washington technology industry association information & communication technology ...€¦ ·...
TRANSCRIPT

Washington Technology Industry Association
Information & Communication Technology Economic and Fiscal Impact Study
February 2015
Submitted to:
Submitted by:

Community Attributes tells data-rich stories about communities
that are important to decision makers.
Principal: Chris Mefford
Analysts: Spencer Cohen
Erin Gengo
Diana Haring
Michaela Jellicoe
Alison Peters
Alexandra Streamer
Eric Viola
Community Attributes Inc.
1411 Fourth Ave, Suite 1401
Seattle, Washington 98101
www.communityattributes.com

Washington State Information & February 2015 iii
Communication Technology Cluster Study
EXECUTIVE SUMMARY
Purpose
After surveying the history of reports, analyses, and data points describing the
Information and Communication Technology (ICT) Industry, the Washington
Technology Industry Association (WTIA) determined a need to research and
publish a current economic and fiscal impact study of the sector. The WTIA
commissioned this study to help inform a productive collaboration among
industry, education, and government leadership in matters of public policy,
investments in public projects, and public-private partnerships.
The ICT Cluster: An Industry, Plus Cross-Industry Talent
Washington’s Information & Communication Technology (ICT) industry has two
defining dimensions: (1) Companies that design and deliver innovative products
and services, create economic value, and bring prestige to Washington State; and
(2) individual professionals with essential skills (“Talent”) that make all that
innovation, value creation, and prestige possible in ICT companies and other
sectors of the economy.
Microsoft, for example, is an ICT sector Company that hires Talent to create
exciting new systems and applications. Starbucks is a coffee retailer—not an ICT
sector company—that nevertheless employs workers from the same ICT Talent
pool to create exciting new systems and applications. In fact, Starbucks employs
more ICT Talent than most ICT Companies. The competition for Talent
therefore is not only global. ICT Talent is in demand in almost every sector of
the State’s economy.
For the foreseeable future, the ICT sector will create jobs at a faster rate than the
State’s public and private education institutions can produce workers qualified to
perform those jobs. As a result, Washington State ranks as the highest importer
of ICT talent in the nation1. The State’s continued economic success is tied to
developing and attracting the talent needed to serve the opportunities created by
the ICT sector. State investments in ICT training and company support are
needed to keep pace with the opportunities.
1 A per capita observation, given the size of California and other states that rank high in absolute
terms.

Washington State Information & February 2015 iv
Communication Technology Cluster Study
ICT Metrics and Impacts
Companies
In 2013, Washington State had an estimated 8,610 ICT employment
establishments2 that provide a wide variety of products and services including
Application Software, Voice and Data Systems, Cloud Computing Services,
Custom Software Development, Electronic Retail, Internet Publishing, and
Manufacturing. More than 90% of all ICT companies employ fewer than 20
workers, which means that most ICT company leaders share the challenges and
goals of typical small businesses across Washington State.
The total revenue reported in Washington by ICT companies is $36.9 billion. Of
this total, Washington ICT companies exported $16.4 billion making it the third
highest exporting state (after California and Texas) and growing exports at more
than 10%—much faster than its larger rivals. No other state matches
Washington’s combination of ICT export growth and absolute ICT export value.
The market value of the ICT sector, including only the top ten public ICT
companies started in Washington State, is nearly $600 Billion. The total market
value of all ICT companies operating in Washington state is in excess of $1
Trillion. While it is true that most of the sales leading to that market valuation are
generated outside the state, the benefits of that business activity accrues to
Washington through job growth, investment in research, commercial
construction, and investment in new companies in the state.
Employment
Employment estimates for ICT are segmented into two main groups. The first is
ICT Companies which includes 162,900 covered workers and an additional
13,700 sole proprietors and independent contractors in 2013. This ICT core
represents 176,600 workers, including workers from across all occupations
employed at ICT companies.
The second group is Tech Units—blocks of ICT talent and supporting team
members that work in non-ICT companies. Tech Units represent an additional
62,300 workers who possess similar skills and face similar project challenges with
their ICT Company peers.
Combining these two groups results in total statewide ICT Talent
employment of 238,900 workers in 2013.
2 Establishments is the employment data term for places of employment and can count one
company more than once if the company has more than one office.

Washington State Information & February 2015 v
Communication Technology Cluster Study
Occupations and density
Within the total employment set of 238,900 ICT workers highlighted above, there
are certain occupations, some of which are essential to the ICT cluster. Examples
of occupations considered essential to ICT delivery include Application Software
Developers, Computer Systems Programmers, Computer Engineers, Network
Architects, and Computer Science Researchers.
Washington State has 90,000 resident individuals in these essential ICT
occupations.
Washington State ranks high in the number of resident professionals serving in
these essential ICT occupations. The State indexes at 2.5 times higher than the
national average on a per worker basis. The Seattle MSA is the primary regional
driver, indexing at 4.3 times that of the U.S. average. And for the specific
Application Software Development occupation, considered by industry experts to
be one of the most essential occupations in the ICT sector, Seattle MSA indexes
at 6.9 times the US average. This talent density makes the region especially
attractive to private and corporate investment.
Wages
In addition to job creation, wages in the sector are also a large driver of economic
benefit impact for the Washington economy. In 2013, the ICT sector paid out
$22 billion in wages. Many of the essential ICT occupations pay very well.
Median wages for workers in the essential ICT occupations range from $100,000
to $140,000, with wages in the 90th percentile of those occupations ranging from
$150,000 to $187,000, in 2013.
Each ICT Company also employs a full spectrum of workers, including sales
positions, administrative support, and many other occupations that do not call
for computer science degrees. In most cases, the median wages for these other
occupations in ICT Companies index above companies in other sectors.
Multiplicative Impact on Jobs
The economic value of the ICT sector extends to the entire state through two
stages of economic multipliers. The archetypal anecdote is: “two developers in a
garage code a new app, launch a company, and then hire many other people to
build that company – which hopes to become the next IPO.”
Each of the 90,000 essential ICT occupations identified earlier – Application
Software Developers, Computer Systems Programmers, Computer Engineers,
Network Architects, and Computer Science Researchers – is the keystone to
creating 1.7 additional jobs in each ICT Company or Tech Unit and resulting in
the total of 238,900 jobs in the ICT cluster.

Washington State Information & February 2015 vi
Communication Technology Cluster Study
Each of those 238,900 high paying jobs then spurs further economic benefit
through the spending generated by those workers, which creates 2.7 more jobs in
the wider state economy. Combining the two factors, we have a combined
economic impact of at least 7 additional jobs in Washington State associated
with every essential ICT worker.
By investing into attracting and developing the workers needed for these essential
ICT occupations - Software Developers, Computer Engineers, Network
Architects, Computer Sciences Researchers – the State could build a sustainable,
robust economy for the next several decades.
Tax Revenues
ICT businesses in Washington State paid $776 million directly in State taxes in
2013. The total tax contributions of the ICT sector are significant—when adding
the tech units and secondary impacts from spending and business transactions—
the total is in excess of $2.8 billion.
ICT State Fiscal Revenue Impacts, 2013
Tax Type
Direct
Payments
Tech Units and
Secondary Impacts
Total ICT-
Supported Tax
Payments
State Sales Tax 523.3 1,159.7 1,683.0
Business & Occupation 219.9 652.5 872.5
State Use Tax 33.3 94.5 127.8
Other Taxes (e.g., Utility Tax) 0.0 152.7 152.8
Total 776.5 2,059.5 2,836.0
Washington Start-Ups
Nearly every ICT Company and nearly every tech unit in Washington today did
not exist 20 years ago. The state has been awash in startups. And even the largest,
oldest ICT companies still possess a startup ethos due to fierce global
competition and the requirement to innovate. The entire startup ecosystem—and
all its creativity—is driven principally by a survival instinct.
Washington enjoys a vibrant startup ecosystem that is evolving rapidly with many
support organizations, entrepreneurial assistance, and tech incubators to help
teams form companies and raise private capital to launch their products and
services. Washington’s 2013 financial support for start-ups was particularly
strong—with nearly $70 million in 60 seed investments and nearly $700
million in 140 Venture Capital investments. However, Washington startup
activity is still lagging more established ICT regions including Massachusetts and
California and is also being outpaced by new entrants such as New York.
Additional talent and private investment capital will lead to more rapid
growth of the industry.

Washington State Information & February 2015 vii
Communication Technology Cluster Study
Despite the smaller stature as a startup ecosystem, the Washington ICT sector
has been a consistent pioneer in the most successful new products and
services including Online Retail, Online Gaming, Cloud Computing, Music and
Video Streaming. In recent years, the region’s prowess in Cloud Computing and
high density of ICT talent has attracted significant private investment and has
also resulted in many of the world’s most prominent ICT companies—including
Hewlett Packard, Oracle, Google, Facebook, Alibaba, Apple and most recently
Dropbox—to invest in building tech units in the region.
Workforce Assessment
Washington State forecasts for occupations compared to graduates show a
significant shortage of workers to fill demand from in-state students. The greatest
shortages are Application Software Developers, Programmers, Help Desk
Specialists, Systems Analysts and Systems Administrators. The annual total
shortage of supply versus demand for these essential ICT occupations is in
excess of 3,000 workers.
Occupations in this arena are in general not interchangeable; the surplus in one
occupation cannot typically serve the shortage in another without substantial
retraining. State investments in ICT talent education and training have not
kept pace with ICT Company growth. Therefore, companies must rely on
workers migrating from other U.S. states and other countries to fill the jobs
created.
Companies seeking ICT talent rely on significant recruiting efforts in California,
Massachusetts and other ICT talent rich regions. Although H-1B visas are a
potential source of additional talent from abroad, the current federal cap
allocated in a national lottery severely limits this source of talent. As a result, the
State’s lack of education investment, in particular in Computer Science, is
retarding the growth of the ICT sector.
Further analysis shows that some occupations with talent shortage could be filled
with retraining of unemployed professionals. For example, 396 unfilled jobs in
the Computer User Support Specialist (aka Help Desk) occupation might be filled
by retraining some of the 595 unemployed workers with prior experience in that
field but whose technical skills are not current. A combination of public and
private investment into specific adult re-training may alleviate some of the
talent shortage in some of the less essential ICT occupations.
Washington’s Universities and ICT Training
The University of Washington’s challenging curricula and internship programs
with industry produce some of the best talent for top ICT companies in
Washington. The University reports that it graduates just over 300 students each
year with degrees in Computer Software Engineering and Programming, making
it the largest program of its kind in the state. The University is a close

Washington State Information & February 2015 viii
Communication Technology Cluster Study
recruiting partner for Washington ICT companies, with approximately 90%
of graduates placed in the State.
Meanwhile, accredited higher education institutions in Washington produced a
total of 4,864 students in 2-year and longer term programs intended to prepare a
student for entry into the ICT sector. However, tech leaders agree that most of these
programs are not suitable for the 3,000 unfilled essential ICT job openings.
Of the 4,864 graduates in 2013, 2,384 graduated with 2-year degrees and are not
qualified for those jobs, according to tech leaders contributing to this study. The
2-year graduates result in a surplus of workers for ICT jobs requiring only a 2-
year degree. Of the remaining 2,480 students graduating in 2013 with 4-year
degrees or higher, the majority of programs – while leading to other employment
opportunities – do not develop the skills or experience required for the leading
firms to hire them into essential ICT jobs. As noted earlier, the result is a
shortfall of 3,000 candidates that must be filled from out of state applicants.
A few education and industry leaders have begun an effort to better integrate
skills requirements and curricula to improve placement of more Washington
program graduates in the future. Some early successes are promising, but
education and tech leaders interviewed for this study speak to the clear need for
a systematic collaboration among industry and education leaders.
Conclusion
Washington’s ICT cluster drives the Washington State economy through its
world-renowned companies and by leading innovation across all sectors of the
economy. Employment and occupation forecasts show continued strong growth,
yet Washington’s education systems do not have the capacity to fill the openings.
Global talent will always seek ICT employment in Washington, but the shortage
of locally trained talent increases the need for Washington companies to recruit
from out of state. This retards growth by increasing recruitment costs and
heightening the requirement for local companies to recruit and relocate workers
from around the world. This talent shortage also forces growing local companies
to invest in other more ICT talent rich regions.
While the industry has and will continue to invest in its own growth, the State
would benefit immensely by serving as an investment partner with the industry to
fully capture the potential for the region.
ICT talent creates jobs—both in the sector and more broadly in the economy.
Each ICT job drives seven additional jobs in the State. A high density of ICT
talent also attracts private investment capital, which leads to more companies
formed, even more jobs created, and a dramatic economic benefit for the entire
State of Washington for many decades to come.

Washington State Information & February 2015 ix
Communication Technology Cluster Study
CONTENTS
Executive Summary ............................................................................................................................. iii
1. Introduction ...................................................................................................................................... 1
Background and Purpose ................................................................................................................. 1
Methods ............................................................................................................................................. 1
Organization of Report .................................................................................................................... 1
2. Cluster Overview .............................................................................................................................. 3
Core ICT Industries ......................................................................................................................... 5
ICT Core & Essential Occupations ................................................................................................ 6
3. ICT Cluster Data Profile .................................................................................................................. 8
Business Revenues ............................................................................................................................ 8
International Exports ....................................................................................................................... 9
Employment Establishments ......................................................................................................... 11
Employment ................................................................................................................................... 12
Core ICT Industries ................................................................................................................... 13
ICT and Tech Units in Other Sectors ...................................................................................... 16
ICT Jobs Across Washington .................................................................................................... 18
Employment Forecasts .............................................................................................................. 20
Occupations .................................................................................................................................... 21
Field Perspectives: Occupational Versatility ............................................................................ 22
Washington State Concentration of ICT Occupations ........................................................... 23
Wages by Industry and Occupation .............................................................................................. 25
Industry Wages Paid ................................................................................................................... 25
Wages by Occupation ................................................................................................................ 27
4. Indirect and Induced Economic Impacts ..................................................................................... 29
ICT Economic Multiplier Effects ................................................................................................. 29
Economic Output Impacts ........................................................................................................ 30
Employment Impacts ................................................................................................................. 31
Tax Revenues .................................................................................................................................. 31
Philanthropic Activities .................................................................................................................. 34
5. Innovation and Entrepreneurialism .............................................................................................. 35
Multi-Generational Start-ups ......................................................................................................... 36

Washington State Information & February 2015 x
Communication Technology Cluster Study
Incubators & Accelerators ............................................................................................................. 36
UW Buerke Center Annual Business Plan Competition ............................................................. 36
Corporate investment ..................................................................................................................... 37
Investments in Washington’s ICT Companies ......................................................................... 37
University Start-Ups ................................................................................................................... 44
Start-Up Profiles ......................................................................................................................... 46
ICT Initial Public Offerings ...................................................................................................... 48
6. Workforce Supply Assessment ...................................................................................................... 49
ICT Occupation Education Requirements ................................................................................... 49
Washington-Based Education and Training ................................................................................. 50
Educational Needs for Essential ICT Occupations ..................................................................... 54
ICT University and College Programs in Washington................................................................. 55
University of Washington .......................................................................................................... 55
Other Washington Universities ................................................................................................. 55
Unemployed Workforce ................................................................................................................. 57
ICT In-Migration and H-1B Visas ................................................................................................ 58
Occupational Forecasts Workforce Supply Assessment ............................................................. 61
7. Industry Perspectives ..................................................................................................................... 63
Regional Assets and Challenges..................................................................................................... 63
Competitive Environment ............................................................................................................. 68
Business Climate Challenges .......................................................................................................... 69
Workforce Insights from Employers ............................................................................................ 70
8. Conclusions ..................................................................................................................................... 73
Appendix A. Workforce Assessment Methods ................................................................................ 74
Appendix B. Economic Impact Analysis .......................................................................................... 75
Appendix C. List of Employers and Institutions Interviewed ........................................................ 78

Washington State Information & February 2015 1
Communication Technology Cluster Study
1. INTRODUCTION
Background and Purpose
Companies that lead Washington’s Information & Communication
Technology (ICT) industry bring talent, tax revenues, charitable contributions
and much more to Washington State, and the ICT talent cluster spans all
sectors of Washington’s economy. The industry drives innovation across the
economy and ICT entrepreneurs create start-ups that grow into employers
and bring capital into the region. Our education and workforce development
institutions must work to align their training with industry needs to continue
to support the state’s economic future.
This study provides a quantitative and qualitative assessment of the
Information & Communication Technology Cluster in Washington State. The
study illuminates the Cluster’s strengths and growth potential, and supports
targeted economic development policies and initiatives. The report serves a
broad range of audiences, including industry associations; leadership in policy,
workforce, and education; and all readers interested in the state of ICT in
Washington.
Methods
Analysis in the report leverages custom data analysis, interpretation of
secondary data sources, and perspectives and insights from local industry
leaders gathered through individual interviews. Data reported and the sources
of information are as follows:
Data on firms, jobs, occupations and wages from the Bureau of Labor
Statistics and Washington State Employment Security Division
Business revenues and taxable retail sales from the Washington State
Department of Revenue
National Center for Education Statistics and Integrated Postsecondary
Education Data System (IPEDS)
Input-output model transactions data published by the Washington
State Office of Financial Management
Organization of Report
Cluster Overview. Definitions and descriptions of what defines the
ICT Cluster.
Cluster Profile. Data summaries and metrics that demonstrate the
size and direct impacts of the cluster in Washington.
Indirect and Induced Impacts. Estimates of the full impact of the
cluster, including indirect and induced impacts, measured by total jobs,
Washington State Information & February 2015 2
Communication Technology Cluster Study
labor income, business revenues, and tax payments to the state
associated with ICT activities.
Innovation and Entrepreneurism. Analysis of the start-up economy
and case studies on innovation driving the cluster.
Workforce Assessment. A detailed discussion of the supply and
demand of ICT skilled workers.
Industry Perspectives. Results from interviews with more than 30
representatives from industry, higher education, and other
stakeholders across the state on industry issues such as talent,
competitiveness, and Washington’s strength as a hub for future ICT
growth.
Conclusions. An interpretation of the overall significance of the
cluster and implications for the future of the industry.

Washington State Information & February 2015 3
Communication Technology Cluster Study
2. CLUSTER OVERVIEW The Information & Communication Technology (ICT) cluster is diverse,
extending across manufacturing, software publishing, and other services. The
cluster consists of two overlapping constituencies: companies engaged in
producing and selling technology products and services, and ICT talent that
work in other industries and produce technology products and services from
within their organizations and companies. However, for practical
measurement, ICT in this study refers only to the production of these goods
and services while excluding many different types of content production that
leverage software and related tools. This section provides a description of the
ICT Cluster and its core industries that define this study.
Exhibit 1 provides a schematic map of the cluster that shows the different
types of companies and occupations that drive ICT in Washington.
Contractors are more prevalent in this field than many fields, and temporary
employment agencies serve major ICT employers with a broad range of
technical expertise that companies rely on for temporary, project-related
support.
Education and workforce institutions training students for careers in ICT
occupations. Investors support ICT companies through several types of
funding and capital investment.
ICT occupations serve and are found in other industries, whose pursuit of
their objectives increasingly rely on custom ICT applications and ICT talent
internally to their operations.
The ICT Cluster Map provides a schematic of the breadth and reach of the
industry, which the following sections address in further detail and provide
data to establish a common understanding of the cluster’s impacts in
Washington State. The next section outlines the number of companies and
organizations engaged directly with ICT, followed by estimates of the number
of employees that serve ICT companies. These sections address the impact of
ICT talent in other industries and the teams, or tech units. Details on ICT
occupations that span the economy follow, along with a profile on wages
across ICT occupations.

Washington State Information & February 2015 4
Communication Technology Cluster Study
Exhibit 1.
Washington State Information & February 2015 5
Communication Technology Cluster Study
Core ICT Industries
This study refers to the economic activities that focus on production of ICT
goods and services as core ICT industries. Other industries are analyzed, too,
because of their reliance on ICT professionals, such as Aerospace, Retail and
others. Employment and other economic data come stratified by the North
American Industry Classification System (or NAICS codes), established by the
U.S. Census.3 Exhibit 2.1 lists core ICT activities identified by NAICS for data
analysis. ICT activities are grouped as follows:
ICT Business Services. Business Services in general include a large
range of business to business activities, including many that have nothing
to do with ICT. Only those related to ICT are included in this report,
however, though even so this group is the most diverse among the
segments of ICT discussed in this report. Activities range from repair
services to custom programming and computer design.
Electronic Retail. Electronic Retail is the fastest growing segment of the
cluster in recent years, driven largely by growth in Amazon—the largest
member company in this group.
Internet Services & Publishing. Activities in this group include web
hosting and data processing.
Software. Anchored by Microsoft, Software includes computer game
companies and other well known companies such as Adobe, Tableau and
more.
Telecommunications Services. This group includes installation,
maintenance, and service provision of broadband and mobile utilities and
technologies.
Manufacturing. This segment includes the semiconductor industry,
which in Washington are concentrated in Southwest Washington near the
Portland cluster of ICT. Many smaller electronics and communications
equipment firms throughout Washington belong to this group.
3 Economists have struggled with assigning codes for ICT activities over the years. Until the late
1990s, NAICS predecessors assigned most computer related activity to either hardware
manufacturing or to “Pre-Packaged Software”.

Washington State Information & February 2015 6
Communication Technology Cluster Study
Exhibit 2. Core ICT NAICS and Definitions
Industry Group NAICS Description Industry Group NAICS Description
541511 Custom computer programming services 334210 Telephone apparatus manufacturing
541512 Computer systems design services 334220 Broadcast and wireless communications equip.
541513 Computer facilities management services 334290 Other communications equipment manufacturing
541519 Other computer related services 335921 Fiber optic cable manufacturing
611420 Computer training 334111 Electronic computer manufacturing
811211 Consumer electronics repair and maintenance 334112 Computer storage device manufacturing
811212 Computer and office machine repair 334118 Computer terminal and peripheral equip. mfg.
811213 Communication equipment repair 334119 Other computer peripheral equipment mfg.
561499 All other business support services 334113 Computer terminal manufacturing
454111 Electronic shopping 334310 Audio and video equipment manufacturing
454112 Electronic auctions 334412 Bare printed circuit board manufacturing
454113 Mail-order houses 334414 Electronic capacitor manufacturing
518111 Internet service providers 334416 Capacitor, transformer, and inductor mfg.
518112 Web search portals 334417 Electronic connector manufacturing
518210 Data processing, hosting and related services 334418 Printed circuit assembly manufacturing
519130 Internet publishing and web search portals 334419 Other electronic component manufacturing
Software 511210 Software publishers 334512 Automatic environmental control manufacturing
517110 Wired telecommunications carriers 334513 Industrial process variable instruments
517210 Wireless telecommunications carriers 333316 Photographic and photocopying equipment mfg.
517211 Paging 333315 Photographic and photocopying equipment mfg.
517212 Cellular and other wireless carriers 333295 Semiconductor machinery manufacturing
517310 Telecommunications resellers 334413 Semiconductors and related device mfg.
517410 Satellite telecommunications 325992 Computer printer toner cartridges manufacturing
517510 Cable and other program distribution
517910 Other telecommunications
517911 Telecommunications resellers
517919 All other telecommunications
ICT Business
Services
Manufacturing
Electronic Retail
Internet Services &
Publishing
Telecommunications
Services
ICT Core & Essential Occupations
ICT companies employ people in all types of occupations that serve the entire
economy, including computer programming occupations, but also business
managers and administrative assistants; bookkeepers and human resource
professionals; sales people; and building management and all types of support
and personnel. The talent that is specific to ICT includes professionals that create
and produce ICT products and services, all listed in Exhibit 3, which this study
refers to as core occupations.
Within these core occupations are a few very select few occupations, however,
which this study refers to as essential occupations, meaning that they are
essential to existence of the ICT Cluster in Washington State. Those essential
occupations are:
Software Developers (all types)
Computer Programmers
Engineers (including Computer Hardware Engineers and the ICT
Electrical Engineers)
Computer Network Architects, and
Computer and Information Research Scientists
The essential nature of these occupations is a central point that this study
addresses in subsequent sections.
Washington State Information & February 2015 7
Communication Technology Cluster Study
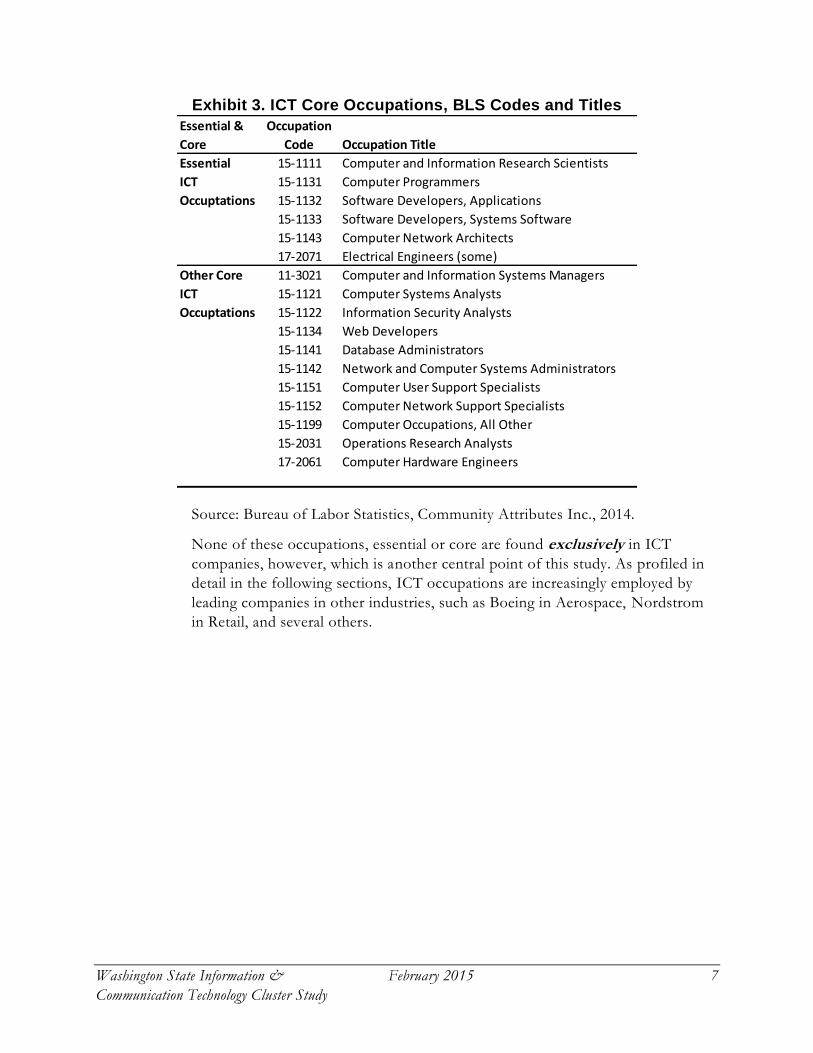
Exhibit 3. ICT Core Occupations, BLS Codes and Titles
Essential &
Core
Occupation
Code Occupation Title
Essential 15-1111 Computer and Information Research Scientists
ICT 15-1131 Computer Programmers
Occuptations 15-1132 Software Developers, Applications
15-1133 Software Developers, Systems Software
15-1143 Computer Network Architects
17-2071 Electrical Engineers (some)
Other Core 11-3021 Computer and Information Systems Managers
ICT 15-1121 Computer Systems Analysts
Occuptations 15-1122 Information Security Analysts
15-1134 Web Developers
15-1141 Database Administrators
15-1142 Network and Computer Systems Administrators
15-1151 Computer User Support Specialists
15-1152 Computer Network Support Specialists
15-1199 Computer Occupations, All Other
15-2031 Operations Research Analysts
17-2061 Computer Hardware Engineers
Source: Bureau of Labor Statistics, Community Attributes Inc., 2014.
None of these occupations, essential or core are found exclusively in ICT
companies, however, which is another central point of this study. As profiled in
detail in the following sections, ICT occupations are increasingly employed by
leading companies in other industries, such as Boeing in Aerospace, Nordstrom
in Retail, and several others.

Washington State Information & February 2015 8
Communication Technology Cluster Study
3. ICT CLUSTER DATA PROFILE At the outset of 2015, the Washington State economy relies heavily on the
Information and Communication Technology industries and talent in Washington,
and the ICT cluster drives and defines Washington and its future role in the
global economy. The cluster is a major employer in the state and pays high wages,
helping to drive economic activity and growth across the state. This section
provides data that describe the establishments and workers in the ICT cluster in
Washington.
Business Revenues
ICT Companies in Washington State generate a tremendous amount of revenue
worldwide. The global revenue generates a lot of wealth, incomes, and business
to business in Washington State. The leading companies in ICT are global in
nature, and their offices and employment in other parts of the world contribute
to their global competitiveness and their global revenues.
Microsoft reported $78 billion in revenue in 2013, for worldwide operations.
Amazon reported $74 billion in 2013, and revenues may pass $90 billion in 2014
(quarterly reports show sales re up more than 20% in 2013 through Q3). T-
Mobile reported $24 billion in 2013. This global economic prominence creates
real value for Washington, in the form of wealth creation, jobs and business
spending. The global relevance also provides less tangible benefits, such as brand
awareness for Washington State and business climate image.
In Washington State, ICT companies reported Gross Business Income (GBI) to
Washington totaling $36.9 billion in 2013, as shown in Exhibit 4, representing
5.4% of total GBI reported in Washington in 2013.
GBI is not a perfect measure of economic activity, and the data in Exhibit 4 do
not include estimated activity among tech units in other industries. GBI for all
industries is self-reported and companies’ reporting practices and decisions vary
tremendously. Companies with operations in other states and other countries
must comply with state laws in reporting income data but multiple places of
business allow for cost-accounting choices that vary among companies in their
representation of value-added or location activity, measured by revenue.

Washington State Information & February 2015 9
Communication Technology Cluster Study
Exhibit 4. Gross Business Income for Core ICT Industries,
Washington State, 2013
Category
Gross Business
Income (mils $)
Computer Systems Design & Related Services 12,811.3
Telecommunications Services 9,856.3
Electronic Retail 4,313.5
Software 2,428.5
Semiconductors 1,874.6
Internet Services 1,683.5
Computer & Peripheral Equipment 857.6
Electronic Components 716.3
Internet Publishing and Broadcasting and Web Search Portals 691.9
Measuring & Control Instruments 587.8
Repair Services 408.2
Communications Equipment 394.4
Consumer Electronics 221.5
Computer Training 32.4
Photonics 23.7
Total 36,901.5
Source: Washington Department of Revenue (2014).
International Exports
Washington State's Information & Communication Technology sector
contributes significantly to the state's international reach, exporting high-value
goods and services. Taken together, Washington State’s ICT sector exported
$16.4 Billion in ICT goods and services in 2012. Washington State ranked third in
ICT export value in 2012 (Exhibit 55). Nearly a third of Washington’s export
value comes from Congressional districts 9 and 7, which comprise the Puget
Sound region (Exhibit 6).
Exhibit 5. Top Five ICT Exporters in 2012, Billions of Dollars
State Exports
California 62.0
Texas 47.9
Washington 16.4
Florida 16.4
Massachusetts 12.9
Sources: Technology CEO Council, 2014; The Trade Partnership, 2013.

Washington State Information & February 2015 10
Communication Technology Cluster Study
Exhibit 6. Top Three ICT-Exporting Washington Congressional Districts
in 2012, Billions of Dollars
District Areas of Interest Exports
WA-9 Tacoma, Bellevue 4.8
WA-7 Seattle, part of Tacoma 4.0
WA-8 Rural King and Pierce counties 1.7
Sources: Technology CEO Council, 2014; The Trade Partnership, 2013.
Not only does Washington have the distinct honor of being a top exporter in
ICT goods and services, but it can boast a spot in the top fastest-growing ICT-
exporting states. Exhibit 7 compares the top ten ICT-exporting states by total
export value. Washington leads export growth states in total export value.
Exhibit 7. Top ICT Exporters by Export Value, Millions of Dollars, 2006-2012
State 2006 2012 CAGR
Washington 9,281 16,433 10.0%
Pennsylvania 3,206 5,116 8.1%
Utah 1,121 3,007 17.9%
Maryland 1,737 2,867 8.7%
South Carolina 1,250 1,818 6.4%
Nevada 699 1,462 13.1%
New Hampshire 563 1,131 12.3%
Mississippi 529 1,039 11.9%
Oklahoma 408 943 15.0%
District of Columbia 520 915 9.9%
Sources: Technology CEO Council, 2014; The Trade Partnership, 2013.
Washington State’s unique combination of top-ranking export volume and export
growth rate tells a compelling story about the state’s ICT cluster: while California
and Texas—the top two ICT exporters at $62B and $47.9B, respectively—far
outstrip Washington in terms of ICT export value, they have very low export
growth rates; Washington may be a distant third, but it is rapidly gaining ground.
In addition to the ICT cluster's export value and impressive export value growth
rate, many companies contribute to the cluster's international reach with
locations abroad. Aside from customer service centers and sale centers, some of
the larger ICT companies have office locations abroad. Exhibit 8 shows a list of
Washington's major ICT companies and their international office locations.

Washington State Information & February 2015 11
Communication Technology Cluster Study
Exhibit 8. Sample of Washington-Based ICT Company International Offices
Company International Office Locations
Avalara England, India
DocuSign Australia, England, France
Big Fish Games Canada, Ireland, Luxembourg
Express Metrix Australia, United Kingdom
Halcyon Monitoring Solutions, Inc. Canada
Impinj China
Microsoft China, France, Germany, Singapore, Turkey
Raima England
Valve Luxembourg
Sources: Community Attributes, 2014.
No other state matches Washington’s combination of ICT export value growth
and absolute ICT export value. Taking into account the large number of
international ICT companies that are based in Washington, the state’s ICT sector
has significant international reach.
Employment Establishments
In 2013, there were an estimated 8,610 ICT establishments with employees in
Washington State (Exhibit 9).4 The majority, 5,400, are in ICT Related Business
Services, a subsector group that includes Computer Repair, Computer Systems
Design & Related Services, and Other Business Support Activities (e.g., cloud
computing services).
4 Establishments is the employment data term for places of employment and can count one
company more than once if the company has more than one office.

Washington State Information & February 2015 12
Communication Technology Cluster Study
Exhibit 9. ICT Employment Establishments, Washington State, 2002-2013
Sources: U.S. Bureau of Labor Statistics, 2014; Community Attributes Inc., 2014.
The data in Exhibit 9 include only companies that have employees. Business
owners and proprietors that entirely operate their companies are included in
economic data as non-employer data. These individuals are co-mingled in the
data with free-lance workers, which ICT are known to be substantial in number.
This study includes non-employer data in the following section on employment.
Additional information on start-ups follows in subsequent sections as well.
Employment
Employment estimates for ICT are segmented into the Core ICT Industries as
defined above, including employees of establishments as well as the self -
employed. ICT workers make up tech units in firms in other industries, such as
Aerospace, Retail and others, as well. Finally, sole proprietors and independent
contracts work throughout the industry.
Combining all three sources of ICT employment—core ICT activities, tech units,
and the self-employed—results in total employment of 238,900 workers in 2013
(Exhibit 10). Between 2009 and 2013, total ICT employment has increased by
56,100 workers, with a compound annual growth rate of 2.7%. Detailed data on
the three employment segments follow.
Washington State Information & February 2015 13
Communication Technology Cluster Study
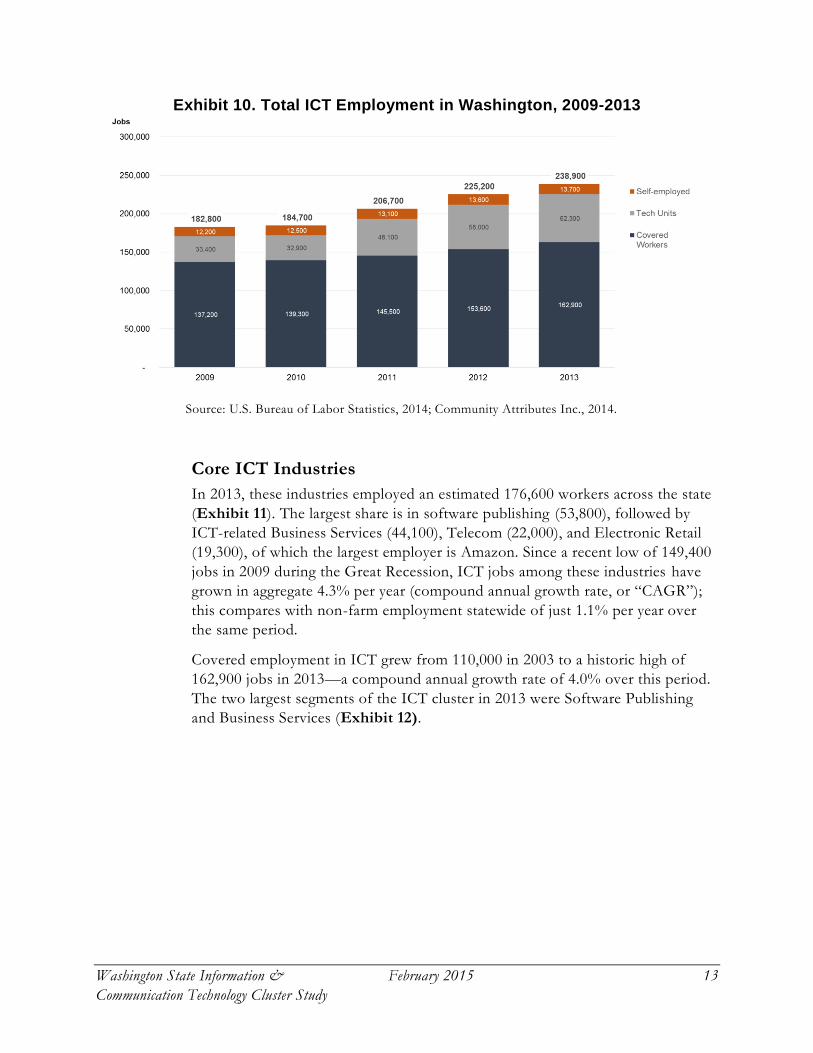
Exhibit 10. Total ICT Employment in Washington, 2009-2013
Source: U.S. Bureau of Labor Statistics, 2014; Community Attributes Inc., 2014.
Core ICT Industries
In 2013, these industries employed an estimated 176,600 workers across the state
(Exhibit 11). The largest share is in software publishing (53,800), followed by
ICT-related Business Services (44,100), Telecom (22,000), and Electronic Retail
(19,300), of which the largest employer is Amazon. Since a recent low of 149,400
jobs in 2009 during the Great Recession, ICT jobs among these industries have
grown in aggregate 4.3% per year (compound annual growth rate, or “CAGR”);
this compares with non-farm employment statewide of just 1.1% per year over
the same period.
Covered employment in ICT grew from 110,000 in 2003 to a historic high of
162,900 jobs in 2013—a compound annual growth rate of 4.0% over this period.
The two largest segments of the ICT cluster in 2013 were Software Publishing
and Business Services (Exhibit 12).

Washington State Information & February 2015 14
Communication Technology Cluster Study
Exhibit 11. Core ICT Employment in Washington, 2004-2013
Source: U.S. Bureau of Labor Statistics, 2014; U.S. Census Bureau, 2014; Community Attributes
Inc., 2014.
Exhibit 12. Employment by Core ICT Group in Washington, 2000-2013
Source: U.S. Bureau of Labor Statistics, 2014; Community Attributes Inc., 2014.
Among ICT industry segments, the fastest growth in employment over the past
10 years occurred in Internet Services & Publishing (13.6% per year; 9,300 jobs
added), followed by Electronic Retail (predominately due to growth within
Amazon), growing at a compound annual rate of 12.6% and adding 13,400 jobs.
Software Publishing—of which Microsoft is the largest firm, but also includes
Avalara, Valve, and Inrix —grew at 3.8% per year. Within Business Services, the
two largest components were Computer Systems Design Services (21,000

Washington State Information & February 2015 15
Communication Technology Cluster Study
employees) and Custom Computer Programming Services (14,700 employees;
Exhibit 13).
Among the large core ICT groups, the fastest growth in covered employment
between 2003 and 2013 occurred within Internet Services & Publishing (which
includes firms that provide data processing services), with a 15.6% CAGR over
the same period. Electronic Retail, of which the largest employer is Amazon
(even when not including Amazon Web Services), grew at 14.1% per year,
reaching 19,300 in 2013.
Industries that experienced declines from 2003 to 2013 included Telecom (-2.0%
per year) and Manufacturing (-1.6% per year). Together, these two industry
groups shed 6,200 jobs, though this was more than offset by gains in software
(14,700 new jobs), Business Services (21,000), Electronic Retail (13,400), and
Internet Services & Publishing (9,400).
Exhibit 13. Growth Rates for ICT Employment by Major Categories, 2004-2013
2004 2013
1 Software 39,100 53,800 3.6%
2 Business Services 23,100 44,100 7.4%
3 Telecommunications Services 26,500 22,000 -2.0%
4 Electronic Retail 5,900 19,300 14.1%
5 Internet Services & Publishing 3,500 12,900 15.6%
6 Manufacturing 12,600 10,900 -1.6%
Total, All Activities 110,700 162,900 4.4%
EmploymentRank Activity
CAGR,
2004-2013
Source: U.S. Bureau of Labor Statistics, 2014; Community Attributes Inc., 2014.
Note: CAGR is Compound Annual Growth Rate
To provide context, Exhibit 14 below compares ICT statewide employment
growth with other major sectors of the Washington economy, indexed to year
2003. Among sectors presented, Aerospace and ICT were the fastest growing
sectors from 2003 to 2013.

Washington State Information & February 2015 16
Communication Technology Cluster Study
Exhibit 14. ICT Employment Growth Statewide Compared with Other Major
Sectors, Indexed (2003 = 100)
Source: U.S. Bureau of Labor Statistics, 2014; Community Attributes Inc., 2014.
ICT and Tech Units in Other Sectors
Information & Communication Technology extends across nearly all major
sectors of the state economy. There are many ICT activities housed within
industries conventionally classified as something other than ICT. These activities
include mobile applications development, data analytics teams, and computer
hardware design and integration—essentially ICT teams within larger, non-ICT
companies.
Employers across do not report how many employees work in these tech units
across the economy, and it would be difficult to ask that of an employers.
Sufficient data and regional economic models do exist, however, to allow for
estimates of the workers in tech units economy-wide.
A tech unit, for the purposes of this analysis, includes a team of workers devoted
to software and application development. This does not include basic layout of a
company’s web pages, but rather production and development of ICT products
and services to advance a company’s business. This definition relies on the
existence of software developers and computer programmers as the critical
occupation for a tech unit to exist. A business will hire a software engineer once
it intends to use that position to develop new software and related products and
services, either for direct internal use or integration with goods and services
provided by the business (e.g., programmers developing new online commerce
platforms for a retail business). Exhibit 15 lists the ICT occupations identified as
central to tech units across non-ICT industries, or tech unit Anchor Occupations.

Washington State Information & February 2015 17
Communication Technology Cluster Study
Exhibit 15. Tech Unit Anchor Occupations
Occupation
Software Developers, Applications
Software Developers, Systems Software
Computer Programmers
(ICT) Electrical Engineers
Computer Network Architects
Computer Hardware Engineers
Computer and Information Research Scientists
Source: U.S. Bureau of Labor Statistics, 2014; Washington State Employment Security
Department, 2013; Community Attributes Inc., 2014.
Good data exist to track these occupations across all sectors in the economy. The
estimates of the additional employees it takes to round out a tech unit follow the
ratios of these anchor occupations to all other employees throughout the ICT
industries.
This approach results in total tech unit employment of 62,300 workers in 2013
(Exhibit 16). The rapid growth of tech units reflects changing dynamics of the
state economy and labor force since 2000. During the dot.com bubble of the late
1990s and early 2000s, the majority of ICT activities occurred within software
publishers and related businesses. However, with the rise of mobile apps and e-
commerce, many traditionally non-ICT businesses have needed to expand their
workforce requirements to developers and other high-skill ICT occupations.
Exhibit 16. ICT Tech Units Estimated Employment
in Washington State, 2009-2013
Sources: U.S. Bureau of Labor Statistics, 2014; Washington State Employment Security
Department, 2013; Community Attributes Inc., 2014.
Aerospace was the largest source for tech unit employment outside of ICT
industries in 2013 (Exhibit 16). This owes to the large number of software

Washington State Information & February 2015 18
Communication Technology Cluster Study
programmers and systems engineers involved in avionics, on-board electrical and
computer systems, and the integration of these components and systems. As
aircraft have becoming increasingly reliant on computer systems and software, so
has the share of the aerospace workforce involved in these activities.
The second largest source of ICT employment outside of ICT industries in 2013
was in Administrative and Support Services, which includes employment staffing
agencies that provide contract programming and engineering work to Microsoft
and other ICT firms. Professional services employed an estimated 8,200 workers
in ICT and support activities in 2013. The professional services industry include
life sciences research, engineering services, and other industries with higher
intensities of R&D.
Examples of innovation at tech units in non-ICT sectors is the focus of section 5
of this report.
Exhibit 17. Top Industries for Tech Units Employment,
2013 (est.)
Rank Industry
ICT Core
Occupations
Supporting
Employment
Total Tech Unit
Employment
1 Aerospace 8,000 8,700 16,700
2 Administrative and support services 4,000 4,400 8,400
3 Professional and technical services 3,900 4,300 8,200
4 Financial services 3,000 3,300 6,300
5 Management of companies and enterprises 2,600 2,800 5,400
6 Merchant wholesalers, durable goods 1,600 1,700 3,300
7 Education (Local, State, and Private) 1,100 1,100 2,200
8 Hospitals and Ambulatory health care services 1,400 1,600 3,000
Total, all non-ICT sectors 29,800 32,500 62,300
Source: U.S. Bureau of Labor Statistics, 2014; Washington State Employment Security
Department, 2013; Community Attributes Inc., 2014.
ICT Jobs Across Washington
Exhibit 18 shows the concentration of ICT jobs by county across Washington
(does not include tech units and self-employed). King County has long been the
state’s largest employment center by county, including for ICT employment. In
2013 King County had an estimated 129,700 workers in ICT businesses, which is

Washington State Information & December 2014 Page 19
Communication Technology Cluster Study
Exhibit 18. ICT Jobs in Washington by County, 2013
Sources: Washington State Employment Security Department, 2014; Community Attributes Inc., 2011.

Washington State Information & February 2015 20
Communication Technology Cluster Study
80% of ICT jobs statewide (does not include tech units and self-employed).
However, in recent years a growing number of ICT activities have been
flourishing in other regions across the state. In 2013, an estimated 9,400 workers
were employed in ICT businesses in Snohomish County, followed by 6,500
workers in Clark County (traditionally an important hub for semiconductor
activities), Pierce County (4,900 workers), and Spokane (4,300 workers).
Employment Forecasts
The future growth of ICT depends on a variety of factors, domestic and global.
Economists’ forecasts suggest the ICT sector will grow from 176,600 jobs in
2013 (and 184,900 in 2014) to more than 200,000 jobs by 2019 and more 224,100
by 2024. ICT employment growth is expected to hold at 2.1% annual growth
between now and 2019, with growth in software publishing at 1.7% (Exhibit 19).
Statewide employment, according to OFM estimates, is forecasted to grow at an
annual rate of 1.3% over the same period.
Exhibit 19. Forecast Jobs in ICT Core Industries,
Washington State, 2019 and 2024
Sources: Washington State Office of Financial Management, 2013; Conway Pedersen Economics,
2014; U.S. Bureau of Labor Statistics, 2014; Community Attributes Inc., 2014. Forecast
employment based on a blending of the OFM and Conway Pedersen forecasts.

Washington State Information & February 2015 21
Communication Technology Cluster Study
Occupations
Industry employment described in earlier sections captured the number of people
that work in companies devoted to ICT or working in ICT tech units within
other industries. This section presents data and information on ICT occupations,
or those job titles most associated with ICT activities. In all cases, people that
have one of these occupations include people working at companies in ICT and
also people that work in ICT occupations for firms not considered to be ICT
firms (Boeing and Starbucks, for example).
Software Developers, including Applications and Systems Software Developers,
together with Computer Programmers make up more than half of the share of
Washington State’s ICT occupations, as shown in Exhibit 20. Together these top
occupations combine for 78,700 people in Washington that fill these occupations
(in 2013). Three quarters of these two occupations are in ICT companies, and
one quarter of them work in industries other than ICT. Exhibit 20 presents all
17 occupations considered ICT occupations for this study. Their concentration
among ICT companies ranges from 18% to 80%.
Exhibit 20. ICT-Related Occupations, Washington State, 2013
Essential &
Core
Occupation
Code Occupation Title
All
Industries
ICT
Industries
% in ICT
Industries
Essential 15-1132 Software Developers, Applications 53,975 42,959 80%
ICT 15-1131 Computer Programmers 16,014 11,496 72%
Occuptations 15-1133 Software Developers, Systems Software 8,664 4,096 47%
17-2071 Electrical Engineers (some) 5,891 971 16%
15-1143 Computer Network Architects 4,314 991 23%
15-1111 Computer and Information Research Scientists 1,080 634 59%
Total Essential ICT Occupations 89,938 61,147 68%
Other Core 15-1121 Computer Systems Analysts 15,017 5,293 35%
ICT 15-1151 Computer User Support Specialists 13,325 5,320 40%
Occuptations 11-3021 Computer and Information Systems Managers 9,344 4,061 43%
15-1142 Network and Computer Systems Administrators 8,881 2,373 27%
15-1134 Web Developers 5,670 3,048 54%
15-1152 Computer Network Support Specialists 4,588 1,531 33%
15-1199 Computer Occupations, All Other 4,704 1,913 41%
15-1141 Database Administrators 2,847 686 24%
15-1122 Information Security Analysts 2,273 876 39%
15-2031 Operations Research Analysts 2,073 220 11%
17-2061 Computer Hardware Engineers 1,515 1,121 74%
Total Other Core 70,237 26,442 38%
Total ICT Core Occupations 160,175 87,589 55%
Washington Employment
Source: Community Attributes, 2014; Washington State Employment Security Department Industry
Occupational Matrix, 2012.

Washington State Information & February 2015 22
Communication Technology Cluster Study
Exhibit 21 illustrates the next most-prevalent industry concentrations for ICT
core occupations. Boeing and Aerospace employ the most ICT professionals
outside of the ICT industry itself, followed by Management of Companies &
Enterprises (corporate headquarters that have registered as such, as opposed to
their company’s industry) and Employment Services (temporary or contract
employment services). Presumably Employment Services follows similar trends
of sector engagement, meaning, for example, that workers in that sector are
engaged at ICT companies for the most part, followed by Aerospace, and so on.
Exhibit 21. ICT Concentration by Occupation,
Other Industry Concentrations, 2012
Industry Workers
% of ICT
Occupations
Aerospace 13,022 15%
Management of Companies & Enterprises 5,915 7%
Scientific Research & Development Services 4,952 6%
Employment Services 4,135 5%
Insurance Carriers 3,790 4%
Travel Arrangement & Reservation Services 2,422 3%
Management & Technical Consulting Services 2,178 2%
Data Processing and Related Services 2,093 2%
Education 2,091 2%
Commercial Equip. Merchant Wholesalers 2,069 2%
Electronic Instrument Manufacturing 1,619 2%
Source: Community Attributes, 2014; Washington State Employment Security Department
Industry Occupational Matrix, 2012.
Field Perspectives: Occupational Versatility
Industry leaders mentioned during interviews an evolution of traditional ICT
roles. While the basics are still necessary, employers are looking for workers who
have a broader range of skills. One interviewee stated he needs traditional
application developers who can also interface with colleagues on the industry-
specific technical pieces—what he called functional analysts, or business analysts.
To find these types of people, company recruiters are diversifying their search
criteria and reaching out through non-traditional methods, such as social media.
One interviewee mentioned utilizing LinkedIn for highly specialized people, then
convincing them they need a change of pace.

Washington State Information & February 2015 23
Communication Technology Cluster Study
Washington State Concentration of ICT Occupations
Exhibit 22 displays the relative concentration of all ICT occupations for
Washington State as well as Seattle’s Metropolitan Statistical Area (including
Pierce, Snohomish, and King County) in 2013. A Location Quotient measures
this concentration, which is a calculated ratio between a local economy and a
reference economy. The U.S. concentration equals 1.0; any figure above that
demonstrates a specialization of the occupation in the local economy. The
location quotient of 3.8 in Washington (6.9 in Seattle’s MSA) for Applications
Software Developers is interpreted by saying that applications software
developers are 3.8 times more concentrated in Washington than in the U.S. as a
whole, and 6.9 times more concentrated in Seattle’s MSA than nationwide. Other
highly concentrated occupations include Computer Programmers (with a location
quotient of 4.1 in Seattle’s MSA and 2.4 in Washington) and Web Developers
(with a location quotient of 3.4 in Seattle’s MSA and 2.2 in Washington State).
Exhibit 22. Occupational Concentration (Location Quotient),
Washington State and Seattle MSA, 2013
Source: U.S. Bureau of Labor Statistics, 2014; Community Attributes Inc., 2014.

Washington State Information & February 2015 24
Communication Technology Cluster Study
Washington’s Employment Security Department forecasts that between 2016 and
2021, Computer and Mathematical Occupations will see annual growth second
only to that of the Healthcare Support sectors (Exhibit 23), with 1.7% growth
annually. This analysis examines a broad array of ICT occupations, from support
occupations such as support specialists, to engineers and programmers.
Exhibit 23. Industry-wide Occupational Growth Rate and Projected Yearly
Openings (parenthesis) by Occupation Group: Washington State, 2016-2021
Source: Community Attributes Inc., 2014; WA ESD, 2014. Occupations included in ESD’s segment of Computer
and Mathematical Occupations are not the same as, but are similar to the occupations included in this analysis.
Statewide, ESD projects that Washington State companies will need to fill 47,000
of these ICT occupations by 2022. ESD forecasts 6,680 economy-wide (all
industries) ICT job openings each year between 2017 and 2022 in Washington
State (Exhibit 24). These occupations have high-predicted growth compared to
the average growth rate for all occupations (1.3%). Web developers, computer
hardware engineers, and applications software developers have the highest
predicted growth rates between 2017 and 2022, at around 2% annual growth.

Washington State Information & February 2015 25
Communication Technology Cluster Study
Exhibit 24. Annual Projected Yearly Openings by ICT Occupation: Washington
State, 2017-2022
SOC
Code Occupation
Average Annual
Openings 2017-
2022
Average Annual
Growth 2017-
2022
15-1132 Software Developers, Applications 2,171 1.9%
15-1151 Computer User Support Specialists 557 1.8%
15-1131 Computer Programmers 863 1.8%
15-1121 Computer Systems Analysts 614 1.6%
15-1133 Software Developers, Systems Software 305 1.6%
11-3021 Computer and Information Systems Managers 414 1.9%
15-1142 Network and Computer Systems Administrators 330 1.5%
15-1199 Computer Occupations, All Other 193 1.6%
15-1134 Web Developers 358 2.0%
15-1152 Computer Network Support Specialists 176 1.6%
17-2071 Electrical Engineers 203 0.9%
15-1143 Computer Network Architects 127 1.0%
15-1122 Information Security Analysts 79 1.3%
15-2031 Operations Research Analysts 74 0.9%
17-2061 Computer Hardware Engineers 65 1.5%
15-1141 Database Administrators 109 1.1%
15-1111 Computer and Information Research Scientists 42 1.6%
Total 6,680
Source: Community Attributes, 2014; Washington State Employment Security Department, 2012.
Wages by Industry and Occupation
Industry Wages Paid
In 2013, the ICT cluster, including covered and self-employed workers, paid out
an estimated $22.1 billion in wages, net of benefits (Exhibit 25.).5 Among all jobs
in ICT core industries, wages in 2013 summed to $20.7 billion.
The largest share of wages paid within this group came from Software Publishing
($10.1 billion), with an average wage of $188,500 before supplemental benefits.
Business Services wages summed to $4.5 billion, with an average wage of $97,300
(Exhibit 28). However, this macro group has the most diverse set of industry
activities, ranging from computer training, custom computer systems design, to
cloud computing, with concomitant diversity in average wages. For example,
5 In 2013 (latest available annual data), supplements to wage and salary income for NAICS 511
(“Publishing Industries, Except Internet”) which includes software publishing averaged an
additional 19% in income for workers. This is generally consistent across all industries in
Washington. Applying this rate to covered employed results in total wage and salary
disbursements plus benefits of $24.7 billion in 2013. Source: U.S. Bureau of Economic Analysis,
2014.

Washington State Information & February 2015 26
Communication Technology Cluster Study
Custom Computer Programming Services (NAICS 541511) paid an average of
$104,600 per worker in 2013, before benefits, followed by Computer Systems
Design Services ($102,900 per worker). But within this same industry group,
much lower average wages were paid out in 2013 in Consumer Electronics Repair
and Maintenance ($46,100), Computer and Office Machine Repair ($49,600), and
Communication Equipment Repair ($50,300).
Exhibit 25. Total Wages Paid to ICT Workers (2013 $, billions)
Source: U.S. Bureau of Labor Statistics, 2014; Washington State Employment Security
Department, 2013; Community Attributes Inc., 2014.
Exhibit 26. Total Wages and Average Wage in ICT Activities, 2013 (millions $)
Total Wages
(millions $)
Average
Annual Wage
Covered Workers
Software 10,143 188,500
Business Services 4,382 99,400
Telecommunications Services 1,997 90,800
Electronic Retail 1,946 100,800
Internet Services & Publishing 1,332 103,300
Manufacturing 856 78,600
Self-employed 1,289 94,100
Total 21,946 124,300
Source: U.S. Bureau of Labor Statistics, 2014; U.S. Census Bureau, 2014; Washington State
Employment Security Department, 2013; Community Attributes Inc., 2014.

Washington State Information & February 2015 27
Communication Technology Cluster Study
Wages by Occupation
Occupations in ICT pay well compared with the median wage statewide across all
occupations ($41,000), and in comparison to other industries. ICT wages also
remain fairly stable during economically challenging times. As Exhibit 27 shows,
ICT wages increased over the five-year period between 2008 and 2013—that
includes the recent the recession. In adjusted 2013 dollars, the annual median
salary for the segment of computer and science mathematical occupations has
increased from 2008 to 2013 by approximately $9,000, a compound annual
growth rate of 1.96%. This percentage represents the highest growth rate in
terms of real wages during that time, while the wage of the majority of
occupational segments (13 of the 23 segments) declined.
Exhibit 27. Annual Median Salary by Occupational Group, Washington State,
2013 and 2008 Comparison (2013
dollars)
2008 (2013 $)
Median Salary
2013 Median
Salary
CAGR, 2008-
2013
Computer and mathematical science occupations $87,955 $96,920 1.96%
Architecture and engineering occupations $80,046 $83,020 0.73%
Healthcare support occupations $30,263 $31,370 0.72%
Legal occupations $72,147 $74,530 0.65%
All Occupations $40,325 $40,910 0.29%
Office and administrative support occupations $35,359 $35,790 0.24%
Production occupations $35,987 $36,360 0.21%
Healthcare practitioners and technical occupations $71,216 $71,520 0.09%
Business and financial operations occupations $67,527 $67,790 0.08%
Construction and extraction occupations $51,275 $51,290 0.01%
Installation, maintenance, and repair occupations $48,181 $48,060 -0.05%
Transportation and material moving occupations $33,498 $33,330 -0.10%
Education, training, and library occupations $48,213 $46,880 -0.56%
Building and grounds cleaning and maintenance occupations $27,634 $26,750 -0.65%
Life, physical, and social science occupations $65,168 $62,920 -0.70%
Sales and related occupations $30,404 $28,970 -0.96%
Food preparation and serving related occupations $22,765 $21,670 -0.98%
Management occupations $108,881 $103,010 -1.10%
Personal care and service occupations $25,545 $23,600 -1.57%
Farming, fishing, and forestry occupations $26,498 $24,170 -1.82%
Arts, design, entertainment, sports, and media occupations $49,685 $45,130 -1.90%
Community and social services occupations $45,216 $40,740 -2.06%
Protective service occupations $50,875 $44,240 -2.76% Sources: Community Attributes, 2014; Bureau of Labor Statistics Occupational Employment Statistics, 2014
Washington State Information & February 2015 28
Communication Technology Cluster Study
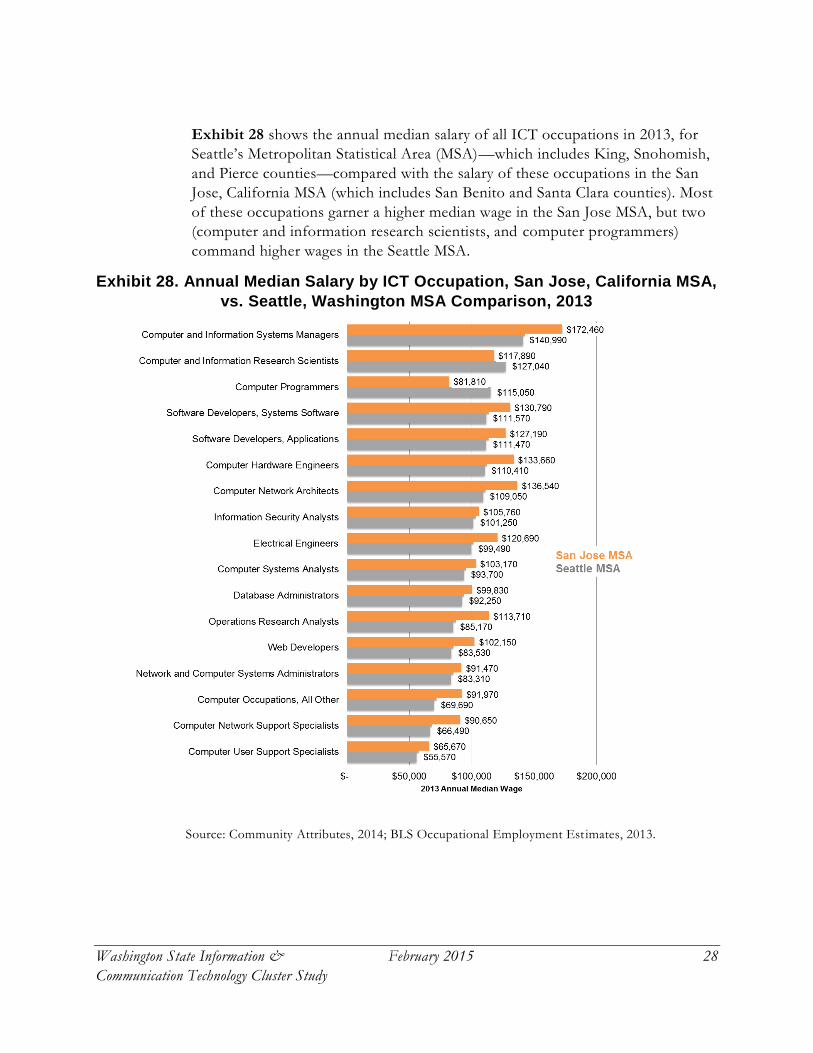
Exhibit 28 shows the annual median salary of all ICT occupations in 2013, for
Seattle’s Metropolitan Statistical Area (MSA)—which includes King, Snohomish,
and Pierce counties—compared with the salary of these occupations in the San
Jose, California MSA (which includes San Benito and Santa Clara counties). Most
of these occupations garner a higher median wage in the San Jose MSA, but two
(computer and information research scientists, and computer programmers)
command higher wages in the Seattle MSA.
Exhibit 28. Annual Median Salary by ICT Occupation, San Jose, California MSA,
vs. Seattle, Washington MSA Comparison, 2013
Source: Community Attributes, 2014; BLS Occupational Employment Est imates, 2013.
Washington State Information & February 2015 29
Communication Technology Cluster Study
The highest paid occupations combine technical and area expertise with
management, such as computer and information systems managers ($140,990
annual median wage in Seattle’s MSA). Computer and information research
scientists and computer programmers are the second- and third-highest salaried
occupations at $127,040 and $115,050 annual median salary, respectively. Even
computer user support specialists, the lowest-paid occupation in the cluster, has a
median annual salary of almost $15,000 additional than the median wage for all
occupation groups.
4. INDIRECT AND INDUCED ECONOMIC IMPACTS ICT businesses and employees have an extensive impact on the statewide
economy. Business buy local goods and services, and the high wages paid to
employee drive consumer spending and local business support, as well as
charitable contributions and significant community support. In addition, the ICT
industry creates tremendous fiscal impacts to state and local governments. This
section discusses estimates of these broader impacts.
ICT Economic Multiplier Effects
Economic impact modeling estimates impacts of the ICT Cluster on statewide
jobs, business to business spending, and labor income. Within each of these
categories, the direct activities of ICT are modeled to estimate additional
activities throughout the economy supported by ICT. The additional impacts
include indirect impacts include business-to-business transactions, and induced
impacts refer to labor income that is spent throughout the economy on goods
and services.
The ICT cluster in Washington State—including both direct activities in ICT
firms and workers in tech units across the economy—in 2013 supported an
estimated total 878,400 jobs statewide. This total includes 120,300 jobs supported
through business-to-business transactions and 519,200 additional jobs supported
through employee spending, as summarized in Exhibit 29.
Total labor income statewide associated with ICT sums to nearly $57.8 billion
annually (inclusive of benefits), while ICT-supported revenues summed to $179.6
billion. Importantly, the largest impacts from ICT cluster activities are induced
through the wages spent by ICT workers throughout the economy.

Washington State Information & February 2015 30
Communication Technology Cluster Study
Exhibit 29. Total Economic Impacts of ICT Activities
in Washington State, 2013
Total
Jobs 878,400
Labor Income (mils $) 57,805
Revenues (mils $) 179,759
Sources: Washington State Office of Financial Management, 2013; Community Attributes Inc.,
2014.
Note: Estimates include both covered employment and the self-employed.
*Labor income totals include estimates of additional benefits per segment of the ICT cluster,
based on national data published by the U.S. Bureau of Labor Statistics’ Employer Cost for
Employee Compensation program.
Overall, for every one direct job in ICT, an additional 2.68 jobs are supported
throughout the economy, resulting in a jobs multiplier of 3.68. Every dollar of
labor income is associated with another $1.30 in labor income across the
economy (multiplier of 2.30). For business revenues, each dollar of ICT sales
apportioned to statewide activity supports another $1.32 in sales across the
economy, a multiplier of 2.32. Each million dollars in final sales supports 7.09
jobs across the state economy (Exhibit 30).
Exhibit 30. Economic Multipliers from ICT Activities, 2013
Total output per $ final demand 2.32
Total jobs per direct job 3.68
Total labor income per $ direct income 2.30
Total jobs per $ mil final demand 11.35
Sources: Washington State Office of Financial Management, 2013; Community Attributes Inc.,
2014.
Economic Output Impacts
The economy-wide impacts of ICT on the economy vary by industry (Exhibit
31), reflecting a combination of each ICT segment’s production function and
employee spending patterns. More than $8.5 billion in "Other Retail" activities—
which includes in-store purchases—nearly all of which reflects employee
consumer spending (96.4%). Among banking institutions, or "Credit
Intermediation and Related Activities," the ICT cluster supported more than $8.4
billion in financial business revenues through business-to-business transactions
and ICT workers spending income on related services.
Employee spending is in fact the primary driver of ICT-supported business
revenues statewide. Of the $102.4 billion in additional business revenues

Washington State Information & February 2015 31
Communication Technology Cluster Study
supported by ICT activities, 79% was through ICT employee spending across the
economy.
Exhibit 31. Largest ICT Output Impacts (Indirect & Induced Combined) by
Industry, 2013, mils $
Rank Industry Indirect Induced
Total Secondary
Impact, mils $
1 Other Retail 303 8,207 8,510
2 Credit Intermediation and Related Activities 1,918 6,527 8,444
3 Other Construction 2,937 4,010 6,948
4 Waste Management/Other, and Agriculture Services 873 6,048 6,921
5 Ambulatory Health Care Services 33 6,000 6,032
All Sectors 21,781 80,613 102,394
Sources: Washington State Office of Financial Management, 2013; Community Attributes Inc.,
2014.
Employment Impacts
Employment impacts from business-to-business and income effects were greatest
among “Other Retail” activities (the addition of 90,400 jobs). There were 70,400
jobs in “Food Services and Drinking Places,” including restaurants and bars,
associated with the ICT cluster. Overall, of the 639,500 additional jobs supported
statewide by the ICT cluster, 81.2% were supported through employee spending
(Exhibit 32).
Exhibit 32. Largest ICT Employment Impacts (Indirect & Induced) by Industry,
2013
Rank Industry Indirect Induced
Total Secondary
Impact
1 Other Retail 3,100 87,300 90,400
2 Food Services and Drinking Places 6,600 63,800 70,400
3 Waste Management/Other, and Agriculture Services 6,400 47,100 53,500
4 Administrative/Employment Support Services 25,500 22,200 47,700
5 Nursing and Residential Care Facilities, Social Assistance 1,700 43,300 45,000
All Sectors 120,300 519,200 639,500
Sources: Washington State Office of Financial Management, 2013; Community Attributes Inc.,
2014.
Tax Revenues
ICT businesses in Washington State paid $776.5 million in state taxes in 2013, up
from $736.6 million in 2012, adjusted for inflation (Exhibit 33). More than two-
thirds of these reported tax payments came in the form of state sales tax
payments, with B&O payments constituting 28.3% of total payments (Exhibit

Washington State Information & February 2015 32
Communication Technology Cluster Study
34). As shown in Exhibit 35, the largest source of payments by industry segment
in 2013 was Telecommunications Services, with $381.2 million in payments, of
which $283.7 million were in the form of collected state sales tax. Business
Services directly paid $169.1 million, with nearly half in the form of B&O
payments ($82.5 million), followed by $129.1 million in payments by Electronic
Retail (of which 88.1% were state sales taxes).
Exhibit 33. Direct State Taxes Paid by Core ICT Activities, 2004-2013 (2013 $)
Sources: Washington State Department of Revenue, 2014; U.S. Bureau of Economic Analysis,
2014; Community Attributes Inc., 2014.
Exhibit 34. Reported Taxes Paid by ICT Cluster Businesses and Secondary Tax
Impacts, 2013, by Tax Type (mils $)
Tax Type
Direct
Payments
Tech Units and
Secondary Impacts
Total ICT-
Supported Tax
Payments
State Sales Tax 523.3 1,159.7 1,683.0
Business & Occupation 219.9 652.5 872.5
State Use Tax 33.3 94.5 127.8
Other Taxes (e.g., Utility Tax) 0.0 152.7 152.8
Total 776.5 2,059.5 2,836.0
Sources: Washington State Department of Revenue, 2014; Community Attributes Inc., 2014.
However, the broader fiscal contributions of ICT businesses are significant. Due
largely to the high wages paid to ICT workers and subcontracting with other
Washington State businesses, tax payments received from business activities

Washington State Information & February 2015 33
Communication Technology Cluster Study
supported by ICT activities are nearly double direct payments by ICT firms
(Exhibit 36).
The largest type of tax receipts supported by ICT activities in 2013 were sales tax
revenues; $1.7 billion was supported by ICT activities economy-wide in 2013, of
which the majority—almost $1.2 billion—was through indirect and induced
effects of business-to-business transactions and income spent by ICT-supported
workers. Business & Occupation tax revenues supported by ICT totaled $872.5
million in 2013, of which $652.5 million were generated by way of multiplier
impacts.
Exhibit 36. Total Fiscal Impacts of Core ICT Activities, 2004-2013, Direct Tax
Payments and Additional Payments from Indirect and Induced Effects
1,809.1 1,764.9 1,869.2 2,034.0 2,059.5
651.3 709.8 711.6
736.6 776.5 2,460.4 2,474.7
2,580.8 2,770.6 2,836.0
0
500
1,000
1,500
2,000
2,500
3,000
2009 2010 2011 2012 2013
Mils 2013 $
Direct ICT Payments
Tech Units and Secondary Impacts
Sources: Washington State Office of Financial Management, 2014; Washington State Department
of Revenue, 2014; Community Attributes Inc., 2014.
Direct tax payments, adjusted for inflation, have increased from $651 million in
2009 (2013 dollars) to $777 million in 2013, a compound annual growth rate of
4.5%. Estimated tax revenues generated by activities supported by ICT grew
3.6% per year over this period.
The term “fiscal multiplier” as used in this study refers to the ratios of direct jobs,
income, and revenues to total tax revenues collected by the state through the sum
of activities supported by ICT through direct, indirect, and induced effects. In
2013, every one additional ICT worker was associated with $11,900 in state tax
revenues. Every $1 million in labor income supported $112,900 in tax revenues,
and every $1 million in sales supported $36,700 (Exhibit 37).

Washington State Information & February 2015 34
Communication Technology Cluster Study
Exhibit 37. Fiscal Multipliers for Core ICT Activities, 2013
Total taxes paid per 1 additional ICT cluster worker $11,900
Total taxes per $1 million in ICT cluster labor income $112,900
Total taxes per $1 million output in ICT cluster $36,700
Sources: Washington State Office of Financial Management, 2014; Washington State Department
of Revenue, 2014; Community Attributes Inc., 2014.
Comparing the ICT cluster against other sectors in Washington helps illustrate
the cluster’s fiscal contributions. In 2013, each additional ICT worker was
associated with $752,400 in output across the economy (factoring direct, indirect,
and induced impacts). From this, an average of $11,900 in state tax revenues was
associated with this one additional worker. This compares with $13,300 in
revenues economy-wide from each additional aerospace worker and $11,300 per
each additional hospital employee (Exhibit 38). The largest share of this total
fiscal impact comes from state sales & use tax revenues, owing to the high
salaries paid to many ICT workers and resulting share of income spent on taxable
goods and services.
Exhibit 38. Sector Comparison of Statewide Impacts per Additional Worker
Economic Category State B&O Tax State Sales & Use Tax Other State Taxes Total Tax Impact
Credit Intermediation and Related Activities 13,700 11,600 700 26,100
Machinery Manufacturing 4,400 7,400 600 12,300
ICT Cluster 3,700 7,600 600 11,900
Water Transportation 3,500 7,100 1,100 11,700
Fishing, Hunting, and Trapping 3,500 6,900 1,000 11,400
Other Finance and Insurance 5,400 5,500 400 11,200
Aircraft and Parts Manufacturing 4,400 6,200 600 11,100
Ship and Boat Building 3,400 6,600 600 10,600
Wood Product Manufacturing 3,600 6,100 700 10,400
Hospitals 4,200 5,100 400 9,600
Fabricated Metals Manufacturing 2,800 4,800 400 8,000
Furniture Product Manufacturing 2,100 4,800 300 7,200
Sources: Washington State Office of Financial Management, 2014; Washington State Department
of Revenue, 2014; Community Attributes Inc., 2014.
Philanthropic Activities
The philanthropic activities of ICT companies and employees in Washington
have a significant impact on both local and national nonprofits. While 2013 saw
total charitable giving in the US by individuals increase, it saw a 1.9% decrease in
corporate giving (Forbes, 2014). That said, Washington’s ICT cluster is home to
several notable philanthropic companies and leaders.
In 2013, Microsoft was the top corporate philanthropist in Washington State,
giving more than $36 million in cash gifts to local philanthropies like Boys and

Washington State Information & February 2015 35
Communication Technology Cluster Study
Girls Clubs, Year Up Puget Sound, and Washington STEM. Microsoft matches
individual employee contributions up to $15,000 per year with a $17/hour
equivalence for volunteer time, accounting for roughly $250 million in additional
philanthropy in Washington. In 2013, Microsoft employees set a new record for
charitable giving, sending $113 million to over 19,000 nonprofits. Microsoft’s
total cash donations for fiscal year 2014 topped out at $1.067 billion, up from
$907 million in fiscal year 2013.
All 12 members of Microsoft’s Board of Directors engaging directly in
philanthropic activities. For example, Chairman John Thompson is the most
public and active supporter of Ducks Unlimited, a wetlands and waterfowl
conservation group that restores grasslands, replants forests, and restores
damaged watersheds. To say Microsoft management leads its employees by
example in the field of philanthropy is an understatement; Microsoft Co-Founder
Bill Gates has personally donated over $28 billion to charity, and his foundation,
the Bill and Melinda Gates Foundation, is the world’s wealthiest.
In October 2013, Amazon announced the launch of AmazonSmile, a website
operated by Amazon that offers the same selection of products, but donates 0.5%
of the price of eligible purchases to charitable organizations. Amazon’s other
philanthropic priorities include education and children. The company regularly
donates Kindles, gift cards to schools and Amazon CEO and Founder Jeff Bezos
has donated roughly $55 million to charities around the country.
Washington State is also home to several charitable organizations in the ICT
sector. Computers with Causes, an organization that refurbishes donated
computers for placement into educational environments, accepts a wide variety
of computers. Large ICT companies that periodically replace employee
computers make bulk donations to the organization, and enjoy tax benefits as a
result. Similar programs exist for the full range of computers and electronics used
by ICT companies.
5. INNOVATION AND ENTREPRENEURIALISM The ICT cluster is rooted in a long history of disruptive innovation and the
development of new products, services, and business processes. Innovation and
entrepreneurialism occur through a variety of channels and sources. Start -ups, an
important component of the ICT cluster, can emerge out of university tech
transfer offices, as spin-outs from larger companies, or through individual
creativity. In many cases, younger firms were launched by former employees of
Microsoft, Amazon, F5, Real Networks, or other larger ICT businesses in
Washington. The examples below help illustrate the various institutions and
sources of innovation and entrepreneurship across the state.

Washington State Information & February 2015 36
Communication Technology Cluster Study
Multi-Generational Start-ups
There are thousands of examples of former employees of one successful
company leaving to start their own company. A perfect example of this is the
following sequence. Microsoft was founded in 1975 and grew to become one of
the most dominant global software companies. RealNetworks was founded by
Microsoft employees in 1994 and pioneered streaming media and online gaming,
which transformed the internet and inspired new services such as YouTube,
Spotify, and Candy Crush. Isilon was founded in by RealNetworks employees in
2001 and pioneered data storage systems, helping lead the way to cloud
computing and attracting EMC to acquire Isilon for $2.2 Billion. Tech start-up
Qumulo was founded in 2012 by Isilon employees, and is pioneering a suite of
services for the new category of Big Data analytics.
Incubators & Accelerators
The start-up incubator is a pool of resources and mentors, designed to provide
everything from low-cost office space to expertise from entrepreneurs who have
been there before. A start-up accelerator typically offers only mentoring.
Founder’s Co-op is an example of an incubator. The Co-op has what it calls a
“peer-to-peer” investment structure allowing limited partners with
entrepreneurial and technology experience to invest in start-ups at the incubator.
The Co-op’s strategy is built off of the idea that funding is no longer the primary
limiting reagent in the start-up equation, but access to talent and expertise is.
UpGlobal is an example of an accelerator. Better known as Start-Up Weekend—
one of the six programs run by the company - UpGlobal is a not-for-profit that
operates a series of seminars and events to coach entrepreneurs from a basic
desire or idea; to forming a viable business plan; to financing and launching their
company. UpGlobal operates in over 100 countries.
Other examples of the many influential start-up incubators and accelerators in
Washington include Surf, Impact Hub, Northwest Innovation Resource Center,
and Start-up Spokane.
UW Buerke Center Annual Business Plan Competition
The Foster School of Business houses a center for Entrepreneurship at the
University of Washington. The UW Buerke Center for Entrepreneurship has
become a nationally recognized, premier organization integrating classic
curriculum and local entrepreneur expertise broadly into the university programs.
The Buerke Center showcase is an annual business plan competition that
provides coaching, mentoring, and advice to student led companies that compete
over the course of several months for funding. Teams from many colleges and
universities in Washington State enter this competition to vie for a significant
financial prize.

Washington State Information & February 2015 37
Communication Technology Cluster Study
The Buerke Center also launched another program—the Jones Accelerator—to
provide additional mentoring and funding after the business plan competition.
These two programs are an excellent example of how a university, in partnership
with local entrepreneurs and venture capital, can develop a successful platform
for start-ups to begin at the undergraduate level.
Corporate Investment
In some cases, innovation in ICT emerges from partnerships between small and
large existing firms, oftentimes through a client/customer-service provider
relationship. For example, the bulk of Verizon’s ICT R&D is done with partners,
linking innovators with a network that can get their product on the market.
Verizon linked with a Kirkland-based company called INW that makes water
sensors that go into lakes, wells, reservoirs, and ponds. Verizon developed a
modem in partnership with INW to pull data from sensors rather than physically
accessing sensors to pull data.
Innovation at AT&T looks very different than 20 or 30 years ago. The Digital
Life products, including home security, are a strategic priority for the company
along with new innovations that will bring Wi-Fi inside your car. R&D for both
the Digital Life group and the “Connected Car” is done in Bothell. ICT
employment there is growing, along with non-ICT occupations such as HR and
sales.
AT&T also boasts four “Foundries” around the U.S. which operate as R&D labs.
Similar to the Nordstrom Innovation Labs, the AT&T Foundry innovation centers
are fast-paced and collaborative environments where AT&T and technology
providers team with developers to deliver the latest applications and services into the
hands of customers more quickly than ever before.
The company reports that each Foundry (the original facility is in Austin, Texas)
demands a $50 million dollar investment to start. Even so, Seattle may be in the
running for the next location. Customer feedback is critical to the R&D cycle at
each Foundry; AT&T showcases strategic projects (many of which originated
from mobile and residential customers) and asks for customer input and
suggestions on their blog.
Investments in Washington’s ICT Companies
Start-ups play a critical role in the growth and vitality of the ICT cluster—much
more so than other segments of the economy. The success of start-ups relies on
an ecosystem that includes seed (angel) and venture capital, existing companies
and educational institutions that drive innovation, and broader institutional
support for companies to grow (and succeed or fail). Exhibit 39 presents the key
components of the start-up ecosystem.
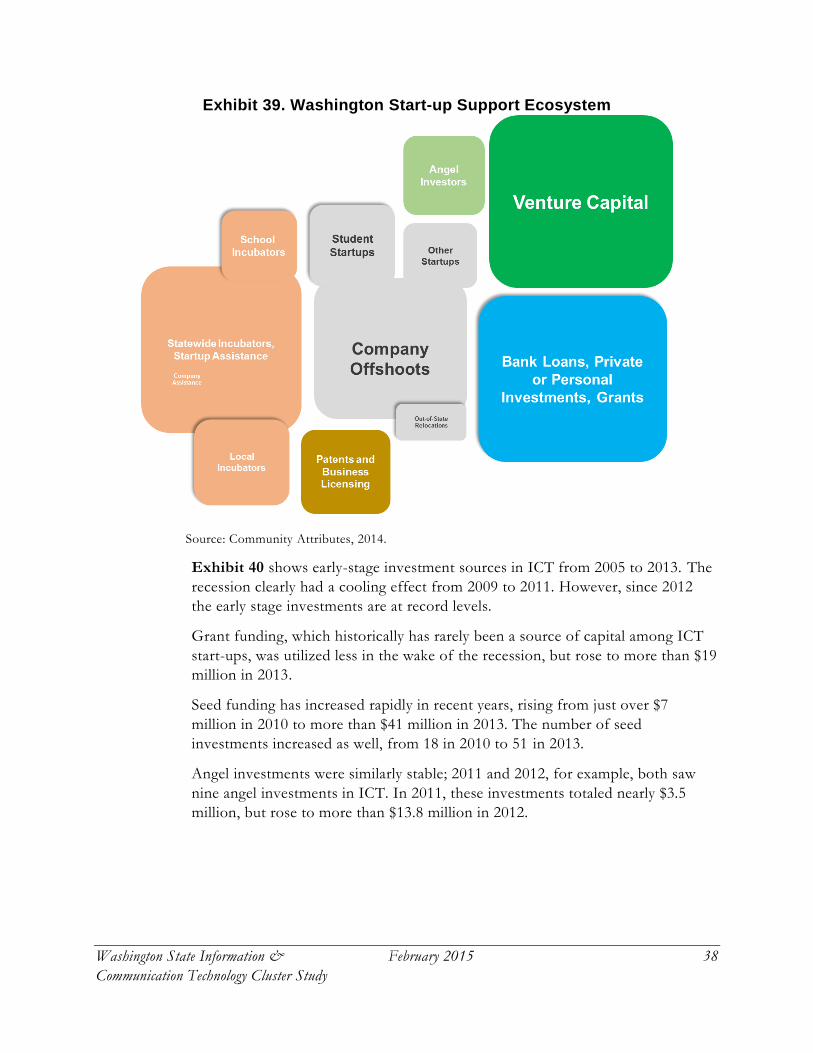
Washington State Information & February 2015 38
Communication Technology Cluster Study
Exhibit 39. Washington Start-up Support Ecosystem
Source: Community Attributes, 2014.
Exhibit 40 shows early-stage investment sources in ICT from 2005 to 2013. The
recession clearly had a cooling effect from 2009 to 2011. However, since 2012
the early stage investments are at record levels.
Grant funding, which historically has rarely been a source of capital among ICT
start-ups, was utilized less in the wake of the recession, but rose to more than $19
million in 2013.
Seed funding has increased rapidly in recent years, rising from just over $7
million in 2010 to more than $41 million in 2013. The number of seed
investments increased as well, from 18 in 2010 to 51 in 2013.
Angel investments were similarly stable; 2011 and 2012, for example, both saw
nine angel investments in ICT. In 2011, these investments totaled nearly $3.5
million, but rose to more than $13.8 million in 2012.

Washington State Information & February 2015 39
Communication Technology Cluster Study
Exhibit 40. Early Stage Investments in ICT, Washington State,
2005-2013, Millions of 2013 Dollars
Source: Community Attributes, 2014; Crunchbase, 2014.
Venture capital investment data comes from the National Venture Capital
Association based ICT investment categories, such as computers and peripheral
equipment and IT services. Total investments in ICT from 2001 through the first
quarter 2014 show that venture capital investments in ICT are no less volatile
year to year than venture capital investments in general. However, the recent
trend has been positive since 2010, with total ICT-related venture capital
investments growing from $301 million (2010) to $613 million in 2013 (Exhibit
41).

Washington State Information & February 2015 40
Communication Technology Cluster Study
Exhibit 41. Venture Capital in Washington-Based ICT by Year, 2001-2014Q1,
Millions of Dollars
Source: National Venture Capital Association, 2014.
While total investments in the ICT sector for the past 12 years have cycled
through a correction period after the Internet bubble of 2000 and a cooling
period due to the recession of 2008, the total number of venture capital firms
making those investments remained fairly consistent.
Interviews completed with two venture capital firms confirm that the Seattle
market in particular is strong. According to one interviewee, “The business
climate and momentum is as high as it’s ever been in Seattle.”
There are several drivers of the growth in ICT start-up formation and financings.
First, the Seattle area has a strong legacy of gaming companies and a talent pool
that has cycled through several iterations of product and company development.
This is a core strength expected to last for at least the next decade. Key
companies in this arena include Xbox, Nintendo, Valve, Big Fish Games, Pop
Cap.
The next big driver of growth is cloud computing. Amazon Web Services
launched this new segment, followed by Google and Microsoft. Oracle has now
entered the area with a new engineering facility. Meanwhile, dozens of new start-
ups have formed to build new products and services that address the shift of
computing to the cloud.
Some private sector interviewees described a lack of mid-size ICT companies.
“There are several billion dollar companies, but we don’t have many $2 to 500
million companies.” Another interviewee mentioned “Washington needs to map
each system holistically. We’re OK at the grass roots level, weak in the middle
market and fine on anchors. We need time to fill in the middle.”

Washington State Information & February 2015 41
Communication Technology Cluster Study
Interviewees acknowledged that their engagement with ICT entrepreneurs
happens at events like Start-up Weekend at UW Buerke Center and TechCrunch
but the companies and/or leaders themselves are not good at self-managing this
piece. Events that help facilitate more meaningful introductions and dialogue
between entrepreneurs and venture capitalists is an area where improvement
seems to be needed.
Exhibit 42 shows venture capital firms investing in ICT by segment. From 2011
to 2013, total investments increased by 70.7% while the number of venture
capital firms making investments increased by 20.1%.
Exhibit 42. Number of Venture Capital Investments in Washington-Based ICT
by Segment, 2011-2013
Segment 2011 2012 2013 Total
Computers and Peripherals 6 0 1 7
Electronics/Instrumentation 0 2 0 2
IT Services 18 23 25 66
Media and Entertainment 32 19 37 88
Networking and Equipment 4 3 5 12
Semiconductors 4 9 4 17
Software 51 64 75 190
Telecommunications 9 6 2 17
Total 124 126 149 399
Source: National Venture Capital Association, 2014.
Exhibit 43 paints a similar picture with regards to total companies receiving
venture capital funding. The same time period that saw a 70.7% increase in total
venture capital only saw a 25.4% increase in companies receiving funding. Taken
together, this data suggests that both venture capital firms and the ICT
companies they invest in are inelastic relative to total venture capital investments;
when less funding is available, a similar number of firms is making investments in
a similar number of companies as when venture capital is more available.

Washington State Information & February 2015 42
Communication Technology Cluster Study
Exhibit 43. Washington-Based ICT Companies Receiving Venture Capital by
Segment, 2011-2013
Segment 2011 2012 2013 Total
Computers and Peripherals 1 0 1 2
Electronics/Instrumentation 0 1 0 1
IT Services 10 10 9 29
Media and Entertainment 15 11 17 43
Networking and Equipment 2 1 1 4
Semiconductors 1 1 1 3
Software 32 39 49 120
Telecommunications 2 3 1 6
Total 63 66 79 208
Source: National Venture Capital Association, 2014.
Exhibit 44 compares ICT funding in Seattle, the center of Washington’s ICT
cluster, with ICT funding in Boston, another major ICT hub. We deliberately do
not compare Seattle to The Valley because the scale is not comparable. Boston is
a better benchmark for Seattle. The two cities received nearly the same total
volume of funding from 2005 to 2013: Seattle companies received more than
$49.9 billion and Boston companies received more than $52.7 billion.
From 2005 to 2013, funding in Seattle—ICT and other—composes almost the
entirety of funding in the state, making up $49.9 billion out of $52.5 billion in
total funding. While Boston area companies received more stable funding over
the time period, Seattle area ICT companies received both more funding than
their Boston counterparts and a larger share of total area funding. 86% of Seattle
area funding went to ICT companies during this time period, while 81% of
Boston area funding went to ICT companies.
ICT investments in Washington increased substantially in 2008 and 2009. These
jumps in investments were largely due to investments in the company ClearWire,
a telecommunications operator that provides communications services to retail
and wholesale companies in the United States and Europe. In 2008, the largest
single investment in Washington was a $3.2 billion investment in ClearWire. The
next year, the two largest investments were a $1.5 billion and $0.9 billion
investment in ClearWire.

Washington State Information & February 2015 43
Communication Technology Cluster Study
Exhibit 44. Seattle and Boston Investments in ICT as Share of
Total Investments, 2005-2013, Billions of 2013 Dollars
Source: Crunchbase, 2014.
Investments in Washington’s ICT cluster can also take the form of acquisitions.
Exhibit 45 summarizes the ratio of in-state to out-of-state acquiring companies
by size of disclosed acquisition from 2005 to 2013. For this time period, every $1
in in-state ICT acquisitions was accompanied by $2.83 in out-of-state ICT
acquisitions. The value of total acquisitions changed significantly over this period,
ranging from 3 acquisitions of undisclosed values in 2006 to more than $8.39
billion in 2008. To compensate for incomplete value disclosure, the number of
in-state and out-of-state ICT acquisitions overlays the chart.
Of the top ten acquisitions in Washington through 2013, six were ICT companies.
The top acquisition by value, Snowblind Studios, was purchased by Warner Bros.
in 2009 for $7.88 billion.
All told, acquisitions from 2005 to 2013 comprise $4.5 billion in acquisitions
from California-based companies, $7.2 billion in acquisitions from Washington-
based companies, $2.7 billion in acquisitions from Massachusetts-based
companies, and $13.4 billion in acquisitions from other companies.
Many start-ups are founded with acquisition by a major company as an explicit
end goal. The data for ICT companies in Washington suggests that, while the
number of acquisitions is increasing, the total value of acquisitions does not show
a similar trend.

Washington State Information & February 2015 44
Communication Technology Cluster Study
Exhibit 45. In-State and Out-Of-State ICT Acquisitions, 2005-2013,
Billions of 2013
Dollars
Source: Crunchbase, 2014.
University Start-Ups
As will be discussed in detail in the next section, the University of Washington
and Washington State University combined accounts for a large portion of new
workers in the ICT cluster. It logically follows that the two universities would
account for a similar portion of ICT start-ups. Universities are well equipped to
provide basic seed funding, patenting and technology commercialization, and
provide mentorship and advice to university-based entrepreneurs (faculty and
students). The University of Washington Center for Commercialization reports
that over 250 start-ups have come out of the University. Exhibit 46 provides
examples of University of Washington and Washington State University start-ups
that fit the definition of ICT.

Washington State Information & February 2015 45
Communication Technology Cluster Study
Exhibit 46. ICT Start-ups from the University of Washington and Washington
State University, 2011-2013 Year Name University Description
2001 DiMeMa, Inc. UW Publisher of CONTENTdm, a digital management software designed for
libraries. In 2003, the Online Computer Library Center (OCLC) acquired
DiMeMa.
2004 Farecast UW A technology developed to predict fluctuations in airfare prices, which
Microsoft purchased and rebranded as Bing Travel.
2005 GridStat WSU Smart grid research and development funded by grants from the
Department of Energy, Department of Homeland Security, and the
National Science Foundation.
2005 Pavia Systems UW Creates web-based employee training programs for companies in the
asphalt industry.
2006 MapWith.US WSU Advanced geospatial technology that affords users the ability to create
and customize online maps.
2006 Nimbic UW Provides 3D Full-Wave, electromagnetic simulation solutions for chip-
package-board design, evaluation of signal and power reliability, and
scalable cloud computing.
2006 Skytap UW Skytap Cloud caters to organizations and software designers, allowing
them to work together to develop, refine, and assess new and
established applications in the cloud.
2007 Ionographics, Inc. UW Specializes in Electrochemical Printing, a computer-aided process
involving electrochemical microfabrication technology.
2007 TransformativeMed UW A leader in health information technology, TransformativeMed develops
software that augments the value of current electronic medical record
systems for hospitals and other healthcare providers.
2008 Adeona UW Produced the first system used to track the location of lost or stolen
laptops that isn’t reliant on a central, privately-operated service.
2008 Corensic UW Designs programming technology that enables developers and IT
companies to construct more dependable software.
2008 Patient Stream UW Develops cloud-based applications that optimize healthcare procedures
with the goal of expediting and streamlining patient care.
2010 Portage Bay Photonics UW Supported by grants from the Department of Defense and the United
States Air Force, Portage Bay Photonics is in the process of
developing advanced photonic devices with silicon inputs to increase
the speed of optical systems, computers, and other communication
devices.
2010 Soluxra UW Produces thermally-stable, advanced polymer-material inputs for
telecommunications and optical computing devices that improve
performance and reliability.
2012 CompSoftBook UW Developed and maintains an online assessment tool geared specifically
towards evaluation of computer science and programming courses.
2012 RGB HATS LLC UW Released “Control-Alt-Hack”, a card game aimed at making learning
about computer safety and security more engaging for high school and
college students.
2012 Rosetta@Cloud UW Caters to the pharmaceutical and biotech industries, offering molecular
modeling in the cloud.
Source: the University of Washington, 2014; Washington State University, 2014.

Washington State Information & February 2015 46
Communication Technology Cluster Study
The University of Washington boasts the top rank in national licenses signed for
a university, and doubled its annual patent applications in 2013. The University of
Washington’s business incubator, known as the New Ventures Facility, was
recently named the emerging incubator of the year by the 2014 University
Business Incubators Global Index. From January to July 2014, the incubator
alone helped launch 18 start-ups.
Washington State University provides similar advantages to its student and
faculty entrepreneurs, and helped develop 13 new businesses at WSU facilities in
2013. At any given time, the university has roughly 100 patents available for
licensing.
Start-Up Profiles
Out of the many ICT start-ups in Washington, several have attracted national
attention and help highlight the diverse set of ICT activities that are receiving
venture capital funds, carrying out successful IPOs, and helping to drive new job
growth in Washington. Profiled below are four such companies.
Zulily
Zulily was founded in 2009 by Darrell Cavens and Mark Vadon, who worked
together at Blue Nile for a number of years. The 72-hour flash sale site caters to
mothers with young children, and offers deals on everything from toys to
women’s apparel to household goods with a site-wide average cost of twenty
dollars or lower per product. After sales for items have ended, Zulily places bulk
orders with the product merchants. Once vendor orders arrive at Zulily’s
fulfillment centers in Reno and Columbus, merchandise is ready to be shipped to
customers. Zulily went public in 2013 with an initial valuation of 2.6 billion
dollars, and is expanding quickly—the company recently moved to its sixth
Seattle office, which houses over a thousand employees. A larger Reno fulfillment
center is also in process, which will bring Zulily’s total warehouse space to a
million and a half square feet. The rapid growth is necessary to accommodate the
site’s ten million members, who generated 5.5 million total orders for First
Quarter 2014, an increase of 91 percent year over year. The company’s net sales
for 2014 are expected to be between 1.15 and 1.2 billion dollars.
An interview with Zulily clarified what elements have been significant in driving
success at Zulily. Executives at the company spoke directly about their unique
business model (i.e. buying no inventory until a sale happens). They also said the
company “deploys code at least 100 times a day.” This kind of dynamic online
environment has been critical to keeping web content fresh and interesting for
their busy customers.

Washington State Information & February 2015 47
Communication Technology Cluster Study
ExtraHop
Jesse Rothstein and Raja Mukerji, two F5 veterans, founded ExtaHop in 2007
with Madrona Venture Group, Meritech Capital Partners, and Andreessen
Horowitz as investors. In 2008, ExtraHop released its Application Delivery
Assurance (ADA) system, and became the first network management company to
supply true application transparency and visibility without agents or overhead.
This program allows IT organizations to pinpoint specific issues hindering
performance as opposed to being limited to monitoring the entirety of a system,
and having to manually search for malfunctions. The ADA system assists IT
entities in predicting network traffic, troubleshooting recurring problems, and
isolating slow routes by affording users real-time wire data analytics at a sustained
speed of twenty gigabytes per second. Prior to the release of the ADA system, IT
providers had to employ a series of configuration settings in conjunction with a
multitude of excess staff in order to investigate system inefficiencies or failures.
ExtraHop is based in Seattle, but has become a global leader in network interface
diagnostics.
Big Fish Games
Paul Thelen established Big Fish Games in Seattle in 2002. Since then, the
company has grown rapidly, acquiring offices in Oakland, California, Vancouver,
Canada, Ireland, and Luxembourg with an 83.3 million dollar common stock
financing for global growth from Balderton capital, General Catalyst Partners,
and Salmon River Capital. Big Fish is the world’s largest producer of casual
games, and has distributed over two billion games from a developing inventory of
more than three thousand unique PC games and three hundred distinctive mobile
games. Big Fish has in-house production studios as well as 140 exclusive
development partners. Its games are played in 150 countries in thirteen languages
on nine platforms, including PC, mobile, Kindle, and Nintendo Wii.
Tableau Software
Born out of a Department of Defense project aimed at augmenting people’s
capacity to examine and comprehend data, Tableau Software was initially
founded by Chris Stolte, Pat Hanrahan, and Christian Chabot in Mountain View,
California in January 2003. Ten months later, the Tableau founders moved the
company’s headquarters to Seattle. Tableau’s overarching goal is to make
spreadsheets and databases accessible and understandable to the average person
in an era where the quantity of available data are constantly increasing. Its
software is simple to use, and delivers fast analysis of any dataset, allowing its
users to increase their business intelligence. The company has a diverse customer
base of more than 17,000 users in fields ranging from healthcare to banking to
insurance to agriculture. Tableau went public in May 2013, and raised more than
250 million dollars. According to the company’s 2013 financial report, revenue
for the year was 232.4 million, an 82% growth over its revenue from 2012.

Washington State Information & February 2015 48
Communication Technology Cluster Study
ICT Initial Public Offerings
ICT IPOs account for a disproportionately large share of total IPO value in
Washington State. Exhibit 47 shows all Washington company IPOs, divided into
ICT companies and non-ICT companies.
Exhibit 47. Washington IPOs, ICT and non-ICT, 2009-2014Q2, Millions of Dollars
Date Company IPO City
4/18/2011 Zillow 55.7 Seattle
4/2/2013 Tableau Software Inc. 248.4 Seattle
10/8/2013 Zulily 238.1 Seattle
6/16/2014 Trupanion, Inc. 122.9 Seattle
Total ICT IPO Value: 665.1
8/10/2009 InfrastruX Group Inc. 290.0 Seattle
10/5/2009 Symetra Financial Copr. 434.7 Bellevue
10/1/2010 Atossa Genetics Inc. 8.1 Seattle
5/6/2011 HomeStreet Inc. 64.7 Seattle
11/14/2011 ClearSign Combustion Corp 12.0 Seattle
2/14/2012 Atossa Genetics Inc. 8.1 Seattle
5/20/2013 NanoString Technologies 93.2 Seattle
3/11/2014 Papa Murphy's Holdings, Inc. 87.2 Vancouver
3/19/2014 Alder BioPharmaceuticals, Inc. 123.3 Bothell
4/17/2014 Taggeres Agriculture Corp 48.3 Kennewick
6/23/2014 Immune Design Corp 74.9 Seattle
Total IPO Value: 1909.5
Source: IPO Monitor, 2014; Community Attributes 2014.
ICT IPOs account for $765.1 million of the $2009.5 million total IPO value of
Washington companies. The average IPO of an ICT company is $153.0 million,
compared to $113.1 million for non-ICT companies.
Experts from the venture capital field commented on the slower pace of IPO’s in
2012 and 2013 in the Seattle area. One interviewee said there have been fewer
recent IPO’s because start-ups have been bought before their valuation
skyrockets. One person said the mergers and acquisitions (M&A) market in 2013
was the hottest it had been in recent years.

Washington State Information & February 2015 49
Communication Technology Cluster Study
6. WORKFORCE SUPPLY ASSESSMENT
ICT Occupation Education Requirements
The Bureau of Labor Statistics surveys and publishes “typical education needed
for entry” by occupation, as shown in Exhibit 48, from BLS’s Employment
Projections program, based on nationwide surveys. BLS describes typical
education needed as the category that “best describes the typical level of
education that most workers need to enter the occupation”.6
Exhibit 48.
Education Attainment Level by Occupation, U.S. Bureau of Labor Statistics
Education SOC Code Occupation
Associates or 15-1151 Computer User Support Specialists
Some college 15-1152 Computer Network Support Specialists
Bachelor's * 15-1132 Software Developers, Applications
degree * 15-1131 Computer Programmers
15-1121 Computer Systems Analysts
11-3021 Computer and Information Systems Managers
* 15-1133 Software Developers, Systems Software
15-1134 Web Developers
15-1142 Network and Computer Systems Administrators
* 17-2071 Electrical Engineers
* 15-1143 Computer Network Architects
15-1199 Computer Occupations, All Other
15-1141 Database Administrators
15-1122 Information Security Analysts
15-2031 Operations Research Analysts
* 17-2061 Computer Hardware Engineers
Master's or Doctoral * 15-1111 Computer and Information Research Scientists
Source: Community Attributes, 2014; BLS Occupational Employment Estimates, 2013.
6 http://www.bls.gov/emp/ep_definitions_edtrain.pdf

Washington State Information & February 2015 50
Communication Technology Cluster Study
The BLS and the National Center for Education Statistics (NCES, a part of the
Census Bureau) also survey educators to ascertain the program names of degree
programs that map to occupations.
For example, the list of degrees that the NCES shows to suit a career as a
Software Developer are shown in Exhibit 49. Nationwide, the list demonstrates
that there is a many-to-many relationship between degree programs and
occupations in ICT (as in all fields). The full list of all degrees and programs
suitable for a degree in all essential ICT Occupations is shown in the next section,
along with graduates from Washington-based institutions.
Exhibit 49. Education Requirements Example: Degree Programs or Majors
Suitable for a Software Developer Career
Program/Major
Associate
Degree and
Certificate
Programs
Bachelor's
Degree
Total
Graduates
Artificial Intelligence 0
Information Technology 29 29
Informatics 0
Computer Programming/Programmer, General 39 39
Computer Programming, Specific Applications 19 19
Computer Science 1 24 25
Modeling, Virtual Environments and Simulation 2 2
Computer Engineering, General 17 17
Computer Software Engineering 2 2
Computer Software Technology/Technician 0
Bioinformatics 0
Medical Informatics 0
Total 43 90 133
Washington-Based Education and Training
The full list of all degrees and programs often associated with ICT Occupations
is shown in Exhibit 50, along with the number of people that graduate from
Washington-based institutions with those degrees in 2013. A smaller set of degree
programs are considered suitable by industry hiring managers for essential ICT
jobs and is shown in the upper section of Exhibit 50.
Accredited higher education institutions produced a total of 4,864 students in 2-
year and higher programs intended to prepare a student for entry into the ICT sector.
However, according to industry hiring managers and recruiters, most of these
programs are not suitable for essential ICT job openings.
Of the 4,864 graduates in 2013, there were 2,384 graduates with 2-year degrees
who are not qualified for those jobs. Of the remaining 2,480 students graduating
in 2013 with 4-year degrees or higher, the majority of programs – while leading to
other employment – do not develop the skills or experience required for the
leading ICT firms to hire them into essential ICT jobs.

Washington State Information & February 2015 51
Communication Technology Cluster Study
In 2013, the entire Washington university and college system graduated 1,239
students with these degrees, of which only 979 were awarded a 4-year degree or
higher. As shown in subsequent sections, this total is far short of the demand.
Exhibit 50. Majors and Programs Suitable for Washington ICT Occupations by
Number of Graduates, Washington, 2013
Rank Program/Major
Associate Degree
and Certificate
Progams
Bachelor's
Degree
Master's
Degree and
Higher
Total
Graduates
1. Computer and Information Sciences, General 356 163 519
2. Computer Science 14 274 30 318
3. Computer Programming/Programmer, General 246 2 248
4. Computer Programming, Specific Applications 59 16 75
5. Computer Engineering, General 65 1 66
6. Computer Software Engineering 4 9 13
Core Degree Programs Subtotal 260 760 219 1,239
1. Computer Systems Networking and Telecommunications 691 35 1 727
2. Electrical and Electronics Engineering 26 347 123 496
3. Web Page, Digital/Multimedia and Information Design 416 18 434
4. Management Information Systems, General 309 18 327
5. Information Technology 1 286 28 315
6. Computer and Information Systems Security/Assurance 187 42 6 235
7. Operations Management and Supervision 18 192 210
8. Computer Support Specialist 176 176
9. Web/Multimedia Management and Webmaster 139 139
10. Computer Graphics 108 26 134
11. System, Networking, and LAN/WAN Management/Manager 106 106
12. Network and System Administration/Administrator 90 90
13. Data Processing and Technology/Technician 79 79
14. Data Modeling/Warehousing and Database Administration 60 60
15. Management Science 37 37
16. Computer Systems Analysis/Analyst 26 26
17. Computer Programming, Vendor/Product Certification 21 21
18. Modeling, Virtual Environments and Simulation 6 6
19. Mathematics and Computer Science 5 5
20. Bioinformatics 1 1
21. Operations Research 1 1
Other ICT Degree Progams Subtotal 2,124 1,325 176 3,625
Total All ICT Degree Programs 2,384 2,085 395 4,864
Sources: Community Attributes, 2014; National Center for Education Statistics, 2012.
The University of Washington graduates the most candidates in programs that are
suitable for many ICT occupations, with 1,118 graduates in the school year of
2012/2013 (of which 141 were reported to NCES for the Computer Science
program), as shown in Exhibit 51, presenting the number of graduates of ICT-
related programs, by institution and level of education. Note that of the total
1,118 graduates less than half are suited to essential ICT occupations. By
comparison, Washington State University graduates the second-most candidates
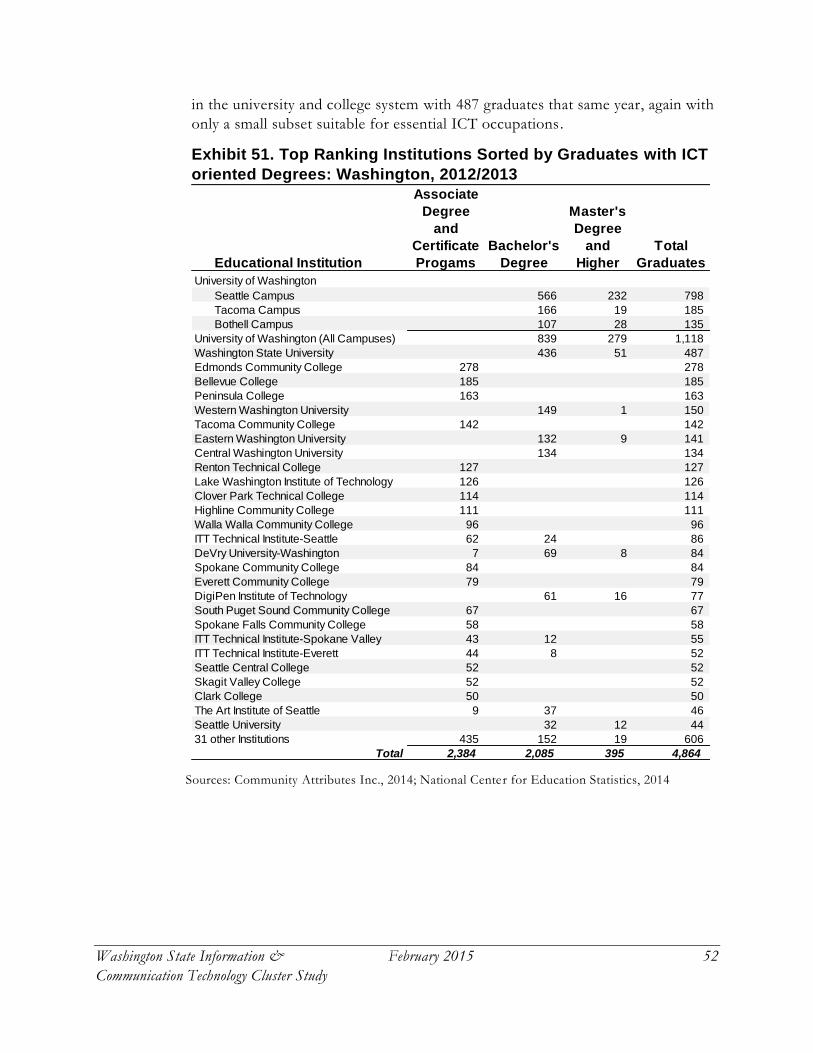
Washington State Information & February 2015 52
Communication Technology Cluster Study
in the university and college system with 487 graduates that same year, again with
only a small subset suitable for essential ICT occupations.
Exhibit 51. Top Ranking Institutions Sorted by Graduates with ICT
oriented Degrees: Washington, 2012/2013
Educational Institution
Associate
Degree
and
Certificate
Progams
Bachelor's
Degree
Master's
Degree
and
Higher
Total
Graduates
University of Washington
Seattle Campus 566 232 798
Tacoma Campus 166 19 185
Bothell Campus 107 28 135
University of Washington (All Campuses) 839 279 1,118
Washington State University 436 51 487
Edmonds Community College 278 278
Bellevue College 185 185
Peninsula College 163 163
Western Washington University 149 1 150
Tacoma Community College 142 142
Eastern Washington University 132 9 141
Central Washington University 134 134
Renton Technical College 127 127
Lake Washington Institute of Technology 126 126
Clover Park Technical College 114 114
Highline Community College 111 111
Walla Walla Community College 96 96
ITT Technical Institute-Seattle 62 24 86
DeVry University-Washington 7 69 8 84
Spokane Community College 84 84
Everett Community College 79 79
DigiPen Institute of Technology 61 16 77
South Puget Sound Community College 67 67
Spokane Falls Community College 58 58
ITT Technical Institute-Spokane Valley 43 12 55
ITT Technical Institute-Everett 44 8 52
Seattle Central College 52 52
Skagit Valley College 52 52
Clark College 50 50
The Art Institute of Seattle 9 37 46
Seattle University 32 12 44
31 other Institutions 435 152 19 606
Total 2,384 2,085 395 4,864
Sources: Community Attributes Inc., 2014; National Center for Education Statistics, 2014

Washington State Information & February 2015 53
Communication Technology Cluster Study
Exhibit 52 illustrates these same ICT completions by
institution, mapped across the state of Washington. While the
western side of Washington contains the largest concentration
of these educational institutions graduating students for ICT,
graduates are distributed widely across the state, from
Vancouver to Bellingham and Seattle to Spokane.
Exhibit 52. Educational Institutions in ICT Sized by Completions, Economy-wide,
Washington State, 2012/2013
Source: Community Attributes, 2014; National Center for Education Statistics, 2014.
Washington State Information & February 2015 54
Communication Technology Cluster Study
Educational Needs for Essential ICT Occupations
As described earlier in this report, a few essential ICT occupations form the
innovation foundation of the ICT Cluster in Washington State, which are as
follows:
Software Developers (all types)
Computer Programmers
Computer Engineers
Computer Network Architects, and
Computer and Information Research Scientists
The degree programs required to serve these occupation, as identified by the
NCES and BLS are as follows:
Artificial Intelligence
Computer and Information
Sciences
Computer and Information
Systems Security/Information
Assurance
Computer Engineering, General
Computer Engineering, Other
Computer Hardware Engineering
Computer Programming
Computer Science
Computer Software Engineering
Computer Software
Technology/Technician
Computer Systems
Analysis/Analyst
Computer Systems Networking
and Telecommunications
Electrical and Electronics
Engineering
Electrical, Electronics and
Communications Engineering,
Other
Information Science/Studies
Information Technology
Modeling, Virtual Environments
and Simulation
Network and System
Administration/Administrator
The BLS choose degree titles that are nationwide in nature, and not all programs
by these names are offered in Washington institutions. Nationally, demand for
these training programs is strong. According to local companies contacted for
this study, the market for workers with these skills and at least a Bachelor’s
degree has never been more competitive. Compensation, ability to impact
important projects, and a dedication to professional and skills development are all
important factors which companies use to recruit and retain the best ICT talent.
Google, Microsoft, and Amazon all have internship programs with colleges that
are designed to identify and prepare students who may have future success at top
companies.

Washington State Information & February 2015 55
Communication Technology Cluster Study
ICT University and College Programs in Washington
University of Washington
The University of Washington’s challenging curricula and internship programs
with industry produce some of the best local talent for top ICT companies in
Washington, especially regarding students who choose training and careers in
engineering.7 The University is a close recruiting partner for Washington
technology companies, the majority of whom are located in Western Washington.
Developing and maintaining expertise in the field is a large part of UW’s success.
In 2012, the University recruited four new faculty members in the fields of big
data and machine learning, who are considered to be some of the brightest in the
world of computer science.8 The UW graduates a little more than 200 students
each year with undergraduate degrees in Software Engineering and Programming.
The capacity of the UW program is a key focus area to increase the supply of
graduates to fill essential ICT occupation openings. The numbers of incoming
freshmen who intend to major in computer science & engineering at the
University of Washington have increased sharply since 2010,9 and while the
number of UW Engineering graduates has increased, capacity remains a
paramount issue for public universities (and the ICT workforce) in Washington
as state funding for higher education fails to keep pace with demand.10
Other Washington Universities
Students at Washington State University and other state universities are also
recruited for Washington’s top technology companies, though in smaller numbers.
Integrating the curricula of these programs and graduates to meet industry needs
is another key focus area to increase the supply of graduates to fill essential ICT
occupation openings. Some universities are working with industry to do that,
including WSU and the other public state universities, Eastern Washington
University, Western Washington University, and Central Washington University.
Private universities prioritizing ICT include Northeastern University in Seattle,
and Gonzaga University, Whitman College, and others.
Enrollment at Washington State University’s computer science and engineering
programs is on the rise. As a result of state investments, WSU plans to double its
7 Interview with Jeremy Brigges, Microsoft University Recruiting Manager, October 2014. 8 Long, Katherine, UW recruits superstars of computer-science world. The Seattle Times:
http://seattletimes.com/html/localnews/2018546054_computerscience28m.html 9 http://news.cs.washington.edu/2014/05/19/intended-majors-of-uws-2014-incoming-
freshmen-its-cse-baby/ 10 Tuition in Washington’s public universities increased more from 2008 to 2013 than in any
other state except Arizona: http://www.spokesman.com/stories/2014/may/05/public-
universities-washington-had-second-highest-/
Washington State Information & February 2015 56
Communication Technology Cluster Study
faculty in CS and CE from 13 to 14 now to 30 instructors over the next three
years. In addition, a new Bachelor’s degree specifically in Software Engineering is
being proposed for both the Pullman and Everett campuses. Presently, only
Computer Engineering and Computer Science are offered as a major at WSU. 11
After graduation, about 65% of CS and CE graduates from WSU receive job
offers and approximately 15% go on to earn graduate education. In 2013, at least
40 undergraduate students secured entry-level positions with Schweitzer
Engineering Labs (Pullman), Boeing, Micron, Microsoft, Isilon and Puget Sound
Energy.12
Community and Technical College Programs in ICT
Community and technical colleges in Washington State produce 35% of the
degrees associated with ICT occupations. Community colleges throughout
Washington provide ICT classes and programs. Many such programs are viewed
as a ramp up to complete a Bachelor’s degree at a four-year institution. Many are
also seen as vocational training to expand one’s marketable skills. Graduates may
apply their skills within existing occupation paths or may use the training to gain
employment in an ICT occupation. The State’s community college network plays
an important part in providing training and education for students that meet this
description.
Seattle Colleges (one school, three campuses plus the Seattle Vocational Institute)
offers two and four-year degrees in several ICT fields. A new evening degree
program (Application Development) began in the fall of 2014 and culminates in a
Bachelor’s of Applied Science degree. Seattle Colleges’ website reports , “When
compared to traditional Bachelor’s programs, bachelor of applied science degrees
more heavily incorporate hands-on learning, focused on a particular industry or
discipline. Added bonuses are emphasis on internship opportunities, credit for
prior learning and workplace experience.” There are 25-30 students admitted
each year and the program is designed for completion in two years pending
prerequisites.
Whatcom Community College in Bellingham offers a well-known AS degree in
Computer Information Systems (CIS) that began in 1996. With emphasis on
network security, support and network administration, this degree program
includes two faculty. One unique feature of their approach is the seamless
integration of all 90 CIS course credits into a new four-year degree program at
Western Washington University. This commitment to partnering with WWU is a
growing reflection that graduates from WCC are in a better position to gain
11 Interview with Dr. Behrooz Shirazi, Professor and Director of Engineering and Computer
Science Department, WSU, October 2014. 12 Interview with Dr. Behrooz Shirazi, Professor and Director of Engineering and Computer
Science Department, WSU, October 2014.
Washington State Information & February 2015 57
Communication Technology Cluster Study
employment in ICT with a 4-year degree. The WCC program has grown 50% in
the last five years, perhaps because of WCC’s designation as an Academic Center
of Excellence from the US Department of Homeland Security and the NSA. In
the next few years, WCC would like to add two more full-time faculty or adjunct
professors to keep up with projected growth.13
Certificate Programs, Online Learning and Other Training Programs
Other training avenues such as professional certificate programs and local and
non-local online represent a significant number of workforce training avenues. At
the University of Washington alone, 50 such certificate programs are offered in
ICT from the basics (programming languages and database architecture) to the
advanced (machine learning and data science) as well as all the support needed
for careers in these areas (project management, software testing and marketing).
Massive Open Online Courses (MOOC), such as Coursera, partner with
universities worldwide and provide students with access to programs and training
available in ICT, available online and for free or low cost. The curriculum for
these courses is broader than what is available locally and are becoming a popular
alternative to the more traditional in-person certificates for ICT professionals to
learn new skills. Recognition of these programs varies from employer to
employer. While they are able to teach technical skills, students do not gain the
interpersonal skills and collaboration taught in traditional programs—abilities
that are highly desirable to employers.
Yet another example of a successful training program is the new SEATech Skills
Center in Walla Walla. Opened in 2013, Walla Walla High School’s innovative
skills center was founded to prepare students for post-secondary education and
success in high-skill, high-demand careers. SEATech provides advanced career
and technical education programs based on rigorous academic standards in digital
media technology, health sciences, sustainable energy technology, and advanced
manufacturing technology. The Center acts as a launching pad for many young
students into highly successful academic and professional careers.
Unemployed Workforce
The next section of this report will examine labor shortages in ICT by occupation.
This section rounds out setting the stage for that analysis first, by profiling
unemployed ICT workers.
13 Interview with Janice Walker, Workforce Education Director at Whatcom Community College,
October 2014.

Washington State Information & February 2015 58
Communication Technology Cluster Study
According to an August 2014 report from Washington’s Employment Security
Department, Washington’s jobless rate was at its lowest since August of 2008. 14
The presence of companies like Microsoft, Amazon, and Boeing have helped
boost the wage level of new jobs replacing those that were lost during the
recession. The report cites high job growth from the professional, scientific and
technical sectors.
Exhibit 53 displays unemployment claims by ICT occupation for Washington
State in 2013 across all industries. Computer and information systems managers
had the most claims (702 claims), followed by computer user support specialists
(595 claims), and applications software developers. (543 claims).
Exhibit 53. Unemployment Claims by ICT Occupation: Washington State, 2013
Occupation Unemployment
Claims
Computer and Information Systems Managers 702
Computer User Support Specialists 595
Software Developers, Applications 543
Software Developers, Systems Software 361
Network and Computer Systems Administrators 306
Computer Systems Analysts 302
Computer Programmers 201
Computer Occupations, All Other 177
Computer Network Architects 134
Electrical Engineers 117
Computer Hardware Engineers 83
Database Administrators 80
Operations Research Analysts 70
Computer and Information Research Scientists 30
Total 3,700
Source: Community Attributes, 2014; Washington State Employment Security Department, 2013.
ICT In-Migration and H-1B Visas
People come to Washington- State from all over the U.S. and from all over the
world to pursue a career in Information & Communication Technology.
Washington’s ICT companies attract talent to the state and talent migrates to
Washington in order to participate in the cluster. Companies welcome out of
state talent because they want the best workers they can find to contribute to
their businesses. Top tier companies welcome out of state talent because they
have more openings in essential occupations than they can fill with local talent
(the subject of the section that follows this section).
14 Garrick, Coral, Job growth in state eclipsing go-go ‘90s; jobless rate falls. The Seattle Times:
http://seattletimes.com/html/businesstechnology/2024301101_unemploymentjulyxml.html

Washington State Information & February 2015 59
Communication Technology Cluster Study
One well-known source of workers for Washington’s ICT cluster includes
international workers on H-1B visas. H-1B visas are the single largest source of
foreign workers nationwide. U.S. Congress caps H-1B visas at 65,000 new visas
nationally per year; note that 6,500 of these are reserved for Chilean and
Singaporean nationals, per trade agreements with these countries. (H-1B visas are
not the only visa through which foreigners are able to work in the U.S. The TN
visa allows citizens of Canada and Mexico to work in the United States for
periods of up to one year.) The Department of Labor certified 23,124
applications in 2012. Exhibit 54 shows top certified H-1B visas by company.
Exhibit 54. Top Certified H-1B Visas Certified, by Company (IT
Occupations): Washington State, 2012
Company
Certified H-1B Visas
(IT Occupations)
% of
Total
Microsoft 2,020 29%
Infosys Limited 1,102 16%
Amazon 434 6%
HCL America 179 3%
Wipro Limited 150 2%
Deloitte 94 1%
Other Companies 3,092 44%
Total 7,071 100%
Source: Community Attributes, 2014; Myvisajobs.com report of certified H-1B Visas, 2014. IT
Occupations are not the same as, but are similar to, the list of ICT occupations included in this
study.
H-1B visas are initially granted for a duration of up to three years, but they can
be renewed for up to another three years. Another 20,000 of these visas for
foreign nationals with a master’s degree or higher are exempted from the cap, and
even more are exempted for those working in research facilities associated with
universities, non-profits, or the government. Demand for H-1B workers
fluctuates along with economic cycles. During times of high job growth (2007
and 2008) the cap was reached within one week. During the recession, it took
eight to nine months to reach the cap.15 In 2014, it took less than a week to hit
the cap.16
Exhibit 55 shows the number of certified H-1B visas in IT occupations in
Washington State, including new employment requests, renewals, amendments,
15 Brookings, “The Search for Skills: Demand for H-1B Immigrant Workers in U.S. Metropolitan
Areas”, July 18, 2012, available at http://www.brookings.edu/research/reports/2012/07/18-
h1b-visas-labor-immigration#overview. 16 Brookings, “H-1B Visa Cap Applications Show Need for Immigration Reform”, April 16, 2014,
available at http://www.brookings.edu/blogs/techtank/posts/2014/04/16-h1b-visa-
immigration-reform-west
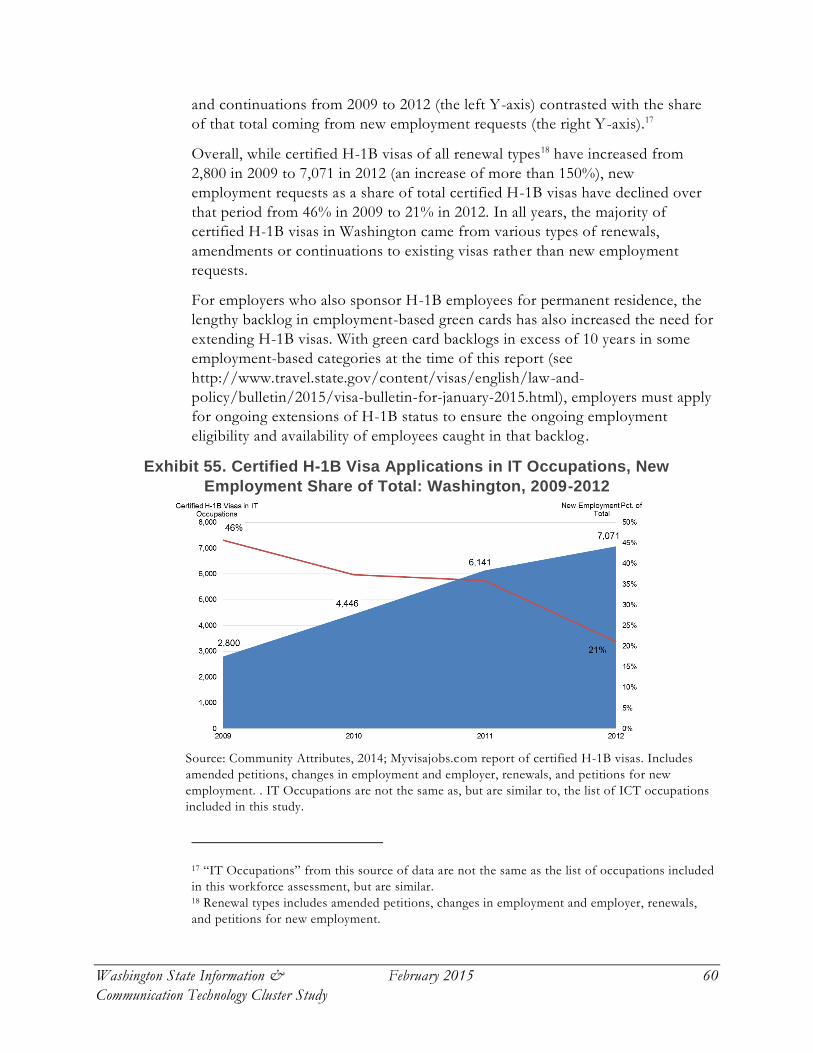
Washington State Information & February 2015 60
Communication Technology Cluster Study
and continuations from 2009 to 2012 (the left Y-axis) contrasted with the share
of that total coming from new employment requests (the right Y-axis).17
Overall, while certified H-1B visas of all renewal types18 have increased from
2,800 in 2009 to 7,071 in 2012 (an increase of more than 150%), new
employment requests as a share of total certified H-1B visas have declined over
that period from 46% in 2009 to 21% in 2012. In all years, the majority of
certified H-1B visas in Washington came from various types of renewals,
amendments or continuations to existing visas rather than new employment
requests.
For employers who also sponsor H-1B employees for permanent residence, the
lengthy backlog in employment-based green cards has also increased the need for
extending H-1B visas. With green card backlogs in excess of 10 years in some
employment-based categories at the time of this report (see
http://www.travel.state.gov/content/visas/english/law-and-
policy/bulletin/2015/visa-bulletin-for-january-2015.html), employers must apply
for ongoing extensions of H-1B status to ensure the ongoing employment
eligibility and availability of employees caught in that backlog.
Exhibit 55. Certified H-1B Visa Applications in IT Occupations, New
Employment Share of Total: Washington, 2009-2012
Source: Community Attributes, 2014; Myvisajobs.com report of certified H-1B visas. Includes
amended petitions, changes in employment and employer, renewals, and petitions for new
employment. . IT Occupations are not the same as, but are similar to, the list of ICT occupations
included in this study.
17 “IT Occupations” from this source of data are not the same as the list of occupations included
in this workforce assessment, but are similar. 18 Renewal types includes amended petitions, changes in employment and employer, renewals,
and petitions for new employment.

Washington State Information & February 2015 61
Communication Technology Cluster Study
Occupational Forecasts Workforce Supply Assessment
The occupational forecasts shown in the ICT Cluster Data Profile (Section 3)
can be compared to graduates of degree programs to understand labor shortages
or surpluses by occupation, as shown in Exhibit 56.
The greatest shortages are in Software Developers (2,009 per year, not including
unemployed), Programmers (433), Support Specialists (aka Help Desk) (396),
Systems Analysts (242) and Systems Administrators (200). The annual total
shortage of supply versus demand is in excess of 3,000 workers.
Note that occupations in this arena are in general not fungible; the surplus in one
occupation cannot typically serve the shortage in another without substantial
retraining. Exhibit 55 also illustrates the opportunity for the State to partner
with industry and community college leadership to invest in retraining the under
and unemployed to help solve part of the talent shortage faced by the industry.
For example, 396 unfilled jobs in the Computer User Support Specialist (aka
Help Desk) occupation might be filled by retraining some of the 595 unemployed
workers with prior experience in that field but whose technical skills are not
current.

Washington State Information & February 2015 62
Communication Technology Cluster Study
Exhibit 56. ICT Occupations Openings and Available Graduates and Unemployed,
Washington State, 2017 – 2022
Education SOC Code Occupation
Annual
Demand
(2017-22)
Supply
(2013
Graduates)
Gap (Surplus
or Shortage)
Additional
Supply (UI
Claims)
Gap with
Unemployed
Associates or 15-1151 Computer User Support Specialists 557 161 (396) 595 199
Some college 15-1152 Computer Network Support Specialists 176 354 178 0 178
Bachelor's * 15-1132 Software Developers, Applications 2,171 162 (2,009) 543 (1,466)
degree * 15-1131 Computer Programmers 863 430 (433) 201 (233)
15-1121 Computer Systems Analysts 614 372 (242) 302 60
11-3021 Computer and Information Systems Managers 414 639 225 702 927
* 15-1133 Software Developers, Systems Software 305 181 (124) 361 238
15-1134 Web Developers 358 641 283 0 283
15-1142 Network and Computer Systems Administrators 330 130 (200) 306 106
* 17-2071 Electrical Engineers 203 496 293 117 410
* 15-1143 Computer Network Architects 127 324 197 134 332
15-1199 Computer Occupations, All Other 193 161 (32) 177 145
15-1141 Database Administrators 109 221 112 80 192
15-1122 Information Security Analysts 79 393 314 0 314
15-2031 Operations Research Analysts 74 38 (36) 70 34
* 17-2061 Computer Hardware Engineers 65 17 (48) 83 35
Master's or Doctoral * 15-1111 Computer and Information Research Scientists 42 144 102 30 132
Source: Community Attributes Inc. (2014)
Note: * indicates Essential Occupations

Washington State Information & February 2015 63
Communication Technology Cluster Study
7. INDUSTRY PERSPECTIVES Community Attributes completed more than 25 telephone and in-person
interviews between May and November, 2014. Industry leaders and stakeholders
provided valuable insights, comments and suggestions in several critical areas of
inquiry. However, the findings and comments from the group are not exhaustive
of the diverse perspectives of the ICT cluster. Interviews yielded great insight and
opinion on what’s transpiring on the ground with start-ups, growing and midsize
companies, and mature ICT employers in Washington State.
Interviewees representing a variety of employers and company sizes lauded
Washington as a state attractive to ICT employers for reasons including
affordability and lower commute times when compared to the Bay area, mild
weather, access to recreation and outdoor activities, political progressivism, and
lack of a state income tax. According to interviewees, these assets translate into
real benefits for Washington’s ICT employers, who are better able to recruit and
retain a highly talented workforce and contribute to regional economic vitality. In
spite of a high quality of life to retain and recruit ICT workers here, high wages
and a steady growth rate in core ICT occupations, interviewees spoke to three
main hurdles to their industry in Washington State: the lack of an established
training pipeline that starts early in education, an unstable regulatory environment
in state and the disconnect between the total supply of ICT graduates and
workers in both technical and support occupations coupled with an acute need
for more qualified candidates in software programming and engineering
specifically.
Almost all participants were asked identical questions about assets and challenges
for the ICT cluster here in Washington State, the competitive environment for
ICT compared to peer cities and perceptions of what is needed to improve the
business climate.
In the following paragraphs, the qualitative analysis will focus in these three
common response categories:
Regional assets and challenges
Competitive environment (Seattle vs. Silicon Valley vs. all other).
Business climate challenges
Regional Assets and Challenges
Participants spoke at great length about the assets and resources available to ICT
companies in the region. Regardless of company size or the percentage of ICT
occupations within the company, interview participants frequently commented on
the following assets that have made the Seattle/King County and Washington
State market desirable for ICT workers and businesses:

Washington State Information & February 2015 64
Communication Technology Cluster Study
Affordability;
Lower commute times compared to the Bay Area;
Mild weather;
Recreation and healthy/outdoors activities;
Diversity/social tolerance; and
No state income tax.
Recruitment and retention strategies were dominant issues among almost
everyone interviewed for this project. The assets discussed above play crucial
roles in ICT businesses’ ability to attract and retain workers in the state. The
state’s assets above help ICT companies succeed at:
Recruit and retain a talented workforce;
Contribute to regional economic vitality; and
Maintain and grow the start-up culture in ICT.
ICT leaders said the assets column is overflowing with good news and perks that
workers understand. In fact, one company leader stated, “We tell people we’re
interviewing from out of state that if it doesn’t work out with us, they’ll find a job
in Seattle with someone else in no time. There are so many new tech companies
here. A 22-year-old can look around and see that tech in Seattle isn’t just
Microsoft anymore.”
The region’s major higher educational institutions are also perceived as assets to
fostering a healthy ICT cluster. Conversations relating to higher education mostly
revolved around the region’s two- and four-year programs with an emphasis on
degree programs, instructors and students at the University of Washington.
Company leaders emphasized the need for a pipeline linking high-ranking ICT-
related education programs to open internship slots as well as full-time positions.
Higher education leaders spoke about the value in having ICT workers on
campus to teach current undergraduate and graduate students.
A participant from DigiPen characterized their recent growth by saying, “We’ve
never seen more interest in our school or a higher number of applications.”
Other assets mentioned by multiple interviewees included:
University of Washington
Other four-year universities and specialized training programs like
DigiPen
Graduate ICT programs
Two-year undergraduate and certificate programs
Programs like WIN Reactor
Private sector college internship programs
A City of Seattle address

Washington State Information & February 2015 65
Communication Technology Cluster Study
Some interviewees mentioned the direct impact of ICT wages on the regional and
state economy. These participants were able to relate direct ICT wages and other
induced benefits to other businesses and industries, such as real estate and
consumer retail. One company leader said their average wage across all ICT
occupations exceeded six figures.
Finally, several assets identified linked the emergence and maturity of ICT
workers in Washington. Some common storylines appeared during this discussion.
Participants mentioned the following assets as continuing to drive innovation and
success in the tech industry:
Microsoft’s role in spawning leaders of new start-up companies
Explosive growth by Amazon
Seasoned dot-com entrepreneurs staying in the area through the
Recession, maintaining the region’s depth and industry knowledge
Other successful non-ICT retailers developing and deploying ICT
products and services, such as Nordstrom and Starbucks hiring software
developers.
Businesses view the ICT cluster as a “founder’s culture,” where engineers,
not MBA’s, are running tech companies
In discussing partnerships between private sector businesses and higher
education, the 2012 Amazon grant funding of two academic/research positions at
the University of Washington’s Computer Science Department was specifically
called out as an example of innovation that will ultimately create tangible assets
plus a sustainable ICT legacy here in Washington.
Each interview also allowed and encouraged participants to describe challenges
for the ICT cluster. In most cases, participants created two categories of ICT
workers (entry-level and seasoned managers/executives) and talked about the
significant challenges affecting each one. For ICT companies, the main challenges
connected to their entry-level ICT workforce were outlined in three areas,
including:
Roles & Responsibilities—a lack of clarity around who is coordinating
private sector employers and higher education institutions/ICT programs
Training/Content—coming to consensus on what entry-level workers in
various ICT occupations need to know
Pipeline Development—building an early (starting in high school) and
growing pipeline of ICT workers in high-demand occupations.
Internship programs in ICT were mentioned as a priority initiative. There are
formal internship programs for ICT students at UW, but not at WSU. Many
businesses understand the connection between summer interns and workforce
competitiveness. A large and productive internship program not only supports

Washington State Information & February 2015 66
Communication Technology Cluster Study
the interns and their learning, but it also reduces time spent hiring entry-level
workers who don’t know how the company works.
When the discussion turned to more seasoned ICT employees (i.e. those with
10+ years of experience), a unique set of barriers materialized to reveal new
insights, including:
Pipeline Development—working to ensure that more innovative ICT
companies grow and get started in Washington to retain talented workers.
One interviewee said, “Yes, we have a great quality of life for certain. But
it’s still a challenge to recruit and retain managers and above from the east
coast or sunny climates.” There is significant concern that talented
workers can be recruited to more sophisticated tech markets with a larger
pool of employers.
Training/Content—demonstrating the benefits to employers of
investing in training programs and using in-house trainers and mentors to
deliver content. One interviewee stated, “Engineers don't know what they
don't know about business. It’s important to find experienced
entrepreneurial mentors to help you build a team, describe how you build
culture.”
Making the Case for Worker Retraining—identifying which workers
need skill refreshers and what programs are best geared toward providing
targeted classes or certifications.
Finally, participants mentioned the challenges facing ICT business owners and
venture capitalists working in the ICT industry. The most notable barriers for
these populations included:
A relatively small, inexperienced field, with specific mention of the
small number of seasoned ICT CEOs, and VP-level employees. The
cluster is dominated by a few companies resulting in a smaller pond with
less mobility.
An unstable and uncertain regulatory environment , creating
“armchair investors” and risk-averse VC leaders in ICT.
An expensive market for entry-level labor, making it unreasonable for
some entrepreneurs to start or scale up their business. One participant
noted, “It still costs a lot of money to scale up. We need more investors
who are focused on ‘the middle,’ companies who have their Series B
funding but aren’t going to flip to Google. ” Another said, “In the last
start-up I was in, we hired a programmer from Indiana because we
couldn’t afford developer talent here without making them a major
stakeholder in the company, or unless they were “retiring” from
Microsoft.
Access to funding events also present a challenge. One interviewee
mentioned, “Here you have one event a week or month but in the Valley

Washington State Information & February 2015 67
Communication Technology Cluster Study
there’s five a day. At any given time there’s a place to meet and come up
with synergies.”
In Exhibit 57, some of the common themes (i.e. education, the ICT Market in
Washington (micro level) and the ICT Market (macro level) are displayed.
Exhibit 57. Summary of Perceived Barriers to Growth within ICT
Entry-level ICT Employees
Seasoned ICT employees
ICT entrepreneurs/ funders
Education/Training/ Skills
STEM training and other K-12 programs aren’t creating enough of a pipeline No consensus what role two- and four-year colleges should play educating entry-level ICT workers The University of Washington alone can’t supply the existing and projected need Universities and colleges can and should be doing more to recruit women into ICT programs
Need more in-house programs and employers who will develop and coach their emerging ICT workforce Skills need to be constantly refined to avoid the skills gap. What is the role of two- and four-year colleges in worker retraining?
N/A
ICT in Washington (micro level)
Entry-level skills are becoming increasingly disparate and complex. Expectations are changing
Not many ICT companies in Washington State.
Small companies limit their risk-taking because of expensive taxes, like Washington’s B&O burden Most ICT executives in Washington have not experienced the entire funding loop, so the number of experienced CEOs is small Perception that Seattle has more armchair investors here versus Silicon Valley where people are rolling the dice

Washington State Information & February 2015 68
Communication Technology Cluster Study
and taking risks
ICT Market (macro level)
Perception is that demand is still outpacing supply. Need more homegrown Computer Science majors graduating from 4-year colleges. Employers in “producer” segment (Amazon) need different skills than employers in “consumer/retail” segment.
Strong competition for experienced workers in ICT, especially software engineers and leaders at the VP level Perception that ICT workers from Silicon Valley are more talented or more innovative
Compared to other tech hubs, there aren’t many venture capital companies in Washington and the total VC investment per year is less now than it was 10 years ago Very dynamic marketplace. Recent grads are changing jobs every two to three years It’s difficult to hire intelligently and be able to afford it. This benefits the employee, but is a burden on employers Impression that there are few federal or state incentives for ICT companies
Sources: Community Attributes, 2014.
Competitive Environment
Interviewees made numerous asset comparisons with Silicon Valley, including
affordability, diversity, start-up culture, talent pool, and the availability of capital.
Other peer markets mentioned, although less commonly, include Austin, Boston,
New York, Singapore, Toronto, and Vancouver, BC. In the last three years,
Portland has benefitted from ICT company growth as well.
Compared to Silicon Valley, the ICT market in Seattle was consistently described
as more stable in that workers don’t hop between occupations as often and
stronger in engineering. However, it’s hard to find the right candidates, especially
in software programming.
Silicon Valley is perceived as having a stronger bench of sales, marketing and
business development talent. Some interviewees also mentioned that companies
in Silicon Valley are clearer about their role and vision. This is possibly because
of the larger and higher quality marketing and communications workforce in ICT

Washington State Information & February 2015 69
Communication Technology Cluster Study
specifically. One interviewee said, “Business in the Bay Area are coached from
Day 1 how to talk about their businesses, how to write about their business plans
and how to talk about ICT more broadly. Here in Seattle, that doesn’t happen or
else the CEO’s aren’t paying attention to that kind of guidance and coaching.”
Competitiveness was also put in the context of what Seattle and peer markets do
to create an ecosystem for ICT to thrive even in non-ICT businesses. Multiple
participants said how ICT and innovation was perceived to flourish in richly
diverse economies. When a market like Silicon Valley is a US market leader in
financial services or consumer packaged goods, ICT businesses grow and healthy
innovation continues. In comparison to “mature” Silicon Valley, the Seattle area
and Washington State in general was routinely described as “new” “young” or
“scrappy.”
On the other hand, Washington’s “youth” and “scrappy” culture has been
effective producing ICT start-ups that are caused by “creative disruption.”
Creative disruption was described as what happens when the stock price at a
legacy ICT company like Microsoft or Real Networks drops over a period of time.
The stock decline gives entrepreneurs room to consider other alternatives and
“what if” scenarios. As a result of this recurring pattern, dozens of start-ups have
found their footing and continue to grow or they are successfully acquired.
Business Climate Challenges
Interviewees offered policy ideas and suggestions to drive innovation and new
opportunities in the ICT cluster. Feedback topics included transportation
infrastructure, tax incentive programs and other effective policy issues that aid
companies in their decision to grow in Washington or prioritize other states .
Questions in this series also produced a “wants and needs” list from many
companies. Here are some of the most important insights about what solutions
are needed to improve Washington’s business climate for ICT.
Many companies repeated variations on this theme, “Washington boasts
great quality of life, but at the end of the day, we make our decisions
about where to grow based on availability of workforce, business climate
(tax policy and land use policies) and infrastructure.”
o High energy costs could prevent data centers from relocating to or
expanding into Washington
o B&O taxes are onerous for small companies
State leaders are not well-versed in the start-up story because there is little
presence in Olympia among small and mid-size ICT companies. ICT
companies are not heavily regulated like other industries, so they don’t
spend money on lobbyists to develop a common messaging platform. As
a result, ICT company workers feel that “Washington doesn’t do anything
for ICT; compared to what they did to keep Boeing in the state.” ICT
leaders say it’s a cycle of “benign neglect.”

Washington State Information & February 2015 70
Communication Technology Cluster Study
Regional transportation infrastructure and transit continues to bring challenges.
ICT companies can’t grow if reliable utility infrastructure isn’t available; this is
especially true and concerning to companies in suburban and rural areas where
outages are more common and there are fewer utility substations.
One interviewee mentioned fighting non-compete enforcement as it would result
in a spike in entrepreneurialism. For small companies, the threat of legal action is
enough to shoot down new ideas, stifling innovation.
Workforce Insights from Employers
Companies and local and state governments anticipate shortfalls of competitive
labor in ICT due to a variety of factors, including rapid product innovations that
require evolving skill sets; a more complex, technical environment; an aging
workforce; offshore outsourcing; and newly emerging industries. Companies
interviewed for this study confirm that demand for software engineers and
programmers exceeds the ESD demand figure of 2,485 (both Software Developer
categories added together). A search on Indeed.com for the keyword “software
developer” in Washington State returns 3,214 jobs alone. A key take -away is that
the combined total of annual CS degrees from UW and WSU equals
approximately 10 percent of the ESD forecasted demand for Computer
Programmers and Software Developers.
The 1-on-1 interview element of this study was designed to understand hiring
concerns from employers’ perspectives. In completing nearly 30 interviews,
targeting a wide range of employers, there was an opportunity to learn more from
ICT employers about Washington’s start-up ecosystem, trends in ICT innovation
and hiring. Most of the interviews were completed between July and September,
2014 but a handful of employers were interviewed in November to specifically
respond to projections of supply and demand in ICT.
Employers were asked to comment and provide insights into their experience
recruiting ICT workers in Washington. The most common themes and labor
outlook comments are as follow:
Top priority ICT occupations are software developers and software
engineers
Employers prefer to hire qualified ICT workers from in-state; priority
hard-to-fill positions in ICT often open up to out-of-state candidates by
necessity
Training and skills of new graduates often are not a match for current
ICT positions
Too many 2 and 4-year schools teach curricula that is not a match for
current ICT positions which creates an overreliance on graduates from
UW

Washington State Information & February 2015 71
Communication Technology Cluster Study
Too many experienced ICT workers are not a match for current ICT
positions if they have outdated skillsets or have not worked in a start-up
environment
Washington’s pool of ICT workers may not be a match for non-ICT firms
that are growing quickly, hiring from scratch and learning “as they go”
what skills and educational background will be a good fit
The priority occupations at most of the companies interviewed for this project
include core ICT occupations such as software engineers and java developers
where there is a projected gap between supply and demand. Many interviewees
said, “Even though we’re an engineering town and that’s our niche, it’s getting
more difficult every year.” Other ‘difficult-to-hire’ occupations here are user
design/interface, product managers and marketing. Leadership positions
(manager and above) are also challenging to hire for; this will be explained further
in the paragraphs below.
In reviewing the supply of new graduates in ICT, many employers that recruit in -
state were critical of students’ lack of applied knowledge in their fields. It was
common to hear, “It’s not my choice to recruit out of state, but I can’t find
enough CS grads here.” Another ICT employer said, “The biggest challenge is
that students aren’t coming out of universities with applied knowledge. They
might have a great academic record, but they can’t solve business problems. The
robotics graduates are probably the best in this area, but other graduates
definitely need our “boot camp. As a result of what we’re seeing, there is a lot of
conversation internally about training our interns in this way from the get-go.”
Employers also want to see a stronger K-12 foundation for ICT occupations. In
response, one of DigiPen’s priority initiatives is to start a private K -12 program
specifically focused on STEM fields.
Many employers are beginning to realize that partnerships with higher education
are critical to a strong and well-trained pipeline of ICT workers and admit to
needing a sharper focus on more resources in establishing formal internship
programs with schools besides UW. Large ICT employers and smaller start-ups
were alike in this. One large ICT company is exploring a certification program
with schools in eastern Washington and Western Washington University in an
attempt to assure that graduates from these smaller schools are teaching the skills
that are important to them. Another ICT company said their intern class of six
for 2013-2014 was larger than in any previous year. In general though, many
small ICT companies don’t partner with universities at all and use personal
referrals, LinkedIn and third-party recruiters to identify qualified workers. It was
also common for smaller ICT companies to “treat every search as a national
search” to expand the field of qualified candidates. Hiring for software
developers is further challenged if the company is headquartered outside the
Puget Sound region or even on the Eastside outside of Seattle. One employer in
Eastern Washington told us, “On average, takes six months to place engineers.
Washington State Information & February 2015 72
Communication Technology Cluster Study
It’s already a challenge to hire just a couple of them. So while volume of
interested candidates is low, if we wait long enough, we’ll come across a high
quality candidate with strong desire to be in our area but we really have to play a
waiting game. And in some cases, we can't take on as much work as we want to.”
Employers can calculate the impact and consequences when UW awards 250
Computer Science degrees each year, out of more than 4,300 total degrees that
are suitable for ICT. In short, employers say it’s the UW graduates that are in
short supply, and most of the other institutions’ graduates are not deemed
competitive with out of state applicants. Employers are also aware that smaller
class sizes in ICT are desirable and encourage collaborative problem solving and
enable better teaching in topics such as business analytics. There was consensus
that this learning environment makes a candidate more qualified for technical and
support positions right out of an undergraduate programs, therefore, a solution
to limited capacity is not simply to increase class sizes. Finally, employers
acknowledge the dilemma of shrinking state funding for public institutions. Less
funding or fewer instructors might mean students aren’t trained in multiple
programming languages. One ICT employer said, “Most of our open positions
require a Bachelor’s degree and we need developers that code in C or C++.
Unfortunately, that’s not a focus anymore at UW, so then we have to hire from
other colleges.” The bottom line: employers and educators agree that in order to
train more young workers and expand the pool of qualified candidates,
internships and direct partnerships that bring together employers and competitive
colleges and universities to develop theoretical and applied curriculum are a
growing priority.
Some employers are not certain the existing supply of experienced ICT workers is
a fit for their open positions because some experienced ICT workers haven’t
updated their skills or completed new training. Educators are also aware of this
challenge, “The reality is that skills age very fast.” Other experienced candidates
might have the right skills background but they don’t apply or don’t want a
leadership role. There were also multiple mentions of slow-churn among
experienced workers in ICT. People said, “Talent is also very loyal here…people
don’t just jump if a company is in a bit of trouble which means the most valuable
candidates are going to have to be convinced they need to change jobs. This takes
time, patience and resources.”
Another perspective on the supply of experienced workers is that not many
candidates have been through multiple start-up experiences. Several companies
stressed the appeal and importance of start-up experience and are frustrated with
the limited experience among Seattle candidates even if the candidate’s academic
credentials or other experience is a match. One person explained, “At our small
start-up, deep ecosystem support is a problem, and what I mean is there’s not a
huge pool of experienced start-up mentors in the Seattle area who have been
there from top to bottom.”

Washington State Information & February 2015 73
Communication Technology Cluster Study
Non-ICT firms like Nordstrom and Starbucks, were also invited to comment on
their recruiting practices and experiences hiring ICT workers because this subset
of companies in Washington provides such an interesting comparison to demand
within traditional ICT companies. One company explained some of their present
hiring challenges in ICT this way, “Recruiting is hard because we need to
bootstrap this, and because we have not traditionally been hiring ICT workers
from Washington. We don’t have the network of people here yet to hire within
and yet we don’t have all the pieces in place because recruiting technologists is so
new for us.”
8. CONCLUSIONS Washington State’s ICT Cluster consists of companies devoted to innovation and
advancing the State’s competitive advantages in ICT, as well as ICT professionals
and innovators that span all industries in Washington, including Aerospace, Retail
and all others. The ICT cluster provides 238,900 jobs, including many very high
wage jobs and also well-paying jobs accessible to workers with a broad range of
skills. Labor income statewide associated with ICT summed to nearly $61.4
billion for 2013, while ICT-supported revenues summed to $187.2 billion. The
industry continues to grow and forecasts suggest adding 6,680 annual jobs
between 2017 and 2022.
The state’s entrepreneurial efforts are well supported by early stage investments.
Challenges exist to match latter stage funding efforts with local funders, but both
related sectors want to find more opportunities to foster successful start-ups in
Washington.
Labor shortages exist primarily in top-tier talent at the State’s leading ICT
companies. The University of Washington is perceived as the only institute in the
State graduating significant numbers of students ready to contribute in software
engineering and programming positions at the leading ICT companies based in
Washington. Future needs and plans address expanding capacity at the University
of Washington and improving the quality of other Washington state colleges and
universities.

Washington State Information & February 2015 74
Communication Technology Cluster Study
APPENDIX A. WORKFORCE ASSESSMENT METHODS
Supply Calculations
The workforce assessment calculates the supply for two cohorts: unemployed
workers and recently trained candidates such as college graduates. Combining
these two data sources for the overall supply calculation provides a more
comprehensive snapshot of qualified candidates based on both educational
attainment and previous work experience.
This study assumes that unemployed workers are eligible and qualified for
positions they previously held and are as competitive in the marketplace as
recently trained candidates. This may not always be the case; however. Rather
than attempting to estimate relative competitiveness, the study clearly
distinguishes the two sources of supply in associated exhibits for easy reference.
Industry experts can determine whether the unemployed are comparably
competitive to trained candidates for particular occupations in each sector.
Unemployed Workers
The analysis estimates supply of unemployed workers based on a monthly
average of continued unemployment insurance claimants for 2013. Claims data
are reported each month at the same time of month by occupation title, and then
averaged for the year to reduce variation in claims resulting from seasonality.
Data for unemployment claimants categorizes workers by previous occupation
using the BLS Standard Occupational Classification Codes (SOC).
Trained Candidates
Trained candidates include college graduates and other individuals that completed
post-secondary training at Washington higher education institutions in the year
2011-2012. Estimates of trained candidates are based on completions data
published by National Center for Education Statistics (NCES) IPEDS, which
identifies the number of students that complete specific instructional programs at
various award levels (such as post-secondary certificate, Bachelor’s or master’s
degree) at each Washington higher education institution. Data of completions
comes by program major (Classification of Instructional Programs, or CIP). For
each instructional program, NCES identifies relevant occupations that trained
candidates may be eligible to fill, which allows the model to translate candidates
by CIP into those eligible by occupation.

Washington State Information & February 2015 75
Communication Technology Cluster Study
APPENDIX B. ECONOMIC IMPACT ANALYSIS The primary tool for estimating the broader impacts of the ICT cluster in
Washington State was the Washington State Input-Output (I-O) Model for year
2007, published in 2012. The model provides a data-rich rendering of the state
economy across 52 sectors. The transactions table, which underpins the I-O
model, provides estimates of intermediate purchases, sales, and final demand
across all modeled sectors. The complex analysis of the model, published online
by the Washington State Office of Financial Management, allows analysts to
model the impacts of economic activities when output, labor, wages, and first
round direct purchases/requirements are known.
In order to apply the input-output model for multiple years of analysis, implicit
price deflators were used to adjust previous year totals to 2013 (the most recent
modeling year). Direct requirements for ICT were estimated by applying the
calculated shares of purchases for ICT by sector to each year of output, derived
from the 2007 transactions table.
As discussed above, the economic impacts of ICT in Washington include direct,
indirect, and induced effects, the total impact being the sum of these impacts.
Analysis begins with a transactions table, constructed from multiple data sources
by Beyers and Lin (2012). This table captures all transactions between and within
industries and final demand, the latter including personal consumption
expenditures (i.e., household consumption), domestic and foreign exports,
investment, and federal, state, and local expenditures. Total output in an
economy is thus the sum of inter- and intra-industry purchases, also referred to
as intermediate transactions, and final demand. The input-output transactions
table is governed by an important accounting identity requiring that all purchases
in an economy must equal all output. Within the transactions matrix, the sum of
each column represents all purchases by an industry or source of demand, and
will equal the amount sales and output by that activity.
For example, in the latest transactions table, the input-output sector “Software
Publishing and Internet Service Providers” in 2007 purchased nearly $5.3 billion
in non-labor inputs from other industries in Washington. Added to this, the
sector paid $9.7 billion in wage and salary outlays (including non-wage benefits),
plus $8.3 billion in other value added activities (e.g., profits, dividend payments)
and $10.1 billion in imported (domestic and foreign) inputs; these amounts total
$33.4 billion, exactly equal to total sales, or output, by the aerospace industry in
Washington (Exhibit A1).

Washington State Information & February 2015 76
Communication Technology Cluster Study
Exhibit A1 Example of Input-Output Transactions Table
Software Publishers
& Internet Service
Providers
Intermediate
Sales
Personal
Consumption
Expenditures
Private
Investment
Government
Expenditures Exports
Total Final
Demand
Total
Output
…
Software Publishers
& Internet Service
Providers … 306.3 … 2,698.2 434.2 82.6 1,474.9 28,663.0 30,654.6 33,352.8
…
Total Intermediate
Purchases 5,289.3
Labor Income 9,658.2
Other Value Added 8,289.7
Imports 10,115.7
Total Purchases 33,352.9
Sources: Washington State Office of Financial Management, 2012; Community Attributes Inc.,
2013.
The columns of a transactions table thus represent production functions for each
modeled industry. Direct requirements coefficients, also referred to as technical
coefficients, are the share of total purchases for each input. For example, in 2007,
according to 2012 Washington Input-Output Model, the Software Publishing and
Internet Service Providers industries in Washington purchased $240.4 million in
goods and services from the industry category “Architectural and Engineering
/Computer Systems Design and Related Services,” translating into a direct
requirements coefficient of 0.0072, or 0.72% of all purchases made by Software
Publishing and Internet Service Providers based in Washington State ($240.4
million / $33.4 billion).
Once a matrix of direct requirements is calculated, a series of equations are used
to relate changes in demand in one sector of the economy to changes in gross
output to across the entire economy. Inter-industry transactions, denoted “O,” is
equal to a vector X of gross output per industry multiplied by the matrix of direct
requirements, denoted “A.”
(1) O = AX
The vector of gross output per industry, X, is the sum of inter-industry output
(transactions) and final demand. In the above example, $41.7 billion in total
output in aerospace is equal to $842.8 million in inter-industry sales plus $40.8
billion in final demand.
(2) X = O + D
Combining equations (1) and (2) results in industry gross output equaling the sum
of industry output multiplied by direct requirements plus final demand:
(3) X = AX + D
Rearranging this equation:

Washington State Information & February 2015 77
Communication Technology Cluster Study
(4) D = (1-A)X, and
(5) X = D(1-A)-1, the (1-A)-1 inverse matrix referred to as the “Leontief Inverse.”
Finally, input-output modeling is primarily used to assess economy-wide changes
given a change in one or more activities, resulting in equation (6):
(6) X = (1-A)-1 D
Fiscal Impacts of ICT
ICT fiscal impacts of ICT firms and tech units were estimated through the use of
what are referred to as effective tax rates. Effective rates represent total direct tax
payments against reported gross business income (GBI) per industry sector,
based on the North American Industry Classification System (NAICS).
The first step is to estimate the output supported through indirect and induced
effects by the ICT cluster. Next, these output totals are adjusted to GBI based on
historic ratios of GBI/output per sector as estimated in the 2007 Washington
State Input-Output Model transactions table. After secondary GBI estimates are
completed, the calculated effective tax rates per tax type and industry are applied
to arrive at additional tax revenues supported by the ICT cluster statewide
through indirect and induced mechanisms.

Washington State Information & February 2015 78
Communication Technology Cluster Study
APPENDIX C. LIST OF EMPLOYERS AND INSTITUTIONS INTERVIEWED Amazon.com
AT&T
Big Fish Games
DigiPen
Expedia
F5 Networks
Founders Co-Op
Glympse
Impinj
Isilon Systems
Madrona Capital
Microsoft
WIN Reactor Entrepreneurs
Nordstrom
Open Eye
PNNL
State of Washington Board
of Community and Technical
Colleges
Tableau
Trace Register
University of Washington
Usermind
Valve
Verizon Wireless
Whatcom Community
College
Washington State University
Zulily