water footprint of electric power generation - mit carbon capture
TRANSCRIPT

Water Footprint of Electric Power Generation: Modeling its use and analyzing options for a water-scarce future
by
Anna Delgado Martín
B.Eng. Industrial Engineering (2006), M.Eng. Industrial Engineering (2010) Universitat Politècnica de Catalunya
Submitted to the Engineering Systems Division in Partial Fulfillment of the Requirements for the Degree of
MASTER OF SCIENCE IN TECHNOLOGY AND POLICY
at the
MASSACHUSETTS INSTITUTE OF TECHNOLOGY
June 2012
©2012 Massachusetts Institute of Technology. All rights reserved.
Signature of Author: ___________________________________________________________________
Technology and Policy Program, Engineering Systems Division May 11, 2012
Certified by: __________________________________________________________________________
Howard J. Herzog Senior Research Engineer, MIT Energy Initiative
Thesis Supervisor Accepted by:__________________________________________________________________________
Joel P. Clark Professor of Materials Systems and Engineering Systems
Acting Director, Technology & Policy Program

2

3
Water Footprint of Electric Power Generation: Modeling its use and analyzing options for a water-scarce future
by
Anna Delgado Martín
Submitted to the Engineering Systems Division on May 11, 2012 in Partial Fulfillment of the Requirements for the Degree of
Master of Science in Technology and Policy
Abstract The interdependency between water and energy, sometimes called the water-energy nexus, is growing in importance as demand for both water and energy increases. Energy is required for water treatment and supply, while virtually all processes for energy production require significant amounts of water. The water and energy nexus is a multifaceted issue. This thesis focuses on the water footprint of electricity generation, specifically on the water use at thermal power plants.
Thermal power plants produce around 70% of the electricity in the US. These power plants require large quantities of water, primarily used for cooling. In the US, the thermoelectric power generation sector accounts for 40% of the total fresh water withdrawals every year. This has an impact both on the aquatic organisms and on the water resources of the region where the power plant is situated. In addition, water is becoming a scarce resource in many regions of the US, and the situation could worsen in the upcoming years. Therefore, it is important to understand the water footprint of the different electricity generation technologies in order to incorporate the information into the decision-making process and to choose the best options. Unfortunately, there is not a clear, generic model to estimate water use in power plants. Existing methods rely on data from direct surveys of power plant operators, which are often unreliable and incomplete, or from very detailed and plant specific models.
This thesis offers a new framework to estimate the water use in power plants using a simple, generic model and focusing on the heat balance of the power plant. The model is used as a common analytical framework to evaluate the water requirements of different types of electricity generating power plants. The model is also used to identify the main drivers on water use in power plants and to explore the possible alternatives to mitigate water use by the power sector in the future. Since regulations and not price signals are usually the drivers of water-related power plant decisions, the presented model will also be very useful in policy analysis and policy decision making processes.
Thesis Supervisor: Howard J. Herzog, Senior Research Engineer, MIT Energy Initiative

4

5
Acknowledgements
These two years at MIT have been an amazing and very rewarding experience. I am very thankful for having been surrounded by exceptional people that have helped and supported me through this journey.
First, I would like to thank my advisor, Howard Herzog, for his invaluable insight, guidance and support during my time at MIT. Without his expertise and knowledge, I could have never learnt in this time what I know now about power plants. I am also very grateful for the opportunity to work with the talented ESC-MIT team, from whom I have learnt so much. Special thanks to Ahmed Ghoniem and Frank O’Sullivan for their support and advice, and to Michael Rutberg, for being a great research partner and for all his help. I also wanted to thank BP for funding and making this research possible as part of the Energy Sustainability Challenge and to Eskom, for providing a tremendously useful dataset.
I am very happy to have been part of Herzog’s Research Group and the MIT Energy Initiative. It has been a pleasure to work with such fantastic people. They have become not only my research colleagues but also some of my best friends here at MIT. Special thanks to Rob, for his patience and for always being willing to help us, and to Amanda, for her kindness and willingness to brighten our days. I am extremely grateful to Mary Gallagher for being such a nice an amazing person and for all her help and advice.
TPP has been a great program to be in. It has been amazing to meet people from all around the world and from many different backgrounds. This is what makes TPP unique. I have learnt so much during these years and not only from the classes, but also from my classmates. I wanted to thank the whole TPP family for making these 2 years so special. I will never forget all the moments that we have shared together. Special thanks to my great flat-mates Sarah, Toni and Mark and my ex-flat-mate Fernando, which have made this whole experience even better.
I am also honored of being part of the eLuma team: Mauricio, Zahraa, Emily, Tori, Laila and Paul. I can’t believe everything that we have achieved in these 2 years with very hard work and passion. MIT wouldn’t have been the same without you. Thank you for everything. Many thanks to everyone that has helped us and support us on the way.
I also wanted to thank Paul. I would have never gotten this far without you. Thank you for all your help and support, and for believing in me even if when I don’t. You are an inspiration for me.
Finally, I want to thank my parents, my brother and my grandparents. Without their love and support I would never be the person I am today. I can’t really express how much I admire you and thank you for all you have done for me. Thank you for believing in me and for doing the impossible to help me achieve my dreams. Gràcies.

6

7
Table of Contents
LIST OF FIGURES .................................................................................................................................................... 9
LIST OF TABLES ................................................................................................................................................... 11
1 INTRODUCTION ............................................................................................................................................ 13
2 BACKGROUND ............................................................................................................................................... 15 2.1 INTRODUCTION: THE WATER AND ENERGY NEXUS ............................................................................................ 15 2.2 THE BIG PICTURE: WATER FOR ELECTRICITY GENERATION ............................................................................... 17 2.3 THE BIG PICTURE: REGIONAL VARIATION IN THE WATER-ENERGY NEXUS ...................................................... 18 2.4 KEY CONCEPTS ........................................................................................................................................................... 21
2.4.1 Consumption vs. withdrawal ........................................................................................................................... 21 2.4.2 Cooling Systems ..................................................................................................................................................... 23
2.5 OVERVIEW OF AVAILABLE DATA SOURCES – LITERATURE REVIEW ................................................................. 28
3 A MODEL OF WATER OF WATER USE FOR THERMAL POWER PLANTS ................................... 33 3.1 INTRODUCTION TO THERMAL POWER PLANTS .................................................................................................... 33 3.2 HEAT RATE VS. WATER USE ..................................................................................................................................... 34 3.3 FORMULATION OF THE MODEL .................................................................................................................................... 35 3.4 TYPICAL MODEL PARAMETERS VALUES BY TECHNOLOGY ................................................................................... 45
4 WATER REQUIREMENTS BY GENERATION TECHNOLOGY: DETAILS ........................................ 47 4.1 FOSSIL FUEL POWER PLANTS: ................................................................................................................................ 47
4.1.1 Pulverized coal ....................................................................................................................................................... 47 4.1.2 Natural gas combined cycle ............................................................................................................................. 52 4.1.3 Integrated gasification combined cycle...................................................................................................... 55 4.1.4 Carbon capture and sequestration ............................................................................................................... 57
4.2 NUCLEAR................................................................................................................................................................ ....... 65 4.3 SOLAR THERMAL ........................................................................................................................................................ 67 4.4 GEOTHERMAL ............................................................................................................................................................... 68
5 MODEL VALIDATION AND LIMITATIONS ............................................................................................ 71 5.1 LIMITATIONS OF THE MODEL ................................................................................................................................... 71 5.2 VALIDATION OF THE MODEL .................................................................................................................................... 72
6 ALTERNATIVES TO REDUCE FRESHWATER USE IN POWER PLANTS ........................................ 75 6.1 INTRODUCTION .......................................................................................................................................................... 75 6.2 ALTERNATIVE COOLING SYSTEMS .......................................................................................................................... 76
6.2.1 Dry Cooling............................................................................................................................................................... 77 6.2.2 Hybrid cooling ........................................................................................................................................................ 81
6.3 ALTERNATIVES TO REUSE WASTE HEAT IN POWER PLANTS ............................................................................... 82 6.3.1 Combined Heat and Power Plants ................................................................................................................. 82 6.3.2 Combined Power and Desalination Plants ................................................................................................ 83

8
6.4 REDUCING WATER USED IN OTHER POWER PLANT PROCESSES (C) .................................................................. 84 6.5 ALTERNATIVE WATER SOURCES ............................................................................................................................ 85
6.5.1 Municipal Wastewater (Publicly Owned Treatment Works – POTW) ......................................... 85 6.5.2 Mine-Pool Water ................................................................................................................................................... 87 6.5.3 Produced Waters from Oil and Gas Wells .................................................................................................. 88 6.5.4 Saline Aquifers ........................................................................................................................................................ 89 6.5.5 Seawater ................................................................................................................................................................... 91
6.6 SUMMARY ................................................................................................................................................................ .... 92
7 IMPACT OF EXISTING AND FUTURE WATER REGULATIONS ON THE POWER SECTOR ...... 93 7.1 INTRODUCTION .......................................................................................................................................................... 93 7.2 THE CLEAN WATER ACT AND THE NATIONAL POLLUTION DISCHARGE ELIMINATION SYSTEM PERMIT
PROGRAM ................................................................................................................................................................................ 94 7.2.1 Clean Water Act §304. Effluent Guidelines ............................................................................................... 95 7.2.2 Clean Water Act §316 ......................................................................................................................................... 97
7.3 SAFE DRINKING WATER ACT ............................................................................................................................... 103 7.4 SUMMARY ................................................................................................................................................................ . 104
8 KEY FINDINGS AND DISCUSSION .......................................................................................................... 105
NOMENCLATURE AND ACRONYMS ............................................................................................................. 111
REFERENCES ....................................................................................................................................................... 113

9
List of Figures ______________________________________________________________________________
Figure 2-1. Water Energy Nexus ................................................................................................................................ 15
Figure 2-2. Hydropower plants vs thermo electric power plants ................................................................................. 17
Figure 2-3: a) US Water availability; b) US Population growth 2000-2010 .............................................................. 19
Figure 2-4: Existing fossil fuel power plants in the US ............................................................................................... 19
Figure 2-5: US freshwater withdrawals and consumption .......................................................................................... 22
Figure 2-6: Diagram of once-through cooling system ................................................................................................. 23
Figure 2-7: Diagram of wet cooling tower (mechanical draft) .................................................................................... 24
Figure 2-8. Picture of a natural draft cooling tower ..................................................................................................... 25
Figure 2-9: Diagram of a cooling pond system ........................................................................................................... 25
Figure 2-10. Diagram of dry cooling and aerial view of a dry cooling system............................................................ 27
Figure 2-11. Types of Cooling Systems and water withdrawal in the US ................................................................... 28
Figure 2-12. Water consumption factors for electricity generating technologies ....................................................... 31
Figure 3-1: Net Electricity Generation in the US by Energy Source, 2010 ................................................................ 33
Figure 3-2. Simple visualization of Thermal Efficiency.............................................................................................. 34
Figure 3-3: Pulverized Coal Water Withdrawn w/ Wet Cooling Towers ................................................................... 35
Figure 3-4: Water Withdrawn w/ Wet Cooling Towers .............................................................................................. 35
Figure 3-5: Simplified Visualization of Heat Balance of a Power Plant .................................................................... 36
Figure 3-6. Visualization of inputs and outputs of the model ...................................................................................... 37
Figure 3-7: Heat Lost through the Flue Gas ............................................................................................................... 39
Figure 3-8. Diagram of the Steam Cycle ..................................................................................................................... 43
Figure 3-9: Example of Water Balance. Pulverized Coal Power Plant ........................................................................ 44
Figure 4-1: World Coal Consumption by Region ....................................................................................................... 47
Figure 4-2: Schematic for PC Power Plant with cooling tower and wet FGD ............................................................ 48
Figure 4-3: Heat Balance Diagram of a typical Super Critical PC Power Plant with an efficiency of 36.8% ............ 49
Figure 4-4: FGD Diagram and Flue gas exhaust Temperature with FGD Systems .................................................... 50
Figure 4-5: Total Heat lost through the Flue Gas in PC power plants with and without FGD .................................... 50
Figure 4-6: Pulverized Coal Water Withdrawn w/Cooling Towers ............................................................................ 51
Figure 4-7: Additions to U.S. generating capacity by fuel type in five cases, 2009-2035 (GW)................................. 53
Figure 4-8: Schematic for an NGCC Power Plant with cooling tower ....................................................................... 53

10
Figure 4-9: Heat Balance Diagram of a typical NGCC Power Plant with an efficiency of 50.2 % ............................ 54
Figure 4-10: Schematic for an IGCC Power Plant with cooling tower ....................................................................... 55
Figure 4-11: Heat Balance Diagram of a typical IGCC Power Plant with an efficiency of 39% ............................... 56
Figure 4-12: Comparison of Heat Rates (HHV) with and without CC. ....................................................................... 58
Figure 4-13: Heat Balance Diagram of different power plants with ........................................................................... 60
Figure 4-14: Typical Econamine FG+ Carbon Capture Process. ................................................................................ 61
Figure 4-15: Total Heat lost through the Flue Gas in IGCC power plants with and without CCS .............................. 62
Figure 4-16: Absolute increase in water consumption for a retrofitted PC Power Plant ............................................ 64
Figure 4-17: Schematic for a Nuclear Power Plant with cooling tower ...................................................................... 65
Figure 4-18: Heat Balance Diagram of a typical Nuclear Power Plant with an efficiency of 32% ............................. 66
Figure 4-19: Solar Thermal Power Plant. Power Tower Type..................................................................................... 68
Figure 4-20: Diagram of a Flash Steam Cycle (left) and a Binary Cycle (right) ........................................................ 69
Figure 4-21: Diagram of an Enhanced Geothermal Power Plant ................................................................................ 70
Figure 5-1. Example Coal-Fired Power Plant Heat Rate vs. Load Curve ................................................................... 71
Figure 5-2. Comparison of water withdrawn from field data with model results ...................................................... 74
Figure 5-3. Comparison of water withdrawn from field data with model results. ....................................................... 74
Figure 6-1. Sankey Diagram of CHP and conventional power plants. ....................................................................... 76
Figure 6-2. Direct Dry Cooling System, Air-Cooled Condenser [ACC] .................................................................... 78
Figure 6-3. Indirect Dry Cooling System with Surface and Spray Condensers .......................................................... 79
Figure 6-4. Eskom's dry cooling towers at Grootvlei and Matimba air cooled condenser dry cooling. ..................... 80
Figure 6-5. Rendering of Tenaska Trailblazer CCS project. ...................................................................................... 80
Figure 6-6. Diagram of hybrid systems. ..................................................................................................................... 81
Figure 6-7. Diagram of Combined Heat and Power with a Steam Turbine. ............................................................... 82
Figure 6-8. Dual-purpose plant with extraction steam ................................................................................................ 83
Figure 6-9. Fujairah Power and Desalination Plant ..................................................................................................... 84
Figure 6-10. Diagram of Dry FGD and Wet FGD ..................................................................................................... 85
Figure 6-11. Location of PTOW and Coal-Fired Power Plants ................................................................................... 86
Figure 6-12. Locations of Abandoned Coal Mines and Coal Fired Power Plants ....................................................... 88
Figure 6-13. Location of Produced Water (with TDS levels) and Coal-Fired Power Plants ...................................... 89
Figure 6-14. Locations of Saline Aquifers and Coal-Fired Power Plants .................................................................... 90
Figure 6-15. Diagram of the process. Saline Water withdrawal and CO2 sequestration ............................................. 91
Figure 7-1. State Authorization to control the NPDES Program. ................................................................................ 94
Figure 7-2. Navajo Generating Station (NGS) ............................................................................................................ 97

11
Figure 7-3. Thermal Plume of the Indian Point Nuclear Power Plant in New York .................................................... 97
Figure 7-4. a) Picture of fish impingement (left). b) Diagram showing impingement and entrainment (right)........... 98
Figure 7-5. Ravenswood Power Plant, NY, might face sitting constraints. ............................................................... 101
Figure 7-6. Ovivo’s Bio Acoustic Fish Fence (BAFF) system. ................................................................................. 101
Figure 7-7. Change in water withdrawn and water consumed with regulation .......................................................... 103
Figure 8-1. Sankey diagram of US water use in 2005 .............................................................................................. 105
Figure 8-2. Water Withdrawn w/ Wet Cooling Towers ............................................................................................ 107
List of Tables ______________________________________________________________________________
Table 1. Summary of Cooling Systems Trade-offs...................................................................................................... 27
Table 2. Breakdown of Cooling Systems used in US Power Plants ............................................................................ 28
Table 3: Typical Heat Rates of different Power Plants ............................................................................................... 39
Table 4: Representative calculated values for the different parameters ....................................................................... 45
Table 5. Representative calculated values for the parameter A ................................................................................... 45
Table 6: Comparison of B values for pulverized coal power plants ............................................................................ 51
Table 7. Comparison of C values in pulverized coal power plants .............................................................................. 52
Table 8. Comparison of B values for NGCC power plants .......................................................................................... 54
Table 9. Comparison of B values for IGCC power plants ........................................................................................... 56
Table 10: Comparison of C values for IGCC power plants ......................................................................................... 57
Table 11: Comparison of B values for pulverized coal and NGCC plants with CCS .................................................. 61
Table 12: B values for IGCC plants with CCS ............................................................................................................ 62
Table 13: Comparison of C values for pulverized coal plants with CCS .................................................................... 63
Table 14: Comparison of C values .............................................................................................................................. 64
Table 15. Coal-fired power plants in the Eskom data set ............................................................................................ 72
Table 16. Summary of Cooling Systems Trade-offs ................................................................................................. 106

12

13
1 Introduction _____________________________________________________________________________
The interdependency between water and energy, sometimes called the water-energy nexus, is growing in
importance as demand for both water and energy increases. Energy is required for water treatment and
supply, while virtually all processes for energy production require significant amounts of water. Many
areas of the world are already under water and energy constraints and yet water and energy are both
indispensable for modern economies. Moreover, the world’s population is expected to grow, which will
boost water and energy demand substantially in the coming years, especially in developing countries,
which are already experiencing water and security challenges. In addition, climate change is exacerbating
the problem, due to extreme weather conditions and prolonged draught periods. The water and energy
nexus is a multifaceted issue. This thesis focuses on the water footprint of electricity generation,
specifically on the water used at thermal power plants in the US.
Thermal power plants produce around 70% of the electricity in the US, and a similarly high percentage in
the rest of the world (DOE, 2008). These power plants require large quantities of water, primarily used for
cooling. Water is also needed in smaller quantities for other purposes, such as ash handling and flue gas
desulfurization. In the United States, the thermoelectric power generation sector accounts for 40% of the
total fresh water withdrawn every year (USGS, 2005). Withdrawing such vast amounts of water has an
impact both on the aquatic organisms and on the water resources of the region where the power plant is
situated (EPA, 2004). In addition, water is becoming a scarce resource in many regions of the US, and the
situation could worsen in the upcoming years. This problem has already had some repercussions on the
power sector. For example, some proposed power plant projects have not been given the permits to be
built due to water competition concerns or to potentially adverse effects on aquatic life. This is especially
true in many western states, where agricultural and urban water needs are in conflict with those of the
power sector and where a new power plant adds an additional demand to the existing competition (DOE,
2010).
There are several federal and state regulations regarding water intake and water withdrawals for power
plants and, due to recent water scarcity issues, these regulations are becoming stricter and stricter. Hence,
power plant constructors and operators have been forced to carefully evaluate the available water sources
when sitting a power plant. Moreover, stricter regulations are leaning towards cooling tower systems,
which use less water but also increase costs. On the other hand, the water scarcity problem is a regional
issue and hence “one fits all” policies are not completely adequate since they can impose an extra burden

14
and cost to power plant operators. Therefore, it is important to understand the water footprint of the
different electricity generation technologies in order to incorporate the information into the decision-
making process and to choose the best alternative. However, nowadays there is not a clear and generic
model or way to estimate water use in power plants. The existing reports rely either on data from direct
surveys to power plant operators, which are often unreliable and incomplete, or from very detailed and
plant specific models, such as ASPEN PLUS simulations.
The purpose of this thesis is to:
1. Understand and quantify water use in power plants by developing a simple generic model of water use in power plants
2. Evaluate alternatives to decrease freshwater user in power plants
3. Evaluate and understand the existing regulations and the impact that new regulations can have in the power sector
This thesis focuses on thermal power plants, specifically pulverized coal (PC) power plants, natural gas
combined cycle (NGCC) power plants, integrated gasification combined cycle (IGCC) power plants,
nuclear power plants, solar thermal power plants and geothermal power plants. It does not include
hydroelectric power, even though it is an important water-energy nexus issue. Electricity generation dams
are used to manage the surface water, so their operation does not solely depend on electricity demand.
Therefore, estimating the water use of hydropower is complex and specific to every single dam; and the
motivations behind the dam management are out of the scope of this thesis.
This thesis begins with an introduction to the water and energy nexus in chapter 2, including the key
concepts and key definitions regarding water use in power plants, discussions about water as a regional
problem, some fundamental tradeoffs and an overview of the existing sources of data and information.
Chapter 3 introduces the model, explaining the fundamental heat balance concepts, the key parameters of
the model and the relationship that exist between the heat rate and the water usage in a power plant.
Chapter 4 evaluates the water requirements of different electricity generation technologies using the
model as a common analytical framework and explaining the different parameters’ ranges of the model
for each of the technologies. Chapter 5 evaluates the limitations of the model and validates it using field
data. Chapter 6 explores the possible alternatives to mitigate water use of the power sector by using the
model to identify what drives water use. Chapter 7 examines the main existing regulatory framework in
the US regarding water use and evaluates the impact that existing and new regulations can have on the
power sector. Chapter 8 ends with the key conclusions of the research.

15
2 Background _____________________________________________________________________________
2.1 Introduction: The Water and Energy Nexus
Energy and water are interrelated. The interdependency between these two essential goods for human life
and development are shown in the diagram on Figure 2-1, which conveys the Water-Energy Nexus.
Figure 2-1. Water Energy Nexus (Source: WEC, 2010)
Energy (mainly in the form of electricity) is required in the water treatment plants to purify the water and
make it suitable for public consumption (EPRI, 2002a). This includes regular treatments but also
desalination processes, which are increasingly being implemented in arid areas and require more energy
than conventional treatments. Moreover, significant amounts of electricity are required to pump and
transport water from the water source to the treatment plant and from the treatment plant to the end user.
This is especially a problem in arid and dry areas, where water can be transported for hundreds of miles
(Stillwell et al., 2009). Wastewater treatment plants also require energy to treat the water before
discharging it to the water source. Households also use energy to heat most of the water that they use to
wash their clothes, to boil food or to have a shower. Indirectly, electricity is also required to produce
bottled water and energy is needed to transport the bottles to the end user.
Energy for Water

16
In addition to using energy in all processes of the water cycle, water is used in all processes of energy
production. Water is needed for fossil fuel extraction and refining. An example of this is shale gas, which
lately is getting a lot of media attention due to water contamination issues (DOE/Office of Fossil Energy,
2009). Water is also required to irrigate some of the crops used to produce biofuels, such as corn ethanol
(National Research Council, 2008). Regarding electricity generation, hydroelectric power is the most
obvious example; however, most of the other types of electricity generation technologies around the
world also need water for their operation. Thermoelectric power plants, such as pulverized coal power
plants, nuclear power plants, natural gas combined cycle, geothermal and solar thermal, require water,
mostly for cooling purposes. Only wind turbines, which do not require any water for their operation, and
photovoltaic solar systems, which require minimal quantities of water for mirror washing, have a
negligible impact in the water-energy nexus problem.
Although interconnections exist between water and energy, these two sectors have historically been
regulated and managed separately. Many times governments and private companies have planned for
future water supply assuming that energy (electricity) would be available for the operations. They also
have planned for new power generation assuming that water availability would not change over time.
Neglecting this interdependency has not yet had severe adverse effects, but in some regions, the
constraints of one sector have already caused constraints in the other. For example, droughts and heat
waves have had a negative impact on the power sector in some states of the US (see section 2.3). The
vulnerabilities of the water-energy nexus will be accentuated in the future with the combination of
population growth, which will cause an increase in energy and water demand (especially in developing
countries), and climate change, which will cause longer dry periods and exacerbate water scarcity
problems (IPCC, 2008). Increasing water demand together with water scarcity will force the water sector
to look for alternative water resources such as deeper ground water reserves or further away watersheds
and to use desalination technologies for water production. The problem is that all these alternatives are
more energy intense. In addition, the global effort to minimize CO2 emissions is pushing towards
biofuels, which require more water than conventional fuels (for irrigation and production) and renewable
energy, which in some case, could also drive up water use in the power sector (see chapter 4).
Therefore, it is important to consider both sides of this water-energy nexus in major planning, policy and
regulation decisions. This is an important challenge that offers many opportunities for technology and
policy innovation. The nexus has multiple dimensions and all them will have to be understood well in
order to make informed decisions. This thesis focuses on the water footprint of electricity generation.

17
2.2 The big picture: Water for electricity generation
Water is required in almost all types of electricity generation. Traditionally, the one that has been seen as
a big water user is hydroelectric power. Everyone is aware that hydropower (hydro means water in Greek)
requires water to produce electricity. However, many people ignore that thermal power plants, which in
many countries supply most of the power, also use water, predominantly for cooling (see chapter 3). In
the US, thermoelectric power plants account for 40% of the freshwater withdrawn every year (almost the
same amount as the agriculture sector) (USGS, 2005). In many regions of the US (and of the world), the
amount of water withdrawn by the power sector has a significant effect on the overall water supply and on
the ecological health of surface water bodies.
Figure 2-2. Water is required in almost all ways of electricity generation. The most known to the general public is hydroelectric power plants (left picture). However, water is also used in thermal power plants
(pictures in the right)
These regional concerns have been addressed by the federal and state authorities, which enforce different
regulations for power plant construction and operation. Consequently, permits for proposed plants have
been denied because of water availability concerns, power plant operators have been pushed to opt for
alternative cooling systems that require less water and power plants have been shut down during heat
waves to ensure that they do not infringe the regulations regarding the temperature of the discharged
water. Water use at power plants is thus an issue that affects regional ecosystems and security of supply
of both water and electricity. However, this problem is very complex and, as exemplified later in this
chapter, it is very regionally dependent. Therefore, it is very difficult to make regulations or policies that
fit for all the US states, especially because there are several stakeholders involved and their interest are
not aligned. The agriculture sector worries about competition that might diminish their water supply for
the crops; environmentalists are concerned about the impacts on the water aquatic life and on the
18
ecosystem, etc. For the power sector, the water footprint of electricity generation matters when concerns
over water use appear as a non-negligible factor in the cost of electricity (COE). (Chapter 7 contains an
examination of the effects of the new and existing regulations on the power sector). This can happen
under different circumstances:
Operating costs – Water supply or disposal costs are themselves a non-negligible fraction of
levelized electricity costs.
Capital costs – Regulations or water scarcity force the operator to invest in more expensive
infrastructure (e.g. a dry or hybrid cooling system, water treatment system for discharged water,
etc.).
Capacity factor – Water related issues cause plant shutdowns (either due to the lack of water for
cooling or due to the fear of non-compliance with discharged water temperature regulations
during heat waves), driving the plant capacity factor down and the COE up.
Thermal efficiency – Water related issues force the operator to install a cooling system that
decreases efficiency, which in turn increases the amount of fuel required per unit of energy and
thereby increases COE.
Permitting delay – Water use concerns force delay in plant construction, prolonging scarcity and
raising COE.
Because power plant costs and revenues depend on so many variables (which are sometimes difficult to
obtain), the work described in this report does not include a detailed economic analysis. However, even a
qualitative economic analysis helps in identifying when and why water use matters in the power sector.
2.3 The big picture: Regional variation in the water-energy nexus
Unlike the emission of greenhouse gases, which is an intrinsically a global problem, the water energy
nexus is a regional problem. The regional variations in water resources, water demand, electricity
demand, and energy mix all combine to create ‘hot-spots’ where the water-energy nexus is more crucial
than elsewhere.
As an illustration, the prospect of carbon capture in the US is considered below. As discussed in section
4.1.4, the implementation of carbon capture can increase significantly the amount of water used per MWh
produced. To get an initial picture of the possible water-related constraints on carbon capture in the US,
three basic drivers can be examined:

19
Water Scarcity: Areas where water scarcity is already a problem should be identified, as well as
areas where there could be issues in the future due to climate change and population increase.
Population Growth: If population increases in a determined area, then it normally results in an
energy and water demand increase too. Hence, where population is expected to grow faster, the
water availability problem could be exacerbated.
Existing Fossil Fuel Power Plants: Even if new coal plants are not built, there are many existing
fossil fuel power plants that could potentially be retrofitted to incorporate carbon capture.
Therefore, it is important to know whether they are located in a water scarce area or not.
Figure 2-3: a) US Water availability – scarce areas in pink and light blue (DOE, 2010. data from USGS);
b) US Population growth 2000-2010 (US Census Bureau)
Figure 2-4: Existing fossil fuel power plants in the US; coal plants are shown in green (USEPA eGRID 2007)

20
Figure 2-3 and Figure 2-4 represent this information on maps of the US, as drawn from various sources. It
can be observed in the maps that water availability changes significantly depending on the state and the
area. In the eastern part of the country water availability is less of an issue, but water is much more scarce
in the west and southwest. Moreover, is in those areas where population has increased the most in the last
ten years. It is expected that due to immigration, the west is going to continue experiencing significant
population growth. Thus, those areas should be considered vulnerable in terms of water use and water
consumption.
If this data is compared with the existing fossil fuel power plants data map (see Figure 2-4), it can be
observed that there are some plants situated in areas where further water consumption from local sources
could be problematic. On the other hand, it can be observed that most of the power plants are in the
eastern part of the country. Those plants are less susceptible to water availability problems in the scenario
of widespread carbon capture deployment. However, in states such as Texas, Arizona, New Mexico and
Utah the combination of regional water scarcity and increasing population could create a major obstacle,
even if technology becomes cost-effective, to retrofit existing power plants with carbon capture and
storage, due to water availability concerns. Retrofitting an existing plant will increase water consumption,
which, in such areas, could potentially be unbearable. In order to be able to retrofit a unit, there must be
sufficient water resources in the proximity or an alternative cooling system such as dry cooling must be
installed; otherwise there could be a water demand conflict.
To fully understand the potential impact of water availability on carbon capture retrofits, the existing
power plants in the vulnerable areas should be studied case by case, combining regional water availability
and cooling system data with other factors of suitability for retrofit such as plant efficiency and proximity
to CO2 storage. Regional water availability is a crucial aspect of the issues surrounding carbon capture
and, more generally, carbon emissions, and should be taken into account by both technology developers
and policy makers in the energy sector.
Existing regional problems:
There have already been cases in the US during the past years where water scarcity has become a problem
for power plants. Some examples have been included here to highlight the importance of this issue and to
exemplify the impact that it can have on the power sector:
In 2011, during a severe drought in Texas, one power plant had to reduce its electricity
production due to the lack of water for cooling and several plants had to find new water sources.

21
This year (2012), Texas is experiencing one of the toughest draughts and the State has already
warned about possible black outs during the summer (Reuters, 2011).
Some proposed Concentrating Solar Power Plants in Nevada and California that intended to use
water cooled systems have been pushed towards dry cooling due to the water constraints of the
environment where the plants had to be placed (desert areas). (NY Times, 2009)
Due to environmental concerns, California has passed a regulation to phase out once-through
cooling systems in coastal areas, forcing all power plants in the state to replace the older systems
for another cooling system that withdraws less water. (CEPA, 2010)
A severe drought in the Southeast during 2006 and 2007, forced Duke Energy to cut their
electricity output at the Riverbend and Allen coal power plants in North Carolina. In Alabama,
the heat wave raised the water temperature of the Tennessee River and a nuclear power plant
(Browns Ferry) had to cut its output to comply with the water discharge temperature regulations
(Climate Central, 2011)
A similar thing happened in 2006 in the Midwest. A heat wave increased the temperature of
several rivers, such as the Mississippi River, and forced some nuclear plants to reduce their
output (UCS, 2011)
In the Southwest, power plants compete for a very scarce resource and therefore, the management
of aquifers is crucial to avoid depletion.
In the Northeast, where water resources are plentiful, power plants face other problems associated
with the intake of water. For example, the Indian Point nuclear power plant uses once through
cooling systems and withdrawals vast amounts of water from the Hudson River. State Regulators
are concerned about the thousands of fish killed annually by the cooling system and have not
renewed the operation licenses required until the plant operators build an alternate cooling system
(NY Times, 2010).
A report from the US Department of Energy (DOE, 2010) identified a total of 347 coal-fired
power plants (from an analysis set of 580 plants) as vulnerable to water demand concerns, to
water supply concerns or to both.
2.4 Key concepts
2.4.1 Consumption vs. withdrawal
It is important to understand the difference between water withdrawn and water consumed when talking
about water use in power plants. Some articles and reports mention water use without specifying if it is
22
consumed or withdrawn. However, as explained later, the amount of water used changes significantly
depending on what are we referring to. “Withdrawal” is typically defined as the amount of water that a
power plant takes from a water source (lake, river, ocean, aquifer, etc). “Consumption” is the water that
is lost from the total water withdrawn, usually due to evaporation during the cooling process. “Discharge”
is the amount of water that is returned to the water source. Therefore, the water consumed is equal to the
water withdrawn minus the water discharged back to the source.
The three concepts are important and all have consequences on the environment. Water withdrawals
matter for two main reasons; water intake systems can trap and kill fish and other aquatic life and
moreover, when water is taken from groundwater aquifers, those can be depleted if the water source is not
managed properly. Water consumption matters because it reduces the availability of water to be used for
other purposes in the region, such as agriculture and urban supply. Finally, discharge matters due to water
quality reasons. If the water has been used for cooling purposes, it will usually be some degrees warmer,
which can have adverse effects on the ecosystem of the water source. Moreover, if the water has been
used in other power plant processes, it might contain polluting chemicals and hence it may require some
treatment before it is returned to the water source, which increases operational costs.
As it will be explained in the following section, depending on the cooling system used in the power plant,
the amount of water withdrawn and consumed will vary significantly. In the US around 40% of the total
freshwater withdrawn annually is used for thermoelectric cooling purposes (USGS, 2005). However,
thermoelectric cooling only accounts for 3.3% of the total freshwater consumed (see Figure 2-5). Despite
this small consumption percentage, the water required for cooling in power plants can have a great impact
on the water resources of a country at a regional level, especially in water-scarce areas.
Figure 2-5: US freshwater withdrawals (left) and consumption (right) (USGS 2005 data)

23
2.4.2 Cooling Systems
As explained earlier and as it will be discussed thorough the thesis, most of the water required to operate
thermal power plants is used for cooling. Thermoelectric generation processes inherently produce large
quantities of “waste” heat, which must be rejected to the environment using a cooling system. The less
heat to be dissipated, the less cooling duty will be required in the power plant. This will be explained
further in chapter 3 and 4. However, it is important to highlight that for a power plant with a given
amount of heat to be dissipated, the amount of water required for cooling will depend on the type of
cooling system being used in the plant. The main types of cooling systems and their tradeoffs are
discussed below.
2.4.2.1 Once-through cooling
Once-through cooling (see Figure 2-6), also called open-loop cooling, is the simplest and cheapest
existing cooling system (see section 2.4.2.4). This system requires withdrawing large quantities of water
from a water body, but it returns almost all that water to its source once it has passed through the heat
exchanger. The cooling water accepts the waste heat and is discharged to the water source some degrees
warmer. There are regulations that set the maximum allowable temperature increase to minimize
environmental impacts. In this type of cooling systems a small fraction of the water is often consumed
through evaporation due to the higher temperature of the discharged water. Although this evaporation
does not happen within the physical boundaries of the power plant, it is driven by the power plant’s waste
heat and hence is often taken into account in the water consumption analysis.
Figure 2-6: Diagram of once-through cooling system
Besides its simplicity and low cost, once through cooling has another advantage; if the water is cold
enough and it is plentiful, it is the most effective and efficient cooling system. However, since it requires
vast amounts of water, it can have adverse ecological impacts. Fish and other aquatic organisms living in
the water may be killed by being sucked into the system or by being trapped against the inlet screens.
24
Moreover, the increased temperature of the discharged water can affect the local ecosystem, having
detrimental effects on the environment. In the US, new power plants have not been built with once-
through cooling for many years; however, there are many old power plants that still use this cooling
system. This old plants might be facing strict regulations from the EPA and from State Regulators in the
near future, which are pressuring to phase out once-through cooling even from existing plants. The
implications of these new regulations on the power sector are addressed further in chapter 7.
2.4.2.2 Closed Cycle Cooling Systems
Closed cycle cooling systems (or recirculated cooling) are the most used cooling systems in US power
plants. There are two types of cooling systems that fall under this category: wet cooling towers and
cooling ponds. Both cooling systems use the same principle; they use a recirculating loop of water.
Wet cooling towers are more common than cooling ponds in the US. In this system, after the water goes
through the steam condenser removing the waste heat, it is sprayed down through the cooling tower while
air comes up from the bottom of the tower and out to the environment. The flow of air, which can be
drawn by a fan or by natural draft, acts as a heat exchanger, with heat transferring from the water to the
air and cooling down the water, with water evaporation as a major source of cooling. The remaining water
is then collected at the bottom of the cooling tower and reused again in the steam condenser of the power
plant, closing the recirculating loop (see Figure 2-7) .
Figure 2-7: Diagram of wet cooling tower (mechanical draft)
Although this cooling system withdraws far less water than once-through systems – about two orders of
magnitude less – the water consumption is higher. As the water goes down the cooling tower, some of it
leaves the tower evaporated in the air. Moreover, smaller amounts of water are purged from the cooling
water circuit to avoid build up of harmful contaminants. This stream is usually called cooling tower

25
“blowdown” and is concentrated in dissolved and suspended solids. Its discharge to the water source is
heavily regulated and needs to be treated before being returned back to the water source (in which case it
is not counted as consumed) or evaporated in holding ponds (in which case it accounts as consumed). A
continuous water intake is required to make up for the evaporation losses and the blowdown.
Therefore, since they withdraw less water, wet towers have less severe impacts on the environment.
However, they consume more water and their cost and complexity is higher than for once-through cooling
systems. Moreover, cooling towers can pose land issues and aesthetic objections. For example, natural
draft cooling towers can be up to 200 meters tall and 100 meters in diameter (see Figure 2-8) and can
produce unwanted vapor plumes under certain conditions.
Figure 2-8. Picture of a natural draft cooling tower
Cooling ponds are less common than cooling towers but still used around the US. They entail a quasi-
closed loop of cooling water, but instead of using a cooling tower, they use a system of ponds or canals.
In these cooling systems, after the water goes through the steam condenser removing the waste heat, it is
discharged to a pond, where it rejects heat through evaporation and direct convection with the air. The
water is then pumped back to the power plant and used in the steam condenser again, closing the cooling
water loop (see Figure 2-9). Similarly than with cooling towers, some of the water is consumed due to
evaporation.
Figure 2-9: Diagram of a cooling pond system

26
It is complicated to estimate or to generalize water use in pond-cooled systems. This is due to the fact that
the “cooling ponds” category includes a variety of types. It can refer to a natural lake or a man-made big
reservoir, which can be used for other purposes than cooling, such as controlled fisheries or recreational
activities; but it can also refer to a series of small and structured canals built for the single purpose of
providing cooling water. Hence, the water consumption and withdrawal for pond-cooled system is very
site specific. However, for a given heat waste to be dissipated, it can be safely bounded between the
factors for once-through cooling and wet cooling towers.
2.4.2.3 Dry cooling
Dry cooling systems (see Figure 2-10), sometimes referred to as air cooling, use air instead of water as the
heat transfer fluid. Therefore, this type of cooling system does not withdraw or consume any water for
cooling purposes (other processes in the power plant may require water). Compared to the other cooling
systems, it has minimal environmental impacts. However, since air is not as efficient as water in heat
transfer, dry cooling systems require a large surface area for the heat exchanger to be able to dissipate the
waste heat to the environment. This makes dry cooling three or four times more expensive than an
equivalent wet tower cooling system.
Dry cooling is usually used in dry and arid areas, where there is not enough water available for the
optimal operation of a wet cooling system. Specifically, it has been proposed as an alternative cooling
system for the new solar thermal power plants being built in the US, which inherently tend to be located
in desert areas. However, since dry cooling is more expensive than wet cooling, it becomes an extra cost
for solar thermal technologies, which are already more expensive than most of the fossil fuel power
plants. In addition, the efficiency of the cooling system, which affects the overall efficiency of the power
plant, depends on the temperature of the heat transfer fluid, in this case the air. Therefore, on hot days, the
effectiveness of a dry cooling system decreases, decreasing the plant efficiency as well. Unfortunately,
and for the reasons mentioned above, dry cooling systems tend to be located in areas where it can get very
hot during the day and usually, hot days coincide with high electricity demand, which makes the problem
worse.

27
Figure 2-10. Diagram of dry cooling and aerial view of a dry cooling system
Hybrid cooling systems combine wet and dry cooling approaches. There are different types of hybrid
cooling systems, but all fall between wet and dry in terms of cost, performance, and water use. Hybrid
and dry cooling are discussed further in Chapter 6 when looking at the possible alternatives to reduce
freshwater use in power plants.
2.4.2.4 Cooling systems summary
Summarizing, the cooling system that power plant operators choose will have an impact on the power
plant efficiency, capital and operation cost, water consumption and water withdrawal and environmental
impact. Therefore, the trade-offs have to be evaluated case-by-case, taking into account the regional and
ambient conditions and the existing regulations to be able to choose the optimal cooling system for that
plant. A summary of the trade-offs is captured in Table 1.
Cooling Type Water Withdrawal
Water Consumption Capital Cost Plant Efficiency Ecological
Impact
Once-Through intense moderate low good intense
Wet Cooling Towers moderate intense moderate good moderate
Dry Cooling none none high bad low
Table 1. Summary of Cooling Systems Trade-offs
As explained earlier, water availability varies regionally and, in the United States, the differences between
the East and the West in terms of water are huge. Therefore, power plant operators have to adapt to their
environment and choose accordingly the most suitable cooling system. Thus, we find that in the East,
where there is enough water, power plants tend to withdraw more water than in the West and more power
plants use once-through cooling. On the other hand, in the arid West, most of the power plants use wet
cooling towers to cope with the water scarcity problems of the region. This is shown in Table 2, where we
can find a breakdown of the number of generators and energy produced by the type of cooling system. As
28
shown, the predominant cooling systems in the US are wet cooling towers followed by once-through.
Most of the generators (75%) using once-through are located on the East of the Mississippi River. In
Figure 2-11 we can find a graphic representation showing where the different types of cooling systems are
located across the US and how much water they withdrawal. As shown, most of the once-through cooling
systems (dark blue dots) are located in the East. In the West and South West there are very few once-
through cooling systems. In California, due to the availability of ocean water, there are some once-
through cooling systems, used especially in nuclear power plants. However, as mentioned earlier, a new
State Regulation is going to ban this type of cooling systems in all power plants.
Cooling Type Generation
(TWh)
Percent of Total
Generation
Number of Generators
Percentage on East of the Mississippi
Percentage on West of
Mississippi
Once-Through 1,203 33% 1,140 75% 25%
Wet Cooling Towers 1,859 52% 2,241 39% 61% Cooling Pond 461 13% 232 50% 50%
Dry Cooling 86 2% 136 46% 54%
TOTAL 3,609 100% 3,749
Table 2. Breakdown of Cooling Systems used in US Power Plants. Source: EIA 2008, UCS 2011
Figure 2-11. Types of Cooling Systems and water withdrawal in the US. Source: EIA 2008, UCS 2011
2.5 Overview of available data sources – Literature Review
All published data on water use for electricity generation is ultimately derived from two types of sources:
A) Field data from power plants

29
B) Power plant models, usually not focused on water use, such as ASPEN PLUS simulations
In the United States, data on water use in power plants is collected by two federal agencies, the U.S
Geological Survey (USGS) and the U.S. Department of Energy’s Energy Information Administration
(EIA). However, even though the power sector accounts for almost 40% of the freshwater withdrawn in
the US, these two agencies have not made an effort to collect high quality and accurate data, which would
be extremely valuable for policy making.
The USGS publishes reports on water withdrawals in the US by sector and state every five years. The last
report available is Estimated Use of Water in the United States from 2005. However, the data of the
USGS is not broken down by power plant or even by power plant type (nuclear, coal, etc). The data is
aggregated by state and therefore is not very useful to estimate water use per kWh. In addition, the
information is collected by different state agencies, which often use different methodologies to account
for water withdrawal and therefore there can be inconsistencies in the results. On the other hand, the
USGS data is very useful to understand the magnitude of water withdrawals by the power sector and to be
able to compare it to the other sectors in the US. The EIA is focused on national energy statistics and
publishes official reports every year. Their data shows water withdrawals and water discharges (and by
difference, also consumption) for each power plant and it also specifies the type of cooling system that is
used. However, the data does not seem to be very accurate and they do not document nuclear facilities
and some natural combined cycle (NGCC) power plants.
At least three reports highlight the problems in the reporting methodologies and challenge the accuracy of
the USGS and EIA data. Yang and Dziegielewski (2007) studied the EIA data and conducted regression
analysis to determine the water footprint of different power generation technologies. They found large
variances, weak correlations and many outliers in the date. The US Government Accountability Office
(GAO) published a report (Mittal and Gaffigan, 2009) where they interviewed representatives from the
USGS and the EIA as well as other stakeholders, such as the data base users. The GAO identified
significant limitations in the data, and challenged the capacity of the EIA to ensure the quality of the
collected data: “Respondents may use different methods to measure or estimate data, and instructions may
be limited or unclear. Respondents may make mistakes or have nontechnical staff fill out surveys.” Mittal
and Gaffigan also mention that USGS data is not consistent due to the fact that different States use
different methodologies and some of them even use the EIA data to report to USGS. They also highlight
the lack of seasonal data and the lack of detail on cooling system configurations and water sources.
Finally, the Union of Concerned Scientist, in their report “Freshwater Use by U.S. Power Plants:
Electricity’s Thirst for a Precious Resource”, also highlight some of the gaps in the available data sets.

30
They analyzed the existing data and concluded that “Power plants that did not report their water use to the
EIA accounted for 28 to 30 percent of freshwater withdrawals by the electricity sector”. As mentioned
before, this is in part due to the lack of reporting from nuclear power plants. They also compared this data
with the available water factors in the literature and found that many reported power plants fell outside
the boundaries of their analysis, with some plants reporting 5 times the median and others reporting zero
water use. Moreover, they found that out of 3,583 generators only 1,741 reported the type of cooling
system being used.
There are different engineering studies that have focused on modeling. However, most of the available
reports are not focused on water use at power plants, and their models dig into all the processes within the
plant. Moreover, the models tend to be too detailed and specific to individual plants and technology,
focusing mostly on fossil fuel power plants using wet cooling towers. There is a lack of models available
on once-through or dry cooling systems. Some of the most complete are the state-of the-art fossil-fuel
power plants models by NETL (DOE/NETL, 2010). They use ASPEN Plus simulations to explain in
detail every single process in the power plant and to benchmark different fossil fuel technologies,
comparing different plant performance aspects, including water. Ikeda et al. (2007), from the Cooperative
Research Center for Coal in Sustainable Development from Australia use similar simulations to also
benchmark the performance of new technologies for possible new fossil fuel power plants in Australia;
and they include water use in the report. From Carnegie Mellon University there are a set of published
papers on the effect of carbon capture on water withdrawal and consumption in pulverized coal power
plants (Zhai, 2010) (Zhai, 2011) using the Integrated Environmental Control Model (IECM), a fossil fuel
power plant model (Berkenpas et al, 2009). These models are very useful to understand how a power
plant works and to identify the processes where water is required and were essential for us to estimate the
parameters of our model. However, due to their complexity and level of detail, they do not intend to be
general models that can be applied to estimate water use in all power generation technologies.
Most of the rest of the available publications draw information from these models or from the primary
data sets (or from both) and use the water factors to conduct regional analysis, to project power plant
water use depending on different scenarios, to identify those States where the water-energy nexus will
have a higher impacts, etc. There are also some high-level reports on the water-energy nexus that do not
give a lot of information about the origin of their numbers. Using a specific number for water withdrawal
and consumption depending on the power plant type is very useful to make projections and forecast
analysis. However, it also has its limitations. For example, these types of reports often use the same value
irrespectively of geographic location and climatic conditions, which do affect water use. They also ignore

31
the huge differences in efficiency within the same type of power plants (for example old coal plants vs.
new coal plants), which also affects water use, as it will be shown later in the thesis.
The huge variation in water consumption factors is shown in Figure 2-12, which is taken from a report by
NREL that collected water factors from published primary literature (Macknick, 2011). In the report, they
also acknowledge that the field data is not of good quality. Fortunately, the EIA is making an effort to
improve its data collection, acknowledging the importance for higher-quality data in this field to meet the
need of policy makers and the public and private sector decision makers. However, given the lack of
consistent and high-quality data today, modeling is necessary to obtain better water estimates and to
understand what drives water consumption. A simple model to estimate water use in power plants has
been developed as part of this thesis, which will help understand the available data and to overcome some
of the mentioned deficiencies. This model is explained and described in detail in the next chapter.
Figure 2-12. Water consumption factors for electricity generating technologies (Macknick, 2011)

32

33
3 A model of water use for thermal power plants _____________________________________________________________________________
3.1 Introduction to Thermal Power Plants
Most of the power plants around the world are thermal power plants. In the US, they produce around 70%
of the electricity and a similarly high percentage in the rest of the world (DOE, 2008). The most prevalent
thermal power plants are pulverized coal (PC) power plants, natural gas combined cycle (NGCC) power
plants and nuclear power plants, in decreasing order. This category also includes less common power
plants such as solar thermal and geothermal plants, which may gain significance in the future moving
towards less carbon-intense technologies (See Figure 3-1 for a breakdown of electricity generation by
source. The category “natural gas” also includes simple gas turbines, which are not thermal power plants).
Figure 3-1: Net Electricity Generation in the US by Energy Source, 2010 (Source: US EIA)
Thermal power plants produce large quantities of waste heat that must be rejected somehow to the
environment, and therefore they require large quantities of water for cooling purposes. Water is becoming
a scarce resource in many regions of the US and of the world, and the situation could worsen in the
upcoming years due to climate change and growing population. While non-thermal renewable generation
technologies such as wind and photovoltaics consume negligible amounts of water, they face another
problem: intermittency. Absent massive grid-scale electricity storage, it seems inevitable to continue
using thermal power plants as base-load and dispatchable power. Thus, it is important to understand the
water footprint of the different electricity generation technologies in order to incorporate the information
into the decision-making process and to choose the best alternative. As mentioned in the previous chapter,
existing power plant data is of poor quality and existing models are too plant specific. This chapter
explains and quantifies water use in power plants from a different perspective by developing a simple
generic model focusing on the heat balance of the power plant.
45.0%
23.9%
19.6%
6.2% 4.2% 1.0% Coal
Natural Gas
Nuclear
Hydroelectric
Other Renewables
Petroleum

34
3.2 Heat rate vs. water use
Thermal power plants convert heat into power in the form of electricity. The heat is generated from a
diverse range of sources, including pulverized coal, natural gas, uranium, solar energy, and geothermal
energy. The heat rate (HR, kJ/kWh) of a power plant is the amount of energy required (kJ/h) to produce
one unit of electricity (kW) (see Equation 1).
(1)
The power plant’s net efficiency is simply the heat content of electricity (3600 kJ/kWh) divided by the
heat rate (kJ/kWh) (see Equation 2).
(2)
The power plant’s heat rate depends on the fuel type used and the specific power plant design. All the
heat put into the plant that is not converted into electricity (shown as “Heat Losses” in Figure 3-2) is
waste heat and has to be dissipated somehow to the environment. The majority of this heat is rejected to
the environment through cooling systems, which usually use water as the heat transfer medium. Thus, the
smaller the heat rate, the smaller the waste heat that needs to be rejected; and therefore, less cooling water
is required per kWh produced.
Figure 3-2. Simple visualization of Thermal Efficiency
Moreover, since between 85% and 95% of the total water needs are for cooling purposes (DOE/NETL,
2010) (EPRI, 2002b), we can get a good estimate of the total water needs of power plants by knowing
only the heat rate and the type of cooling system used. This correlation between water use and heat rate
can be observed in Figure 3-3 and Figure 3-4 (the graphs show data for power plants with cooling
HR =Heat Input of FuelNet Power Output
Efficiency = 3,600HR

35
towers). In both graphs, the data fall along a straight line. The variability can be attributed to the
remaining 5% - 10% water used in other processes and to small differences in the heat balance, which
depend on the type of power plant and other characteristics that are explained in the next sections.
Figure 3-3: Pulverized Coal Water Withdrawn w/ Wet Cooling Towers (ESKOM Field Plant Data 2006-2011)
Figure 3-4: Water Withdrawn w/ Wet Cooling Towers (Data from simulations. Sources: DOE/NETL, EPRI,
Ikeda)
3.3 Formulation of the model
Water use in a power plant can be complicated, sometimes with water being recycled in different
processes. However, to calculate total water withdrawal and consumption, it is not necessary to delve
into these details. All one needs to do is understand water and heat flows across the battery limits of the
power plant.
0
500
1000
1500
2000
2500
3000
3500
0 2000 4000 6000 8000 10000 12000 14000
Wat
er W
ithdr
awal
(L/
Mw
h)
Heat Rate (KJ/KWh)
0
1,000
2,000
3,000
4,000
5,000
6,000
0 5000 10000 15000 20000
Wat
er W
ithdr
awal
(L/M
Wh)
Heat Rate (kJ/kWh)
PC FGD
PC w/o FGD
PC CCS
NGCC
NGCC CCS
IGCC
IGCC CCS

36
The following equation expresses water use for a thermal power plant (I in L/kWh) as a function of the
heat rate (HR) and 3 adjustable parameters: A (L/kJ), B (kJ/kWh), and C (L/kWh). This simplified
equation also helps us identify the parameters that have a higher impact on water withdrawn and water
consumption.
𝐼 = 𝐴(𝐻𝑅 – 𝐵) + 𝐶 (2)
Figure 3-5: Simplified Visualization of Heat Balance of a Power Plant
Figure 3-5 represents the heat balance of the power plant and helps us understand better the parameters
HR and B. The energy input into the plant (as fuel) has to be equal to the energy going out of the plant.
The amount of heat that is rejected to cooling water is simply HR-B. The parameter B (kJ/kWh)
represents all other heat outputs (heat content of electricity, heat loss with the flue gas, and other losses
discussed below).
The cooling water needed to dissipate HR-B for a given power plant will vary depending on the type of
cooling system. This is modeled by the parameter A, which represents the water needed per unit of energy
rejected through the cooling water (L/kJ). Finally, the parameter C represents the water used in other
processes not related to cooling (L/kWh). Thus, the total amount of water required in the power plant (I)
depends on the amount of heat to be dissipated through the cooling system (HR-B), the type of cooling
system (A) and the water needs of the other processes in the plant (C) (see Figure 3-6). Going back to
Electricity
Flue gas Other
HR-B
B
HR
Heat to Cooling Heat input

37
Figure 3-3 and Figure 3-4, the equation (3) represents the trend-line of the graphs. All these parameters
are explained in more detail below1.
Figure 3-6. Visualization of inputs and outputs of the model
3.3.1 Parameter B: Heat dissipated through other mechanisms than the cooling system
We can obtain the amount of energy that has to be dissipated through the cooling system by subtracting
the energy lost to other sinks (B) from the energy needed to generate one kWh (HR). Thus, the bigger the
B, the smaller the waste heat that needs to be rejected through the cooling system; and therefore, less
cooling water is required per kWh produced. The energy going into the system can only leave it in two
ways: as process heat losses, or as a product stream.
The process heat losses account for 3% to 5% of the total energy input depending on the type of power
plant. These include steam turbine heat losses, generator heat losses, radiation losses, etc.; most of the
processes in the power plant dissipate small amounts of heat into the environment.
The product streams can be classified into three categories:
Electricity
Flue gas
Other streams
Electricity, by definition, accounts for 3600 kJ/kWh. Flue gas is typically a significant stream for
combustion-based plants, and will be discussed further in the following paragraphs. “Other streams”
1 Several reports and books on power plant processes have been consulted to quantify the standard values for the parameters of the model for each power generation technology. Too avoid extended and repeated citations of the references, most of the sources used for chapter 3 and 4 s have been listed in the reference section under General Bibliography.

38
includes small streams such as slag and sulfur, which carry some heat to the environment. However,
these streams are negligible compared to the overall energy balance. For CCS cases, the CO2 stream has
to be taken into account, but its effect on the overall heat balance is also small (on the order of 2%) (see
section 4.1.4).
The flue gas from the combustion of fossil fuel and/or biomass in a power plant is ultimately released to
the atmosphere, and therefore some energy is lost up the stack. The energy content of the flue gas consists
of both sensible heat (associated with the energy of temperature rise) and latent heat (associated with the
energy of water vaporization).
The sensible heat (Qsens) in kJ/kWh is a function of the flue gas mass flow rate (mFG) in kg/kWh, flue gas
temperature (T) in K, and specific heat capacity of the flue gas (CFG)) in kJ/kgK:
(4)
Thus, the higher the mass flow rate and the higher the temperature of the flue gas, the higher the heat lost
up the stack. For example, the flue gas mass flow is higher in NGCC and IGCC power plants than in
pulverized coal power plants. Therefore, more heat is released to the environment through the stack and
less heat load is sent to the cooling system, which means that less cooling water is needed.
The latent heat is a function of the water content of the flue gas. This water comes either from the fuel as
a product of combustion or from other processes such as flue gas desulfurization (FGD), which adds
water to the flue gas. If we are using the higher heating value (HHV) of the fuel to account for the thermal
input, which assumes that after the combustion all the water components are in liquid state, we have to
take into account the latent heat of all the evaporated water suspended in the flue gas. The latent heat can
be calculated with the following:
(5)
Where mwater (kg/kWh) is the flue gas water content (mass flow rate) and hfg is the latent heat of
vaporization of water (2,300 kJ/kg). Thus, the higher the water content in the flue gas ( mwater ), the higher
the latent heat.
Therefore, the three parameters that will define the heat losses through the flue gas are: total flow rate,
exit temperature and water content of the flue gas. These three parameters will vary significantly
depending on the power plant type and fuel, whether the plant has an FGD system to control the sulfur
emissions or not, whether it has carbon capture system or not, etc. (see Figure 3-7).
Qsens = mGFGCFG∆T
Qlatent = mwaterhfg

39
Figure 3-7: Heat Lost through the Flue Gas (Source: DOE/NETL, Ikeda, EPRI)
3.3.2 Parameter HR: Heat rate of the power plant
The heat rate (HR) can vary significantly depending on the fuel used and the type of power plant. As
explained earlier, a lower heat rate means less waste heat to be rejected and thus less cooling water
required per kWh generated. Hence, if the cooling systems are equal, the amount of required water will be
determined by the heat rate of the power plant. In Table 3 there are some examples of power plants and
their typical heat rate values. Therefore, gas combined-cycle plants (heat rate around 7,200) require less
cooling water than sub-critical pulverized coal power plants (9,800) and much less than solar thermal
plants (12,000).
Power Plant Type (examples) Typical Heat Rate (kJ/kWh)
NGCC 7,200 HHV
IGCC 9,100 HHV
Super-Critical Pulverized Coal 9,200 HHV
Sub-critical Pulverized Coal 9,800 HHV
Nuclear 11,250 HHV
Solar Thermal (Rankine Cycle) 12,000 HHV
Table 3: Typical Heat Rates of different Power Plants (Source: DOE, EPRI, World Nuclear Association)
3.3.3 Parameter A: Cooling System Type
A [L/kJ] is a constant related to the cooling system used in the power plant. It represents the required
water withdrawal or consumption per unit of waste heat that has to be rejected. There are three main types
of cooling systems: once-trough cooling, evaporative cooling (cooling towers) and dry cooling. There is

40
also a hybrid version between wet and dry. Currently, once-through cooling and evaporative cooling are
far more common than dry or hybrid wet/dry cooling. Each of them require different amounts of water (or
none at all in the case of dry cooling), which means that A will change significantly for each of the
cooling systems. Hence, the type of cooling system used in power plants has a huge effect on the overall
water consumed. The main differences between cooling systems are described below, ranked in
decreasing water withdrawal intensity:
Once-through cooling: It is the simplest cooling system but also the one that requires large amounts of
withdrawn water and hence, the one with the highest “A” for water withdrawn. Water is withdrawn from
a water source (river, lake, sea) and it is run through the condenser to remove the heat. The water is then
discharged back into the source but some degrees hotter. For this cooling system, A [L/kJ] will be :
For water withdrawn (6)
For water consumed (7)
Where Cp is the specific heat capacity of water (cp = 4.184 [kJ/(kg*K)]), ΔT is the temperature increase of
the water (which usually by law is around 10 K)2 and ρW is the density of water (which is 1 kg/l). The
parameter A has been calculated using the following thermodynamic equation (8):
(8)
Where m is the amount of water required (kg/kWh); Cp is the specific heat capacity of water (cp = 4.184
[kJ/(kg*K)]), Q is the amount of heat to be dissipated ((HR-B) [kJ/kWh] ) and ΔT is the temperature
increase of the water.
However, only a small part of m evaporates (i.e. is consumed) once it is returned to the source due to the
temperature increase of the water (see section 2.4.2), which is captured by the coefficient α . Hence,
AOT_C is much smaller than AOT_W. α indicates the percentage of the water that is evaporated and its value
is around 1%. However, it depends on ambient conditions such as the temperature of the watershed and
the wind speed.
2 EPA does not set a maximum AT, however, most of decides only allow a 20ºF increase. See here an example of Massachusetts:
www.mass.gov/dep/water/resources/72wqa07i.doc
AOT _ W =1
CP∆TρW
AOT _ W =α
CP∆TρW
Q = mCP∆T → m =Q
CP∆T

41
Evaporative cooling: This is a closed-loop system, in which the cooling water is sent from the condenser
to the cooling tower, where the heat of the water transfers to the ambient air by evaporation. The resulting
lower temperature cooling water is returned to the condenser, and the amount of water that evaporates in
the cooling tower is replenished. The total evaporated water (i.e. consumed) depends on the design of the
cooling tower and on the temperature and humidity of the incoming air. “A” will be:
For water withdrawn (9)
For water consumed (10)
Where ksens is the fraction of heat load rejected through sensible heat transfer and it depends on the design
of the cooling tower and on the temperature and humidity of the incoming air. This parameter is very
significant because the higher ksens is, the less water is consumed for a given heat load. ncc is the number
cycles of concentration (it determines the amount of water that is purged as blowdown) , ρw is the density
of water (kg/l) and hfg is the latent heat of water (2,454 kJ/kg at 20ºC). The main difference between
water withdrawn and water consumed is the parameter kbd , which is the fraction of blowdown discharged
to the watershed. Thus, if ncc and kbd are low, then water consumption will be high. However, usually it
is not the case. If ncc is high, it means that the water in the cooling towers will be high in mineral
concentration and therefore kbd will be low. Most of the blowdown water will not be returned to the water
shed. If ncc is low, then the quality of the cooling water will be higher and most of it will be returned to
the water shed (kbd will be high). However, for cooling towers, the main consumption mechanism is
evaporation. Blowdown consumption is non-negligible but small compared to cooling tower evaporation
(Rutberg et.al, 2011).
Wet/Dry Hybrid Cooling: this cooling system is a combination of a wet cooling system (cooling tower)
and a dry cooling system (air cooled heat exchanger). There are different configurations for this system,
but for all of them, the value of “AHC_C” would be between that of ACT_C and ADC_C.
Dry Cooling: It uses air as the medium of heat transfer and hence, does not use or consume any amount of
water. However, the main disadvantages are its high cost and the efficiency penalty. “ADC” in this case
would be 0.
ACT _ W =1− ksens( )ρwhfg
1+1
ncc −1
ACT _ C =1− ksens( )ρwhfg
1+1− kbd
ncc −1

42
In terms of the parameter A, the trends among these cooling systems can be described as follows: once
through cooling withdraws (AOT_W) large quantities of water but only consumes (ACT_C) a small
percentage of it; cooling towers withdraw (ACT_W) smaller amount of water but consume (AOT_C) most of
it; dry cooling does not withdraw (ADC_W) or consume (ADC_C) any amount of water; and hybrid cooling
withdrawn (AHC_W) and consumption (AHC_C) rates fall between those of cooling towers and dry cooling.
Summarizing, for water withdrawn: AOT_W > ACT_W > AHC_W > ADC_W = 0
And for water consumed: ACT_C > AOT_C > AHC_C > ADC_C = 0
3.3.4 Parameter C: Other processes water needs in the power plant
The water amounts for C (l/kWh) are about one order of magnitude smaller than the amount of water
required by the cooling system. Processes under this parameter include FGD systems, dust removal, water
gas shift, etc. Since there are many processes that require small amounts of water, it can be difficult to
quantify them. However, if we look at the power plant as a whole and focus on what happens at the
boundaries, we can simplify the calculations and understand the water use in a more intuitive way.
Starting from the premise that the water that goes into the plant has to be equal to the water that leaves the
plant, we can quantify water consumption looking at the outlet streams.
Water can leave the power plant in three ways:
(1) evaporated in the flue gas
(2) as discharge streams
(3) as part of other products such as slag
The stream (1) can be known calculating the amount of water suspended in the flue gas that is not a
product of the coal combustion process as shown in Equation 11.
C1 = mwater – mwater_CP (11)
Where mwater is the total water content in the flue gas (L/kWh) and mwater_CP is the water from the coal
combustion process (L/kWh).
The water from the combustion process can be estimated through stoichiometry, once the coal feed rate
(kg/h) and the hydrogen content of the coal are known.

43
(12)
For example, if the coal feed is 198,391 kg/h with 4.5% hydrogen by weight and the water content in the
flue gas is 216,537 kg/h (DOE/NETL, 2010), then:
Since we know that 1kg water = 1 liter of water, then:
Stream (2) includes the cooling tower blowdown and the boiler blowdown. Minerals and other impurities
usually accumulate in the circulating water of the cooling towers and thus, the blowdown is necessary to
maintain the quality of the water and avoid corrosion. If the quality of the water source is good, then less
water blowdown is needed. In many cases, this water is recycled and used for the FGD system, which
does not require high quality water, and hence, most of it leaves the plant evaporated in the flue gas
(which is already being accounted for in stream (1)). Otherwise, it is sent to the wastewater treatment
system and then returned to the water body.
Figure 3-8. Diagram of the Steam Cycle
Impurities also accumulate in the steam-cycle water (boiler water) and therefore, water is also blow down
and replaced with clean water (see Figure 3-8). However, the quantity of water necessary is orders of
magnitude smaller than the cooling water and is usually taken directly from the municipal water source
H2 +12
O2 → H2O
198,391kgCOAL
h4.5kgH
100kgCOAL
18kgH2O
2kgH
= 80,348kgH2O
h
C1 = 216,537lh− 80, 348
lh= 136,188
lh→ C1 =
136,188 l / h550,000kW
= 0.248 l / kWh

44
instead of from the natural water source. Thus, this stream is almost negligible in terms of water
consumption accounting for up to 1% of the total. However, blowdown streams can be important at the
plant level in terms of cost due to the expensive water treatment systems needed to comply with strict
discharge regulations.
Stream (3) can vary depending on the power plant types and includes streams such as the gypsum from
the FGD, slag, etc. However, these water amounts are typically small and most of the times the water gets
recycled internally.
For some types of power plants we will have to quantify also water used in other process not related to the
steam cycle, such as the water used to clean the mirrors in solar thermal plants.
Figure 3-9: Example of Water Balance. Pulverized Coal Power Plant
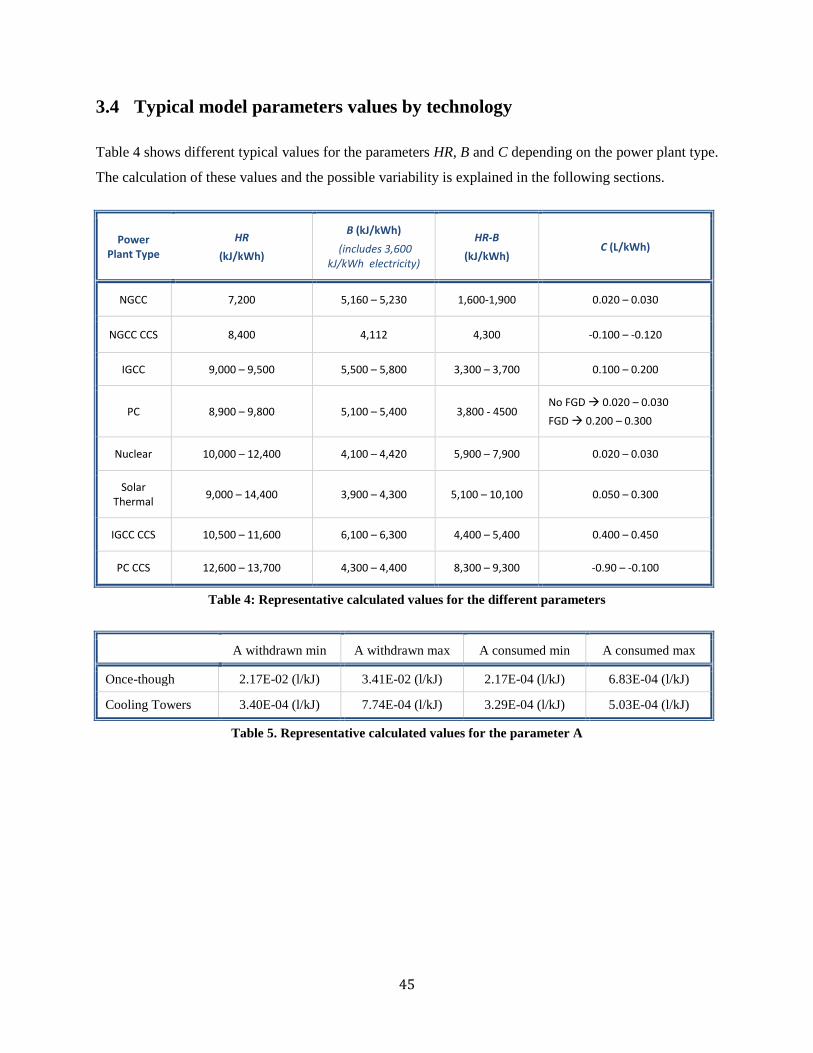
45
3.4 Typical model parameters values by technology
Table 4 shows different typical values for the parameters HR, B and C depending on the power plant type.
The calculation of these values and the possible variability is explained in the following sections.
Power Plant Type
HR (kJ/kWh)
B (kJ/kWh) (includes 3,600
kJ/kWh electricity)
HR-B (kJ/kWh)
C (L/kWh)
NGCC 7,200 5,160 – 5,230 1,600-1,900 0.020 – 0.030
NGCC CCS 8,400 4,112 4,300 -0.100 – -0.120
IGCC 9,000 – 9,500 5,500 – 5,800 3,300 – 3,700 0.100 – 0.200
PC 8,900 – 9,800 5,100 – 5,400 3,800 - 4500 No FGD 0.020 – 0.030 FGD 0.200 – 0.300
Nuclear 10,000 – 12,400 4,100 – 4,420 5,900 – 7,900 0.020 – 0.030
Solar Thermal 9,000 – 14,400 3,900 – 4,300 5,100 – 10,100 0.050 – 0.300
IGCC CCS 10,500 – 11,600 6,100 – 6,300 4,400 – 5,400 0.400 – 0.450
PC CCS 12,600 – 13,700 4,300 – 4,400 8,300 – 9,300 -0.90 – -0.100
Table 4: Representative calculated values for the different parameters
A withdrawn min A withdrawn max A consumed min A consumed max
Once-though 2.17E-02 (l/kJ) 3.41E-02 (l/kJ) 2.17E-04 (l/kJ) 6.83E-04 (l/kJ)
Cooling Towers 3.40E-04 (l/kJ) 7.74E-04 (l/kJ) 3.29E-04 (l/kJ) 5.03E-04 (l/kJ)
Table 5. Representative calculated values for the parameter A

46

47
4 Water Requirements by Generation Technology _____________________________________________________________________________
4.1 Fossil Fuel Power Plants
Fossil fuel power plants burn fuels such as coal, natural gas or petroleum to generate electricity. The flue
gas from the combustion process contains different pollutants such as nitrogen oxides, sulfur oxides, fly
ash, etc. As a result, they generally require emission control systems to mitigate the environmental
impact. Fossil fuel power plants are also major emitters of carbon dioxide, a greenhouse gas contributing
to climate change. However, fossil fuels are cheap, plentiful and the technology used in fossil fuel power
plants has been used for decades. Moreover, they are still the lowest cost power plants compared to
nuclear power plants and renewable energy. In the US, fossil fuel power plants account for almost 70% of
the electricity generated (EIA, 2010) and absent any climate policy, will likely hold a similar share in the
future.
4.1.1 Pulverized coal
Figure 4-1: World Coal Consumption by Region (Source: EIA, 2010)
Currently, almost half of the electricity generated in the United States comes from coal. Coal is cheap and
abundant. In addition, because it is a domestic resource for the US, it does not create foreign energy
dependency. In emerging countries, coal is also the most commonly used fuel for power production. The
primary examples of this are China and India, with 79% and 70% of their electricity being generated from
coal (EIA, 2010). With relatively cheap coal prices and energy demand increasing, coal power plants will
continue to hold an important share of the electricity market (see Figure 4-1). Therefore, it is crucial to
understand the water consumption of this type of power plant.

48
Pulverized coal (PC) power plants use steam as the prime mover. The coal is crushed into a fine powder
and fed into the boiler. Then it is burned to heat water, which turns into steam and spins a steam turbine
driving an electrical generator to produce electricity. Once the steam goes through the turbine, it is
condensed and sent to the boiler to be heated again, closing what is known as the Rankine Cycle (see
Figure 4-2).
Figure 4-2: Schematic for PC Power Plant with cooling tower and wet FGD (NETL. DiPietro, 2009)
4.1.1.1 HR: Heat Rate of pulverized coal power plants
As explained in section 3, the amount cooling water required for a given cooling system will vary
depending on the heat rate of the power plant, which for PC typically range from 8,300 kJ/kWh to 13,300
kJ/kWh. The heat rate depends on the age of the power plant (usually newer plants use better technology
and have lower heat rates), on the power plant type – subcritical, supercritical, and ultra-supercritical and
on the coal type. These different designs operate the steam generators at different temperatures and
pressures. Supercritical and ultra-supercritical power plants use higher pressure and temperatures to lower
the heat rate achieving heat rates as low as 9,000 kJ/kWh and 8,300 kJ/kWh respectively. Thus, more
efficient supercritical and ultra-supercritical plants consume less water than subcritical plants.
In the United States, subcritical plants account for the highest percentage of pulverized coal power plants.
There are many old subcritical coal power plants that have very high heat rates (efficiencies as low as
27%). However, newer subcritical plants usually have heat rates around 9,700 kJ/kWh (37% efficiency).
There are few supercritical and ultra-supercritical power plants in the US. The heat rate average for
pulverized coal power plants is approximately 10,733 kJ/kWh (EIA, 2010). Hence, in general, coal power

49
plants have middle-of-the-road thermal efficiencies as well as moderate water consumption intensities
compared to other power plants.
4.1.1.2 B: Heat losses to other sinks in pulverized coal plants
To quantify the heat load on the cooling system, we have to understand the heat balance of the power
plant. A diagram of a typical heat balance is shown in Figure 4-3. The amount of energy necessary for
electricity generation is known by definition (3,600 kJ/kWh). Therefore, the amount of heat lost through
the flue gas and through other processes to the environment has to be identified.
Figure 4-3: Heat Balance Diagram of a typical Super Critical Pulverized Coal Power Plant with an efficiency of 36.8% (values taken from DOE/NETL, 2010)
In the case of Pulverized Coal Power Plants, the latent and sensible heat of the flue gas will vary
depending on whether there is a flue gas desulphurization (FGD) system for pollution control or not.
Below there is a comparison between the results of the DOE/NETL (2010) report, which uses an FGD
system with the ones of Ikeda et.al (2007), which does not.
With FGD: In this case, the latent heat of the flue gas is much higher than the sensible heat due to the
water evaporated in the FGD system. The FGD system is used to remove the sulfur dioxide from the
exhaust flue gas and in many countries it is required by law. There are two types of FGD systems: wet
and dry. Nevertheless, most of the power plants in the US and around the world use wet systems (see
Figure 4-4), which use a wet lime spray to remove SOX from the plant exhaust. While some of the spray
water can be recovered and recycled, a significant amount leaves the flue as vapor, cooling down the flue
gas. The flue gas leaves the FGD system at a temperature close to the saturation (wet bulb) temperature.
In the DOE/NETL report, the flue gas leaves the plant at a temperature of 57ºC, which falls into the
expected range for wet FGD systems.
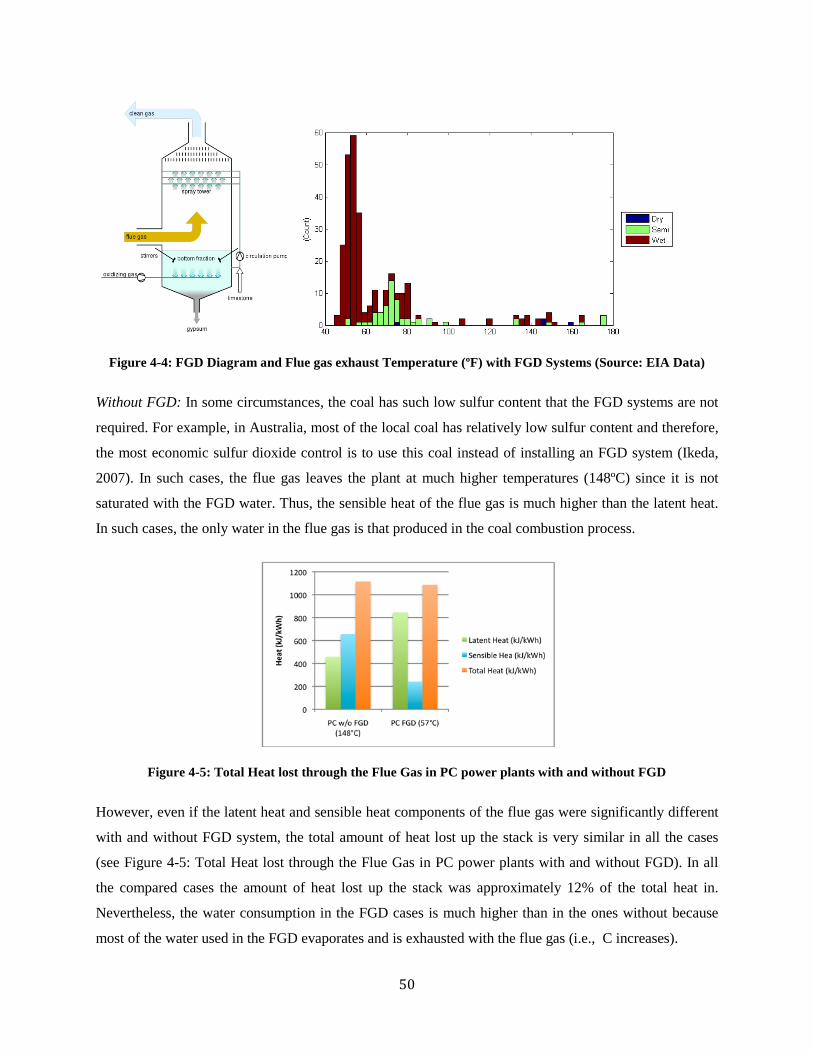
50
Figure 4-4: FGD Diagram and Flue gas exhaust Temperature (ºF) with FGD Systems (Source: EIA Data)
Without FGD: In some circumstances, the coal has such low sulfur content that the FGD systems are not
required. For example, in Australia, most of the local coal has relatively low sulfur content and therefore,
the most economic sulfur dioxide control is to use this coal instead of installing an FGD system (Ikeda,
2007). In such cases, the flue gas leaves the plant at much higher temperatures (148ºC) since it is not
saturated with the FGD water. Thus, the sensible heat of the flue gas is much higher than the latent heat.
In such cases, the only water in the flue gas is that produced in the coal combustion process.
Figure 4-5: Total Heat lost through the Flue Gas in PC power plants with and without FGD
However, even if the latent heat and sensible heat components of the flue gas were significantly different
with and without FGD system, the total amount of heat lost up the stack is very similar in all the cases
(see Figure 4-5: Total Heat lost through the Flue Gas in PC power plants with and without FGD). In all
the compared cases the amount of heat lost up the stack was approximately 12% of the total heat in.
Nevertheless, the water consumption in the FGD cases is much higher than in the ones without because
most of the water used in the FGD evaporates and is exhausted with the flue gas (i.e., C increases).

51
As discussed above, most of the processes in the power plant dissipate small amounts of heat into the
environment. However, even if these amounts of energy are small, once we add all of them, it accounts
for approximately 3%- 5% of the energy losses. These include steam turbine heat losses, generator heat
losses (which usually are about 1.5% of the power generated), etc.
Comparison of parameter B from models with field data
Different flue gas temperatures and different flue gas water content lead to different heat losses up the
stack. From the existing data of published reports based on ASPEN and other models; different B have
been calculated for further comparison with field data (see Table 5).
Table 6: Comparison of B values for pulverized coal power plants
Comparing these results with real field data from ESKOM Pulverized Coal Power Plants, which do not
use any FGD and hence C≈03, it can be observed that the parameter B is similar to those calculated from
the different model-based reports.
Figure 4-6: Pulverized Coal Water Withdrawn w/Cooling Towers (ESKOM Plant Data 2006-2011))
3 After cooling, FGD is the most water intense process in Pulverized Coal Power Plants. It can account for up to 10% of the
power plant water needs. The other process water needs can be neglected. (EPRI)
y = 0.3686x - 1931.6
0
500
1000
1500
2000
2500
3000
3500
0 2000 4000 6000 8000 10000 12000 14000
L/M
wh
Heat Rate (KJ/KWh)
Heat Rate (HR) kJ/kWh B (kJ/kWh) B – 3,600
kJ/kWh B as % of
HR (%) FGD Flue Gas T ºC
NETL Subcritical 9,788 5,155 1,555 15.9% YES 57
NETL Supercritical 9,165 5,054 1,454 15.9% YES 57
Ikeda Supercritical 8,924 5,074 1,474 16.5% NO 147
IECM Supercritical 9,381 5,344 1,627 17.3% YES 55

52
The graph’s trend-line can be fitted to find B.
Thus, B = 5,240 kJ/kWh
From those 5,240 kJ/kWh, 3,600 kJ/kWh are used to generate electricity. Therefore, ~1,640 kJ/kWh is
lost to other sinks, which is in average around 15% of the Heat Rate of the plotted power plants, a similar
value to the ones from the existing reports (see Table 5).
4.1.1.3 C: Non-cooling process water needs in pulverized coal power plants
Besides boiler water makeup, which is needed in all thermal power plants, there are some other non-
cooling processes unique to coal power plants that require water. The main one is the flue gas
desulfurization system, which accounts for about 10% of the pulverized coal water consumption. As
mentioned in section 3, most of the water used in the FGD system is evaporated once it contacts with the
flue gas, leaving the plant as vapor through the stack. A very small amount leaves the FGD unit as part of
the gypsum product; however, this quantity is almost negligible. Hence, using the Equation 11 and
stoichiometry, we can calculate the water lost up the stack. This enables the calculation of C as shown in
Table 6.
Table 7. Comparison of C values in pulverized coal power plants
4.1.2 Natural gas combined cycle
Natural gas combined cycle (NGCC) power plants offer the highest conversion efficiency and the lowest
carbon dioxide emissions for fossil fuel power plants. Because of this fact and the low gas prices due to
the increasing production of shale gas in the recent years, the use of natural gas for electricity generation
it is expected to rise in the coming years (see Figure 4-7).
y = 0.3686x −1931.6 →l
MWh= 0.3686(HR − 5240)
Coal Feed (kg/h) Calculated C1
(L/kWh)
Boiler make-up (L/kWh)
Calculated C (L/kWh)
NETL Subcritical 198,391 0.248 0.03 0.278
NETL Supercritical 185,759 0.231 0.03 0.261
IECM Supercritical 160,934 0.280 0.03 0.310
Ikeda Supercritical 126,535 0.030 0.03 0.060

53
Figure 4-7: Additions to U.S. generating capacity by fuel type in five cases, 2009-2035 (GW). (EIA Annual Energy Outlook, 2011)
NGCC power plants have an open-cycle gas turbine, which directly drives a generator to produce
electricity. The hot flue gas stream (waste heat) from the gas turbine is used to make steam to produce
additional electricity in a steam turbine (see Figure 4-8). Thus, NGCC power plants achieve very high
efficiencies.
4.1.2.1 HR: Heat Rate of NGCC power plants
As mentioned, NGCC power plants achieve high efficiencies and therefore low heat rate. The heat rate
might vary slightly depending on the gas turbine design. Generally NGCC power plants have heat rates
around 7,200 kJ/kWh (50% efficiency).
Figure 4-8: Schematic for an NGCC Power Plant with cooling tower (NETL. DiPietro, 2009)

54
4.1.2.2 B: Heat losses to other sinks in NGCC power plants
Besides the amount of energy necessary for electricity generation (3,600 kJ/kWh) and the other process
losses (3% of HR) common in all power plants, the parameter B also includes the heat lost through the
flue gas, which causes the variability among the different power plants as discussed below.
Approximately 70% of the total power output in NGCC power plants is generated by the gas turbine
(Black, 2010). The gas turbine operates in open cycle and the flue gas mass flow rate is higher than in a
PC power plant. In addition, since there is no FGD system that saturates the flue gas and cools it down,
the exit temperature of the flue gas is higher. Consequently, the amount of heat lost up the stack is almost
double than in PC power plants (see Figure 4-9).
Figure 4-9: Heat Balance Diagram of a typical NGCC Power Plant with an efficiency of 50.2 % (values taken from DOE/NETL, 2010)
Thus, in NGCC cases the parameter B is relatively higher than in PC cases (See Table 7). In addition to
that, NGCC heat rate values are low, which means that the remaining heat to be dissipated through the
cooling system is small compared to the other power plants. As shown in Figure 4-9, the blue arrow,
which represents the heat to the cooling system, is considerably thinner than in Figure 4-3.
Table 8. Comparison of B values for NGCC power plants
4.1.2.3 C: Non-cooling process water needs in NGCC power plants
NGCC power plants do not require FGD Systems and therefore, they do not consume the significant
amount of water that is needed to operate these emission control systems. The only water required for the
production of electricity besides cooling water is the make-up water for the boiler, which is not a
Heat Rate (HR) kJ/kWh B (kJ/kWh) B – 3,600
kJ/kWh B as % of
HR (%) Flue Gas T
ºC
NETL NGCC 7,172 5,235 1,633 22.8% 132
Ikeda NGCC 6,797 5,163 1,561 23% 101
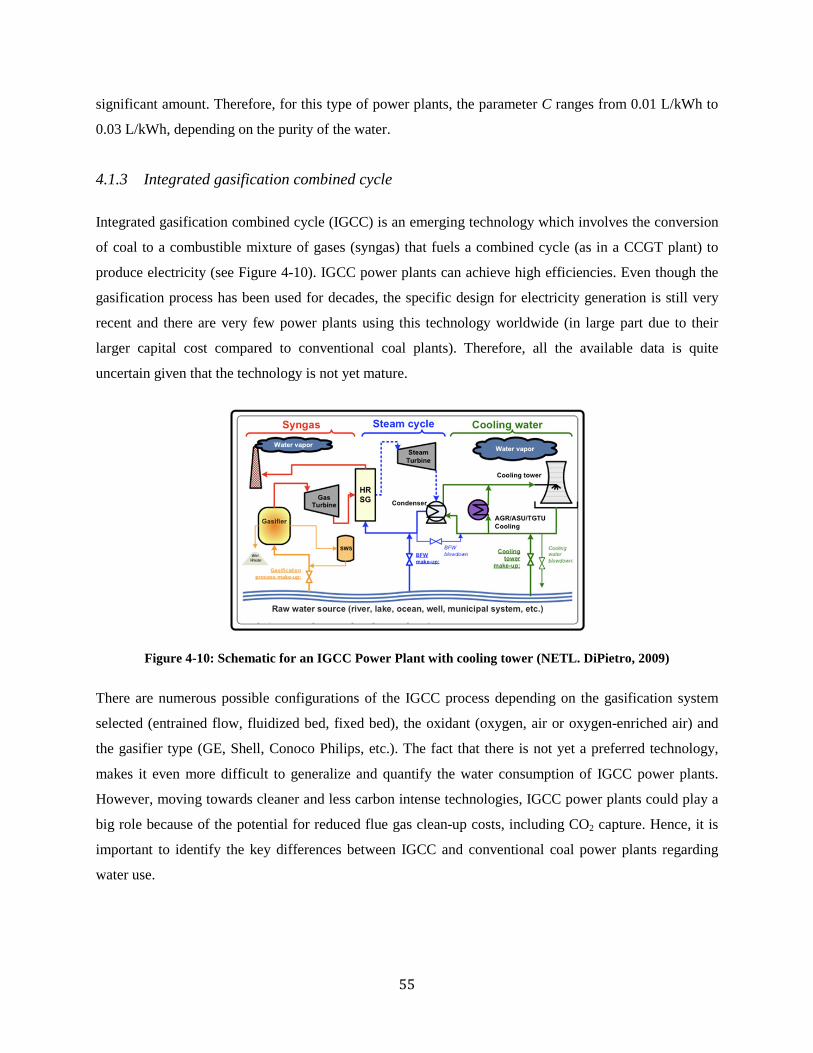
55
significant amount. Therefore, for this type of power plants, the parameter C ranges from 0.01 L/kWh to
0.03 L/kWh, depending on the purity of the water.
4.1.3 Integrated gasification combined cycle
Integrated gasification combined cycle (IGCC) is an emerging technology which involves the conversion
of coal to a combustible mixture of gases (syngas) that fuels a combined cycle (as in a CCGT plant) to
produce electricity (see Figure 4-10). IGCC power plants can achieve high efficiencies. Even though the
gasification process has been used for decades, the specific design for electricity generation is still very
recent and there are very few power plants using this technology worldwide (in large part due to their
larger capital cost compared to conventional coal plants). Therefore, all the available data is quite
uncertain given that the technology is not yet mature.
Figure 4-10: Schematic for an IGCC Power Plant with cooling tower (NETL. DiPietro, 2009)
There are numerous possible configurations of the IGCC process depending on the gasification system
selected (entrained flow, fluidized bed, fixed bed), the oxidant (oxygen, air or oxygen-enriched air) and
the gasifier type (GE, Shell, Conoco Philips, etc.). The fact that there is not yet a preferred technology,
makes it even more difficult to generalize and quantify the water consumption of IGCC power plants.
However, moving towards cleaner and less carbon intense technologies, IGCC power plants could play a
big role because of the potential for reduced flue gas clean-up costs, including CO2 capture. Hence, it is
important to identify the key differences between IGCC and conventional coal power plants regarding
water use.

56
4.1.3.1 HR: Heat Rate of IGCC power plants
Due to the combined cycle and the fact that al the IGCC plants are new, IGCC power plants can achieve
lower heat rates than conventional coal plants. Heat rates range from 9,200 kJ/kWh to 8,100 kJ/kWh.
4.1.3.2 B: Heat losses to other sinks in IGCC power plants
Besides the amount of energy necessary for electricity generation (3,600 kJ/kWh) and the other process
losses (5% of HR) common in all power plants, the parameter B also includes the heat lost through the
flue gas, which causes the variability among the different power plants as discussed below. The heat
dissipated through the flue gas is higher in IGCC power plants than in PC power plants. The main reason
is the flue gas higher temperature (sensible heat). In IGCC cases, there is no need for FGD systems
(pollutants are removed before combustion), which were the cause of the low exhaust gas temperature in
PC cases. Moreover, similarly than in the NGCC cases, the mass flow of the flue gas is higher for IGCC
and therefore more heat is rejected to the environment through the stack .
Figure 4-11: Heat Balance Diagram of a typical IGCC Power Plant with an efficiency of 39% (values taken from DOE/NETL, 2010)
In Table 8 we can find different calculated values for the B parameter. As shown, the amount heat lost to
other sinks is comparable to the one of NGCC power plants. However, since the heat rate for IGCC is
higher, IGCC plants consume higher amounts of water for cooling.
Table 9. Comparison of B values for IGCC power plants
Heat Rate (HR) kJ/kWh B (kJ/kWh) B – 3,600
kJ/kWh B as % of HR (%) Flue Gas T ºC
NETL IGCC GE 9,239 5,583 1,982 21.2% 132
NETL IGCC Conoco Philips 9,058 5,744 2,144 23.7% 132
Ikeda IGCC Conoco Philips 9,246 5,680 2,081 22.5% 132
EIAGHG IGCC GE 9,474 5,664 2,064 21.8% 129

57
4.1.3.3 C: Non-cooling process water needs in IGCC power plants
Besides the water needed for the boiler make-up, a significant amount of water is needed for other
processes in the plant. One of the main one is the gasification process, where coal, oxygen and steam
(water) react to produce the syngas.
C +H2O CO + H2
In the IGCC realm, process water use can include humidification, dilution, water gas shift, and slurry,
slag and ash handling, so there is significant variation among the various models. For example, in IGCC
GE Power plants water is required for the syngas quench process. The syngas exists the gasifier reactor at
a significant high temperature (around 1500ºC). It is necessary to bring down the temperature of the
syngas to protect downstream process equipment. Basically, what all these processes do is to add water
into the flue gas. Since most of the water is condensed in different processes and reused in the plant, the
simplest way to calculate the water consumption regardless of the IGCC tyepe of technology, is using the
following formula (Equation 11 described in Section 3) instead of delving into the details of the processes
(see Table 9). As explained earlier, this equation calculates the amount of water lost up the stack that was
not produced in the combustion process (i.e. all the water added along the way in all the different
processes).
C1 = mwater (L/kWh) – mwater_CP (L/kWh)
Table 10: Comparison of C values for IGCC power plants
4.1.4 Carbon capture and sequestration
The world is moving towards “clean energies” to try to mitigate global warming and to preserve the
environment. The US Government is implementing many policies to foster not only renewable energies
but also other alternatives that would decrease carbon emissions. Carbon Capture and Storage could be an
option to still use cheap and abundant fossil fuels to continue leveraging all its benefits and at the same
time to lower the CO2 emissions. CCS could solve the problem of not only power plants but also of many
industries that burn fossils in their manufacturing processes.
Coal Feed (kg/h)
Calculated C1 (L/kWh)
Boiler make-up (L/kWh)
Calculated C (L/kWh)
NETL IGCC GE 622MW 211,783 0.115 0.03 0.118
NETL IGCC Conoco Philips 625 MW 208,634 0.205 0.03 0.208
Ikeda IGCC Conoco Philips 520 MW 196,890 0.129 0.03 0.132

58
However, as the water-energy nexus has gained attention worldwide, carbon capture and storage (CCS)
has been subject to water use analyses, and the results suggest a water consumption intensity almost
double that of a non-CCS plant. In some regions, as discussed in the introduction, this presents a
significant barrier to CCS deployment (to be added to the list of more commonly cited barriers: cost,
technology immaturity, legal uncertainties, and lack of strong carbon policies). We therefore sought to
understand more exactly what is causing such an increase in water use and consumption when CCS is
implemented, and what the implications are both for retrofits and new plants.
4.1.4.1 HR: Heat Rate of power plants with carbon capture and sequestration
One of the main drawbacks of carbon capture is the drop in efficiency (increase in heat rate). When
carbon capture is added, efficiency decreases and therefore we need more fuel input to achieve the same
electricity output. In post-combustion carbon capture, the main reason why efficiency is affected is due to
the extracted heat from the steam electric cycle (low pressure steam from the turbine) to heat the solvent
(amine) in order to release the captured CO2. In addition, the efficiency is penalized by the need to run
auxiliary equipment such as pumps, fans and compressors for the CO2 capture stream.
In Figure 4-12 we can find typical heat rates for different power plant types, with and without CCS.
Although heat rates can vary slightly depending on the technology, the take away from this graph is that
power plant’s heat rate increases substantially when carbon capture is added to the plant.
Since, as explained in Section 3, water consumption is highly related to heat rate, water withdrawal is
higher in CCS power plants mainly because of the efficiency reduction; process and cooling water uses
independent of efficiency are all but negligible.
Figure 4-12: Comparison of Heat Rates (HHV) with and without CC. (DOE/NETL, 2010)
0
2,000
4,000
6,000
8,000
10,000
12,000
14,000
PC IGCC GE IGCC Shell NGCC
Heat
Rat
e (k
J/kW
h)
wo/CCS
w/CCS

59
4.1.4.2 B: Heat losses to other sinks in power plants with CCS: CO2 Stream
The CO2 is captured in liquid form and, as we mentioned earlier, the reference state of the model is HHV.
Therefore, we have to take into account this enthalpy change of the CO2, which results in a positive sign
in the equation because the CO2 leaves essentially as a liquid. Hence, the heat to be rejected through the
cooling system will be:
Heat to cooling = HR - Flue gas losses – Other losses + CO2 Stream (See Figure 4-13)
However, this extra heat that has to be dissipated due to the carbon capture process is very small, as
shown in the following example. The example is calculated from data of a 550 MW Subcritical Power
Plant (DOE/NETL, 2010). The heat rate of the power plant is given below. The captured CO2 stream is
given in the report and is equal to 595,978 kg/h. The enthalpy change between CO2 at (25°C, 1 bar) and
(25°C, 100 bar – liquid state) is 250 kJ/kg CO2
Pulverized Coal with CCS NGCC with CCS
HR = 13,763kJ
kWh
595,978kgCO2
h× 250
kJkgCO2
= 148,995,500kJh→ CO2stream = 271
kJkWh
→ 2%of HR

60
IGCC with CCS
Figure 4-13: Heat Balance Diagram of different power plants with (values taken from DOE/NETL, 2010)
Besides the amount of energy necessary for electricity generation (3,600 kJ/kWh) and the other process
losses (3% of HR) common in all power plants, the parameter B also includes the heat lost through the
flue gas. As shown in Figure 4-13, the amount of heat lost up the stack in post-combustion capture cases
(PC and NGCC) varies significantly compared to pre-combustion capture cases (IGCC). The main
differences are explained below.
4.1.4.3 B: Heat losses to other sinks in PC and NGCC power plants with CCS
The heat lost through the flue gas is much smaller with CCS than without. This is mainly due to two
reasons:
First of all, the flue gas exit temperature is considerably lower, which means that the sensible heat part of
the flue gas will decrease too. When post combustion carbon capture technologies are incorporated in the
power plant, the temperature of the flue gas needs to be lowered before it enters the amine system (to
guarantee acceptable absorption efficiencies). This is done by spraying it with a recirculating water
stream in a direct contact cooler (DCC). Moreover, to minimize amine losses, there is a water wash
section at the top of the absorber column. The flue gas is sprayed with water to remove most of the lean
solvent that would otherwise leave the plant evaporated in the flue gas (see Figure 4-14). This decreases
substantially the flue gas temperature to 32ºC .
Secondly, the latent heat part of the flue gas is also lower because the water content of the flue gas exiting
the plant has decreased. The flue gas gets cooled down by spraying water on top of it. However, all the
sprayed water plus most of the water suspended in the flue gas (FGD water and combustion water) gets
condensed and recycled in the power plant. The flue gas leaves the power plant saturated. At saturated
conditions, lower temperature flue gas will contain less water than higher temperature flue gas. In the

61
CCS case, the flue gas leaves at much lower temperature. Hence, all the latent heat that accounted for in
the case without carbon capture is almost nonexistent in this one.
Figure 4-14: Typical Econamine FG+ Carbon Capture Process. (Source: Fluor website4)
Thus, the heat lost through to other sinks for PC and NGCC power plants with CCS decreases from 17%
to 6% and from 23% to 6% of the energy input respectively (see Table 10). This means that more heat has
to be rejected to the environment through the cooling system, which consequently means that more
cooling water is required. On the other hand, since most of the water in the flue gas is recovered, the
parameter C will decrease too, offsetting the total water consumption. This is explained in more detail in
the following section.
Table 11: Comparison of B values for pulverized coal and NGCC plants with CCS
4 http://www.fluor.com/econamine/Pages/efgprocess.aspx
Heat Rate (HR) kJ/kWh B (kJ/kWh) B – 3,600
kJ/kWh B as % of
HR (%) Flue Gas T
ºC
NETL Subcritical PC w/CCS 13,763 4,413 813 5.9% 32
NETL Supercritical PC w/CCS 12,662 4,348 748 5.9% 32
NETL NGCC w/CCS 8,406 4,112 513 6.1% 30
DCC
Water Wash

62
4.1.4.4 B: Heat losses to other sinks in IGCC power plants with CCS
As in the case without CCS, the sensible heat of the flue gas in IGCC power plants it is higher than in PC
power plants because the temperature of the flue gas is higher too (132ºC compared to 32ºC); which
means that more heat is lost up the stack.
Moreover, in IGCC with CCS cases, to facilitate the capture of the CO2 only hydrogen is burnt and as a
result there is a higher amount of water in the product of the combustion process. Therefore, the water
content of the flue gas is higher than in non-CCS cases, and consequently, the latent heat part is larger too
(see Figure 4-15).
Figure 4-15: Total Heat lost through the Flue Gas in IGCC power plants with and without CCS
Thus, for IGCC power plants with CCS, the parameter B is higher, which means that less heat has to be
dissipated through the cooling system, and less water is required for cooling purposes compared to PC
CCS power plants with the same heat rate (see Table 11).
Table 12: B values for IGCC plants with CCS
4.1.4.5 C: Non-cooling process water needs in PC and NGCC power plants with CCS
As explained previously, due to the direct contact cooler and the water wash section, most of the water
vapor in the flue gas condenses and it is recovered. This includes the water used in the FGD system for
Heat Rate (HR) kJ/kWh B (kJ/kWh) B – 3,600
kJ/kWh B as % of
HR (%) Flue Gas T
ºC
NETL IGCC GE w/CCS 11,034 6,095 2,495 22.6% 132
NETL IGCC Conoco P. w/CCS 11,604 6,257 2,657 22.9% 132
Ikeda IGCC Conoco P. w/CCS 10,506 6,159 2,559 24% 96

63
PC cases and some water from the combustion process. The condensed water is usually re-used in the
power plant after treatment.
Therefore, even if the parameter B is smaller than in the case with no CCS (less heat is dissipated through
the flue gas), which means that more water will be needed for cooling purposes, C is smaller too, which
means that less water is required for other processes in the plant. In many cases, C will even be negative
(see Table 12) because most of the water in the flue gas is recovered. As mentioned earlier, a portion of
the water suspended in the flue gas is originated in the combustion process, and therefore, if it is
recovered, is an amount that has to be accounted as negative since it never entered the system in liquid
form (it was not withdrawn form a water body).
Table 13: Comparison of C values for pulverized coal plants with CCS
4.1.4.6 C: Non-cooling process water needs in IGCC power plants with CCS
In IGCC Plants with CCS one extra process is added to capture the CO2. This process is the water gas
shift (WGS) and it is water intensive due to the following reaction, where carbon monoxide reacts with
water vapor to form carbon dioxide (which is captured) and hydrogen (which is burnt).
This process specific to the CCS case and the ones explained in section 4.1.3, add a significant amount of
water in the flue gas. Hence, the amount of heat rejected through the stack is large due to the high latent
heat (the parameter B is high). However, all that water evaporated in the flue gas, leaves the plant and
therefore should be accounted as consumed. Thus, the parameter C for IGCC power plants is also high
(see Table 13).
Coal Feed (kg/h)
Calculated C1
(L/kWh)
Boiler make-up (L/kWh)
Calculated C (L/kWh)
NETL Subcritical PC w/CCS 278,965 -0.100 0.03 -0.097
NETL Supercritical PC w/CCS 256,652 -0.092 0.03 -0.089

64
Table 14: Comparison of C values
Retrofitting Power Plants with CCS
The fact that the heat rate increases is the main cause of higher water use intensity values in CCS plants
has significant implications. A new plant with CCS requires higher fuel input to produce 500 MW
compared to its counterpart without carbon capture. Since the required input fuel is higher per kWh, the
cooling water will also increase per kWh since there is more heat that has to be dissipated. For new CCS
power plants, water withdrawal and consumption per kWh could be the 80-90% higher than non-CCS that
is cited in the studies.
For existing power plants retrofitted with CCS, however, the absolute water use would not increase by the
same factors. When carbon capture is added to an existing plant, efficiency decreases, and therefore the
net electricity output will be lower (as opposed to higher fuel inputs in the case above). Retrofitting a
plant with CCS, would likely include some combination of capacity derating and the upgrade of older,
less efficient components. In absolute terms, then, the retrofitted plant would consume considerably less
than double what it consumed before retrofitting.
Figure 4-16: Absolute increase in water consumption for a retrofitted PC Power Plant ( values taken from EPRI, 2010; NETL, 2010)
Coal Feed (kg/h)
Calculated C1 (L/kWh)
Boiler make-up (L/kWh)
Calculated C (L/kWh)
NETL IGCC GE w/CCS 220,904 0.401 0.03 0.404
NETL IGCC Conoco P. w/CCS 219,635 0.437 0.03 0.440
Ikeda IGCC Conoco P. w/CCS 210,931 0.428 0.03 0.431

65
Therefore, in terms of absolute water use, the increase for plants retrofitted with CCS will not be as
significant as the water intensity factors suggest. For example, as shown in Figure 4-16, for a given
Pulverized Coal power plant, the total water consumption will increase around 30%. It can be observed
that this is highly related to the efficiency penalty, which also varies (in this case, decreases) around 30%.
Some articles and reports ignore this issue and focus only on the 80-90% increase in water use intensity
factors. However, it is important to make the distinction because, as it was just explained, should the plant
be retrofitted, the absolute water consumption impacts will not be that severe. This observation is very
important given that there are around 388 units in the US that could potentially be retrofitted in a future
carbon constrained scenario (EPRI, 2009). This information should be incorporated in any future policy
and economic considerations since, for a specific existing power plant, the absolute water use values are
the numbers that matter most with regard to regional water availability concerns. Moreover, depending on
how the lost power is made up for (gas, nuclear, coal, etc.), the overall water consumption will vary
considerably.
4.2 Nuclear
Nuclear energy generates 20% of the electricity in the US (EIA, 2010), accounting therefore for the
largest power generation technology with near zero carbon emissions. Currently, there are 103
commercial nuclear reactors in operation in the U.S. Nuclear energy was expected to play a big role in the
transition towards cleaner technologies. However, new nuclear is currently considered too expensive for
the US given a lack of climate policy as well as low natural gas prices. Due to the breakdown of the
Fukushima power plant in the summer of 2011, public opposition has increased.
Figure 4-17: Schematic for a Nuclear Power Plant with cooling tower (NETL. DiPietro, 2009)

66
Nuclear power plants, like pulverized coal power plants, use the steam cycle to generate electricity. In this
case the energy source is uranium instead of coal, but the principle is the same. Pressurized water is
heated by the energy from the decay of the uranium, which is then used to heat water to produce steam for
the steam cycle (see Figure 4-17).
4.2.1 HR: Heat Rate of nuclear power plants
Nuclear power plants are designed to operate at lower temperatures and pressures than pulverized coal
power plants for safety reasons. Thus, the heat rates are somewhat higher than coal. Heat rates range from
10,000 kJ/kWh to 12,400 kJ/kWh depending on the reactor type; however, global averages are around
11,225 kJ/kWh (32% efficiency).
4.2.2 B: Heat losses to other sinks in nuclear power plants
In nuclear power plants there is no heat lost up the stack because there is no combustion process and
therefore there is no flue gas. Thus, almost all the waste heat has to be rejected through the cooling
system (see Figure 4-18). The parameter B is therefore lower than for all the previously explained cases.
B is approximately 4,200 kJ/kWh (3,600 kJ/kWh for electricity and around 600 kJ/kWh for other process
losses).
Figure 4-18: Heat Balance Diagram of a typical Nuclear Power Plant with an efficiency of 32%
4.2.3 C: Non-cooling process water needs in nuclear power plants
Nuclear power plants virtually do not require any water besides the boiler water make-up. The parameter
C is small compared to PC with wet FGD Systems. Hence, even if the “B” parameter is smaller as
explained in the previous section, which means that more water is required for cooling purposes, the
parameter “C” is smaller too, which means that less water is required for other processes in the plant. The
67
total water consumption intensity of nuclear generation with once-through or wet-tower cooling is
therefore somewhat higher than coal, offset slightly by the fact that nuclear plants have no significant
non-cooling process water uses.
On the other hand, nuclear power plants need to have available large quantities of water for the
emergency core cooling systems. If an accident occurs, water is needed to remove the decay heat
generated by the reactor core and to cool down the equipment.
4.3 Solar thermal
Solar thermal, or Concentrated Solar Power (CSP) plants use the energy from the sun to generate
electricity. These plants use mirrors to redirect sunlight and heat a fluid to eventually spin the
generator/engine to produce power. There are four main concentrated solar power plant types: linear
Fresnel, parabolic troughs, power towers, and dish/engines. Dish/engine systems use Stirling cycle
engines powered by the sunlight and using hydrogen as the working fluid to generate electricity.
Therefore, they do not need any water for cooling. The other three types of CSP plants have a steam cycle
using the heat from the sun as the energy source and hence, will require a cooling system.
The efficiencies of steam cycle CSP plants are at best comparable to that of nuclear plants. For example,
linear Fresnel and parabolic troughs CSP, which have lower concentration ratios, have Rankine Cycle
efficiencies of approximately 25% (HR of 14,400 kJ/kWh) and power tower CSP, which have a much
higher concentration ratio, can reach efficiencies from 30% to 40% (HR from 9,000 kJ/kWh to 12,000
kJ/kWh). However, because solar thermal plants start up and shut down on a daily basis, they operate off-
design more often than nuclear plants, resulting in average efficiencies that are significantly lower and
thus requiring higher amounts of water for cooling.
Currently, all the commercial scale CSP power plants in the US use parabolic trough systems and all of
them use wet cooling towers as the cooling system. However, water scarcity is increasingly becoming a
problem, especially in arid areas, which are the most suited for solar thermal power generation. Therefore,
most of the new CSP power plants accepted by the DOE are going to employ dry cooling, which further
lowers the power plant efficiency and increases cost.
All designs of solar thermal power plants use a small amount of water for mirror washing, but the
quantity of water involved is two orders of magnitude below that required for wet tower cooling. Like in
other thermal power plants, some water is required for the boiler water make up. Existing studies report

68
water requirements ranging from 0.070 L/kWh to 0.350 L/kWh for the parameter C (see general
bibliography) Regarding the parameter B, since there is no combustion process, virtually all the waste
heat has to be rejected to the environment through the cooling system, and thus, B will have values
slightly over 3,600 kJ/kWh.
Figure 4-19: Solar Thermal Power Plant. Power Tower Type
4.4 Geothermal
Geothermal power plants generate electricity from the thermal energy generated and stored in the Earth.
Currently, geothermal power plants are used in 24 different countries accounting for a total installed
capacity of 10,715 MW. The country with the largest installed capacity is the US (3,086 MW), followed
by the Philippines and Indonesia (Geothermal Energy Association, 2010).
Geothermal power is sort of an oddball technology in the context of water. Geothermal power
encompasses several subtypes, at various levels of maturity and having drastically different implications
for water use. The two main categories discussed are “hydrothermal” geothermal (Flash and Binary), and
“enhanced” geothermal, also called “hot dry rock” geothermal. Both hydrothermal and enhanced
geothermal use some form of Rankine cycle, and thus, require a cooling system.
Since geothermal plant efficiencies are very low (due to relatively low source temperatures compared to
fossil fuel plants), the amounts of water required for wet-tower or once-through cooling systems are very
high; many geothermal plants are therefore dry-cooled. For example, for binary power plants, efficiencies
go from 5% to 13%, which means that heat rates range from 27,700 kJ/kWh to 72,000 kJ/kWh (MIT,
2006).
Hydrothermal geothermal power, a relatively mature technology, uses hot pressurized water from deep
brine aquifers to drive either a “flash” steam cycle or a “binary cycle.” A binary cycle is similar to a
steam cycle, but uses a working fluid with a lower boiling point than water. As with other steam-cycle
technologies, cooling is a major consideration with respect to hydrothermal water use. Binary cycle

69
geothermal plants are often dry cooled. Flash steam geothermal plants, however, have a built-in source of
water for cooling tower makeup – the condensate from the steam cycle, which originates in the brine
aquifer. The water withdrawn and consumed in flash steam geothermal plants comes from an inherently
non-freshwater source, so is often accounted as negligible water use. There is also a third type, called dry
steam geothermal power plants, which directly use geothermal steam to spin the steam turbines and
generate electricity. This type of plant does not consume any water.
Figure 4-20: Diagram of a Flash Steam Cycle (left) and a Binary Cycle (right) (Source: TechnologyStudent)
Enhanced geothermal, an emerging technology, entails hydraulic fracturing of a hot dry rock formation,
followed by injection of water to create a closed-loop binary cycle power plant. Unlike hydrothermal
systems, there is no pre-existing water in the formation, so any water used for cooling must be accounted
for. Even if a dry cooling system is used, there is a non-cooling water consumption requirement: the
leakage loss of water that permeates the rock formation and must be made up to maintain pressure.
Estimates of rock formation losses in enhanced geothermal power vary widely, from basically negligible
to substantially higher than cooling tower evaporation losses.

70
Figure 4-21: Diagram of an Enhanced Geothermal Power Plant (Source: Science.org Australia)

71
5 Model validation and limitations ______________________________________________________________________________
5.1 Limitations of the model
One of the most important parameters of the model to estimate water use (consumption and withdrawal)
in power plants is the heat rate (HR) of the plant. As shown in the previous chapters, heat rate, and not the
technology used, explains most of the variations between water use. In the formulation of the model we
have assumed that the heat rate of the power plant is constant and that by using the reported efficiency of
the power plant we can get a good estimation of the water required in the plant. However, many power
plants cycle and reduce their power output depending on electricity demand. Cycling power plants has an
impact on heat rate: at some point heat rate increases when power output decreases (Figure 5-1 shows an
example of a heat rate curve for a coal-fired power plant). With future higher penetration of intermittent
renewables, power plants will have to cycle more often, which will affect their heat rate and in turn, water
use will vary. As we know now, the higher the heat rate, the higher the water requirement. Thus, if a
power plant is required to cycle, it most likely will need more water than the same plant running at
constant maximum power output. Therefore, it is important to understand this limitation of the model
when we are using a given efficiency of the power plant. When data is available, using the yearly average
heat rate would be more suitable to achieve better estimation results.
Figure 5-1. Example Coal-Fired Power Plant Heat Rate vs. Load Curve (Source: MIT Energy Initiative, 2011)

72
5.2 Validation of the model
The model may be applied to get a very good estimation of regional water use once the input parameters
of the region of interest are well-characterized (ambient conditions) and there is enough information about
the power plants performance (heat rate and water used in other processes than cooling “C”) and cooling
system type. Alternatively, the model can be used to get a fair estimation of water use when not all the
input parameters are known by using standard values for the missing ones. As a preliminary validation of
this approach, field data from Eskom, a public utility company in South Africa, has been compared to the
results of the model.
South Africa is a water-scarce nation and Eskom has always been comprehensive in generating power
without wasting this highly needed resource. Eskom is a pioneer of using dry and hybrid cooling and
unlike many plants in the US, it has been keeping track of water use at each of their power plants. Eskom
provided us with water and operational data from 9 pulverized coal power plants: 6 of them using wet
cooling systems, 2 using dry cooling systems and 1 using hybrid system (see Table 14). The data set was
very useful to validate the output generated by the model since it included information about cooling type,
number of cycles of concentration (ncc), monthly heat rate (HR), monthly water withdrawals (l) and
monthly power output (MWh). All Eskom plants follow a policy of zero liquid discharge, so water
withdrawal and consumption are identical. Moreover, none of the plants run flue gas desulfurization
systems, which simplifies the estimation of non-cooling process water use.
Table 15. Coal-fired power plants in the Eskom data set, with median values of heat rate and water consumption intensity
Plant Cooling System Type Heat Rate (kJ/kWh)
Water Consumption (L/MWh)
Arnot Wet tower (ncc = 20) 11,030 2,074
Duvha Wet tower (ncc = 20) 10,686 2,005
Hendrina Wet tower (ncc = 20) 11,747 2,327
Kendal Indirect dry 11,002 136
Matla Wet tower (ncc = 14) 10,265 1,994
Lethabo Wet tower (ncc = 39) 10,308 1,819
Matimba Direct dry 10,670 106
Tutuka Wet tower (ncc = 39) 10,230 1,915

73
For the field data sample, monthly water withdrawals (l/MWh) were calculated by dividing the water data
(l) over the power output data (MWh) for each month. For the model estimation, recall (see section 3.3
equation 3) that water used in a power plant is given by:
𝐼 = 𝐴(𝐻𝑅 − 𝐵) + 𝐶
Where A is the water required per unit of energy to be dissipated and depends on the cooling system type
(L/kJ), HR is the heat rate of the power plant (kJ/kWh), B is the heat that is rejected to the environment to
other sinks than the cooling system (kJ/kWh), and C the water used in other processes in the power plant
(L/kWh). To convert to L/MWh, we will have to multiply the final results from the model (L/kWh) by
1,000.
For wet cooling towers the parameter A (see section 3.3 equation 10) for water consumed is:
Where ksens is the fraction of cooling load rejected through sensible heat transfer, ρw is the density of water
(1kg/l) and hfg is the latent heat of vaporization of water (2,454 kJ/kg at 20°C). kbd is the fraction of
blowdown discharged to the watershed and ncc is the number of cooling tower cycles of concentration.
The value of ncc was given for each power plant, kbd is zero, since all plants follow a zero liquid discharge
policy and ksens was given a value of 15%, which would be typical for a wet-cooled coal plant in a dry
location (Rutberg, 2012).
The parameter HR (heat rate) was given for each plant month by month. The parameter B includes 3,600
kJ/kWh of heat that is contained in the electricity generated plus all the heat that is rejected to the
environment through the flue gas and other heat losses. For this case, since the plants are sub-critical
power plants, a standard value of 15.5% of heat rate was given to the other losses (see section 4.1.1
Pulverized coal for more information). Thus, for this case: B = 3,600 kJ/kWh + HR x 0.155 kJ/kWh. The
parameter C has been given a standard value of 0.1 (l/kWh). The power plants of the data set do not have
an FGD system. The value of 0.1 (l/kWh) was chosen more or less in the middle of the values found in
the literature for PC power plants without FGD (0.06 l/kWh) and the ones of the field data from the two
dry-cooled plants (0.106 l/kWh and 0.136 l/kWh).
It is encouraging to see that, even using standard values for C, B and ksens,, the agreement of the model
values with field data values is reasonably good (see Figure 5-2), especially when looking at yearly
average values for each plant (see Figure 5-3). If values for the parameters, would be calculated
ACT _ C =1− ksens( )ρwhfg
1+1− kbd
ncc −1

74
specifically for each power plant, we would get better estimates. However, as expected, since the heat rate
explains much of the variation in water use, we can get a good estimate of water use in power plants using
the model by knowing the heat rate, even if not all the variables are fine-tuned.
Figure 5-2. Comparison of water withdrawn from field data (horizontal axis) with model results (vertical
axis) (monthly data from 2006 to 2010)
Figure 5-3. Comparison of water withdrawn from field data (horizontal axis) with model results (vertical
axis). Only average yearly data from 2006 to 2010
1,500
1,700
1,900
2,100
2,300
2,500
2,700
1,500 2,000 2,500
Wat
er W
ithdr
awn
Cal
cula
ted
by M
odel
(L
/MW
h)
Water Withdrawn Reported (L/MWh)
Average Arnot Dhuva HendrinaMatla Lethabo Tutuka
1,500
1,700
1,900
2,100
2,300
2,500
2,700
1,500 1,700 1,900 2,100 2,300 2,500 2,700
Wat
er W
ithdr
awn
Cal
cula
ted
by
Mod
el (L
/MW
h)
Water Withdrawn Reported (L/MWh)

75
6 Alternatives to reduce freshwater use in power plants _____________________________________________________________________________
6.1 Introduction
One of the advantages of the model is that it helps to easily identify what drives water use in a power
plant. Therefore, it is very useful to determine where actions can be taken to reduce water withdrawal and
use.
If we look at the formulation of the model I =( HR – B ) + C and we want to minimize the water used per
MWh ( ) , then:
Ideally, A, which represents the water needed per unit of energy rejected through the cooling system
(L/kJ) should be zero or as close to zero as possible. As it was explained in chapter 3, the value of A
depends on the cooling system used in the power plant. Thus, the use of alternative cooling systems that
require almost no water would reduce considerably water use in the power sector. This is explained in
section 6.2 on Alternative Cooling Systems.
Another way to minimize water use in power plants is reducing the amount of heat to be dissipated
through the cooling system (HR-B). This can be done either by 1) decreasing the heat rate (HR), 2)
increasing B or 3) both. The heat rate varies depending on different characteristics of the plant such as age
(usually, the older the plant, the higher the heat rate), efficiency of the boiler, etc. and on the power plant
type. A lower heat rate means less waste heat to be rejected and thus less cooling water required per kWh
generated and therefore, shifting from old power plants to new and more efficient plants such as NGCC
power plants would reduce water use in the power sector.
The parameter B represents all the other heat that is not rejected to the environment through the cooling
system (including the electricity stream, flue gas, process losses, etc. See chapter 3 for more information).
Thus, the bigger the B, the smaller the waste heat that needs to be rejected through the cooling system;
I
0 ≈ A(HR − B) + CA ≈ 0
orHR − B = 0 → HR = B
andC ≈ 0

76
and therefore, less cooling water is required per kWh produced. One way to increase B is taking some of
the heat that is now being lost through the cooling system and re-using it. This is what it is done in
combine heat and power (CHP) plants. As shown in the diagram below (Figure 6-1), in a traditional
power plant (bottom right diagram) the heat losses are significant, and most of that heat goes to the
cooling system. However, in CHP (left diagram), the heat that had to be dissipated through the cooling
system is now being used to meet the heat demand and a smaller portion remains as lost. Hence, the
cooling duty will be reduced significantly. CHP is explained further in section 6.3.1.
Figure 6-1. Sankey Diagram of CHP and conventional power plants. Source: UK’s Department for Environment, Food and Rural Affairs
Finally, to reduce I we would also need to minimize the amount of water used in other processes within
the power plant (parameter C). For example, using dry FGD in pulverized coal power plants or recovering
the water evaporated in the flue gas would reduce C. Usually the parameter C is small compared to the
overall water use in the power plant (approximately 1/10) (see chapter 3). However, in arid areas, where
dry cooling might be implemented, the parameter C becomes the one that drives water use; therefore, it is
also important to take it into account. Other examples on how to reduce water use in other power plant’s
processes can be found in section 6.4 Reducing water used in other power plant processes.
Water use most of the times matters when the water being used by the power sector is freshwater,
competing with irrigation and municipal supply. Therefore, if power plants use alternative water sources
such as saline aquifers or waste water, the impact is mitigated. Government and the private sector are
already trying to identify those alternative water sources and their potential for the future.
6.2 Alternative Cooling Systems
Alternative cooling systems are increasingly popular in the US, not only in arid regions such as the West
and Southwest, where water shortages are frequent and competition for water becomes an issue for power

77
plant sitting and permit approval, but also in areas where water is plentiful, such as the Northeast. These
have been driven by regulatory concerns focused on the impact mitigation on aquatic organisms and
thermal plumes rather than water conservation. Almost half of the existing and proposed dry cooling
systems are east of the Mississippi river and most of them, for example, are in New York, Massachusetts
and Pennsylvania, which do not have arid climates (UCS, 2011). These alternative cooling systems offer
significant opportunities for water conservation, but come at a price (either are more expensive or reduce
plant efficiency, or both). On the other hand, sometimes speeding the time to market is enough of an
economic reason to implement dry or hybrid cooling due to the fact that permits are easier to obtain for
dry cooling than for conventional cooling and therefore the plant can be brought online faster. Another
incentive to implement alternative cooling systems is the freedom to be able to locate the power plant far
away from a water source. Often the power plant operator would prefer to locate the power plant as close
as possible to a transmission corridor or a low-cost fuel source, which might not be next to a plentiful
water source.
6.2.1 Dry Cooling
Dry cooling was first used in the United States in 1968 in Wyoming to be able to be next to a cheap fuel
but where water was not available for cooling. After that, there were no more new units with dry cooling
until the 1990s, when some power plants in the Northeast started to use dry cooling systems to avoid
controversies with plumes and drifts on those plants next to airports and residential areas. However, by
year 2000, about 92 percent of all U.S. dry-cooling installations were in smaller power plants and most
commonly in natural gas combined-cycle power plants. More recently, large plants have started to utilize
dry cooling systems (Maulbetch, 2004).
Dry cooling uses air instead of water as the heat transfer fluid. Therefore, this type of cooling system does
not withdraw or consume any water for cooling purposes (other processes in the power plant may require
water). This cooling system minimizes environmental impacts in comparison with the other cooling
system types. Dry cooled systems can decrease by more 90% the total amount of water used in power
plants. There are no environmental impacts that affect aquatic organisms related to entrainment,
impingement or thermal plume. In addition, dry cooling sometimes reduces maintenance costs because
there is no need for handling and treating the cooling water before being discharged, which can be very
costly. And as mentioned earlier, implementing a dry cooling system can speed up the permit approval
process. The main trade-off is that dry cooling systems tend to be more expensive and reduce the
efficiency of the power plant, which also drives up fuel costs and can lead to higher GHG
emissions. Since air is not as efficient as water in heat transfer, dry cooling systems require a larger

78
surface area for the heat exchanger to be able to dissipate the waste heat to the environment. Therefore,
where space is limited, it could become a problem.
Dry cooling systems can use either a direct or indirect air cooling process. In direct dry cooling (see
Figure 6-2) exhaust steam flows from the steam turbine through a series of fin tube heat exchangers of an
air cooled condenser (ACC). The steam is then condensed, collected in the condensate tank and pumped
back to the boiler. The steam is cooled using a high flow rate of ambient air, and thus, no cooling water is
needed. This cooling system requires a large surface area, which drives up capital costs.
Figure 6-2. Direct Dry Cooling System, Air-Cooled Condenser [ACC] (Maulbetsch, 2004)
In an indirect dry cooling system (see Figure 6-3), the turbine exhaust steam is cooled and condensed by a
conventional water-cooled surface condenser (just like in the wet cooling systems) but a dry cooling
tower (instead of a wet one) is used to cool down the cooling water transferring the heat to the ambient
air. The cooling water operates in a closed loop, and therefore, there are no evaporative losses. As with
wet cooling towers, dry cooling towers can be either mechanical or natural draft. In mechanical draft
cooling systems, parasitic power is required to run the fans, increasing operation costs. Natural draft does
not require any extra electricity but the towers have to be much larger, which require higher capital cost
and also higher land availability.

79
Figure 6-3. Indirect Dry Cooling System with Surface and Spray Condensers (Maulbetsch, 2004)
Dry cooling systems are not yet used extensively in the United States due to the higher capital cost. The
EPA has estimated that capital costs for a dry cooling tower is around 6.5% of the total plant capital costs,
whereas for a conventional wet cooling tower it is around 2% (EPA, 2001). On the other hand, Eskom, a
South African energy utility company using both wet and dry cooling systems, stated that the cost of dry
cooling are going down and that the capital cost for a dry system is about 170% of the wet counterparty
(EPRI-Eskom Presentation, 2011). Eskom also mentioned that the power output is reduced about 1%
when dry cooling is implemented and that is very challenging to retrofit a power plant with dry cooling
due to the high capital cost and the efficiency reduction.
Summarizing, dry cooling is a very good alternative to reduce significantly the water footprint of power
plants, especially for those located in dry areas. Moreover, it can also be a good option to speed up
permitting process in those areas where competition for water is severe or where regulation is very
restrictive. On the other hand, this benefits come at a cost, both in extra capital costs and reduced plant
efficiency.
Solar Thermal power plants inherently tend to be located in dry and arid areas, where there is not enough
water available for the optimal operation of a wet cooling system, so dry cooling systems are often the
only option for these power plants. Since dry cooling is more expensive than wet cooling, it becomes an
extra cost for solar thermal technologies, which are already more expensive than fossil fuel power plants.
Hence, governments tend to subsidize solar thermal power plants and to encourage the implementation of
dry cooling systems to mitigate environmental impacts. In the US, all of the last 9 solar thermal projects
that have been granted permits will use dry cooling systems (www.BLM.gov).

80
Figure 6-4. Eskom's dry cooling towers at Grootvlei (Indirect system with surface condenser and dry cooling tower) and Matimba air cooled condenser dry cooling. (source: Eskom)
Dry cooling systems can also be beneficial for pulverized coal power plants with carbon capture and
storage. As mentioned in chapter 4, since CCS reduces significantly the power plant efficiency, it also
requires more cooling water than the counterparty without CCS. When the power plant is located in a
water scarce area, dry cooling can be a good alternative. For example, the Tenaska Trailblazer CCS
project, which will be located in arid Texas, decided to use a dry cooling system after analyzing the
environmental impacts and the associated costs of dry, hybrid and wet cooling systems. To offset the
cooling system efficiency drop during hot days, the operator decided to slightly lower the capturing rate
from 90 percent to 88 percent. This way, they could use a cooling system with less air coolers and
therefore, reduce capital cost. The operator also recognizes that the efficiency of the power plant will vary
from 28% to 30% depending on ambient conditions (which affect the cooling system efficiency) (Tenaska
Trailblazer Partners, 2012).
Figure 6-5. Rendering of Tenaska Trailblazer CCS project. Observe the size of the dry cooling system, which is half of the overall size of the power plant. (Source: Tenaska website)

81
6.2.2 Hybrid cooling
Hybrid cooling systems combine wet and dry cooling approaches. There are different types of hybrid
cooling systems, but all fall between wet and dry in terms of cost, performance, and water use. However,
different hybrid systems are used to mitigate different environmental impacts: some are intended to
reduce water use, while others are used for plume abatement.
The first type reduces or increases water use depending on water availability and on the climate
conditions. During hot days, it uses a small amount of water to mitigate the efficiency losses of a dry
cooling system. In addition, if water availability increases, it can also be adjusted to improve the cooling
system performance. This type of cooling system uses less water than the counterpart wet cooling system;
however, the range can go from 2% up to 80% of that required for wet cooling system depending on the
configuration. Plume abatement cooling systems are used in wet cooling systems during cold and humid
days (when the plume is likely to be visible). In those days, air is used to heat the plume above saturation
level, reducing the visible plume.
There are many designs and combinations of hybrid cooling systems with different capital costs and
operating flexibility. For example, low cost hybrid systems, such as using water to cool the ACC inlet air,
are sometimes employed during the hottest periods to improve the performance of the cooling system and
of the power plant. The different types of hybrid cooling systems are explained further in Maulbetsch
(2004).
Figure 6-6. Diagram of hybrid systems. Single Tower (plume abatement) (Source: Maulbetsch, 2004)

82
6.3 Alternatives to reuse waste heat in power plants
6.3.1 Combined Heat and Power Plants
Combined heat and power (CHP) plants, also known as cogeneration plants, integrate power and usable
heat production in one single highly efficient process. In conventional power plants a large amount of low
grade heat is being dissipated to the environment through the cooling system and through the flue gas. If
some of this heat could be used, then the efficiency of the process would increase and the water required
for cooling purposes would be reduced. This is what CHP plants do. Usually, CHP plants are designed to
optimize steam production where electricity is a byproduct of heat generation. Hence, electrical efficiency
tends to be lower than in a conventional power plant. However, since the heat produced is also used, the
combined efficiency (total energy output, including heat and power, by energy input) can reach
efficiencies as high as 90% (IEA, 2008). CHP is fuel neutral, which means that can be tailored and
implemented in any thermal-power generation technology (NGCC, PC, solar thermal, etc.); however,
different technologies will achieve different efficiencies.
There are mainly two types of configurations for CHP: gas turbine with heat recovery unit and a steam
boiler with an extraction steam turbine. The first configuration type is not relevant for the purpose of this
thesis since no cooling water was required in the first place (since all the waste heat leaves the plant as
exhaust gas). Usually this type of CHP is used at small scale at large industrial or commercial sites where
power and heat is required. On the other hand, the CHP type using a steam turbine (see Figure 6-7) does
reuse the heat that was otherwise sent to the cooling system (“HR-B” in the model). A portion of the
steam is extracted from the turbine and is often used for feedwater heating. In some plants, the steam
extraction is regulated in such a way that it allows higher flows through the turbine to generate more
electricity when heat demand is lower.
Figure 6-7. Diagram of Combined Heat and Power with a Steam Turbine. (Source: EPA)

83
Correctly designed CHP systems require less fuel to achieve the same energy output than independent
heat and power producers would need. As a result, fuel costs are reduced and GHG emissions decrease.
Moreover, CHP relies on existing and well-known technologies used already all over the world. In many
areas in the north of Europe the use of CHP plants is wide spread. For example, in Denmark CHP
facilities produce about 50% of the total power production. (IEA, 2008).
CHP plants are convenient when they are located near the heat and power demand (i.e. the CHP plant is
located near a city or is used to meet the demand onsite of a big industry or commercial complex). The
high efficiency of CHP plants highly depends on how the heat is delivered to the end user. Thus, this
system is not feasible if the heat has to be transported for long distances (i.e., greater than a few miles). It
is more suitable as a decentralized form of energy supply. CHP plants require higher capital investments
than conventional power plants. Although the energy savings may eventually make the investment worth
it, the pay back time is usually quite long. Seasonal variations also affect the performance of CHP plants.
The fact that CHP plants are meeting two different demands (heat and power), require CHP plant
operators to respond dynamically to these variations and to have a strategy to deal with excess heat during
the hot periods of the year.
6.3.2 Combined Power and Desalination Plants
Figure 6-8. Dual-purpose plant with extraction steam (source: Kamal, 2005).
Hybrid desalination plants are increasingly becoming attractive in arid areas such as the Middle East.
These plants integrate desalination with thermal power generation to improve efficiency and lower the
energy cost of desalination processes. Hybrid plants use the steam of the steam turbine as the heat source
for the Multi-stage flash (MSF) distillation, which is a desalination process that distils seawater by
flashing it into steam in multiple stages (see Figure 6-8). Some studies claim that it is the most
economical way to meet both electricity and water demand in such desert areas (Pechtl, 2003).
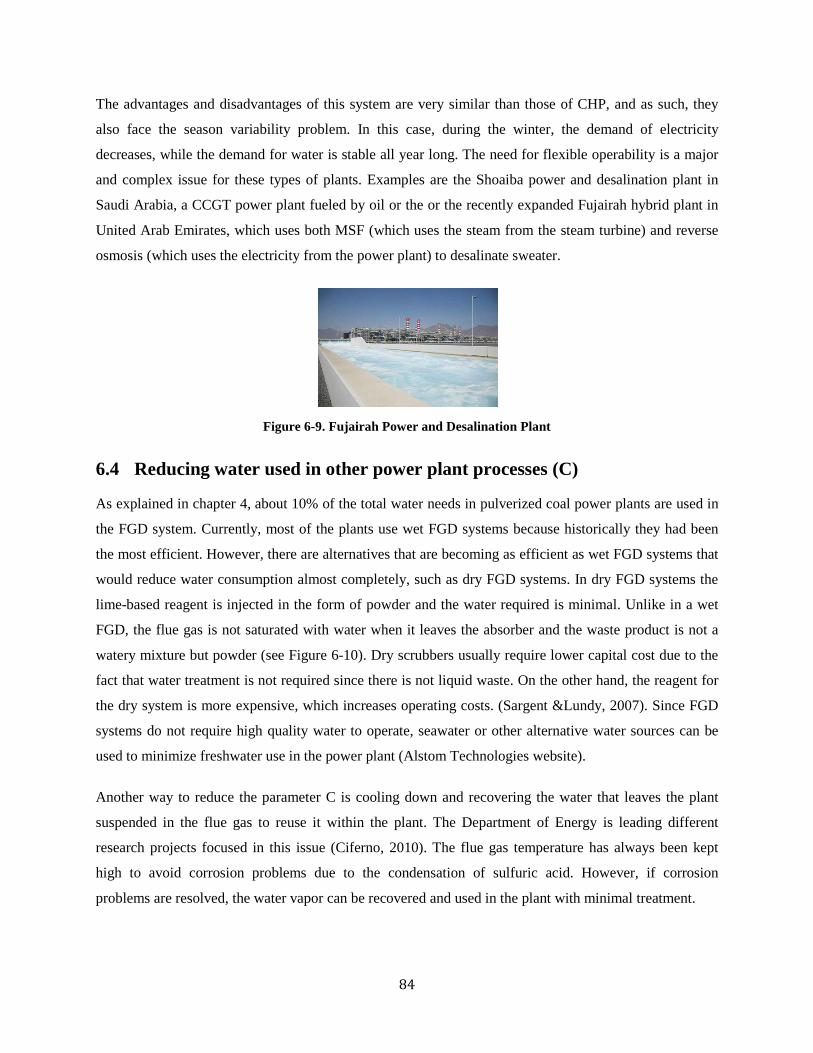
84
The advantages and disadvantages of this system are very similar than those of CHP, and as such, they
also face the season variability problem. In this case, during the winter, the demand of electricity
decreases, while the demand for water is stable all year long. The need for flexible operability is a major
and complex issue for these types of plants. Examples are the Shoaiba power and desalination plant in
Saudi Arabia, a CCGT power plant fueled by oil or the or the recently expanded Fujairah hybrid plant in
United Arab Emirates, which uses both MSF (which uses the steam from the steam turbine) and reverse
osmosis (which uses the electricity from the power plant) to desalinate sweater.
Figure 6-9. Fujairah Power and Desalination Plant
6.4 Reducing water used in other power plant processes (C)
As explained in chapter 4, about 10% of the total water needs in pulverized coal power plants are used in
the FGD system. Currently, most of the plants use wet FGD systems because historically they had been
the most efficient. However, there are alternatives that are becoming as efficient as wet FGD systems that
would reduce water consumption almost completely, such as dry FGD systems. In dry FGD systems the
lime-based reagent is injected in the form of powder and the water required is minimal. Unlike in a wet
FGD, the flue gas is not saturated with water when it leaves the absorber and the waste product is not a
watery mixture but powder (see Figure 6-10). Dry scrubbers usually require lower capital cost due to the
fact that water treatment is not required since there is not liquid waste. On the other hand, the reagent for
the dry system is more expensive, which increases operating costs. (Sargent &Lundy, 2007). Since FGD
systems do not require high quality water to operate, seawater or other alternative water sources can be
used to minimize freshwater use in the power plant (Alstom Technologies website).
Another way to reduce the parameter C is cooling down and recovering the water that leaves the plant
suspended in the flue gas to reuse it within the plant. The Department of Energy is leading different
research projects focused in this issue (Ciferno, 2010). The flue gas temperature has always been kept
high to avoid corrosion problems due to the condensation of sulfuric acid. However, if corrosion
problems are resolved, the water vapor can be recovered and used in the plant with minimal treatment.

85
Figure 6-10. Diagram of Dry FGD (left) and Wet FGD (right) (Source: Alstom, 2003)
6.5 Alternative Water Sources
The rising population, which increases energy and water demand, together with the recent regional
droughts, has pushed national labs and industry to explore non-traditional water sources for power plant
cooling. These sources are generally defined as waters that historically were never considered suitable for
cooling due to their low quality or contamination. Municipal wastewater, mine pool water, oil and gas
produced water and saline groundwater effluents are the some of the most common examples.
It is important to acknowledge that using alternative water sources for cooling purposes can become very
challenging. Water treatments necessary to achieve the required quality to avoid corrosion and other
undesired effects in the cooling system can be expensive and sometimes complex. In addition, there are
extra regulations and permits that have to be complied with and obtained in order to be able to use non-
traditional water sources, which can become an extra barrier. Since many of these water sources have
never been viewed as useful in the past, there is a lack of quality data on their exact location, quality and
useful volumes, which makes their use even more complicated.
6.5.1 Municipal Wastewater (Publicly Owned Treatment Works – POTW)
Wastewater is water that has been used by industry, domestic residences, commercial properties or
agriculture and is discharged as liquid waste. In many cases, wastewater also includes storm runoff.
Hence, wastewater contains polluting substances such as oils, food, human waste, soaps and chemicals.
However, there are several reasons why municipal wastewater could be a potential non-traditional source
for power plant cooling purposes.
First of all, even if wastewater contains pollutants, in many countries such as in the US, municipal
wastewater has to be treated before returning it to the water source. Federal regulations ensure that

86
wastewater is treated at least to secondary standards before it leaves the treatment facility. The main
purpose of those mandatory treatments is to remove the suspended solids. Thus, even if in some cases the
water quality might not meet the standards to be used in the cooling system, its quality is better than that
of some other alternative water sources and can be improved with supplemental treatments. The
treatments are usually implemented onsite and include sand filtration, coagulation, chlorination and
others, which are widely used in water treatment plants around the world (Argonne National Laboratory,
2007).
Secondly, wastewater is available all around the US (see Figure 6-11), mostly near cities or towns,
making wastewater a reliable and continuous water source for cooling. Since wastewater has to be treated,
its quantity and availability its known by the POTW and therefore power plants can plan ahead with
reliable information. Currently, wastewater is being used in 50 power plants around the US. One of the
most well known is Palo Verde in Arizona, the largest nuclear power plant in the US. The agreement
between the POTW and the nuclear power plant was renewed in 2010 and ensures a provision of 26
billion gallons of wastewater a year to the power plant until 2050 (UCS, 2011).
One of the challenges of using wastewater is that the quality of the water, and therefore the need for
supplementary treatments, are very site specific. Thus, the cost of using wastewater for cooling a given
power plant will vary depending on the amount of treatment already provided by the wastewater
treatment plant, the quality of the wastewater before entering the plant and the amount of energy required
to pump the water from the POTW to the power plant. If the wastewater is not treated correctly, two
things can happen: corrosion can occur at the cooling towers and at other equipment; and harmful
microorganisms can be released to the environment through the plumes at cooling towers, which can be
dangerous for surrounding residential areas (Argonne National Laboratory, 2007).
Figure 6-11. Location of PTOW and Coal-Fired Power Plants. Light blue points are POTW >1,000 gpm and black points are operating coal-fired power plants (Source: ALL Consulting, LLC/NETL)

87
In summary, even though accommodating the quality of municipal wastewater bring challenges, its
widespread availability and regulated quality make it one of the best alternative water sources for power
plant cooling.
6.5.2 Mine-Pool Water
Mine-pool water is defined as the groundwater accumulated in abandoned underground mines. During the
excavation works in a mine, it is required to pump out all the underground water that infiltrates in order to
keep the mine dry. However, when the mine is abandoned, the water continues to infiltrate and is not
pumped out, fills all the underground voids to form “mine pools”. Mine pools are especially attractive
when they contain water from several mines or from a mine complex since the amount of water is
substantial.
One of the advantages of using mine pool water as cooling water is its constant low temperature (around
10ºC), which would benefit the efficiency of the power plant. Reports suggest that besides using the mine
pool water as water make-up for wet cooling towers, it could also be used in once-through cooling
systems. In addition, a mine pool could be used as a closed-cycle cooling reservoir, taking water from the
mine pool and returning it to the source where it would naturally cool down to be reused. (Veil, 2003)
Like with wastewater, the quality of mine-pool water is very site specific and depends on the coal’s
chemistry, the mining method used and the time of residence of the water in the mine. Hence, the cost of
the required treatment will vary too. Generally, mine-pool water has a high level of total dissolved solids
(TDS), of dissolved metal ions and low PH. Thus, it requires treatment prior to being used in the cooling
system such as pH adjustment treatments and coagulation and flocculation to remove metals
(Ziemkiewicz et al., 2004).
Withdrawing significant amounts of water from a mine pool can change the hydrology of the mine and
can have serious consequences. One of the risks of using mine-pool water is the possible collapse of the
mine, which could cause subsidence at the surface above the mine. Moreover, getting all the needed
permits to use mine-pool water can be very challenging due to the mentioned water quality issues and to
the posed risks of water extraction.
Currently there are six power plants in the US (all in Pennsylvania) using mine pool water for cooling
purposes, most of them using a closed-cycle cooling system. Since a significant fraction of the coal mines
in the US are in Pennsylvania and in West Virginia (See Figure 6-12), most of the efforts to quantify and
locate potential mine pool resources have taken place at the University of Pittsburgh and the University of

88
West Virginia. The existing reports estimate that there are 100,000 abandoned mines in West Virginia and
around 15,000 in Pennsylvania, collectively containing hundreds of billions of gallons of water (EPRI,
2003).
The location of the mines is a key factor when determining the cost and the viability of the mine-pool
water cooling projects. In order to reduce costs, it is preferable to be as close as possible to the water
source. However, many times, coal mines are located in rocky and steep locations where it is difficult to
build power plants.
In summary, mine-pool water could be an important alternative water sources for cooling. Since the exact
quantity, quality and hydrological patterns are not yet well-known, further research is necessary to
quantify the full potential of this alternative water source.
Figure 6-12. Locations of Abandoned Coal Mines and Coal Fired Power Plants. Light blue areas are abandoned coal mines and black points are operating coal-fired power plants (Source: ALL Consulting,
LLC/NETL)
6.5.3 Produced Waters from Oil and Gas Wells
Produced water is defined as the underground water that is withdrawn and brought to the surface when
drilling for gas or oil. It includes water that was already in the reservoir and the water injected as part of
the drilling and extraction process. It contains salts, oil and grease, natural organic and inorganic
compounds, chemicals used in drilling and well operations, naturally occurring radioactive material and
other pollutants. Produced water the largest waste stream generated by the gas and oil industry
(DOE/NETL, 2009).
As with the other previously described alternative water sources, the quality of the produced water varies
depending on the site (see Figure 6-13). The geological host formation, the type of the produced
hydrocarbon, and the location of the reservoir are all parameters that affect the water quality. The physical
and chemical properties of produced water can also change during the reservoir’s lifetime.

89
Due to the high levels of chloride and total dissolved solids (TDS), produced water can never be used
directly for cooling purposes without extensive treatments (EPRI, 2003). Moreover, in most of the cases,
reverse osmosis will be required to achieve suitable water quality. Reverse osmosis is a more expensive
and complex water treatment used for brackish or saline water that uses membranes. It also requires a pre-
treatment such as precipitation and filtration to ensure the proper operation of the reverse osmosis system.
In the US approximately 3,340 billions of liters of produced water are generated every year, which could
potentially be used as an alternative water sources for power plant cooling (DOE/NETL, 2009).
Figure 6-13. Location of Produced Water (with TDS levels) and Coal-Fired Power Plants (Source: ALL Consulting, LLC/NETL)
6.5.4 Saline Aquifers
There is a large volume of saline aquifers in many regions of the US (see Figure 6-14), which could be
used as an alternative water source for many purposes including power plant cooling. As with the other
mentioned non-traditional water sources, the water quality can vary significantly depending on the site.
Moreover, the variability over time of the levels of total dissolved solids can become a barrier when
trying to assess the quality and usability of the water (DOE/NETL, 2009). .
On the other hand, carbon sequestration experts are looking at saline aquifers as possible sites for
permanent sequestration. For example, in Norway carbon dioxide has been stored in deep saline aquifers
since 1996 at the Sleipner gas field, in the middle of the North Sea. It is a full-scale project and it is
injecting 1 million of tons of CO2 per year without leakage. The injection of CO2 in saline aquifers might
increase its pressure, which could cause leakages. Bringing saline water to the surface continuously could
be a solution to relieve the pressure in the aquifer while creating an alternative water source (Kobos et al.,

90
2008). Hence, saline aquifers could be a potential solution for both issues: CO2 sequestration and power
plant cooling.
Figure 6-14. Locations of Saline Aquifers and Coal-Fired Power Plants. Light blue are saline aquifers and black points are operating coal-fired power plants. (Source: ALL Consulting, LLC/NETL)
The withdrawn saline water would require different treatments before reaching suitable quality for
cooling purposes. Due to the injected CO2, the water would likely contain chemical pollutants. Moreover,
desalination treatments (typically reverse osmosis) would be needed to improve the water quality.
Depending on the quality of the withdrawn water, which will be very site specific, and the expensive
required treatments, using saline water for cooling will or will not be a suitable option.
In summary, different reports claim that coupling these two processes could be possible (See Figure
6-15), which would be mutually beneficial. However, one solution does not fit all, especially when cost
and operations are site specific. As more research is done and more data is available on the quality,
quantity and geologic properties of these aquifers, underground saline water could be a potential
alternative water source for power plant cooling.

91
Figure 6-15. Diagram of the process. Saline Water withdrawal and CO2 sequestration (source: DOE/NETL)
6.5.5 Seawater
As explained in the previous chapters, cooling towers are one of the cooling systems available for power
plants. However, many power plants located next to the seashore use a once-through cooling system,
which can have negative ecological impacts. As a result, EPA and state regulations are pressuring plants
towards wet cooling towers as the best existing alternative for cooling to reduce the environmental
impact. This trend naturally suggests the possibility of using seawater in cooling towers. Such towers,
while rare, have been used since the 1970s and are becoming more popular in arid areas such as the
Middle East.
The high salinity of seawater poses operational challenges such as corrosion of the tower and of the
nearby facilities (due to spray drift), salt deposition, salt concentration, packing, etc. In addition, seawater
has different thermo-physical properties than freshwater, which means that the cooling tower design has
to be modified to achieve the same thermal performance (Maulbetsch and DiFilippo, 2008) . Some
cooling towers manufacturers take salinity into account, and design and build cooling towers capable of
accommodating seawater. For example, choosing the appropriate materials (such as plastic or stainless
steel) can eliminate or minimize the corrosion in the cooling towers. To avoid salt concentration, the
number of cycles of concentration should be much lower than for fresh-water cooling towers (Mostafa
et.al, 2011). .

92
While these challenges and extra needs add cost to the tower, the benefit is an unlimited water supply and
a reasonably low ecological impact. Currently, there are seven power plants around the US using seawater
and several more using brackish water (and more around the world) (DOE/NETL, 2009). . Therefore, it is
a known and used technology that could potentially be used in the future as freshwater becomes
increasingly scarce.
6.6 Summary
There are many different ways to reduce water use in power plants; however, there are trade-offs
involving both costs and efficiencies. In general, the incentive for plant operators to invest in any of these
solutions is driven by government regulation. These regulations are enacted to ensure that increasing
electricity demand is met in a sustainable way and with the minimal impact to the environment and the
water resources.

93
7 Impact of existing and future water regulations on the power sector
______________________________________________________________________________
7.1 Introduction
Water is a precious and finite resource and as such, in many countries its use and quality is regulated to
ensure that it is used in the most efficient and sustainable way. In the US, the growing public concerns
about the increasing water pollution led to the creation of the Federal Water Pollution Control Act, which
was enacted in 1948 as the first major US law intended to address water pollution. After some
amendments in 1972 it became what is now commonly known as the Clean Water Act (CWA). Since
then, the Clean Water Act (CWA) has established the regulatory framework for discharges into the US
water body and for surface water quality standards. Among other changes, the 1972 amendments gave the
Environmental Protection Agency (EPA) the authority to implement pollution control programs and to set
standards and regulations to ensure the compliance of the CWA.
There are two types of regulations under the CWA that directly affect the power industry, and more
specifically, thermal power plants: those regulating water intake and those regulating water discharge. On
some occasions, power plant discharges have also been impacted by regulations under the Safe Drinking
Water Act (SDWA). These regulations are needed to protect the public and the environment. However,
they impose a burden to power plants operators due to the costly processes that need to be implemented,
such as expensive water treatments, or alternate cooling systems. Thus, it is important to recognize that
these regulations affect many stakeholders with different interests: the power sector wants to minimize
operation costs and therefore usually opposes to very stringent regulations; environmental groups focus
on the protection of living organisms and the conservation of the environment and often lobby for stricter
standards; the public wants reliable and cheap electricity but also cares about the quality of the drinking
water and of the watershed; the agriculture sector worries about water availability and water quality;
regulators such as the EPA have to enforce federal laws while understanding and taking into account the
various stakeholders needs.

94
7.2 The Clean Water Act and The National Pollution Discharge Elimination
System permit program5
Part of the 1972 amendments of the Clean Water Act was the section 402, which requires all point
sources to get a permit in order to be able to discharge any type of pollutant to US navigable waters. The
EPA was given authority by the Clean Water Act to enforce this law and created the National Pollutant
Discharge Elimination System (NPDES) permit program as its main means to ensure the compliance of
the Clean Water Act. This means that all industrial, municipal and other facilities that have surface
discharge must obtain a permit and comply with the CWA. The permits designate acceptable standards
for water discharges and contain specific limits on water pollution, requirements on how and what to
report and monitor and other specifications to ensure that the discharge will not become a health hazard.
Figure 7-1. State Authorization to control the NPDES Program.
Although is EPA’s duty to oversee and ultimately ensure the compliance of the NPDES program, in most
cases states have been given the authority to directly implement and administer the NPDES program. If
states meet the EPA criteria, they can issue and enforce the permits. Thus, states have autonomy to
5 To avoid repeating citations, the author wanted to clarify that all the information about the NPDES program
and the CWA law has been obtained from the EPA website (http://water.epa.gov/) and from “Environmental Law, Policy and Economics” (Ashford and Caldart, 2008).

95
determine allowable pollutant limits, water standards and additional parameters. This limits can be more
stringent than the Federal ones, but never less stringent. Moreover, EPA has always the right to override
state decisions if those do not align with the CWA. As shown in Figure 7-1, most of the states are
authorized to implement the program.
There are different sections of the CWA that directly affect the power industry, which are described
below.
7.2.1 Clean Water Act §304. Effluent Guidelines
Section 304 authorizes EPA to establish a set of limitations and guidelines for different industry
categories based on the characteristics of the industry and how much that industry can reduce pollution
discharges by implementing pollutant control technologies. The EPA has issued effluent guidelines for 56
industry categories, including the category “Steam Electric Power Generating” (40 CFR Part 423).
The Steam Electric Power Generating effluent limitations guidelines and standards affect most of the
power plants included in the model in chapter 4. According to EPA this category applies to “a subset of
the electric power industry, namely those plants “primarily engaged in the generation of electricity for
distribution and sale which results primarily from a process utilizing fossil-type fuel (coal, oil, or gas) or
nuclear fuel in conjunction with a thermal cycle employing the steam water system as the thermodynamic
medium.” For this category, the EPA has set up limits for iron, copper, zinc, chromium, chlorine, oil and
grease and Total Suspended Solids (TSS). Moreover, it has identified and included in the guidelines 126
“priority pollutants” 6 which should be regulated and not detectable in the final discharge according to
EPA standards.
The guidelines for the “Steam Electric Power Generating” category were last revised in 1982. However,
the EPA is required by the CWA to periodically review the guidelines and make changes if needed. In the
2005 annual review, the EPA concluded that Steam Electric Power Generating industry was one of the
industries with the highest polluting discharges and that a more detailed study of the industry was needed
to determine if the guidelines for this category needed to be reviewed. The study, which was finished in
2009 and published in the EPA website (EPA, 2009), is mainly focused on coal power plants and on the
impacts of air pollution controls on the amount of pollutant discharges. The EPA acknowledges that the
industry has evolved since 1982 and that the effluent guidelines have not incorporated those changes. The
6 The complete list of priority pollutants can be found online : http://ecfr.gpoaccess.gov/cgi/t/text/text-
idx?c=ecfr&sid=a167d68a3b8e57d72caeb2a573712f41&rgn=div5&view=text&node=40:29.0.1.1.23&idno=40

96
study reviewed wastewater discharges from several power plants and the different technologies that exist
to reduce or eliminate pollutants in water discharges. Although in the study it was mentioned the possible
pollutant discharge from new technologies such as carbon capture and IGCC, it is mainly focused on flue
gas desulfurization (FGD) systems. New regulations have forced power plants to install FGD systems,
which produce a significant fraction of the pollutants discharged by coal power plants, and were not
contemplated in the 1982 guidelines. Since the EPA expects an increase of FGD systems in power plants
due to even more restrictive federal and state air pollution regulations, EPA announced the decision to
proceed with the review of the current effluent guidelines for this industry. EPA plans to propose a new
regulation for the category “Steam Electric Power Generating” in November of this year (2012), to
approve it by April 2014 and to implement it from 2014 to 2019.
Impact on the power sector
Besides the cooling water, whose discharges are also regulated, there are many processes in the power
plant that require water (parameter “C” of the model explained in chapter 3). These processes require
small amounts of water compared to the cooling system; however, the discharges contain a high level of
pollutants and therefore they need to be treated before returning them to the watershed. State standards
are often more stringent than those of the EPA, which require power plant operators to have expensive
and complex water treatment plants inside the power plant complex. During some conversations with
power plant operators, it became clear that meeting those standards is already challenging and very costly
and many operators are considering implementing zero discharge processes to avoid the risk of non-
compliance. The planned new regulation by EPA on FGD systems, which accounts for a substantial
amount on water use in PC power plants (around 10% of the total water use) might push more power
plant operators towards that direction, especially in water-scarce areas or where NPDES permits are
difficult to obtain. In fact, the EPA 2009 study documents (EPA, 2009) recognizes zero liquid discharge
operating practices as a viable solution to minimize environmental impacts, reducing both water use and
discharged pollutants. Zero liquid discharge (ZLD) systems reuse and recycle all the wastewater of the
power plant by using advanced treatment technologies to obtain a zero liquid discharge.
Although ZLD systems have many benefits, it seems unlikely that all power plants will implement these
systems in the near future due to their high maintenance and overall costs. However, due to future stricter
standards on water discharges, most of the power plants will have to invest in more advanced water
treatment processes to ensure that they comply with the regulations.

97
Figure 7-2. Navajo Generating Station (NGS), situated in northern Arizona near the Grand Canyon, a water-scarce area. It uses a zero-discharge water treatment process: all cooling tower blowdown, all wastewater,
and most storm water are recovered, recycled, and reused in plant processes (Source: NGS website
7.2.2 Clean Water Act §316
(a) Water Thermal Discharge
Section 316(a) of the Clean Water Act (CWA) requires the regulation (either by EPA or by the state, if it
has been granted authority) of water thermal discharge from cooling water systems in order to protect
shellfish, fish, and other aquatic wildlife (see Figure 7-3 for an example of thermal plume). States usually
allow a temperature difference (∆T) of 20ºF or less and often also impose a limit on the maximum
temperature allowed7. As explained in chapter 2, this mainly affects once-through cooling power plants
during hotter periods. In some occasions, power plants have had to reduce the power output (or even to
shut down) to ensure that they not exceed the permitted temperature (see examples in chapter 2).
Figure 7-3. Thermal Plume of the Indian Point Nuclear Power Plant in New York
(b) Cooling Water Intake Structures
Section 316 (B) of the Clean Water Act requires that “the location, design, construction and capacity of
cooling water intake structures reflect the best technology available for minimizing adverse
environmental impact”. Thus, unlike most of the other sections of the Clean Water Act, the CWA
§316(b) addresses the adverse environmental impact caused by the intake of cooling water and not those
7 EPA does not set a maximum AT, however, most of decides only allow a 20ºF increase. See here an example of Massachusetts:
www.mass.gov/dep/water/resources/72wqa07i.doc

98
caused by polluting discharges. The main environmental impact of withdrawing significant amounts of
water is the death of aquatic organisms due to impingement or entrainment. Impingement usually occurs
when the force of the intake water traps fish and other big organisms against the intake screens or in other
parts of the water intake structure (see Figure 7-4 a). EPA estimates that 2.1 billion pounds of fish, crab,
and shrimp are killed each year due to impingement on cooling water intake structures. Entrainment takes
place when smaller organisms such as young fish and shellfish or microorganisms fish and
microorganisms are sucked into the cooling system, where most of them die due to thermal, mechanical
or chemical stress (see Figure 7-4b). These environmental impacts are addressed in the regulation
proposed by the EPA.
Figure 7-4. a) Picture of fish impingement (left). b) Diagram showing impingement and entrainment (right).
(Source: Aldenlab and University of California Santa Barbara)8
The regulation was issued in three phases. Phase I rule was promulgated in 2001 and only covers new
facilities. It effectively requires the installation of closed-cycle cooling systems in most of the new power
plants in order to meet the water intake standards. Phase rule II was created in 2004 addressing large
existing power plants that withdraw more than 50 million gallons per day and use at least 25% of that
water for cooling purposes. In 2006, Phase III rule was promulgated covering existing small electric-
generating facilities and new offshore and coastal oil and gas extraction facilities. Phase II required an
important decrease on organism impingement and entrainment but did not consider closed-cooling
systems as the “best technology available” (BTA).
8 found here: http://www.aldenlab.com/services/desalination_intakes_and_discharges http://marinemitigation.msi.ucsb.edu/mitigation_projects/behavioral_barriers/background.html

99
As Stone explains in Policy Paradox (Stone, 2002), all rules are ambiguous at the boundaries, which give
an incentive to try to manipulate or modify the applicability of the rule for one’s own benefit. In this case,
the CWA did not specify which factors the EPA should consider in determining what constitutes the
(BTA). Therefore, it was not clear if EPA was authorized to include costs and benefits as it had done to
reject closed-cycle cooling as BTA. Following a challenge, the Second Circuit concluded that EPA could
not consider a comparison of the costs and benefits of closed-cycle cooling in determining BTA (EPA,
2011). However, in Riverkeeper Inc. vs. US EPA (2007), the Supreme Court of the United States gave
permission to EPA to consider cost and benefits in determining the BTA and to decide what to consider
as costs and benefits. The legal challenges that EPA faced in 2007, forced EPA to respond with the
suspension of Phase II and an update is still pending.
During the following years, environmentalist groups argued that regulations should be more stringent to
protect aquatic life and industry argued that too strict regulations could shut down power plants due to
high compliance costs. In 2008, the Office of Electricity Delivery and Energy Reliability of the
Department of Energy (DOE), in collaboration with NERC, elaborated the report “Electricity Reliability
Impacts of a Mandatory Cooling Tower Rule for Existing Steam Generation Units” under a request of the
U.S. Senate Committee on Appropriations, Subcommittee on Energy and Water to understand the impacts
of the possible EPA regulation on the power sector. The report was intended in part, to serve as an
information source for the EPA in taking the final decision. In the report, the DOE concluded that if all
power plants had to replace once-through cooling systems for cooling towers, it “would exacerbate a
potential decline in electric generation reserve margins that are needed to ensure reliable delivery of
electricity” (DOE, 2008). This would be due to the forced retirement of old power plants and to the
efficiency drop caused by the less efficient cooling system.
In March 2011 the EPA finally issued the proposed rule, supposedly taking into account all the reports
and petitions from both sides. The proposed regulation has three parts. 1) Existing facilities that withdraw
2 million gallons per day and use at least 25% of that water for cooling purposes will be subject to a
mortality performance standard (an upper limit on fish and other organism deaths by impingement) or to a
design standard (a limit on intake velocity of 0.5 feet per second). The plant operator is free to decide
which technology is best suited to meet at least one of these two requirements to reduce organism
mortality. 2) Existing facilities that withdraw at least 125 million gallons per day will be required to
conduct environmental impact studies to help the permitting authority (state or EPA) to determine which
measures are needed to reduce fish and other organism deaths by entrainment. The permitting authority
will have to request for public input for the final decision. 3) New facilities (either a new plant or an
extension of an existing plant) will be required to install a closed-cycle cooling system or design changes

100
equivalent to the reductions associated with closed-cycle cooling. After proposing the new rule, there
was a public comment period on the rule, which closed on August 18, 2011. The EPA is planning to take
final action and to issue the rule by July of this year (2012).
Impact on the power sector
The new rule will affect approximately 670 power plants, which will have to comply with the
impingement requirements within a period of 8 years from the final issue of the rule. Some of those plants
will also have to perform entrainment studies. Moreover, new power plants will have to meet the
requirements by the time they begin operations.
EPA argues in their website that the regulation has set flexible technology standards to adapt to site
specific needs and concerns, allowing for the design of cost effective options. The proposed standards
recognize that, in specific occasions, closed-cycle cooling systems might not be appropriate for existing
power plants. However, the regulation has already received complaints from both sides of the conflict.
Environmental groups and also some individuals complain about the fact that the rule is not strict enough
and still leaves room for once-through cooling systems. On the other hand, the industry has raised
concerns about the proposal, which they claim could accelerate the retirement of some existing power
plants (NERC, 2010).
The NERC (2010) study focused on the hypothetical scenario where all existing power plants were
required to convert to recirculating cooling. The final rule proposal does not include cooling towers as the
BTA. However, most of the power plants using once-though cooling systems will have to invest in new
environmental systems or to convert to closed-cycle cooling system. Both options mean high capital costs
and higher operational costs for the sector. Although under the EPA regulations once-through cooling will
be still legally permitted, the complex permit process and the extra reporting requirements might prevent
power plant operators from using them. The NERC study gives us a magnitude of the impact of the
regulation on the power sector (if all power plants were to install cooling towers). The NERC report
argues that around 33 GW would be vulnerable to retirement and another 5 GW would be lost due to
derating of the power plants once the cooling tower is installed. Retrofitting old plants with cooling
towers might not be worth it, due to the high capital investment costs and the energy penalty of cooling
towers. Moreover, the DOE (2008) report argues that some power plants close to urban areas might face
sitting constraints that prevent them from installing cooling towers (see Figure 7-5). However, in the area
where the study took place (NY Sub-region), one of the most dense in the country, only 3 plants out of 26
were identified as having sitting constraints.

101
Figure 7-5. Ravenswood Power Plant, NY, might face sitting constraints.
Given that the new EPA regulation does not explicitly require power plants to install closed-cycle cooling
systems, power plant operators can install less costly available technologies to reduce entrainment and
impingement (EPRI, 2008) if the states do not impose stricter standards.
There are systems to minimize flow rates by using variable speed pumps during critical seasons (during
breeding season, for example) to reduce fish mortality. This option is cheap as it does not require major
infrastructure changes, however, there needs to be a good quality fish monitoring system. Another option
is to permanently reduce the water intake speed to avoid impingement and let the fish swim away from
the current. There are also systems to protect the intake structure to reduce entrainment and impingement
such as travelling screens, fine mesh screens, barrier nets or aquatic filter barriers, which are nets that
have micropores that allow water passage but block most floating or suspended organisms and objects.
Figure 7-6. Ovivo’s Bio Acoustic Fish Fence system. It uses a combination of sensory stimuli that produces a linear barrier to guide fish away from the point of abstraction to an exit or by wash. The sensory stimulus is
a combination of customized sound signals, directional strobe lighting and an air bubble curtain. (Source: Ovivo’s website)9
This last system has been used in several plants in NY and the NY state government has verified that the
system has been almost as effective in reducing impingement and entrainment as a closed-cycle cooling
9 http://www.ovivowater.com/en/FishGuidanceSystemBioAcousticFishFence

102
system10. However, in other areas it has not been proven as successful. Thus, again, the best-suited option
will vary site by site and plant operators should make specific evaluations and impact assessments to find
the best alternative. Another option are systems that guide the fish and other aquatic life away from the
water intake area, a.k.a. behavioral deterrent systems, such as acoustic systems, air bubble curtains,
electrical barriers, light systems, water jet curtains, etc (see Figure 7-6).
Where water is plentiful, there are alternatives to continue using once though cooling systems and
minimize aquatic organisms deaths. However, some states enforce more stringent regulations that those of
the EPA and force power plants to use closed-cycle cooling systems. This is the case of the State of
California, which has adopted regulations that require all power plants to phase out once-through cooling
systems. The State of New York has not enforced retrofitting power plants with cooling towers through
regulation but has denied NPDES permits to a few once-through cooling power plants. One example is
the Indian Point nuclear power plant near NYC own by Entergy, whose permit is expiring and has not
been granted a new one yet. Entergy has said that converting to cooling towers would cost $1.1 billion
and would require closing down reactors for 42 days. The company wants to install a wedge-wire system
and to reduce the water intake speed in order to reduce impingement and entrainment. However, the state
understands that the “best technology available” rule requires switching to cooling towers. This might
cause an early retirement of the plant, which supplies around 30% of the NYC electricity demand. If so,
there will be a need for new transmission to supply electricity from new power sources, which is
expensive and often controversial11.
Water withdrawn vs. water consumed
As explained in chapter 2, once-through cooling systems withdraw vast amounts of water. However, only
a small amount (around 1%) is consumed. On the other hand, cooling towers withdraw much less water
but consume almost all of it. The power sector accounts for around 40% of the freshwater withdrawals in
the US, but only 3% of the freshwater consumed (see chapter 2). This is due to the fact that there are still
many power plants using once through cooling systems. Therefore, a regulation that forces to install
cooling towers would completely change those percentages. The total water withdrawn would be
significantly lower, but the water consumed would increase. In most of the cases, that would not be a
problem, given that once through cooling systems have been installed where water is plentiful. However,
it is important to highlight this potential impact of the regulation. As an example, we have used the EIA
data to simulate what would happen if the regulation forced to shift from once through to cooling towers
10 http://www.dec.ny.gov/docs/permits_ej_operations_pdf/FEISHRPP3.pdf 11 http://www.nytimes.com/2010/04/04/nyregion/04indian.html

103
in 8 years. We have tonly taken the power plants using once through with freshwater and efficient enough
to be able to install a cooling tower. The results are not completely accurate since we have used the same
B, ksens , ncc and C for all power plants. However, since we have used the reported efficiencies, and we
know that efficiency (HR=3,600/efficiency) is one of the major drivers of water use, we get a good sense
of the magnitude of the change. The cooling towers adoption rate is assumed to be linear with 100%
adoption by year 8.
Figure 7-7. Change in water withdrawn and water consumed if existing once through cooling systems shift to cooling towers
7.3 Safe Drinking Water Act
The Safe Drinking Water Act (SDWA)12 is the main US federal law created to protect public health by
ensuring the quality of America’s drinking water. It was passed by Congress in 1974 and amended in
1986 and 1996 adapting to the public needs. It applies to all drinking water sources that serve more than
25 individuals: lakes, reservoirs, rivers, springs and ground water. Under the SDWA, the EPA is
authorized to set regulations and national standards for drinking water quality and to protect the public
from pollutants that might be in the water source (both natural occurring such as dead animals and man
made such as chemical discharges). EPA works with states and local water suppliers to ensure that all the
standards are met. Although the SDWA does not apply directly to the power sector, the Act is relevant for
thermal power plants. The SDWA established additional limits on different pollutants, such as mercury,
arsenic and other metals that are often present in power plant discharges. Hence, when the power plant is
discharging to a drinking water source, it might be required to meet also those standards. In some states
these regulations are very stringent and allow a very small level of elements in the water source (i.e. parts
12 more information on the SDWA can be found in the EPA website: http://water.epa.gov/lawsregs/rulesregs/sdwa/index.cfm

104
per trillion), which means that power plants might require additional water treatments to comply with the
regulation.
7.4 Summary
Water issues in power plants related to effluent discharges or to water intake systems are becoming
important due to the increasing environmental regulations. Most of the regulations require the power plant
operator to invest in expensive alternative cooling systems, extensive water treatment processes or other
systems to be able to comply with the regulation. The power sector is affected not only by those
regulations addressing water quality issues but also air quality standards. Often the implementation of
different technologies to control emissions is accompanied by new contaminated water streams, which
impose new challenges for wastewater treatment. More stringent regulations could potentially force an
early retirement of various old power plants due to permit denial or to compliance costs, which could
have a significant impact in the power sector.
While the EPA has been granted the authority to implement regulations by the CWA and the SDWA, in
most of the cases it is the states that implement and enforce the regulations (under EPA supervision).
Therefore, in states with stringent regulations, which do not necessarily correlate with more water
scarcity, water related issues could become a burden for the power sector, especially in terms of costs. In
addition, the public seems to be opposed to once-through cooling systems and sometimes are not well
informed about the existing technologies and the effects of each on the environment. In the comment
periods for the new EPA regulation on intake cooling systems, some individual public comments were
worried about the amount of consumed water by once-through cooling systems but at the same time want
cheap electricity, for example. It is important, hence, that all stakeholders are informed about water issues
in power plants and that all the views are taken into account. In the future, it will be critical that EPA,
DOE, FERC, state regulators and environmental organizations work together and collaborate to achieve
best results. New rules should minimize environmental impacts while also taking into account all the
possible implications for the power sector and for the American society as a whole (such as early
retirement of power plants which could lead to power outages). Regulations should be flexible enough to
accommodate site-specific requirements. The EPA should offer clarity and certainty to the power sector
so that they can plan ahead and adapt to the new regulations. However, given that the market on its own
would not solve environmental impacts of power plants due to the lack of incentives for the plant
operators, regulations are needed to solve this market failure and to ensure that water is used in a
sustainable and responsible way.

105
8 Key findings and discussion ______________________________________________________________________________
This thesis has explored the water energy nexus from the perspective of “water for energy”, digging into
available reports and publications, using a model to identity, understand and analyze what drives water
usage in power plants, investigating the alternatives to reduce water use and dwelling into the impacts of
existing and future water regulations on the power sector. The key findings of this research are
summarized below:
1. Regionally, the amount of water withdrawn by power plants is usually much larger than the
amount consumed.“Withdrawal” refers to water taken from a watershed or aquifer, while “consumption”
refers to water withdrawn that is not discharged back to the watershed (section 2.4.1). In the US, the
thermoelectric power sector withdraws account for about 40% of total freshwater withdrawals, but only
about 3% of freshwater consumption (see Figure 8-1). As explained in chapter 2, in the US there are still
many once-through cooling systems (especially in older power plants), which withdraw vast amounts of
water but return most of it to the water source. Large withdrawals can have a negative impact on the
aquatic organisms and the ecosystem (section 2.4.2.1 and section 7.2.2) at a site level. However,
consumption is the number that matters on a regional level. This ratio is likely going to change in the
future with the implementation of the new EPA regulations (section 7.2.2).
Figure 8-1. Sankey diagram of US water use in 2005 (DOE LLNL 2011 / USGS 2009)

106
2. Field data on power plant water use is in many cases unavailable or of poor quality. There are
very few primary sources of data on US power plant water use, and those that exist are inaccurate and
incomplete (see section 2.5). In regions where water is plentyful, this problem is exacerbated, and existing
data is less accurate than for regions with water scarcity. Fortunately, the EIA is making an effort to
improve its data collection, acknowledging the importance for higher-quality data in this field to meet the
need of policy makers and the public and private sector decision makers. However, given the lack of
consistent and high-quality data today, the model developed in this thesis is very useful to obtain better
water estimates and to understand what drives water consumption.
3. In most cases, water use in thermal power plants is dominated by cooling. Thermoelectric
generation processes inherently produce large quantities of “waste” heat and most of it must be rejected to
the environment using a cooling system. As a result, for plants with similar heat rates, the type of cooling
system used in a generation plant has a greater effect on the water consumption intensity (liters consumed
per MWh generated) than the type of fuel (see section 3.2).
4. Different types of cooling system have different strengths and weaknesses. These tradeoffs, which
are explained in section 2.4.2, are summarized below (see Table 15). Currently, the most commonly used
are once-through cooling (especially in old power plants) and cooling towers. However, this might change
in the future. New US EPA regulations have been pushing towards the elimination of once-through
systems, which open a whole new set of possibilities for research in alternative cooling systems that
would replace the old once-through (section 7.2.2). Because of the differences in cost, effectiveness, and
water use between cooling system types, a mandated change away from once-through has strong
implications both for the energy mix of the US power fleet and for regional water consumption profiles.
Cooling Type Water
Withdrawal Water
Consumption Capital Cost Plant Efficiency
Ecological Impact
Once-Through intense moderate low good intense
Wet Cooling Towers moderate intense moderate good moderate
Dry Cooling none none high bad low
Table 16. Summary of Cooling Systems Trade-offs
5. Among plants with the same cooling system type, the amount of cooling water consumed is
mainly determined by the power plants’ heat rate, irrespective of the type of fuel used. Lower heat
rate means less waste heat to be rejected and thus less cooling water required per MWh generated (see
Figure 8-2). Hence, gas combined-cycle plants (around 7,200 kJ/kWh HHV) require less water than

107
pulverized coal power plants (10,300 kJ/kWh HHV) and much less than solar thermal plants (12,000
kJ/kWh HHV) and geothermal (24,000 kJ/kWh HHV) (see chapter 0).
Figure 8-2. Water Withdrawn w/ Wet Cooling Towers ( Sources: DOE/NETL, EPRI, Ikeda)
6. A wet tower cooled power plant with carbon capture and storage (CCS) requires significantly
more water than an equivalent plant without CCS; the primary cause of this increase is the
efficiency penalty. Non-cooling water needs related to carbon capture are not significant, but the carbon
capture process does incur a substantial plant efficiency decrease, which increases water consumption
intensity as discussed above. For a new power plant with CCS, the water requirement can be up to double
that of a new non-CCS plant with the same electrical output. Retrofitting a plant with CCS, however,
would likely include some combination of capacity derating and the upgrade of older, less efficient
components; in absolute terms, then, the retrofitted plant would consume considerably less than double
what it consumed before retrofitting (see section 4.1.4)
7. Water constraints can be an incentive towards higher efficiencies and other innovative
alternatives to reduce fresh water usage in power plants. As explained in chapter 6, besides alternative
cooling systems, there are different options to minimize water use. One option is to re-use the waste heat
from the plant (see section 6.3). For example, where there is suitable demand, combined heat and power
can be implemented, which can drastically reduce the amount of heat that must be rejected through the
cooling system, and thus the amount of cooling water required. There are also alternatives to reduce the
water used in other plant processes (see section 6.4). Finally, fresh-water usage can be reduced by using
alternate water sources, such as municipal wastewater (see section 6.5). However, most of those
alternatives come at an extra cost. Hence, regulations are enacted to ensure that increasing electricity
demand is met in a sustainable way and with the minimal impact to the environment and the water
resources.
0
1,000
2,000
3,000
4,000
5,000
6,000
0 5000 10000 15000 20000Wat
er W
ithdr
awal
(L/M
Wh)
Heat Rate (kJ/kWh)
PC FGD
PC w/o FGD
PC CCS
NGCC
NGCC CCS
IGCC
IGCC CCS

108
8. Low-carbon thermal generation technologies may be at risk from a water availability standpoint.
The dependence of water requirements on thermal efficiency is bad news for carbon capture, nuclear,
solar thermal and geothermal plants, which are less thermally efficient than conventional fossil plants.
Solar thermal and geothermal are at particular risk since these plants are usually sited in arid areas. There
are available solutions to overcome this problem, but they are more costly than the conventional
counterpart. For example, most of the solar thermal power plants have been forced to implement dry
cooling systems, which do not require any water but have a negative effect on efficiency and costs. It is
important to take into account all this information when making national level energy policies that might
change the fleet mix, due to the impacts that can have on the water resources.
9. From a regional water consumption perspective, non-cooling plant processes are usually
negligible; however, from a plant-level economic standpoint, they can incur very significant costs
related to treating wastewater for discharge under stringent regulations. We spoke with several
water specialists at US utilities, and wastewater disposal, especially at coal plants, seems to receive the
bulk of their attention. More cost-effective wastewater treatments and zero-discharge technologies are
areas of active research. Wastewater treatments will play an important role in the water-energy nexus,
especially with EPA planning on adding stricter regulations for power plant discharges.
10. Regulations, not price signals, are usually the drivers of water-related power plant decisions.
Moreover, US water regulations are becoming stricter, which will have an impact for the power
sector. The value of electricity is typically high compared to the cost of the water required for wet tower
cooling. In many states, water is not priced and therefore, unless regulations force to do otherwise, it
nearly always makes economic sense to use a wet cooling tower, which results in increased electricity
output vs. a dry or hybrid system. On the other hand, most of the new regulations require the power plant
operator to invest in expensive alternative cooling systems, extensive water treatment processes or other
systems to be able to comply with the regulation. More stringent regulations could potentially force an
early retirement of various old power plants due to permit denial or to compliance costs, which could
have a significant impact in the power sector.
Discussion
Water usage in power plants is and will be a critical issue for the power sector, especially in water-scarce
areas. However, despite the interdependence between water and energy, frameworks for energy policies
are often developed separated from those for water policies. There is a need to start thinking of those
sectors as 2 interconnected worlds, where policy decisions made in one sector can have a large impact on

109
the other. Energy policies focused to tackle the challenges of climate change will likely change the
existing fleet mix, which in turn could exacerbate the water energy nexus. Hence, when implementing
energy policies it is very important to also consider the impact that the policy might have on water
availability and what can be made to mitigate the problem. On the other hand, unlike the emission of
greenhouse gases, which is an intrinsically a global problem, the water energy nexus is a regional
problem. The regional variations in water resources, water demand, electricity demand, and energy mix
all combine to create ‘hot-spots’ where the water-energy nexus is more crucial than elsewhere. Therefore,
policies and regulations should also take this into account.
We know that there are many alternatives available, but most times they are costly. R&D on alternatives
to reduce water use in power plants will be a crucial part of this puzzle. Another aspect that has to be
improved is the data collection on water use from government agencies. Water withdrawal in the power
sector accounts for around 40% of all the freshwater withdrawals, and still the data collected is of very
poor quality. This information is crucial for policy makers and regulators to be able to make educated
decisions. The EIA has already announced that they are taking steps to improve the data collection
process. Another option could be to combine EIA and EPA efforts, given that EPA regulates water
intakes and water discharges. On the other hand, existing and future air and water pollution regulations
will most likely put an extra burden for power plants operators. Hence, new policies and regulations
should minimize environmental impacts while also taking into account all the possible implications for
the power sector and for the American society as a whole (such as early retirement of power plants which
could lead to power shortages). The model developed in this thesis should be useful in policy analysis and
informing policy decisions.

110

111
Nomenclature and acronyms
Nomenclature A Water needed per unit of energy rejected [L/kJ]
ACT_C Parameter A for Cooling Towers – water consumed [L/kJ]
ACT_W Parameter A for Cooling Towers – water withdrawn [L/kJ]
ADC_C Parameter A for Dry Cooling – water consumed [L/kJ]
ADC_W Parameter A for Dry Cooling – water withdrawn [L/kJ]
AHC_C Parameter A for Hybrid Cooling – water consumed [L/kJ]
AHC_W Parameter A for Hybrid Cooling – water withdrawn [L/kJ]
AOT_C Parameter A for Once-through cooling – water consumed [L/kJ]
AOT_W Parameter A for Once-through cooling – water withdrawn [L/kJ]
B Heat to other sinks than the cooling system [kJ/kWh]
C Other process water needs [L/kWh]
CFG Specific heat capacity of the flue gas [kJ/kg-K]
Cp Specific heat of water [MJ/kg-K]
HR Heat Rate [kJ/kWh]
hfg Latent heat of vaporization of water [kJ/kg]
I Total water needs [L/kWh]
kbd Fraction of blowdown discharged to the watershed [%]
ksens Heat load rejected through convection [%]
mFG Flue gas mass flow rate [kg/kWh]
mwater Flue gas water content [kg/kWh]
mwater_CP Water from the coal combustion process [L/kWh]
ncc Number of cycles of cooling water concentration [#]
Qsens Flue Gas Sensible Heat [kJ/kWh]
Qlatent Flue Gas Latent Heat [kJ/kWh]
ΔT Cooling range; inlet/outlet temperature difference [°C]
ρw Density of water [kg/L]
Acronyms
ACC Air Cooled Condenser
BTA Best Technology Available

112
CCGT Combined Cycle Gas Turbine
CCS Carbon Capture and Sequestration
CSP Concentrated Solar
CHP Combined Heat and Power
COE Cost of Electricity
CWA Clean Water Act
DCC Direct Contact Cooler
DOE Department of Energy
EIA Energy Information Administration
EPA Environmental Protection Agency
EPRI Electric Power Research Institute
FERC Federal Energy Regulatory Commission
FGD Flue Gas Desulfurization
GAO Government Accountability Office
GHG Green House Gases
HHV High Heating Value
IEA International Energy Agency
IECM Integrated Environmental Control Model
IGCC Integrated Gasification Combined Cycle
MSF Multi Stage flash
NETL National Energy Technology Laboratory
NGCC Natural Gas Combined Cycle
NPDES National Pollutant Discharge Elimination System
NREL National Renewable Energy Laboratory
PC Pulverized Coal
POTW Publicly Owned Treatment Works
SDWA Safe Drinking Water Act
TDS Total Dissolved Solids
TSS Total Suspended Solids
USGS U.S Geological Survey
UCS Union of Concerned Scientists
WGS Water Gas Shift
ZLD Zero Liquid Discharge

References ______________________________________________________________________________
Alstom (2003). Air Pollution Control. Regulatory & Technology Development. Presentation Environmental Control Systems –GM. UN-ECE Ad Hoc Group of Experts on Coal in SD -6th Meeting 17-18.11.2003
Argonne National Laboratory (2007). Use of Reclaimed Water for Power Plant Cooling. For the US Department of Energy by J.A: Veil, Environmental Science Division, Argonne National Laboratory. ANL/EVS/R-07/3
Babcock & Wilcox Power Generation Group, Inc. (2009) “Spray Dry Flue Gas Desulfurization Systems.” Found here: http://www.babcock.com/library/pdf/e1013178.pdf
Berkenpas (2009). “IECM Technical Documentation Updates Final Report,” Contract No. DE-AC26-04NT41917. Berkenpas, M.B., Kietzke, K., Mantripragada, H., McCoy, S., Rubin, E.S., Versteeg, P.L., and Zhai, H. U.S. DOE National Energy Technology Laboratory, Pittsburgh, PA.
Carnegie Mellon University, Integrated Environmental Control Model, http://www.cmu.edu/epp/iecm
CEPA (2010). Policy on the Use of Coastal and Estuarine Waters for Power Plant Cooling. California Environmental Protection Agency. 2010.
Climate Central (2011). In Tennessee, Heat Waves Diminish Nuclear Power Output. Available here: http://www.climatecentral.org/news/in-tennessee-heat-waves-frustrate-nuclear-power/
Ciferno (2010) Department of Energy/National , Energy Technology Laboratory’s, Water-Energy Interface Research , Program: December 2010 Update Ciferno. December 1, 2010
DOE (2006) “Energy Demands on Water Resources: Report to Congress on the Interdependency of Energy and Water.” U.S. Department of Energy, Washington, DC.
DOE. (2008). Electricity Reliability Impacts of a Mandatory Cooling Tower Rule for Existing Steam Generation Units. Office of Electricity Delivery and Energy Reliability. U.S. Department of Energy. Available at: http://www.netl.doe.gov/energy-analyses/pubs/Cooling_Tower_Report.pdf
DOE/Office of Fossil Energy (2009). Modern Shale Gas. Development in the United States: A primer.
DOE (2010). Water Vulnerabilities for Existing Coal-fired Power Plants. August 2010 DOE/NETL-2010/1429
DOE/NETL (2009). Use of Non-Traditional Water for Power Plant Applications: An Overview of DOE/NETL R&D Efforts. DOE/NETL-311/040609. 2009
DOE/NETL (2010). Cost and Performance Baseline for Fossil Energy Plants. Volume 1: Bituminous Coal and Natural Gas to Electricity. U.S. DOE National Energy Technology Laboratory, Pittsburgh, PA.
EIA (2008) EIA-860 Annual Electric Generator Report, U.S. DOE Energy Information Administration, Washington, DC.
EIA (2010) EIA-923 January – December Final, Nonutility Energy Balance and Annual Environmental Information Data, U.S. DOE Energy Information Administration, Washington, DC.
EIA (2011). Annual Energy Outlook 2011. Retrieved from website
EPA (2001) .Technical Development Document for the Final Regulations. US. Environmental Protection Agency, (EPA-821-R-01-036), November 2001.
EPA (2004). Basic information about Regulations under §316(b) of the Clean Water Act. Available at: http://water.epa.gov/lawsregs/lawsguidance/cwa/316b/basic.cfm
EPA (2009) Steam Electric Power Generating. Point Source Category: Final Detailed Study Report. Found here: http://water.epa.gov/scitech/wastetech/guide/upload/finalreport.pdf
EPA (2011).Technical Development Document for the Proposed Section 316(b) Phase II Existing Facilities Rule. March 2011
EPA (2012). EPA website. http://www.epa.gov/lawsregs/laws/cwa.html

114
EPRI. (2002a). Water & Sustainability (Volume 4): U.S. Electricity Consumption for Water Supply & Treatment - The Next Half Century . Technical Report.
EPRI (2002b) Technical Report “Updated Cost and Performance Estimates for Fossil Fuel Power Plants with CO2 Removal”.
EPRI (2003). Use of Degraded Water Sources as Cooling Water in Power Plants.1005359. Final Report, October 2003
EPRI (2008). Advanced Cooling Technology Workshop July 8-9, 2008 Charlotte, North Carolina. Presentation summary. An Electric Power Industry Perspective on Water Use Efficiency. John R.Wolfe, Robert A. Goldstein, John S. Maulbetsch, and Charles R. McGowin. Limno Tech, Inc., Ann Arbor, MI; Electric Power Research Institute
EPRI (2009). The Potential Growing Role of Post-Combustion CO2 Capture Retrofits in Early Commercial Applications of CCS to Coal-Fired Power Plants. MIT Coal Retrofit Symposium .March 23, 2009 Specker et al.
EPRI (2010) Cooling Requirements and Water Use Impacts of Advanced Coal-fired Power Plants with CO2 Capture and Storage. Interim Results.
EPRI-Eskom Presentation (2011). Advances in Dry Cooling Deployed at South African Power Stations. Presentation for EPRI, Steve Lennon, Divisional Executive Eskom 2011 Summer Seminar August 1, 2011
Geothermal Energy Association (2010). Geothermal Energy: International Market Update. Alison Holm, Leslie Blodgett, Dan Jennejohn and Karl Gawell. May 2010.
IEA (2008). Combined Heat and Power. Evaluating the Benefits of Greater Global Investments. OECD/IEA, International Energy Agency (IEA), Paris France
Ikeda (2007) Technical Performance of Electric Power Generation Systems. Technology Assesment report 63. Volume 1 of 2. Selected Flowsheets adapted to Australian Coal and Conditions. Ikeda, E., Lowe, A., Spero and C. Stubington, J. Cooperative Research Center for Coal in Sustainable Development. Australia. 2007.
IPCC. (2008). Climate change and water. IPCC Technical Report VI.
Kamal (2005). “Integration of seawater desalination with power generation”. Ismat Kamal. Fluor Enterprises, Inc. Journal: Elsevier. Received 14 September 2004; accepted 4 February 2005
Kobos et al. (2008) Study of the Use of Saline Aquifers for Combined Thermoelectric Power Plant Water Needs and Carbon Sequestration at a Regional Scale.
Macknick (2011) “A Review of Operational Water Consumption and Withdrawal Factors for Electricity Generating Technologies,” Technical Report No. NREL/TP-6A20-50900. Macknick, J., Newmark, R., Heath, G. and Hallet, KC, U.S. DOE National Renewable Energy Laboratory, Boulder, CO.
Maulbetsch, (2004) “Comparison of Alternate Cooling Technologies for U.S. Power Plants: Economic, Environmental, and Other Tradeoffs,” Technical Report No. 1005358, EPRI, Palo Alto, CA.
Maulbetsch and DiFilippo (2008) Performance, Cost, and Environmental Effects of Saltwater Cooling. Prepared for California Energy Commission Public Interest Energy Research Program. January 2010 CEC-500-2008-043
MIT Energy Initiative (2011) Managing Large-Scale Penetration of Intermittent Renewables
Mittal, A., and Gaffigan, M. (2009) “Energy-Water Nexus: Improvements to Federal Water Use Data Would Increase Understanding of Trends in Power Plant Water Use,” GAO-10-23, U.S. Government Accountability Office, Washington, DC.
Mostafa et.al (2011). “Thermal Performance of Seawater Cooling Towers” Mostafa, H. Sharqawy John H. Lienhard, V, and Syed M. Zubair, J. Eng. Gas Turbines Power 133, 043001 (2011), DOI:10.1115/1.4002159
National Research Council (2008). Water Implications of Biofuels Production in the United States
NERC (2010) Special Reliability Scenario Assessment: Resource Adequacy Impacts of Potential U.S. Environmental Regulations

115
NETL. DiPietro (2009) “Water Requirements for Existing and Emerging Thermoelectric Plant Technologies,” Technical Report No. DOE/NETL-402/080108. DiPietro, P., Gerdes, K., and Nichols, C. U.S. DOE National Energy Technology Laboratory, Pittsburgh, PA.
NY Times (2009). Alternative Energy Projects Stumble on a Need for Water. Todd Woody. September 2009. Available here: http://www.nytimes.com/2009/09/30/business/energy-environment/30water.html?pagewanted=2&_r=1
NY Times (2010). New York Denies Indian Point a Water Permit. Available here: http://www.nytimes.com/2010/04/04/nyregion/04indian.html
Paul Ziemkiewicz et al. (2004) Strategies For Cooling Electric Generating Facilities Utilizing Mine Water: Technical and Economic Feasibility. Prepared by West Virginia University for Department of Energy.
Pechtl (2003), “Integrated Thermal Power and Desalination Plant Optimization” Peter Pechtl, Marco Dieleman, Martin Posch, Bijan Davari, Michael Erbes, Stefan Schneeberger. General Electric Energy Services, Optimization Software. PowerGen Middle East, October 2003, Paper No. 110
Reuters (2011). Texas grid narrowly avoids power outages. Available here: http://www.reuters.com/article/2011/08/25/us-utilities-texas-grid-idUSTRE77N72G20110825
Rutberg et.al (2011). A system-Level Generic Model of Water Use at Power Plants and its Application to Regional Water Use Estimation. Rutberg, M., Delgado, A., Herzog, H., Ghoniem, A. ASME 2011 International Mechanical Engineering Congress & Exposition. November 11-17, 2011, Denver, Colorado, USA. IMECE2011-63786.
Rutberg (2012). MIT Thesis “Modeling Water Use at Thermoelectric Power Plant”. Michael Rutberg, MIT Mechanical Engineering.
Sargent &Lundy (2007). Flue Gas Desulfurization Technology Evaluation. Dry Lime vs. Wet Limestone FGD. Project number 11311-001. Sargent & Lundy, Chicago, 2007.
Stone (2002). Policy Paradox: The art of Political Decision Making. Deborah A, Stone. Publisher: New York : W.W. Norton, ©1997.
Stillwell et al. (2009). Energy Water Nexus in Texas. A. S. Stillwell, C. W. King, M. E. Webber, I. J. Duncan, and A. Hardberger. University of Austin, Texas.
Tenaska Trailblazer Partners (2012). Report to the Global CCS Institute . Final Front‐End Engineering and Design Study Report
UCS (2011). Freshwater use by U.S. power plants: Electricity’s thirst for a precious resource. A report of the Energy and Water in a Warming World initiative. Cambridge, MA: Union of Concerned Scientists. Averyt, K., J. Fisher, A. Huber-Lee, A. Lewis, J. Macknick, N. Madden, J. Rogers, and S. Tellinghuisen. November 2011.
USGS (2005). Estimated Use of Water in the United States in 2005. Joan F. Kenny, Nancy L. Barber, Susan S. Hutson, Kristin S. Linsey, John K. Lovelace, and Molly A. Maupin
Veil (2003). Use of Mine Pool Water for Power Plant Cooling, prepared by Veil, Kupar and Puder, Argonne National Laboratory for Thomas J. Feeley, III, U.S. Department of Energy, National Energy Technology Laboratory, September 2003.
WEC (2010). Water for Energy. World Energy Council, London UK. ‘Used by permission of the World Energy Council, London, www.worldenergy.org’
Yang, X. and Dziegielewski, B. (2007) “Water Use by Thermoelectric Power Plants in the United States,” J. Amer. Water Resources Assoc., 43(1), pp. 160-169.
Zhai (2010) “Performance and Cost of Wet and Dry Cooling Systems for Pulverized Coal Power Plants With and Without Carbon Capture and Storage,” Zhai H. and Rubin, E.S. Energy Policy, 38(10), pp. 5653-5660.
Zhai (2011) “Water Use at Pulverized Coal Power Plants with Postcombustion Carbon Capture and Storage,” Zhai, H. Rubin, E.S. and Versteeg, P.L. Environ. Sci. Technol., 45(6), pp. 2479-2485.
116
General Bibliography Argonne National Laboratory (2010). “Water Use in the Development and Operation of Geothermal Power Plants.”
Ausra (2007). An Introduction to Solar Thermal Electric Power Ausra, Inc. Palo Alto, CA
Babcock & Wilcox Power Generation Group, Inc. (2009) “Spray Dry Flue Gas Desulfurization Systems.” Found here: http://www.babcock.com/library/pdf/e1013178.pdf
Carter, Nicole T, and Richard J Campbell (2009) . “Water Issues of Concentrating Solar Power ( CSP ) Electricity in the U . S . Southwest.” Water Resources
DOE. Concentrating Solar Power Commercial. Application Study: Reducing Water Consumption of Concentrating Solar Power Electricity Generation. Report to Congress. U.S. Department of Energy. Found here: http://www1.eere.energy.gov/solar/pdfs/csp_water_study.pdf
DOE (1996). “Electric Utility Engineer’s FGD Manual. Volume I- FGD Process Design.”
DOE/NETL (2010). Cost and Performance Baseline for Fossil Energy Plants. Volume 1: Bituminous Coal and Natural Gas to Electricity. U.S. DOE National Energy Technology Laboratory, Pittsburgh, PA.
ELCOGAS (2000). “Igcc Puertollano a Clean Coal Gasification Power Plant.”
El-Wakil (1984). “Power Plant Technology”. M.M. El-Wakil. Mc Graw Hill Book Company.
EPRI (2002) Technical Report “Updated Cost and Performance Estimates for Fossil Fuel Power Plants with CO2 Removal”.
EPRI (2010) Cooling Requirements and Water Use Impacts of Advanced Coal-fired Power Plants with CO2 Capture and Storage. Interim Results.
FLUOR (2008). Reddy, Satish, Dennis Johnson, and John Gilmartin. “Fluor ’ S Econamine FG Plus SM Technology For CO2 Capture at Coal-fired Power Plants.” Presented At: Power Plant Air Pollutant Control “Mega” Symposium August 25-28, 2008 Baltimore
IEA (2005) . The present and Future use of Solar Thermal Energy as a Primary Source of Energy. Cédric Philibert . International Energy Agency, Paris, France.
IEAGHG (2011). “Evaluation and Analysis of Water Usage of Power Plants with CO2 Capture”
Ikeda (2007) Technical Performance of Electric Power Generation Systems. Technology Assesment report 63. Volume 1 of 2. Selected Flowsheets adapted to Australian Coal and Conditions. Ikeda, E., Lowe, A., Spero and C. Stubington, J. Cooperative Research Center for Coal in Sustainable Development. Australia. 2007.
Klett, M.G., Kuehn, N.J., Schoff, R.L., Vaysman, V. and White, J.S. (2007) “Power Plant Water Usage and Loss Study” (May 2007 Revision), U.S. DOE National Energy Technology Laboratory, Pittsburgh, PA.
NREL (2010). “Water Use in Parabolic Trough Power Plants: Summary Results from Worley Parsons’ Analyses,” Technical Report No. NREL/TP-5500-49468, Turchi, C.S., Wagner, M.J. and Kutscher, C.F. U.S. DOE National Renewable Energy Laboratory, Boulder, CO.
MIT Energy Initiative (2006) . “The Future of Geothermal Energy”
MIT Energy Initiative (2009). “Retrofitting of Coal-Fired Power Plants for CO 2 Emissions Reductions An MIT Energy Initiative Symposium.” Symposium (2009) : 1-7. Print.
Newmark, Robin L, Samuel J Friedmann, and Susan a Carroll. (2010) “Water Challenges for Geologic Carbon Capture and Sequestration.” Environmental Management 45.4 : 651-61.
The Babcock & Wilcox Company (2005). Steam/its generation and use. 41st edition. Editors: John B. Kitto and Seteven C.Stultz. The Babcock & Wilcox Company , Barberton, Ohio, U.S.A.
Todreas, Neil E., and Mujid S. Kazimi. (1989). Nuclear Systems: Thermal Hydraulic Fundamentals. Vol. 1. New York, NY: Taylor & Francis Inc., December 1, 1989, 3rd printing. ISBN: 9781560320517.

117
Vine, G. (2010) “Cooling Water Issues and Opportunities at U.S. Nuclear Power Plants,” Technical Report No. INL/EXT-10-20208, U.S. DOE Idaho National Laboratory, Idaho Falls, ID.
World Nuclear Association (2011). “Cooling Power Plants.” Retrieved from website
Zhai (2011) “Water Use at Pulverized Coal Power Plants with Postcombustion Carbon Capture and Storage,” Zhai, H. Rubin, E.S. and Versteeg, P.L. Environ. Sci. Technol., 45(6), pp. 2479-2485.