water quality and hydrogeochemical processes in
TRANSCRIPT

WATER QUALITY AND HYDROGEOCHEMICAL PROCESSES IN MCDONALDS BRANCH BASIN,
NEW JERSEY PINELANDS, 1984-88
By Patricia A. Johnsson and Julia L. Barringer
U.S. GEOLOGICAL SURVEY
Water-Resources Investigations Report 91-4081
Prepared in cooperation with the
NEW JERSEY DEPARTMENT OF ENVIRONMENTAL PROTECTION AND ENERGY
West Trenton, New Jersey
1993

U.S. DEPARTMENT OF THE INTERIOR
BRUCE BABBITT, Secretary
U.S. GEOLOGICAL SURVEY
Dallas L. Peck, Director
For additional information Copies of this report canwrite to: be purchased from:
District Chief U.S. Geological SurveyU.S. Geological Survey Books and Open-File Reports SectionMountain View Office Park, Suite 206 Box 25425810 Bear Tavern Road Federal CenterWest Trenton, NJ 08628 Denver, CO 80225
CONTENTS
Page
Abstract................................................................ 1Introduction............................................................ 2
Purpose and scope.................................................. 5Previous investigations............................................ 5Acknowledgments.................................................... 6
Description of study area............................................... 6Location........................................................... 6Geology............................................................ 8Hydrology.......................................................... 9Soils and vegetation............................................... 9
Data collection, analytical methods, and quality assurance.............. 11Collection of hydrologic and water-quality data.................... 11Field fractionation of aluminum.................................... 14Quality assurance of analytical data............................... 15
Hydrologic setting...................................................... 16Components of the water budget..................................... 16
Precipitation................................................. 16Evapotranspiration............................................ 17Streamflow.................................................... 20Ground-water discharge........................................ 20Change in surface-water storage............................... 20Change in soil-water storage.................................. 21Change in ground-water storage................................ 21
Estimated water budgets ............................................ 21Ground-water/surface-water relations ............................... 22
Water quality........................................................... 24Precipitation chemistry........................................... 24Throughfall chemistry............................................. 28Surface-water chemistry........................................... 39Ground-water chemistry............................................ 51
Hydrogeochemical processes.............................................. 67Retention and release of chemical constituents.................... 67Transport of trace elements....................................... 70Variations in surface-water chemistry caused by drought........... 75Hydrogeochemical controls of acidity.............................. 81
Summary and conclusions................................................. 85References cited........................................................ 88Appendix A: Chemical analyses of wet (PPT-1WC) and bulk (PPT-1BC)
precipitation in McDonalds Branch basin, December 2, 1986 through December 4, 1987.......................................... 99
Appendix B: Precipitation in McDonalds Branch basin,December 1, 1986, to February 8, 1988, based on results fromthe Belfort event-recording rain gage at site PPT-1WC.............101
Appendix C: Chemical analyses of surface water at site S-l in the hardwood swamp at McDonalds Branch basin, November 25, 1986 through June 28, 1988.............................................102
iii
CONTENTS--Continued
Page
Appendix D: Stage measurements at McDonalds Branch basin,November 25, 1986 through June 1, 1988 ............................ 103
Appendix E: Chemical analyses of ground water at sitesQWC-1A, QWH-1A, QWO-3A and QWH-4A in McDonalds Branchbasin, November 26, 1986 through June 1, 1988..................... 104
Appendix F: Altitude of the water table in McDonalds Branch basin,based on data from water-quality wells, November 25, 1986 through June 1, 1988...................................................... 107
Appendix G: Results of aluminum fractionation of surface-water, soil- water, and ground-water samples at McDonalds Branch basin, October 1987...................................................... 109
Appendix H: Results of chemical analyses of surface-water, soil-water,and ground-water samples at McDonalds Branch basin, October 1987..110
Appendix I: WATSTORE site-identification numbers and site descriptionsfor water-quality sites in McDonalds Branch basin.................111
ILLUSTRATIONS
Figure 1. Map showing location of McDonalds Branch basin in theNew Jersey Pinelands....................................... 7
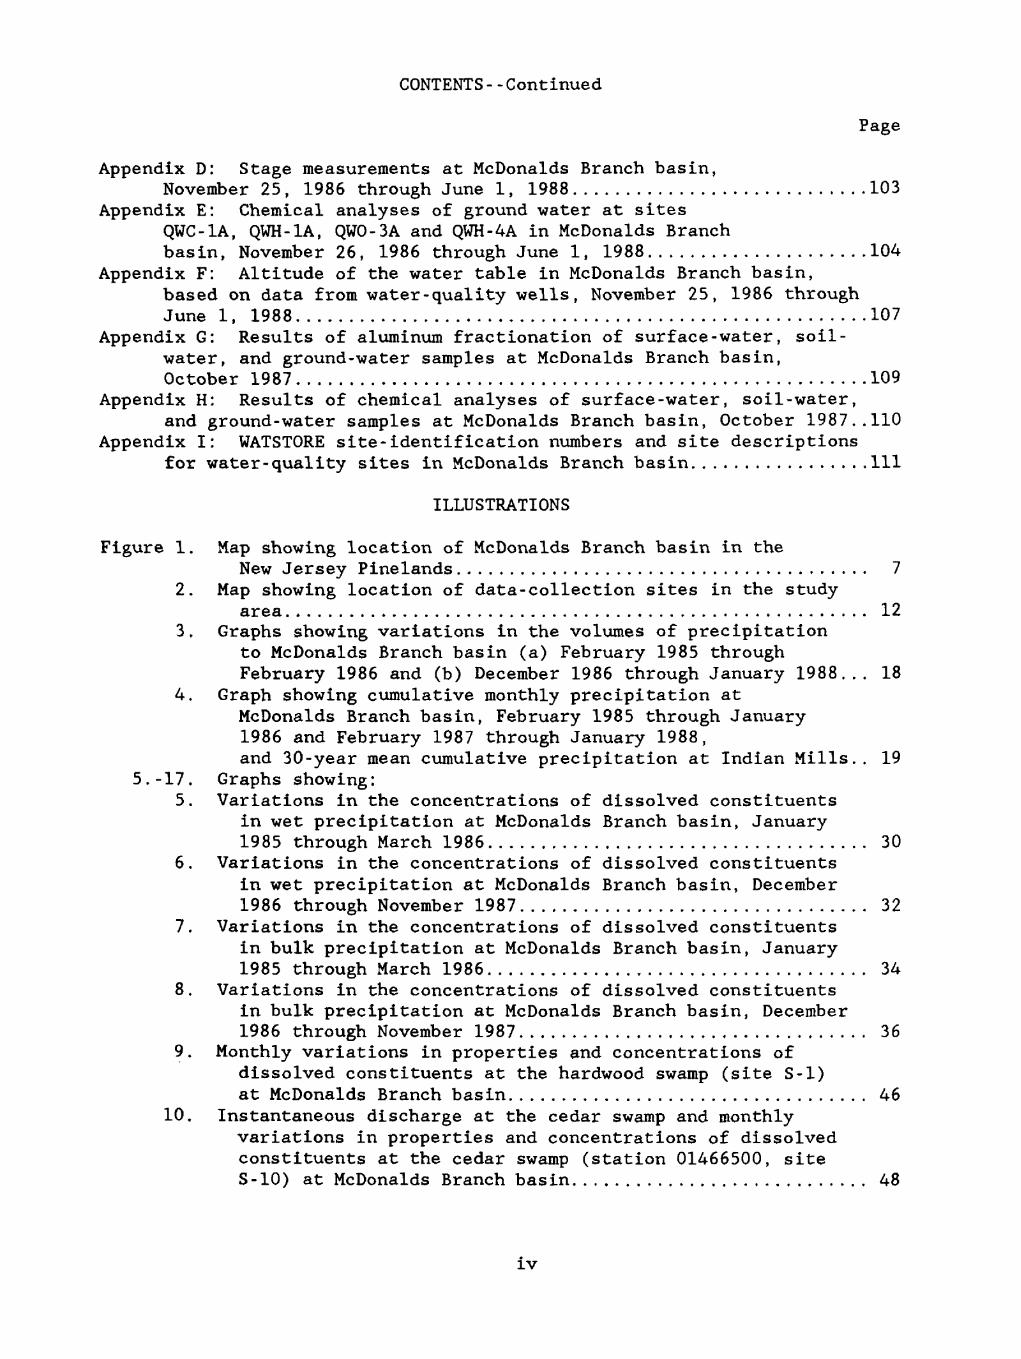
2. Map showing location of data-collection sites in the studyarea....................................................... 12
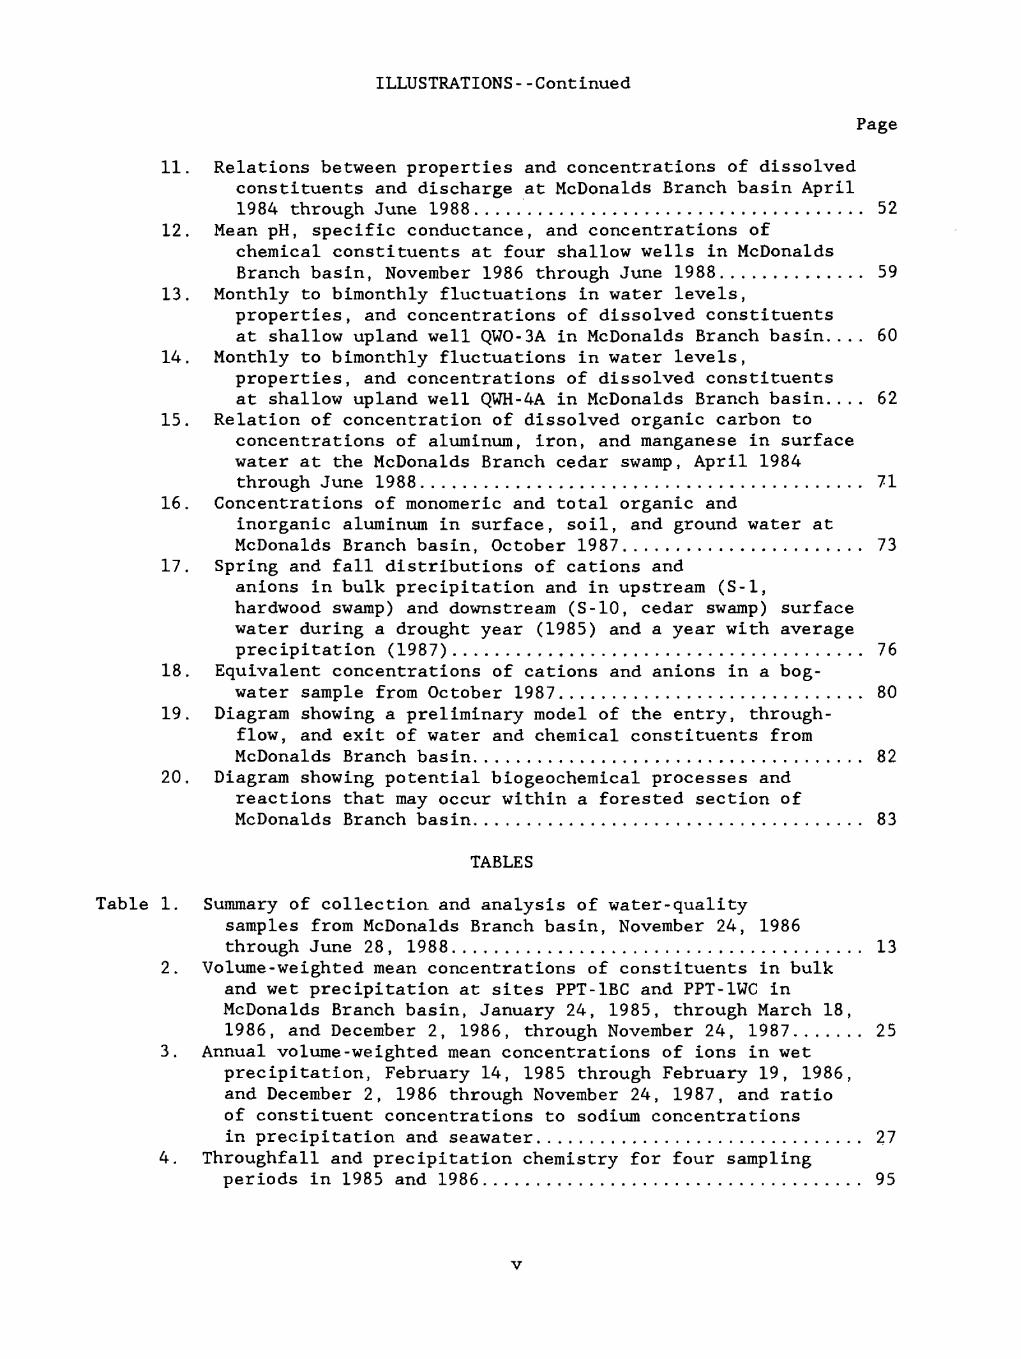
3. Graphs showing variations in the volumes of precipitation to McDonalds Branch basin (a) February 1985 through February 1986 and (b) December 1986 through January 1988... 18
4. Graph showing cumulative monthly precipitation atMcDonalds Branch basin, February 1985 through January 1986 and February 1987 through January 1988,and 30-year mean cumulative precipitation at Indian Mills.. 19
5.-17. Graphs showing:5. Variations in the concentrations of dissolved constituents
in wet precipitation at McDonalds Branch basin, January1985 through March 1986.................................... 30
6. Variations in the concentrations of dissolved constituents in wet precipitation at McDonalds Branch basin, December1986 through November 1987................................. 32
7. Variations in the concentrations of dissolved constituents in bulk precipitation at McDonalds Branch basin, January1985 through March 1986.................................... 34
8. Variations in the concentrations of dissolved constituents in bulk precipitation at McDonalds Branch basin, December1986 through November 1987................................. 36
9. Monthly variations in properties and concentrations ofdissolved constituents at the hardwood swamp (site S-l)at McDonalds Branch basin.................................. 46
10. Instantaneous discharge at the cedar swamp and monthlyvariations in properties and concentrations of dissolvedconstituents at the cedar swamp (station 01466500, siteS-10) at McDonalds Branch basin............................ 48
iv
ILLUSTRATIONS - -Continued
Page
11. Relations between properties and concentrations of dissolved constituents and discharge at McDonalds Branch basin April 1984 through June 1988..................................... 52
12. Mean pH, specific conductance, and concentrations ofchemical constituents at four shallow wells in McDonalds Branch basin, November 1986 through June 1988. ............. 59
13. Monthly to bimonthly fluctuations in water levels,properties, and concentrations of dissolved constituentsat shallow upland well QWO-3A in McDonalds Branch basin.... 60
14. Monthly to bimonthly fluctuations in water levels,properties, and concentrations of dissolved constituentsat shallow upland well QWH-4A in McDonalds Branch basin.... 62
15. Relation of concentration of dissolved organic carbon toconcentrations of aluminum, iron, and manganese in surfacewater at the McDonalds Branch cedar swamp, April 1984through June 1988.......................................... 71
16. Concentrations of monomeric and total organic andinorganic aluminum in surface, soil, and ground water at McDonalds Branch basin, October 1987....................... 73
17. Spring and fall distributions of cations andanions in bulk precipitation and in upstream (S-l, hardwood swamp) and downstream (S-10, cedar swamp) surface water during a drought year (1985) and a year with average precipitation (1987)....................................... 76
18. Equivalent concentrations of cations and anions in a bog- water sample from October 1987............................. 80
19. Diagram showing a preliminary model of the entry, through- flow, and exit of water and chemical constituents from McDonalds Branch basin..................................... 82
20. Diagram showing potential biogeochemical processes and reactions that may occur within a forested section of McDonalds Branch basin..................................... 83
TABLES
Table 1. Summary of collection and analysis of water-qualitysamples from McDonalds Branch basin, November 24, 1986through June 28, 1988....................................... 13
2. Volume-weighted mean concentrations of constituents in bulk and wet precipitation at sites PPT-1BC and PPT-1WC in McDonalds Branch basin, January 24, 1985, through March 18, 1986, and December 2, 1986, through November 24, 1987....... 25
3. Annual volume-weighted mean concentrations of ions in wetprecipitation, February 14, 1985 through February 19, 1986,and December 2, 1986 through November 24, 1987, and ratioof constituent concentrations to sodium concentrationsin precipitation and seawater............................... 27
4. Throughfall and precipitation chemistry for four samplingperiods in 1985 and 1986.................................... 95

TABLES- -Continued
Page
5. Statistical summary of selected dissolved constituents in surface water in the cedar swamp (site S-10 or station number 01466500) in McDonalds Branch basin, April 25, 1984 through June 28, 1988....................................... 40
6. Concentrations of major constituents at McDonalds Branch basinand concentrations in world average river water............. 41
7. Ion balances based on monthly samples of surface water at the McDonalds Branch cedar swamp (site S-10 or station number 01466500), April 1984 through June 1988 and the hardwood swamp (site S-l), December 1986 through June 1988. .......... 42
8. Statistical summary of properties and selected dissolvedconstituents in surface water in the hardwood swamp (site S-l) in McDonalds Branch basin, January 24, 1985 through February 19, 1986 and November 25, 1986 through June 28, 1988............................................... 43
9. Surface-water chemistry at the hardwood swamp(site S-l) and at the cedar swamp (site S-10 or station number 01466500) for the study period from November 25, 1986 through June 28, 1988....................................... 44
10. Correlation of chemical properties and constituents with flow at the cedar swamp (site S-10 or station number 01466500) in McDonalds Branch basin, April 24, 1984 through June 30,1988................................................ 50
11. Statistical summary of properties and selected dissolvedconstituents in shallow ground water at the hardwood swamp (well QWH-1A) in McDonalds Branch basin, January 31, 1985 through February 20, 1986 and November 25, 1986 through June 28, 1988............................................... 54
12. Statistical summary of properties and selected dissolved constituents in shallow ground water at an upland area (well QWH-4A) in McDonalds Branch basin, January 30, 1985 through February 20, 1986 and November 25, 1986 through May 31, 1988................................................ 55
13. Statistical summary of properties and selected dissolved constituents in shallow ground water at an upland area (well QWO-3A) in McDonalds Branch basin, February 4, 1985 through February 21, 1986 and November 25, 1986 through June 1, 1988................................................ 56
14. Statistical summary of properties and selected dissolved constituents in shallow ground water at the cedar swamp (well QWC-1A) in McDonalds Branch basin, February 7, 1985 through February 24, 1986 and November 25, 1986 through June 1, 1988................................................ 57
15. Correlation of properties and chemical constituents with water level at upland well QWO-3A in McDonalds Branch basin....................................................... 65
16. Correlation of properties and chemical constituents with water level at upland well QWH-4A in McDonalds Branch basin....................................................... 66
VL
TABLES--Continued
Page
17. Ratios of ions to chloride ion in surface water and ground water at McDonalds Branch basin with ratios in bulk precipitation, November 25, 1986 through November 24, 1987.. 68
18. Spearman correlation coefficients for trace elementsaluminum, iron, and manganese compared with dissolved organic carbon in surface water and shallow ground water at McDonalds Branch basin, based on analyses of samples collected from April 1984 through June 1988. ........ 72
19. Ion ratios to chloride ion (based on concentrations in equiva lents per liter) in precipitation and surface water in McDonalds Branch basin, March and October 1985 and March and October 1987............................................ 78
20. Equations for potential reactions and processes that might alter the chemistry of water as it passes through the hydrologic system at McDonalds Branch basin................. 84
VI1

Multiply
inch (in.)foot (ft)mile (mi)
square mile (mi 2 )
CONVERSION FACTORS AND VERTICAL DATUM
By To obtain
Length
cubic foot per second (ft3/s)
Multiply Bv.
Length
2.5400.30481.609
Area
2.590
Discharge rate
0.0283
centimeter (cm) meter (m) kilometer (km)
0.39373.2810.6215
Area
square kilometer (km2 ) 0.3861
Discharge rate
cubic meter per second (m3/s) 35.33
Weight
microgram (jug) milligram (mg) gram (g) kilogram (kg)
milliliter (mL) liter (L)
3.527 x 10 0.00003527 0.03527 2.205
Volume
0.033833.81
-8
centimetermeterkilometer
square kilometer
cubic meter per second
To obtain
inch foot mile
square mile
cubic foot per second
ounce, avoirdupoisounce, avoirdupoisounce, avoirdupoispound, avoirdupois
ounce, fluid ounce, fluid
viii

The equivalent weight or "combining weight" of a chemical species is obtained by dividing the formula weight of the ion by the ionic charge. The equivalent concentration in meq/L (milliequivalents per liter) is obtained by dividing the concentration in mg/L (milligrams per liter) by the equivalent weight (or by multiplying by I/equivalent weight).
Multiply By To obtain
Aluminum (A1 3+ ) mg/L 0.11119 Aluminum (A1 3+) meq/L
Calcium (Ca2+ ) mg/L .04990 Calcium (Ca2+ ) meq/L
Chloride (Cl~) mg/L .02821 Chloride (Cl~) meq/L
Hydrogen (H+ ) mg/L .99209 Hydrogen (H+ ) meq/L
Iron (Fe3+ ) mg/L .05372 Iron (Fe3+ ) meq/L2+ 2+
Magnesium (Mg ) mg/L .08226 Magnesium (Mg ) meq/L
Potassium (K ) mg/L .02557 Potassium (K ) meq/L
Sodium (Na+ ) mg/L .04350 Sodium (Na+ ) meq/L
Sulfate (S042 ~) mg/L .02082 Sulfate (SC^2 ') meq/L
(Hem, 1985, p. 56)
1 equivalent - 1,000 milliequivalents 1 milliequivalent 1,000 microequivalents
Temperature-conversion formula
degree Fahrenheit (°F) - 1.8 x degree Celsius (°C) + 32
Sea Level: In this report "sea level" refers to the National Geodetic Vertical Datum of 1929--a geodetic datum derived from a general adjustment of the first-order level nets of the United States and Canada, formerly called Sea Level Datum of 1929.
IX
WATER QUALITY AND HYDROGEOCHEMICAL PROCESSES IN MCDONALDS BRANCH BASIN,NEW JERSEY PINELANDS, 1984-88
by Patricia A. Johnsson and Julia L. Barringer
ABSTRACT
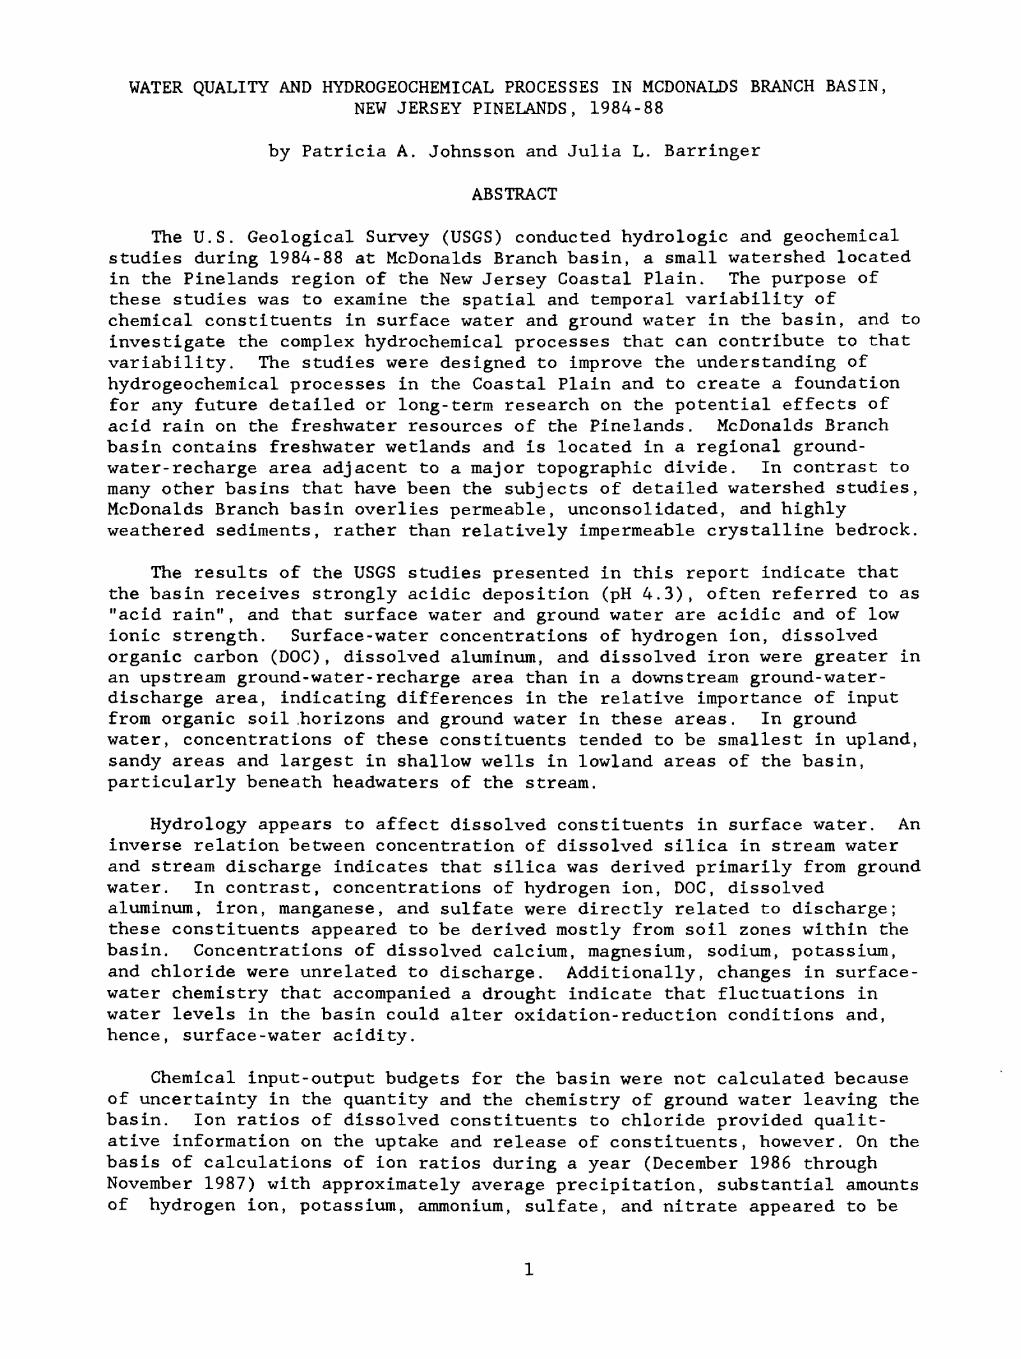
The U.S. Geological Survey (USGS) conducted hydrologic and geochemical studies during 1984-88 at McDonalds Branch basin, a small watershed located in the Pinelands region of the New Jersey Coastal Plain. The purpose of these studies was to examine the spatial and temporal variability of chemical constituents in surface water and ground water in the basin, and to investigate the complex hydrochemical processes that can contribute to that variability. The studies were designed to improve the understanding of hydrogeochemical processes in the Coastal Plain and to create a foundation for any future detailed or long-term research on the potential effects of acid rain on the freshwater resources of the Pinelands. McDonalds Branch basin contains freshwater wetlands and is located in a regional ground- water-recharge area adjacent to a major topographic divide. In contrast to many other basins that have been the subjects of detailed watershed studies, McDonalds Branch basin overlies permeable, unconsolidated, and highly weathered sediments, rather than relatively impermeable crystalline bedrock.
The results of the USGS studies presented in this report indicate that the basin receives strongly acidic deposition (pH 4.3), often referred to as "acid rain", and that surface water and ground water are acidic and of low ionic strength. Surface-water concentrations of hydrogen ion, dissolved organic carbon (DOC), dissolved aluminum, and dissolved iron were greater in an upstream ground-water-recharge area than in a downstream ground-water- discharge area, indicating differences in the relative importance of input from organic soil .horizons and ground water in these areas. In ground water, concentrations of these constituents tended to be smallest in upland, sandy areas and largest in shallow wells in lowland areas of the basin, particularly beneath headwaters of the stream.
Hydrology appears to affect dissolved constituents in surface water. An inverse relation between concentration of dissolved silica in stream water and stream discharge indicates that silica was derived primarily from ground water. In contrast, concentrations of hydrogen ion, DOC, dissolved aluminum, iron, manganese, and sulfate were directly related to discharge; these constituents appeared to be derived mostly from soil zones within the basin. Concentrations of dissolved calcium, magnesium, sodium, potassium, and chloride were unrelated to discharge. Additionally, changes in surface- water chemistry that accompanied a drought indicate that fluctuations in water levels in the basin could alter oxidation-reduction conditions and, hence, surface-water acidity.
Chemical input-output budgets for the basin were not calculated because of uncertainty in the quantity and the chemistry of ground water leaving the basin. Ion ratios of dissolved constituents to chloride provided qualit ative information on the uptake and release of constituents, however. On the basis of calculations of ion ratios during a year (December 1986 through November 1987) with approximately average precipitation, substantial amounts of hydrogen ion, potassium, ammonium, sulfate, and nitrate appeared to be

accumulated in the basin. Calcium and magnesium accumulated in some areas and were released in other areas. Dissolved organic carbon, dissolved aluminum, iron, manganese, and silica apparently were released within the basin. Because these input-output relations are based on only a single year of data, these relations may not be representative of long-term conditions in the basin.
Relatively large concentrations of aluminum, iron, and manganese were present in some basin waters; aluminum, iron, and manganese correlated well with organic carbon in surface water at the downstream gaging station, but these metals did not appear to correlate well with organic carbon in most ground water or with organic carbon in surface water in other parts of the basin. Preliminary investigations of aluminum distributions into organic and inorganic forms indicated that relatively large concentrations of inorganic monomeric aluminum (generally considered to be toxic to aquatic life at large concentrations) were present in some surface and ground waters.
In general, these studies, as well as previous studies, indicate that a number of hydrological, geochemical, and biological processes are working together to govern the acidity of ground and surface water in the basin. Additional investigation, including long-term monitoring of precipitation, surface-water and ground-water chemistry, and detailed studies of individual processes, is needed to determine the role of acidic deposition in the acidification of surface and ground water.
INTRODUCTION
A forested watershed is a dynamic system wherein the hydrological, geological, and biological cycles interact to produce a complex environment. As Likens and others (1977) demonstrated in their classic study at the Hubbard Brook Experimental Forest (HBEF) in New Hampshire, the study of watershed processes requires an integrated approach that encompasses components of all three cycles. The "small-watershed approach" developed by Likens and others (1977) calls for selection of a watershed with an "impermeable" base such that ground-water inputs or outputs presumably are negligible, and differences between chemical inputs in precipitation and outputs in surface water may be attributed to processes that occur within the confines of the basin. The basinwide cycling of some chemical constituents can be determined by monitoring precipitation and surface-water quality and volumes. Information on specific processes can be determined by sampling water as it moves through the ecosystem--for example, sampling at different horizons in the soil zone or under various types of canopy vegetation.
Application of the small-watershed approach to an expanding number of forested sites led to an improved understanding of natural watershed processes and to a growing awareness that such processes may be perturbed by human activities. Perhaps the greatest emphasis of watershed studies to date (1991) has been on the role of acidic deposition (acid rain) in the acidification of surface water and the decline of forests in North America and Europe. A number of small-watershed studies conducted in areas such as the White Mountains of New Hampshire (Cronan, 1980; Johnson and others, 1981), the Adirondack Mountains of New York (Galloway and others, 1980) and

the Catoctin Mountains of Maryland (Katz and others, 1985) have indicated that current concentrations of sulfuric acid present in wet and dry precipitation may cause the acidification of lakes and rivers. Susceptibility of lakes or rivers to acidification appears to be affected, to a large extent, by geologic setting--carbonate rocks tend to neutralize rain acidity, whereas crystalline silicate rocks and noncarbonate sandstones are unable to neutralize acidity as effectively.
Soil properties also can determine sensitivity to acidification; for example, Cleaves and others (1970) determined that a thick soil cover at Pond Branch in western Maryland provided weatherable minerals for neutralization of acid rain. Johnson and others (1981) and Johnson and Reuss (1984) demonstrated that the ability of soils to neutralize acidity also may be related to the capacity of a particular soil to adsorb sulfate 1 from the soil solution. Lastly, hydrologic factors may be important; for example, increased residence time of water in the soil zone may enhance the ability of the soil to neutralize acidity through processes such as sulfate adsorption or mineral weathering (Lynch and others, 1986).
A number of researchers have noted that acid rain can increase leaching of aluminum from soils (Cronan and Schofield, 1979); this aluminum may be transported into springs, lakes, and ground water. Aluminum in its ionic form may be toxic to fish at concentrations as small as 200 ng/L (micrograms per liter) (Driscoll and others, 1980; Schofield and Trojnar, 1980), and large aluminum concentrations in soil solution can adversely affect tree growth (Ulrich and others, 1980).
Most watershed studies of natural and acid-rain-induced processes have been located in mountainous ecosystems or in lowland areas with crystalline bedrock; relatively little is known about natural watershed processes in coastal-plain ecosystems or about the potential effects of acid rain on these ecosystems. In general, studies of coastal plain areas usually are not suitable for the small-watershed approach as defined by Likens and others (1977) because of the difficulty of identifying a coastal-plain watershed underlain by impermeable rock that contributes virtually no ground water to the hydrologic system. In order to improve an understanding of hydrogeochemical processes in the Coastal Plain, the U.S. Geological Survey (USGS) began, in 1983, an intensive watershed study at McDonalds Branch basin, a small watershed in the Pinelands region of the New Jersey Coastal Plain. McDonalds Branch basin contains freshwater wetlands, is located in a ground-water-recharge area, and overlies unconsolidated, highly weathered sands with interbedded clays, rather than crystalline bedrock. Although the small-watershed approach of other researchers could not be applied at McDonalds Branch basin because of the complexity of the ground-water-flow regime, a network of wells permitted qualitative analysis of the ground- water component of the hydrologic cycle.
1 In this report, dissolved species are referred to by the element or compound name; for example,^calcium and sulfate. Specific ionic forms are identified--for example, Al . Ionic hydrogen (commonly referred to as hydronium ion (H.,0 )) is referred to as hydrogen ion to distinguish this form from hydrogen in gaseous form.
3

The USGS studies at McDonalds Branch basin were prompted, in part, by the importance of the Pinelands area as a major east-coast freshwater reserve and by uncertainty concerning the potential susceptibility of the area to the deleterious effects of acid rain. The Pinelands region receives acidic precipitation (pH generally < 4.5) and may be especially susceptible to acidification because the soils and the underlying sands have relatively few weatherable silicate minerals such as clays and, therefore, minimal buffering capacities. Several researchers have conducted statistical analyses of long-term stream-chemistry data from the Pinelands; results of their studies have led to conflicting conclusions about the trends in acidity. Johnson (1979a, b) concluded that the acidity of surface waters had increased (pH had decreased) since the 1960's, and he attributed this increase to acid rain. In contrast, Smith and Alexander (1983) and Morgan (1984) concluded that the acidity of surface waters had not changed at one site (McDonalds Branch), and Morgan (1984) concluded that acidity had indicated first an upward trend and then a downward trend at a second site (Oyster Creek). A study by the National Research Council (1986) indicated no trend in pH or in concentrations of alkalinity or sulfate at McDonalds Branch. These conflicting conclusions are partly related to differences in the methods used to study chemical trends over time; however, the complex hydrology and geochemistry of the Pinelands may complicate the identification of long-term trends. As Morgan (1984) suggested, a number of natural and anthropogenic processes may be working together to govern the chemistry, and particularly the acidity, of streams in the Pinelands.
The presence of freshwater wetlands in the Pinelands undoubtedly contribute to the hydrologic and geochemical complexity of the watersheds of this area. As Gorham and others (1984) indicated, the vulnerability of bogs and fens to the effects of acid rain is unknown; these authors identified a number of processes that might serve to control alkalinity or buffering in wetlands and to complicate the identification of acid-rain effects. Certain species of Sphagnum mosses, particularly the hummock-forming species (for example, S. magellanicum and S. fuscum) can acidify surrounding waters, and the effects of these species, therefore, must be taken into consideration in determining the effects of acid rain. Nitrification, oxidation of hydrogen sulfide (H_S), and pyrite oxidation also can increase acidity of wetland waters. Processes that may decrease acidity of wetland waters include weathering reactions, cation exchange in which hydrogen ions are consumed and replaced by other cations, anion exchange, denitrification, and sulfate reduction. Aluminum hydroxides also can act as buffers in the pH range of 4 to 5 in waters that receive drainage from mineral soils (Johannessen, 1980).
Gorham and others (1984) also stressed the potential importance of hydrology in controlling wetland acidification. For example, the authors suggested that sulfate reduction in wetlands could be followed by re- oxidation when the water table declines seasonally, as a result of drainage for water use, and (or) drought. Such oxidation would lead to the release of acidity into wetland waters.
In subsequent USGS studies, a modification of the small-watershed approach was applied to a watershed in the New Jersey Pinelands. The studies were designed to improve the understanding of hydrogeochemical processes in a coastal-plain setting that contains freshwater wetlands and to serve as a foundation for any future, detailed or long-term research on
the potential effects of acid rain on the freshwater resources of the Pinelands. Researchers focused on identification of the factors controlling variability in surface- and ground-water chemistry and on the effects of hydrology on surface-water chemistry. The studies were conducted in cooperation with the New Jersey Department of Environmental Protection and Energy.
Purpose and Scope
This report describes the spatial and temporal variability in the chemical constituents of surface and ground water in a small watershed in the Pinelands and discusses the complex hydrologic and geochemical processes thought to contribute to the variability associated with the freshwater wetlands within the basin.
The report presents hydrologic measurements (precipitation amounts, stream stage and discharge, and water-table altitudes) and water-quality data (from analysis of samples of bulk and wet precipitation, surface water, and ground water) collected as part of a 1986-88 study by the USGS at McDonalds Branch basin. The data from this study are examined, along with previously published results from other USGS investigations in the basin as follows: (1) hydrologic measurements (precipitation volumes, stream stage and discharge, and water-table altitudes), and data on quality of precipitation, throughfall, surface water, and ground water collected during an intensive 1983-86 USGS study at McDonalds Branch basin (Lord and others, 1990); and (2) surface-water-quality and discharge data collected at the USGS Hydrologic Benchmark station in the basin (Bauersfeld and others, 1987).
Previous Investigations
Previous investigations at McDonalds Branch provide a basis for current hydrogeochemical research, including work by Rhodehamel (1970, 1979b) on hydrology, by Swanson (1979), Turner (1983), and Turner and others (1985a and 1985b) on trace-element geochemistry, by Markley (1955) on soils, by McCormick (1955) on vegetation, by Madsen and others (1986) on biochemical processes, and by Wang (1984) on the relation of fire and nutrient dynamics. Additionally, the USGS has collected streamflow and water-quality data at McDonalds Branch since 1953 and 1963, respectively, as part of the nationwide Hydrologic Benchmark Network. This record has been utilized by a number of researchers (Johnson, 1979a and 1979b; Smith and Alexander, 1983; Morgan, 1984; and National Research Council, 1986) in studies of long-term trends in acidification of surface waters, and served as an invaluable data base for designing the investigations described here. Lastly, McDonalds Branch is the focus of ongoing research not only by the USGS but by various universities, as well. Recent studies include investigations of sulfate reduction in peat at the McDonalds Branch cedar swamp by researchers at Rutgers University (Spratt and others, 1987), and studies of colloid mobilization in ground waters by researchers at the Massachusetts Institute of Technology (Ryan and Gschwend, 1990).
Relations among cations and anions in surface and ground waters, and variations in surface- and ground-water chemistry with factors such as location within the basin, stream discharge, and altitude of the water

table, are used to investigate the hydrogeochemical controls on the components of acidity. Weight and equivalent ratios of selected ions (ion ratios) to chloride are used to investigate the cycling of chemical components within the basin. Sulfur cycling, iron geochemistry, aluminum geochemistry, and natural organic geochemistry are described in detail because of their significant contributions to the acidity of basin waters. Results of field fractionations of dissolved aluminum in surface-, ground-, and soil-water samples done during October 1987 also are presented. Additionally, spring and fall surface-water chemistry from a drought year (1985) are compared with spring and fall surface-water chemistry from a year with average precipitation (1987) to determine the effects of a summer drought on the surface water and ground water of the basin. Lastly, a preliminary conceptual model of basin hydrogeochemistry is presented.
Acknowledgments
Christopher Cronan of the University of Maine provided instruction in the method of field fractionation of aluminum and loaned equipment for performing the fractionations. Charles Driscoll of Syracuse University arranged for the fractionated aluminum samples to be analyzed at his laboratory, and shared his valuable knowledge concerning aluminum fractionation techniques. Robert Santore (Syracuse University), who wrote the Langmuir regression program used to calculate sample concentrations, analyzed the aluminum samples. Both the project and this paper benefited from numerous discussions with Noye Johnson (Dartmouth College, deceased), whose generous consultation will be greatly missed. The manuscript benefited significantly from critical review by Mark Johnsson (Princeton University).
Particular gratitude is expressed to Anthony Altieri, Joseph Speck, and Michael Arecco of the New Jersey Department of Environmental Protection and Energy, who collected and processed precipitation samples and measured water levels at many of the wells.
Lastly, the encouragement and support of Robert Runyon, Gail Carter, and Gregory Cooper of the New Jersey Department of Environmental Protection and Energy is gratefully acknowledged.
DESCRIPTION OF STUDY AREA
Location
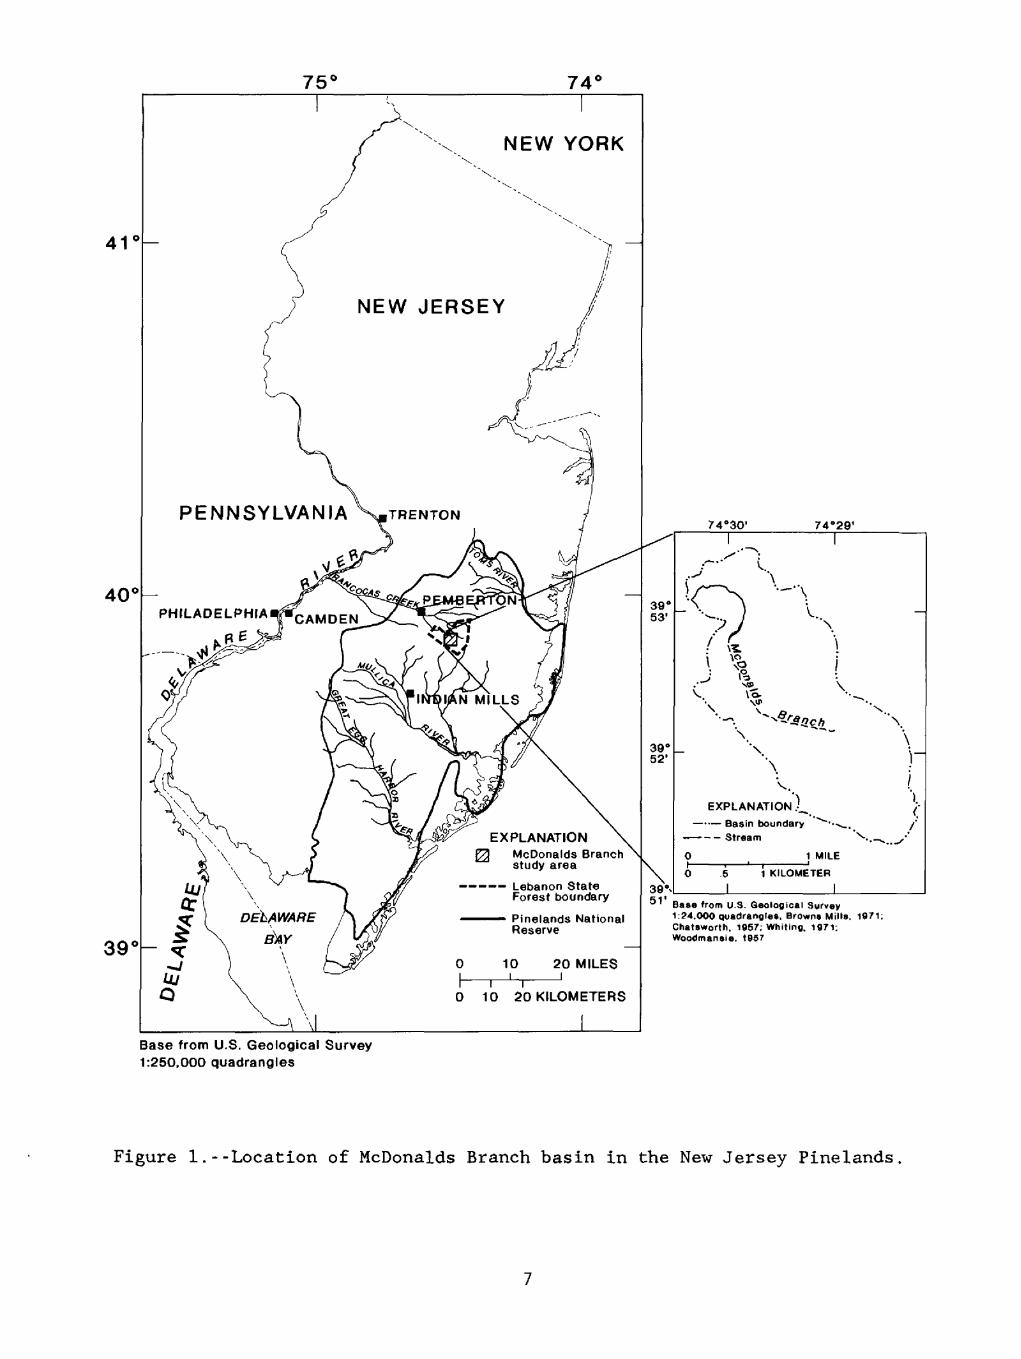
McDonalds Branch basin, a small (2.35-mi 2 (square mile)) forested watershed located in Lebanon State Forest, about 20 mi (miles) from the coast, was chosen as the study area (fig. 1). The basin is located just to the west of the main surface-water drainage divide in the Pinelands and contains a single first-order stream--McDonalds Branch. McDonalds Branch flows into Rancocas Creek, a tributary to the Delaware River. Physiographic relief in the basin is low, with elevations ranging from about 200 ft (feet) above sea level in the southeastern corner to about 120 ft in the northwestern corner, where the stream flows out of the basin (fig. 1). As noted by Bacho (1955) , the McDonalds Branch watershed contains several
NEW YORK
NEW JERSEY
PENNSYLVANIA X.TRENTON
PHILADELPHIA«*CAMDEN
INtMAN MILLS
EXPLANATIONMcDonalds Branch study area
Lebanon State Forest boundary
^ ' Base from U.S. Geological Survey 1:24.000 quadrangles. Browns Mills Chatsworth. 1957: Whiting. 1971; Woodmansie. t957
Pinelands National Reserve
10 20 KILOMETERS
Base from U.S. Geological Survey 1:250,000 quadrangles
Figure 1.--Location of McDonalds Branch basin in the New Jersey Pinelands.

upland swamps separated from the stream channel; the swamps appear to result from the perching of ground water by clay layers that underlie these upland hollows.
A number of factors make McDonalds Branch basin an excellent location for the study of hydrogeochemical processes in the Pinelands. Although small, the basin contains many of the diverse plant communities and soil types that characterize the Pinelands as a whole. Hardwood swamps and cedar swamps are present, along with the ubiquitous mixed pine and oak forests of the Pinelands. Development in the basin is minimal; activities are limited mostly to hunting and scientific investigations. The area contains several unpaved roads and one paved road that are not salted during the winter, so that the complicating factor of road-salt input does not have to be taken into consideration in calculating ion budgets for the basin.
The geology, hydrology, soils, and vegetation at McDonalds Branch barsin are summarized in subsequent sections and are related to the characteristics of the Pinelands in general. Detailed information on these topics, including appropriate maps, is available in Lord and others (1990).
Geology
The geology of McDonalds Branch basin is dominated by the Cohansey Sand, a northern Atlantic Coastal Plain sedimentary unit consisting of unconsolidated, highly weathered sand and gravel of Miocene age (Rhodehamel, 1979a), which is underlain by the Kirkwood Formation (Knapp, 1904) of middle Miocene age (Rhodehamel, 1979a). In the region of McDonalds Branch basin, the Cohansey Sand is believed to be of deltaic origin (Owens and Sohl, 1969) and is approximately 100 ft thick (Rhodehamel, 1979a, fig. 3, p. 49). According to Rhodehamel (1979a, p. 47), the Cohansey Sand is lithologically variable, but is "predominantly a yellow, limonitic (mostly goethitic) quartz sand containing minor amounts of pebbly sand, fine to coarse sand, silty and clayey sand, and interbedded clay." Small quantities of weathered feldspar, chert, and vein quartz are present, along with rounded ironstone pebbles. Muscovite, detrital lignite, and ilmenite also are present in some areas (Rhodehamel, 1979b). Means and others (1981, p. 2) described iron- oxide stains and cements in the Cohansey Sand and in the underlying Kirkwood Formation. In the present study, iron-cemented sediments were observed during well drilling at McDonalds Branch. Well logs and geophysical surveys within the basin also revealed a number of clay lenses of variable thickness and extent within the Cohansey Sand. The lenses are composed primarily of fine-grained quartz, kaolinite, and illite (Lord and others, 1990), and may have important effects on the hydrology and geochemistry of the basin by altering flow paths and by providing a source of clay minerals for ion- exchange or other reactions (Lord and others, 1986).
In some upland parts of the basin, the Cohansey Sand is unconformably overlain by the more resistant Beacon Hill Gravel of Miocene age (Owens and Minard, 1975). The Beacon Hill Gravel was deposited by fluvial processes, and consists of coarse-grained sand and gravel, with pebbles of vein quartz, quartzite, and fossiliferous chert (Minard, 1966). Alluvial deposits of late Tertiary age consisting of reddish- to yellowish-brown quartz sand eroded from the Cohansey Sand are present in lowland parts of the basin (J.P. Owens, U.S. Geological Survey, oral commun., 1986). Quaternary

alluvial and eolian deposits are scattered throughout the basin (Owens and Minard, 1975; Rhodehamel, 1979a), and dark brown Quaternary organic deposits line streams and undrained depressions (E.G. Rhodehamel, U.S. Geological Survey, written commun., 1965).
Hydrology
The Pinelands have a humid and temperate climate that is mostly continental (Markley, 1971). During the summer and early fall, however, maritime air masses often dominate because of the presence of the Bermuda high over the Atlantic Ocean (Havens, 1979). The average annual precipitation to the Pinelands, on the basis of data collected during 1951- 80 at Pemberton is 45.8 in. (inches); the largest average monthly precipitation, 5.3 in., occurs in August, and the smallest average monthly precipitation, 3.1 in., occurs in February (National Oceanic and Atmospheric Administration, 1982).
The Pinelands area is underlain by the Kirkwood-Cohansey aquifer system, which consists of discontinuous Quaternary and late Tertiary deposits, the areally extensive Cohansey Sand, and the underlying Kirkwood Formation. In much of the aquifer system, ground water moves along short flow paths and discharges to small streams; however, according to Rhodehamel (1979b), precipitation on the upland areas of the Pinelands, such as McDonalds Branch basin, percolates through the sandy soil and geologic materials and recharges the deep regional ground-water flow system. This deep regional system discharges to streams in lower-lying basins along the periphery of the Pinelands.
Rhodehamel (1970 and 1979b) did the most comprehensive investigation to date of the surface- and ground-water hydrology of the Pinelands. On the basis of data collected during 1931-64, he calculated a long-term annual hydrologic budget for the region by means of the equation P - R + ET, where the average precipitation (P) is 45 in., the average stream runoff (R) is 22.5 in., and the average evapotranspiration (ET), estimated from the difference between P and R, is 22.5 in. (Rhodehamel, 1970, p. 1). Studies by Rhodehamel indicate that the calculation of hydrologic and chemical input/output budgets at McDonalds Branch should include possible water loss from the basin in the form of ground-water recharge. Rhodehamel (1979b, p. 161) also noted that ground-water discharge constitutes, on average, 89 percent of total annual discharge of streams in the Pinelands.
Bauersfeld and others (1987) report an average annual discharge at McDonalds Branch of 13.06 in. per year (2.26 cubic feet per second), on the basis of data collected during 1953-86.
Soils and Vegetation
The soils of the Pinelands are characteristically acidic, with surface (A horizon) pH ranging from 3.6 to 4.0 and subsoil (B horizon) and substratum (C horizon) pH ranging from 4.2 to 5.0, with an average (for B and C horizons) of about 4.6 reported by Markley (1979, p. 81). The drainage properties of soils in the Pinelands differ greatly; excessively drained, extensively leached Quartzipsanunents and Hapludults are found in upland regions, and very poorly drained Haplaquods, muck and peat are found
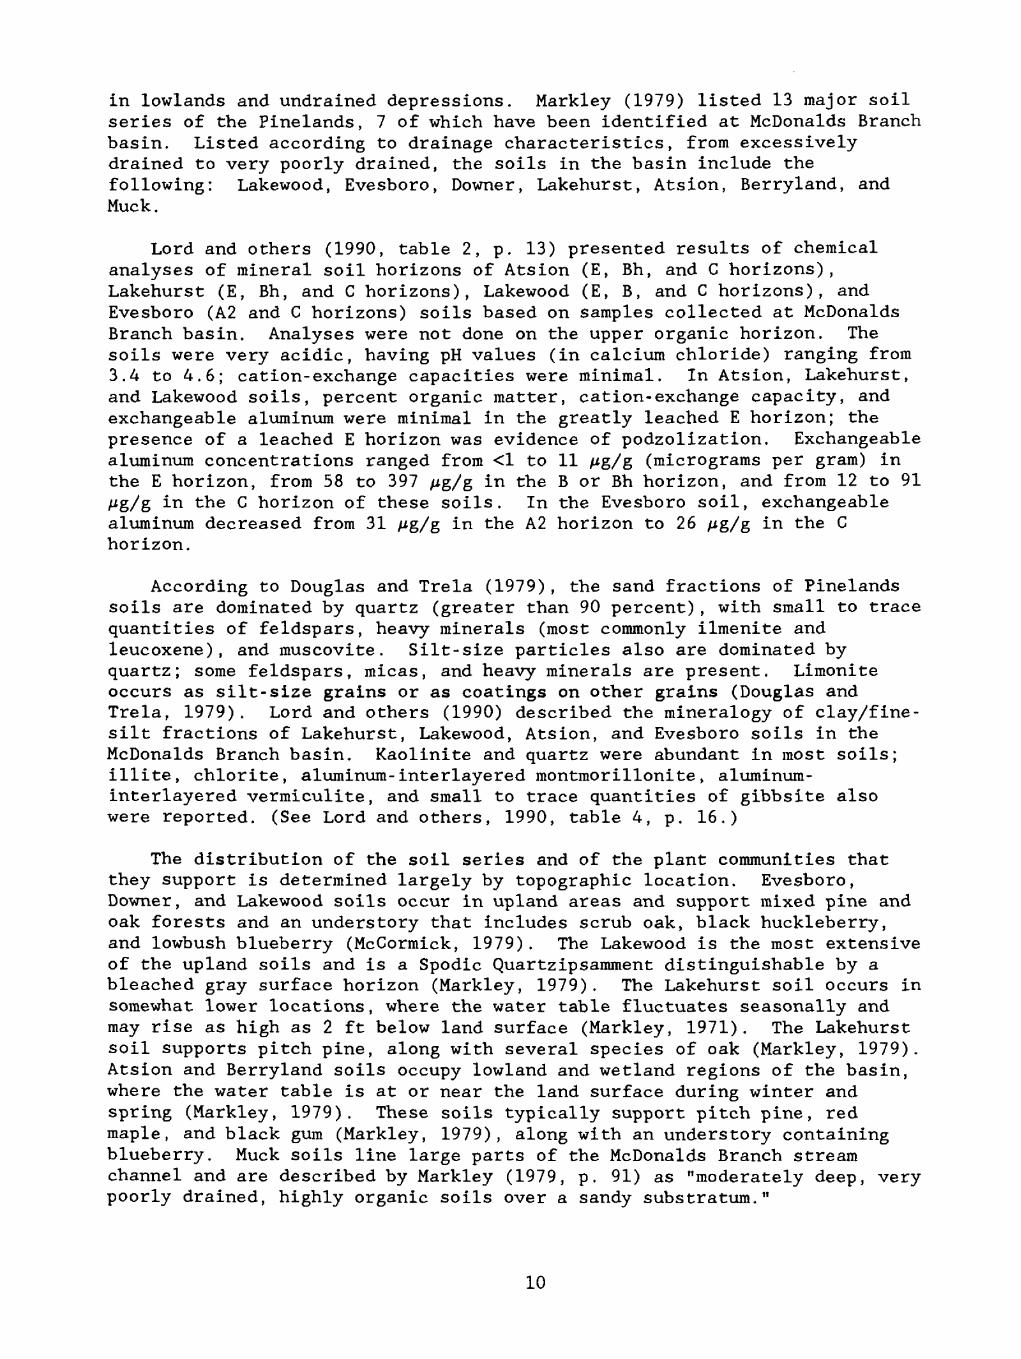
in lowlands and undrained depressions. Markley (1979) listed 13 major soil series of the Pinelands, 7 of which have been identified at McDonalds Branch basin. Listed according to drainage characteristics, from excessively drained to very poorly drained, the soils in the basin include the following: Lakewood, Evesboro, Downer, Lakehurst, Atsion, Berryland, and Muck.
Lord and others (1990, table 2, p. 13) presented results of chemical analyses of mineral soil horizons of Atsion (E, Bh, and C horizons), Lakehurst (E, Bh, and C horizons), Lakewood (E, B, and C horizons), and Evesboro (A2 and C horizons) soils based on samples collected at McDonalds Branch basin. Analyses were not done on the upper organic horizon. The soils were very acidic, having pH values (in calcium chloride) ranging from 3.4 to 4.6; cation-exchange capacities were minimal. In Atsion, Lakehurst, and Lakewood soils, percent organic matter, cation-exchange capacity, and exchangeable aluminum were minimal in the greatly leached E horizon; the presence of a leached E horizon was evidence of podzolization. Exchangeable aluminum concentrations ranged from <1 to 11 A*g/g (micrograms per gram) in the E horizon, from 58 to 397 A*g/g in tne B or Bh horizon, and from 12 to 91 A*g/g in the C horizon of these soils. In the Evesboro soil, exchangeable aluminum decreased from 31 A*g/g in the A2 horizon to 26 A*g/g in the C horizon.
According to Douglas and Trela (1979), the sand fractions of Pinelands soils are dominated by quartz (greater than 90 percent), with small to trace quantities of feldspars, heavy minerals (most commonly ilmenite and leucoxene), and muscovite. Silt-size particles also are dominated by quartz; some feldspars, micas, and heavy minerals are present. Limonite occurs as silt-size grains or as coatings on other grains (Douglas and Trela, 1979). Lord and others (1990) described the mineralogy of clay/fine- silt fractions of Lakehurst, Lakewood, Atsion, and Evesboro soils in the McDonalds Branch basin. Kaolinite and quartz were abundant in most soils; illite, chlorite, aluminum-interlayered montmorillonite, aluminum- interlayered vermiculite, and small to trace quantities of gibbsite also were reported. (See Lord and others, 1990, table 4, p. 16.)
The distribution of the soil series and of the plant communities that they support is determined largely by topographic location. Evesboro, Downer, and Lakewood soils occur in upland areas and support mixed pine and oak forests and an understory that includes scrub oak, black huckleberry, and lowbush blueberry (McCormick, 1979). The Lakewood is the most extensive of the upland soils and is a Spodic Quartzipsamment distinguishable by a bleached gray surface horizon (Markley, 1979). The Lakehurst soil occurs in somewhat lower locations, where the water table fluctuates seasonally and may rise as high as 2 ft below land surface (Markley, 1971). The Lakehurst soil supports pitch pine, along with several species of oak (Markley, 1979). Atsion and Berryland soils occupy lowland and wetland regions of the basin, where the water table is at or near the land surface during winter and spring (Markley, 1979). These soils typically support pitch pine, red maple, and black gum (Markley, 1979), along with an understory containing blueberry. Muck soils line large parts of the McDonalds Branch stream channel and are described by Markley (1979, p. 91) as "moderately deep, very poorly drained, highly organic soils over a sandy substratum."
10
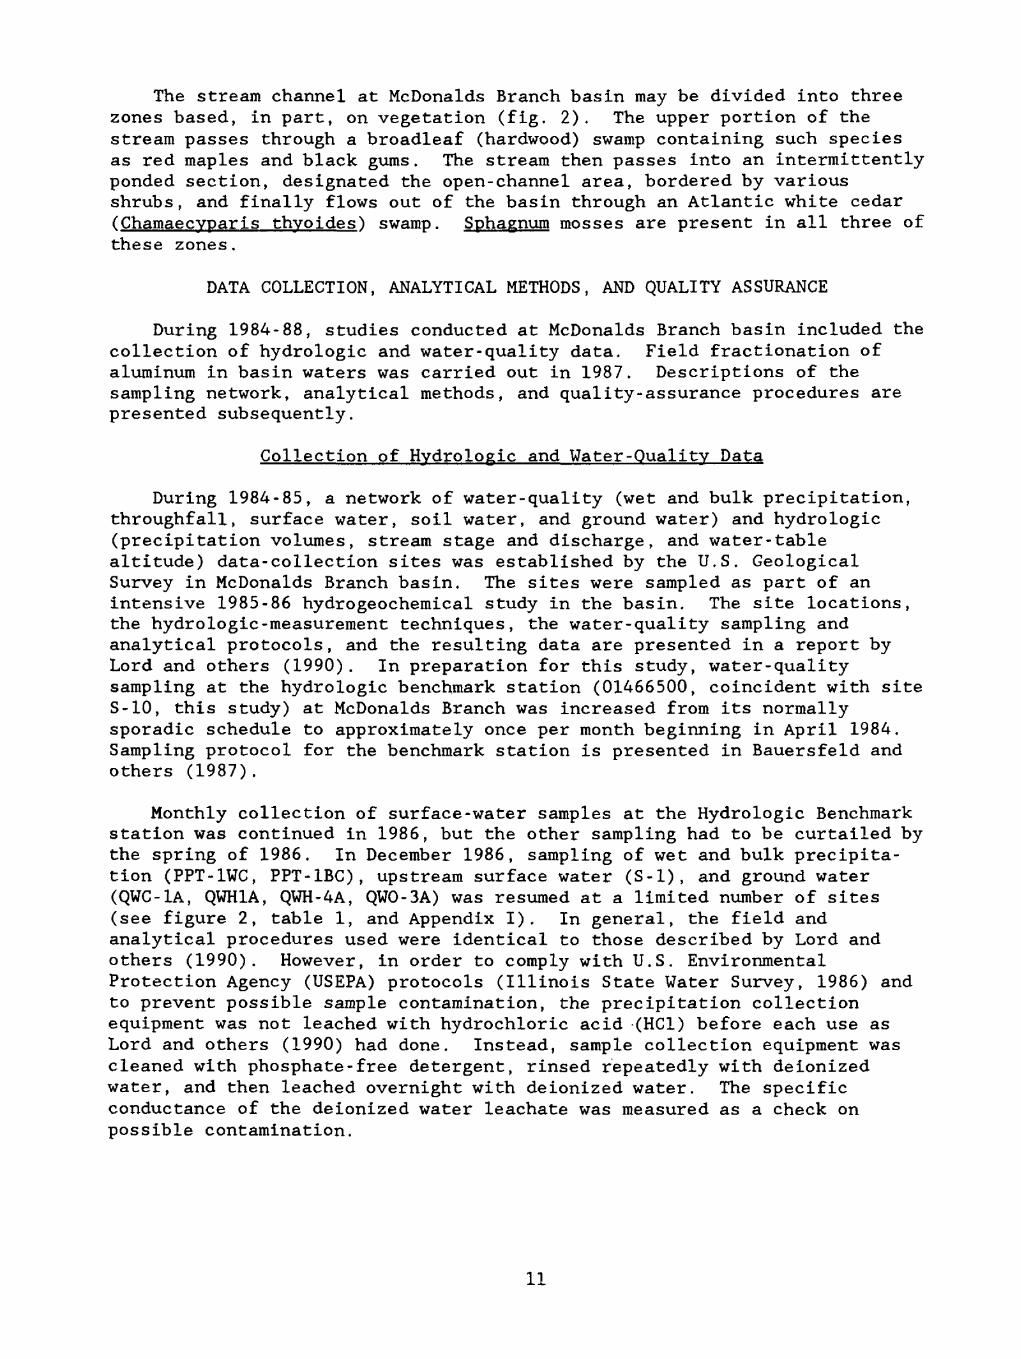
The stream channel at McDonalds Branch basin may be divided into three zones based, in part, on vegetation (fig. 2). The upper portion of the stream passes through a broadleaf (hardwood) swamp containing such species as red maples and black gums. The stream then passes into an intermittently ponded section, designated the open-channel area, bordered by various shrubs, and finally flows out of the basin through an Atlantic white cedar (Chamaecyparis thyoides') swamp. Sphagnum mosses are present in all three of these zones.
DATA COLLECTION, ANALYTICAL METHODS, AND QUALITY ASSURANCE
During 1984-88, studies conducted at McDonalds Branch basin included the collection of hydrologic and water-quality data. Field fractionation of aluminum in basin waters was carried out in 1987. Descriptions of the sampling network, analytical methods, and quality-assurance procedures are presented subsequently.
Collection of Hydrologic and Water-Quality Data
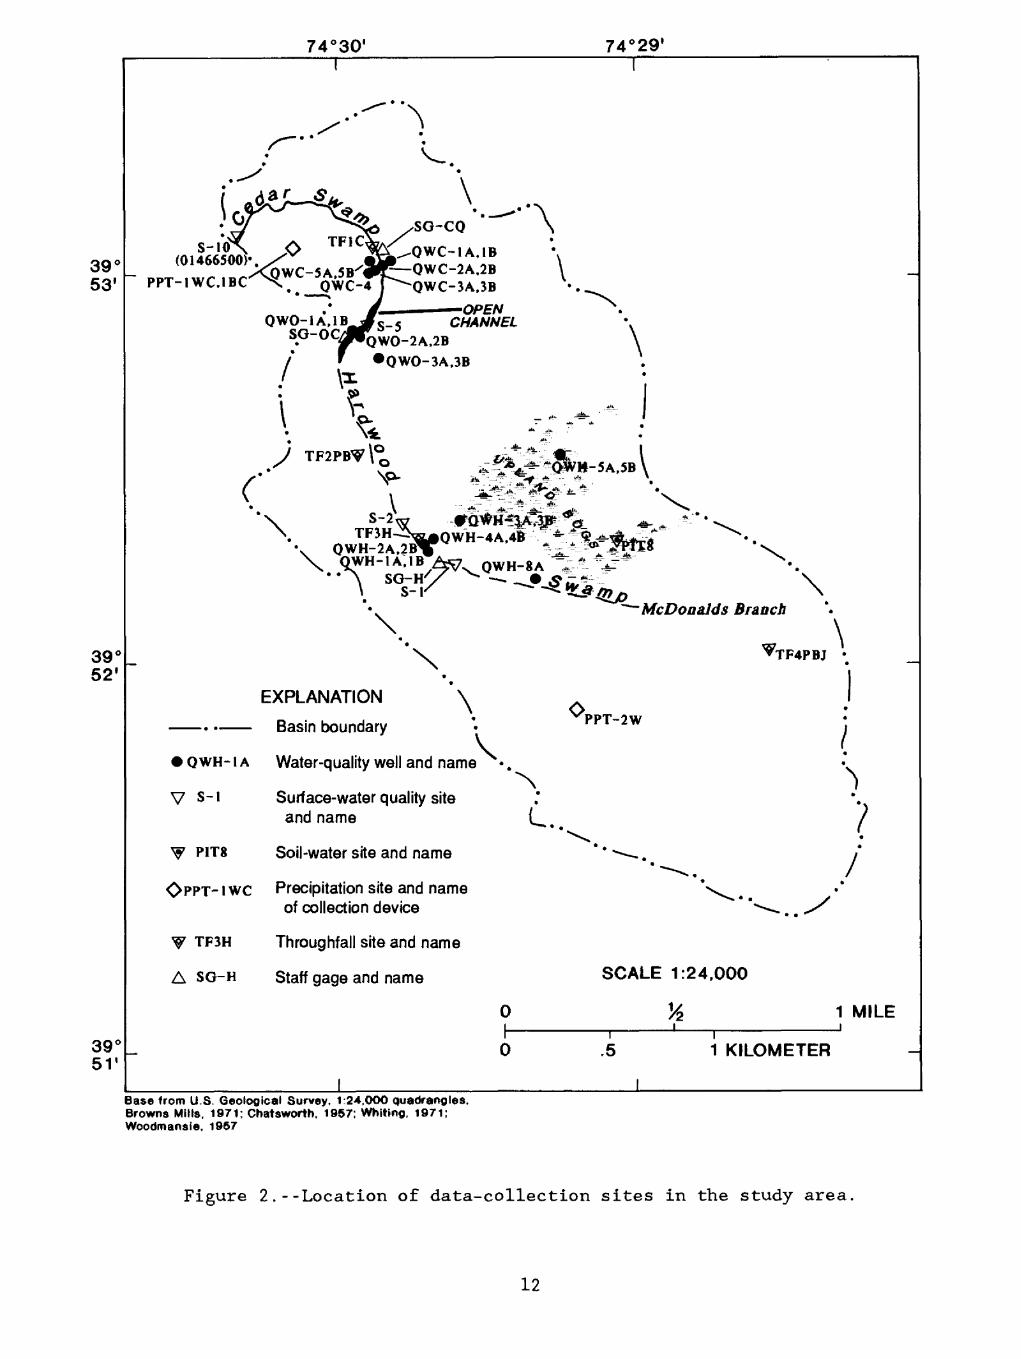
During 1984-85, a network of water-quality (wet and bulk precipitation, throughfall, surface water, soil water, and ground water) and hydrologic (precipitation volumes, stream stage and discharge, and water-table altitude) data-collection sites was established by the U.S. Geological Survey in McDonalds Branch basin. The sites were sampled as part of an intensive 1985-86 hydrogeochemical study in the basin. The site locations, the hydrologic-measurement techniques, the water-quality sampling and analytical protocols, and the resulting data are presented in a report by Lord and others (1990). In preparation for this study, water-quality sampling at the hydrologic benchmark station (01466500, coincident with site S-10, this study) at McDonalds Branch was increased from its normally sporadic schedule to approximately once per month beginning in April 1984. Sampling protocol for the benchmark station is presented in Bauersfeld and others (1987).
Monthly collection of surface-water samples at the Hydrologic Benchmark station was continued in 1986, but the other sampling had to be curtailed by the spring of 1986. In December 1986, sampling of wet and bulk precipita tion (PPT-1WC, PPT-1BC), upstream surface water (S-l), and ground water (QWC-lA, QWH1A, QWH-4A, QWO-3A) was resumed at a limited number of sites (see figure 2, table 1, and Appendix I). In general, the field and analytical procedures used were identical to those described by Lord and others (1990). However, in order to comply with U.S. Environmental Protection Agency (USEPA) protocols (Illinois State Water Survey, 1986) and to prevent possible sample contamination, the precipitation collection equipment was not leached with hydrochloric acid (HC1) before each use as Lord and others (1990) had done. Instead, sample collection equipment was cleaned with phosphate-free detergent, rinsed repeatedly with deionized water, and then leached overnight with deionized water. The specific conductance of the deionized water leachate was measured as a check on possible contamination.
11
39° 53'
39° 52'
39' 51'
74°30'
I
74°29'
S-10 , (01466500)'.
PPT-1WC.1BC
QWH-1A.1B A^7.' \ SO-H//
\ S-l/ \
\
EXPLANATION
Basin boundary
Me Donalds Branch
\
\
Q WH- 1 A Water-quality well and name
V S-i
*PPT-2W
PITS
Surface-water quality site and name
Soil-water site and name
OPPT-IWC Precipitation site and name of collection device
V TF3H
A SO-H
Throughfall site and name
Staff gage and name SCALE 1:24,000
fe 1 MILE
.5 1 KILOMETER
IBase from U.S. Geological Survey. 1 24.0OO quadrangles. Browns Mills. 1971; Chatsworth. 1957: Whiting. 1971; Woodmansie. 1957
Figure 2.--Location of data-collection sites in the study area.
12

Table 1.--Summary of collection and analysis of water-quality samples from HcDonalds Branch basin.November Z4. 1986 through June 26T
[NJDEPE lab, New Jersey Department of Environmental Protection and Energy Laboratory; sc, specific conductance; NUQL, U.S. Geological Survay National Water Quality Laboratory; major cations are calcium, magnasjum, sodium, potassium; an ions are sulfate, chloride, fluonde, bromide: nutrients are ammonium, nitrate, and phosphate; T, temperature; DO, dissolved oxygen; DOC, dissolved organic carbon]
Water-sample Number of type sites
Wet precipitation
Bulk precipitation
Surface water
Ground water
1
1
2
4 wells8
Frequency of sampling
Collected weekly, Composited monthly 12/02/86-12/04/87
Collected weekly. Composited monthly 12/02/86-11/24/87
Monthly 11/25/86-06/28/88
Every other month
Analyses performed
NJDEPE lab--pH, sc, NUQL--pH ( sc, major cations and nutrients
NJDEPE lab--pH, sc NUQL--pH, sc, major cations alkalinity, nutrients
and anions, alkalinity,
and anions,
Field characteristics--!, pH, sc, DO NUQL--pH, sc. major cations and anions, alkalinity, nutrients, aluminum, iron, manganese, silica, DOC
Field characteristics--!, pH , sc, DO11/25/86-06/01/88 NWQL--pH, sc, major cations and anions,
alkalinity, nutrients, aluminum, iron, manganese, silica, DOC
The four well sites are QWC-1A, QWH-1A, QWH-4A, and QWO-3A.
13

Field Fractionation of Aluminum
Field fractionations of aluminum were done on samples of surface water (from sites S-l, S-5, and S-10), soil water (from 0, A, and B horizons sampled from a cluster of gravity lysimeters at Pit 8 in the Atsion soil series), and ground water (from sites QWH-8A, QWO-2A, QWO-3A, and QWO-2B) immediately following collection at McDonalds Branch basin on October 13-14, 1987. (Locations of sampling sites are shown in fig. 2.) The fractionation protocol used was based on the Albios field sampling protocol developed by Cronan and Schofield (1985), and was a modification of the procedure developed by Driscoll (1984).
The method developed by Driscoll (1984) partitions the total reactive aluminum in a water sample into three fractions. These fractions are: (1) labile monomeric aluminum, which includes aquo aluminum and inorganic complexes of aluminum with hydroxyl ion (OH-), fluoride, and sulfate; (2) non-labile monomeric aluminum, which includes monomeric alumino-organic complexes; and (3) acid-soluble aluminum, which includes colloidal polymeric aluminum or very strong alumino-organic complexes. Cronan and Schofield (1985) modified the Driscoll method by the addition of another fraction, total organic aluminum.
In this report, the fractions are referred to by the following acronyms, as shown in the table below: (1) TAL refers to total reactive aluminum; (2) TOAL refers to total organic aluminum; (3) MAL refers to total monomeric aluminum, which includes labile and non-labile monomeric forms (fractions 1 and 2, above; (4) MOAL refers to organic monomeric aluminum (fraction 2, above); (5) MIAL refers to inorganic monomeric aluminum (MAL-MOAL) (fraction 1, above); (6) TIAL refers to total inorganic aluminum, calculated from TAL- TOAL; and (7) acid-soluble aluminum (Driscoll's fraction 3, above) can be calculated from TAL-MAL.
-TAL, total reactive aluminum-
-MAL, total monomeric aluminum----|-------------TAL - MAL-------------acid-soluble aluminum
(colloidal polymeric and very strong alumino-organic complexes)
- - --MIAL,-----|-------MOAL,-------|inorganic non-labile, organic monomeric monomeric aluminum aluminum
|----....TIAL,--------|-----------------------TOAL,-----------------------|total inorganic total organic aluminum
aluminum
All samples were filtered through 0.45-/im (micrometer) Gelman2 filters, prior to any additional treatment. Separate samples from one surface-water site (S-10) and two ground-water sites (QWH-lA and QWO-3A) also were filtered through 0.2-/zm filters.
2 The use of trade names is for identification purposes only, and does not constitute endorsement by the U.S. Geological Survey.
14

Total reactive aluminum (TAL) was defined by acidification of sample solutions using addition of phenanthroline and hydroxylamine-hydrochloride in the method of Barnes (1975).
Monomeric forms of aluminum (total monomeric (MAL)), and organic monomeric (MOAL)) were isolated by addition of a complexing agent (8- hydroxyquinoline), followed by rapid extraction in an organic solvent (methyl isobutyl ketone, MIBK). Sample pH was buffered at approximately 8 by addition of ammonium acetate (NH,Ac). Organic monomeric forms (MOAL) were separated from inorganic forms (MIAL) by passing an aliquot of sample through a cation exchange column with a pH similar to the original sample pH. In this study, the cation exchange resin Rexyn 101 was used, as called for in the protocol by Cronan and Schofield (1985). Columns of pH 4.0 and 4.5 were set up, and the pH of samples passing through the columns was monitored. Concentrations of labile (inorganic) monomeric aluminum (MIAL) were estimated as the difference between total monomeric aluminum (MAL) and nonlabile monomeric aluminum (MAL-MOAL).
Total organic aluminum (TOAL) was separated by passing sample solution through a cation exchange column containing Rexyn 101 resin and then adding phenanthroline and hydroxylamine-hydrochloride.
For samples collected from water that normally had large concentrations of aluminum, separate subsamples were prepared for monomeric fractions by first diluting the samples to one half their original concentrations by using deionized water.
All samples were sent to the Syracuse University Laboratory of Dr. Charles Driscoll for aluminum analysis by graphite-furnace atomic-absorption (AA) spectrometry. A Langmuir regression program was used to calculate sample concentrations based on standard concentrations.
Quality Assurance of Analytical Data
Quality assurance of inorganic and DOC analyses was performed in accordance with the protocol described by Lord and others (1990).
For the October 1987 aluminum fractionations, quality assurance included the preparation of duplicate samples for analysis whereby separate samples collected at some of the sites were carried through the entire fractionation procedure, and a single sample was fractionated into subsamples for replicate analysis. Additionally, sample blanks (deionized water) as well the following sample standards underwent the various procedures: 0.1 ppm (parts per million) aluminum +0.1 ppm iron, 1.0 ppm aluminum, 1.0 ppm aluminum + 1.0 ppm iron, 3.0 ppm aluminum and 3.0 ppm aluminum + 3.0 ppm iron. The aluminum AA analyses were performed with three injections per sample.
For samples collected at the hydrologic benchmark station in the cedar swamp at McDonalds Branch, cation-anion balances were calculated and samples for which balance errors exceeded 15 percent were deleted from the data set. Approximately 16 percent of benchmark samples collected from April 1984 through June 1988 failed to pass this cation-anion balance test; the imbalances were caused by an excess of anions over cations and were deleted
15

from the data set. The excess of anions probably resulted from an overestimation of the concentrations of sulfate in samples with large concentrations of DOC. Benchmark samples were analyzed for sulfate by a turbidimetric method that could produce incorrect results for colored waters. Other samples collected in the basin were analyzed for sulfate by ion chromatography (1C) and did not appear to have a similar problem.
HYDROLOGIC SETTING
In the subsequent sections, the components of the water budget are described, followed by estimated water budgets for 2 study years. Ground- water/surface-water relations in the basin also are described.
Components of the Water Budget
As Likens and others (1977) demonstrated in their classic study at the Hubbard Brook Experimental Forest, the calculation of yearly water budgets is an important part of any watershed study. Water budgets provide valuable information on the movement of water into and out of the basin and, hence, on the cycling of dissolved chemical constituents.
Yearly water budgets for McDonalds Branch basin may be represented in detail by the following equation:
P = SW + ET +/- GW +/- dST +/' dST , +/' dST ,gw ' sw s
where P is the precipitation input to the basin, SW is the surface-water discharge, ET is the evapotranspiration, GW is the volume of ground-water discharge,
dST is the change in ground-water storage in the basin (+ is an increase in storage, - is a decrease),
dST is the change in surface-water storage in the basin, and dST is the change in soil-water storage in the basin.
The various components of the water budget then are described, followed by estimated simplified water budgets for each of 2 study years--February 1, 1985, through January 31, 1986, and February 1, 1987, through January 31, 1988, because the study years were chosen on the basis of the availability of precipitation data for the basin, conditions during these years may not be representative of long-term hydrologic conditions.
Precipitation
In 1985-86, precipitation volumes were recorded with two Belfort event- recording raingages connected to wet/dry collectors (PPT-1WC and PPT-2W) located at approximately opposite ends of the basin, as shown in figure 2. From February 1, 1985, through January 31, 1986, precipitation totaled 37.9 in. (inches) at site PPT-1WC. Data were not collected at site PPT-2W for 17 days in December 1985 because the collector was dismantled for safety reasons before the hunting season. The annual precipitation for the two sites, therefore, could not be compared directly; however, for the remainder of the year, precipitation at site PPT-2W was 1.6 in. less than
16
precipitation at site PPT-1WC. From February 1, 1987, through January 31, 1988, precipitation volumes were recorded at only one site, PPT-1WC. Precipitation totaled 45.0 in. over this time period.
The closest sites for comparison of precipitation volumes with a long- term record are the National Oceanic and Atmospheric Administration (NOAA) sites at Pemberton (39°58' N, 74°38' W) and at Indian Mills (39°48' N, 74°47' W). Over the course of the 2 study years, monthly precipitation volumes at McDonalds Branch compared most closely with monthly precipitation volumes at Indian Mills--within 0.1 in. During 1951-80, the mean yearly precipitation at Indian Mills was 45.01 in. (National Oceanic and Atmospheric Administration, 1982). From February 1, 1985, through January 31, 1986, precipitation at McDonalds Branch totaled 7.1 in. less than this mean value, and from February 1, 1987, through January 31, 1988, precipitation was equal to the mean.
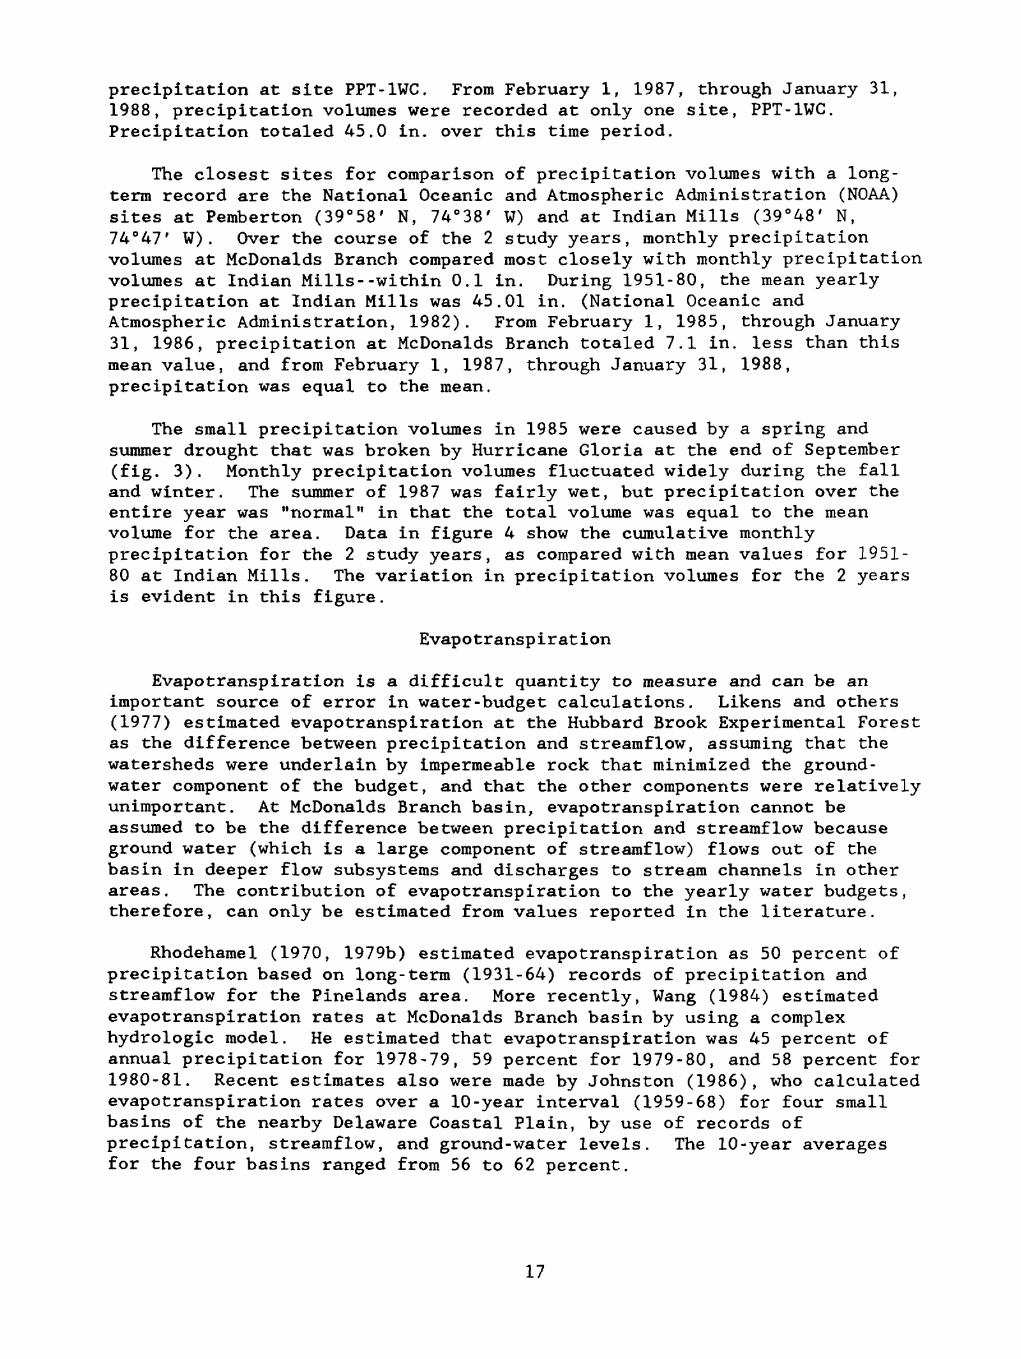
The small precipitation volumes in 1985 were caused by a spring and summer drought that was broken by Hurricane Gloria at the end of September (fig. 3). Monthly precipitation volumes fluctuated widely during the fall and winter. The summer of 1987 was fairly wet, but precipitation over the entire year was "normal" in that the total volume was equal to the mean volume for the area. Data in figure 4 show the cumulative monthly precipitation for the 2 study years, as compared with mean values for 1951- 80 at Indian Mills. The variation in precipitation volumes for the 2 years is evident in this figure.
Evapotranspiration
Evapotranspiration is a difficult quantity to measure and can be an important source of error in water-budget calculations. Likens and others (1977) estimated evapotranspiration at the Hubbard Brook Experimental Forest as the difference between precipitation and streamflow, assuming that the watersheds were underlain by impermeable rock that minimized the ground- water component of the budget, and that the other components were relatively unimportant. At McDonalds Branch basin, evapotranspiration cannot be assumed to be the difference between precipitation and streamflow because ground water (which is a large component of streamflow) flows out of the basin in deeper flow subsystems and discharges to stream channels in other areas. The contribution of evapotranspiration to the yearly water budgets, therefore, can only be estimated from values reported in the literature.
Rhodehamel (1970, 1979b) estimated evapotranspiration as 50 percent of precipitation based on long-term (1931-64) records of precipitation and streamflow for the Pinelands area. More recently, Wang (1984) estimated evapotranspiration rates at McDonalds Branch basin by using a complex hydrologic model. He estimated that evapotranspiration was 45 percent of annual precipitation for 1978-79, 59 percent for 1979-80, and 58 percent for 1980-81. Recent estimates also were made by Johnston (1986), who calculated evapotranspiration rates over a 10-year interval (1959-68) for four small basins of the nearby Delaware Coastal Plain, by use of records of precipitation, streamflow, and ground-water levels. The 10-year averages for the four basins ranged from 56 to 62 percent.
17

COHII o
O
Io. oHI DC Q.
1 I I I I I I I I I I I T
a
FMAMJJASONDJF
I i i
Tiiriiiiiiiiii
i i i i i i i iDJFMAMJJASONDJ
MONTH
Figure 3.--Variations in the volumes of precipitation to McDonalds Branch basin (a) February 1985 through February 1986 and (b) December 1986 through January 1988.
18

H
(DC
UM
ULA
TIV
E P
RE
CIP
ITA
TIO
N,
IN I
NC
HE
S
S
C I
hrj
C"5
K-
P>
(D
CM
3
a- g
W
P)
£
Mhi
P)
P)^
(-!
rt
VO
I
' (D
O
O
VO
oo o
o g
Ui
o
a. OO
P
13
i C
T hi
x
j (D
(D
t-H
O
P)
P)
h
" hi
3
T3
3
PI0>
hi
P) ^
3
rt
P>
rt
K-
o
3
g c^
PJ
£
rtM
P)
P>
3
Srt
O
. O
P.
O 3(D
(D
"!
£
&(D
P
) W
O
hiW
p- I
' P)
rt
vo 3
PJ
oo o
W
O
rt
a*
3
D'
P>(-!
P)
O
rt
C
a.
_L
_L
N>
N>
CO
CO
O
Ol
O
Ol
O
Ol
4^.
4^.
01
O
01
O
5 > CO o
i r
i i
i i
r
I I
I I
I I
I I

Some of the variability in estimated evapotranspiration rates may result from differences in the methods used in calculating the estimates as well as differences in the hydrologic, geologic, topographic, and vegetational characteristics of individual study areas. Additionally, evapotranspiration rates may vary from year to year as the result of differences in such factors as rainfall volume and mean daily temperature. In the budgets calculated subsequently, the Rhodehamel (1970, 1979b) value of 50 percent is used as a first approximation, because this value was based on the most intensive hydrologic study conducted in the Pinelands to date (1990). However, the inherent uncertainty of this component of the water budgets needs to be kept in mind.
Streamflow
Streamflow represents base flow (the portion of ground-water recharge that discharges within the basin) and direct runoff. The average yearly surface-water discharge at McDonalds Branch is 13.06 in. per year, based on 34 years of record (Bauersfeld and others, 1987). From February 1, 1985, through January 31, 1986, the surface-water discharge at McDonalds Branch equaled only 6.52 inches, half of the mean annual value. From February 1, 1987, through January 31, 1988, the surface-water discharge at McDonalds Branch equaled 12.95 in. The variations in surface-water discharge reflect the variations in precipitation to the basin--1985 was a drought year, whereas precipitation approximated the long-term average in 1987.
Ground-Water Discharge
According to Rhodehamel (1979b), McDonalds Branch basin is located in a ground-water recharge area. Because the basin is located in an upland area near the major topographic divide, it is expected that some ground-water that is recharged within the basin flows within deeper flow subsystems and discharges out of the basin. The volume of water leaving the basin in the regional flow system was estimated to be approximately 3 to 5 in. of water (Mary Martin, U.S. Geological Survey, written commun., 1988; and Martin, 1990).
Change in Surface-Water Storage
The change in surface-water storage is difficult to evaluate. During most of the summer of 1985, the open-channel part of the stream, upstream from the gaging station, was dry (fig. 2). However, there was water at the hardwood swamp area, upstream from the open channel, during most of the summer. As the fall progressed, the open channel area became filled with water, and by February of 1986, the surface-water levels in the open-channel area appeared to have returned to normal (February 1985 staff-gage measurement = 126.31 in.; February 1986 staff-gage measurement = 126.33 in.; data in Lord and others, 1990). There are several other parts of the basin that contain standing water in the form of small bogs or fens. The water levels in these areas were not monitored. Any change in surface-water storage probably was small compared with other parts of the hydrologic budget but cannot be quantified.
20
Change in Soil-Water Storage
The change in soil-water storage could not be estimated based on the available data. However, this component of the hydrologic budget probably is small because excessively well-drained soils predominate in the basin.
Change in Ground-Water Storage
Variations in ground-water storage (dS ) for a homogeneous area may be computed with the following equation (see, for example, Sokolov and Chapman, 1974):
dS - v x dh, gw
where v is the specific yield of the geologic materials and dh is the average variation of ground-water level for the area. Sokolov and Chapman (1974) give mean values of specific yield of various rock and sediment types. For McDonalds Branch, values for v of 0.2 to 0.25 are a good approximation, representing the range of values for medium sands.
Because changes in storage for surface water and soil water are assumed to be small, it is therefore assumed that change in ground-water storage is the significant balancing term in the water budget equation. From January 30, 1985, through January 23, 1986, water-level data from shallow wells indicate that the mean decrease in water level in these wells was approximately 0.9 ft. The water-level data were collected from wells located near the stream, however, and do not necessarily reflect basin-wide changes in ground-water level. It is expected that seasonal changes in water level in upland areas near the topographic divide would be larger than water-level changes in areas near the stream, particularly at the lowest end of the basin. Mean change in basin-wide ground-water levels during a drought could be as large as 2 ft or greater resulting in changes in ground- water storage at least as large as 6 in.
Estimated Water Budgets
Data in the table below are a summary of the most important components of the water budget for 2 years--February 1, 1985, through January 31, 1986, and February 1, 1987, through January 31, 1988.
Components of water budnet 1Period P
2/1/85 - 1/31/86 37.9 in. -
SW ET
6.5 in. + 19 in. +
GW dST
4 in. +
+/- errors gw
8.4 in.
2/1/87 - 1/31/88 45.0 in.
(+/- errors) (+/- errors)
13.0 in. + 23 in. + 4 in. + 5 in.(+/- errors) (+/- errors)
1 P = SW + ET + GW + residual, where Residual = dST +/- dST +/-CW SW S+/- errors in estimates. The estimated value of ET aiso contains errors.
Both dST and dST are considered negligible in this study. An average value is used for the GW term.
21
The values in this table for evapotranspiration and ground-water storage have a large degree of uncertainty. Uncertainty in the measurements of precipitation and surface-water discharge is less. The estimate of change in ground-water storage in the basin includes error from uncertainty in other values, particularly evapotranspiration.
Ground-Water/Surface-Water Relations
Investigations of ground-water/surface-water relations were conducted in each of the three distinctive parts of the stream channel--the upstream hardwood swamp, the open channel, and the downstream cedar swamp (fig. 2). In each of these areas, a staff gage and a set of wells including a shallow (A) well and a deep (B) well were installed in the stream channel as part of the 1983-86 Geological Survey study in the basin (Lord and others, 1990). The shallow wells at each site extended to a depth of from 5.5 to 7.9 ft below the streambed, and the deep wells extended to a depth of from 23 to 30 ft below the streambed (see well construction details in Lord and others, 1990). Water-level measurements collected from 1985 to 1988 at the shallow and the deep wells were compared with each other and with stream-stage measurements as a means of identifying general recharge and discharge areas 3 . Additionally, streambed piezometer studies were conducted at a number of sites in the spring and fall 1987. Results of these studies indicated that the three parts of the stream channel were characterized by differing ground-water/surface-water relations.
Wells QWH-1A and QWH-lB and staff gage SG-H were located in the hardwood swamp in the upstream part of the basin (fig. 2). For the two sampling periods from January 30, 1985, through May 21, 1986, and November 25, 1986, through March 29, 1988, water-level measurements indicated that the head at the shallow (A) well consistently was from 1 to 6 in. higher than the head at the deep (B) well. Staff-gage measurements could not be made in July, August, and November 1986 because the stream was nearly dry near the staff gage in the hardwood swamp on these dates. Measurements that were made during other months indicated that stream stage generally was from 0.11 to 0.34 ft above the head in the A well. The only exception to this relation was in November 1986, when the stage was 0.24 ft below the head of the A well. On the basis of these relations, water from the upstream part of the channel appeared to be draining to the shallow ground-water system; however, flow in a vertical direction is retarded by relatively impermeable materials beneath the swamp.
In October 1987, a bed-piezometer survey was done in the hardwood swamp. Relative stream and shallow ground-water heads were measured at six locations upstream from wells QWH-lA and QWH-lB to a distance of 1,735 ft upstream and at a seventh location near the wells. The survey determined that ground-water heads were equal to or lower than the heads in the stream.
3 Water-level measurements from October 24, 1984, to May 21, 1986, are available in Lord and others, (1990); water-level measurements from November 26, 1986, to June 1, 1988, are included in Appendix E of this report.
22

Although the stream in the hardwood swamp appears to drain to the shallow ground water, movement of water may be impeded as a result of the impermeable nature of the muck material that underlies the stream. Clay lenses also may impede or redirect water movement. The water present in the hardwood swamp probably comes from a number of sources, including direct precipitation on the stream channel, overland flow from elevated areas surrounding the hardwood swamp, streamflow from intermittent tributaries draining upland areas, and subsurface stormflow. In the fall of 1987, a field trip to the hardwood swamp was taken following a major storm. Water was observed in several tributaries leading into the swamp, and water could be seen pouring out of the streambank above the level of the stream. Such shallow stormflow may be prevented from entering the ground-water system by shallow clay layers that have been detected in well logs from the hardwood section of the basin.
Wells QWO-1A and QWO-1B and staff gage SG-OC were located in the open- channel area downstream from the hardwood swamp (fig. 2). For the two sampling periods from February 4, 1985, to May 21, 1986, and November 25,1986. to March 30, 1988, monthly water-level measurements indicated that the head at the shallow (A) well generally was slightly higher than the head at the deep (B) well, although in April and May 1985, the head at the B well generally was higher. The head in the A well briefly rose above that of the B well following more than 1 in. of precipitation in early May.
During the first period of sampling, stage measurements could not be made from May 9, 1985, to January 23, 1986, because the stream channel either was dry or had little water. This drying up of the open channel was a result of drought conditions during the spring and summer of 1985. For the months when measurements could be made, the stream stage varied from 0.29 to 1.06 ft above the head in the A well. During the second period of sampling, staff-gage measurements were made on a monthly basis from July 30,1987. to March 29, 1988, and stream stage varied from 0.16 ft to 0.83 ft above the head in the A well.
The stream in the open channel area generally appeared to be draining to the shallow ground-water system, although water-table maps suggested that the stream might be receiving ground-water discharge during at least some months of the year. Water-level measurements from additional wells in the area indicate that shallow ground-water flow is approximately perpendicular to the channel in this part of the basin, from east to west. In order to provide further insight into the ground-water/surface-water relations at the open channel, a bed-piezometer survey was undertaken in October 1987. Two sections were taken, one located about 1,200 ft upstream from wells QWO-1A and QWO-1B and the second at the site of the two wells (fig. 2). The more upstream section indicated that ground water was discharging to the stream on the east bank (+0.02 difference in head); there was a zero difference in head on the west bank. The second section indicated potential loss across the channel with a difference in head of approximately -0.5 ft from east to west. In the open-channel area, the vertical component of ground-water flow appears to vary through space and time. These variations can be extreme enough to change the area from a pond to a dry bed over the course of a few months.
23
Wells QWC-1A and QWC-1B and staff gage SG-CQ are located in the cedar swamp, downstream from the open channel and upstream from the gaging station. For the two sampling periods from February 7, 1985, to March 21, 1986, and November 26, 1986, to June 1, 1988, the difference in head at the two wells was slight, and the relation between the heads varied. During the first period of sampling, stage measurements could be made only twice-- February 26, 1986, and March 21, 1986,--because of dry conditions. Stream stage on these dates was 0.05 ft and 0.23 ft below the head in the A well, respectively. During the second period of sampling, stream stage began at 2.24 ft above the head in the A well on November 26, 1986, and decreased to 0.21 ft below the head in the A well on March 30, 1988, and 0.04 ft below the head in the A well on June 1, 1988. This change in relation between the stream stage and the ground-water head reflected decreasing precipitation that coincided with the start of a drought in 1988. Overall, the stream at the cedar swamp, upstream from the gaging station, appears to receive ground-water discharge during periods of drought when flow in the stream is low, and to drain to the ground-water system during periods of greater rainfall and higher flow. Ground-water discharge to the stream probably originates as precipitation in upland parts of the basin, although sources such as deeper ground water or lateral flow from adjacent basins cannot be discounted at this time.
WATER QUALITY
Results of investigations of precipitation, throughfall, surface-water, and ground-water quality are described in subsequent sections.
Precipitation Chemistry
The volume-weighted mean concentrations of cations and anions in wet and bulk precipitation in McDonalds Branch basin are shown in table 2. Hydrogen ion was the predominant carrier of cationic charge in both wet and bulk precipitation; the volume-weighted mean pH was 4.30 for wet precipitation and 4.34 for bulk precipitation4 . Sodium and ammonium also carried substantial cationic charge in precipitation; calcium, magnesium, and potassium were of lesser importance in this regard. The predominant anion in wet and bulk precipitation was sulfate. Chloride and nitrate also were substantial carriers of anionic charge in precipitation; fluoride was of less importance. Concentrations of constituents in wet and bulk precipitation were similar, although bulk precipitation was overall slightly more concentrated, as reflected in the volume-weighted means of specific conductances--28.3 ^S/cm (microsiemens per centimeter at 25 degrees Celsius) for bulk precipitation and 27.6 ^S/cm for wet precipitation.
Insight into the sources of ions in precipitation is provided by previous investigations in the Pinelands (Means and others, 1981) and in other areas of the world (Stallard and Edmond, 1981; Galloway and others,
4 Volume-weighted mean pH was calculated by first calculating volume- weighted mean hydrogen-ion concentrations, and then converting to pH.
24

Table 2.--Volume-weighted mean concentrations of constituents in bulk and wetprecipitation atJanuary 24. 1985.through November
[mg/L, milligrams
sites PPT-1BC andthrough March 18 .
24. 1987 1
per liter; meq/L,
Bulk precipitation (mg/L) (meq/L)
Hydrogen ion (H
Calcium (Ca2+ )
2+ Magnesium (Mg )
Sodium (Na )
Potassium (K+)
Ammonium (NH, )
Sum
Sulfate (SO 2 ")
) 10
.21
.08
.56
.09
.33
of cations
2.63
Cations
0.046
.010
.007
.025
.002
.018
- 0.108 meq/L
Anions
.055
PPT-1WC in McDonalds Branch basin1986. and December 2. 1986.
milliequivalents per liter]
Wet precipitation (mg/L) (meq/L)
10
.10
.06
.44
.05
.25
Sum of cations =
2.22
0.051
.005
.005
.019
.001
.014
0.095 meq/L
0.046
Chloride (Cl~)
Fluoride (F~)
Nitrate (NO ~)
.82
.03
.023
.002
.89
.03
.025
.002
1.88 .030 1.59 .026
Sum of anions = 0.110 meq/L Sum of anions = 0.099 meq/L
1 Precipitation volumes measured by the Belfort event-recording raingage at site PPT-1WC were used to estimate the precipitation volumes, as actual sample volumes had not been determined during the first few months of 1985. For analytical values reported as less than the reporting limit, the reporting limit was used.
25

1982). An excellent discussion of the state-of-the-art knowledge of ion sources is provided by Berner and Berner (1987, p. 72), who compiled the following "hierarchy of ions" based on the relative importance of marine and continental sources:
Cl" = Na+ > Mg2+ > K+ > Ca2+ > SC^2 ' > NC> 3 ~ - NH4+ 5 . mostly -------------------------------------->mostlymarine continental
Chloride in rain generally is caused by input from sea-salt aerosols, although some chloride may derive from industrial pollution. Sodium and magnesium also have a mostly marine origin, but some sodium and magnesium may be due to forest fires, and small quantities may derive from soil dust. Potassium and calcium are almost entirely continental in origin. Sulfate and nitrate are mostly continental and are derived largely from the burning of fossil fuels. Ammonium has an almost entirely continental origin and may derive from fertilizers, biological inputs, and burning of coal.
Means and others (1981) sampled bulk precipitation in the Pinelands from 1971-72, and their work serves as a prototype for analysis of precipitation chemistry and as a data base for comparison of current and past precipitation chemistry in the Pinelands. The authors used ion ratios to sodium, an ion considered to be of mostly marine origin, to determine the relative importance of marine and continental sources of precipitation. On the basis of these ratios, Means and others (1981) concluded that chloride was of mostly marine origin, whereas potassium, calcium, and sulfate were of mostly continental origin. These conclusions were substantiated by plots of ion concentrations as compared to distance from the coast. Potassium and calcium were determined to increase in concentration in a landward direction, whereas chloride and sodium decreased in concentration, and magnesium stayed approximately the same. Finally, Means and others (1981) plotted seasonal variations in chemical constituents and compared these variations with seasonal changes in storm patterns. Sodium and chloride were determined to be elevated in the winter, when storms tend to move along the coast. In contrast, potassium, calcium, sulfate, and nitrate were determined to be elevated during the spring and summer, when storms tend to move from west to east across the continent, picking up continental aerosols and particles. Concentrations of magnesium did not indicate seasonality.
In table 3, the volume-weighted mean concentrations of major ions in wet precipitation at McDonalds Branch basin are presented for two approximately 1-year periods, February 14, 1985, to February 19, 1986, and December 2, 1986, to November 24, 1987, and ratios of concentrations of the various ions to sodium concentrations also are presented and compared with the ratios of concentrations in seawater. As shown in table 3, the ratios of magnesium:sodium and chloride:sodium at McDonalds Branch are similar to the ratios in seawater, indicating that magnesium and chloride have a mostly marine source, as was suggested by Means and others (1981). The
__ _ ___ i O i 1 Q i
5 Cl , chloride; Na , sodium; Mg , magnesium; K , potassium; Ca , calcium; SO, , sulfate; NO, , nitrate; NH, , ammonium; >, greater than.
26

Table 3.--Annual volume-weighted mean concentrations of ions in wetprecipitation. February 14. 1985. through February 19. 1986. and December 2. 1986. through November 24. 1987. and ratio of constituent concentrations to sodium concentrations in precipitation and seawater
[mg/L, milligrams per liter]
Volume-weighted mean concentration
(me/L)
Ratio of constituent concentration to sodium concentration
Cme/D
Ion
Calcium
Magnesium
Sodium
Potassium
Sulfate
Chloride
02/14/1985- 02/19/1986
0.071
.065
.46
.045
2.08
.99
12/02/1986- 11/24/1987
0.12
.049
.38
.054
2.21
.76
02/14/1985- 12/02/1986- 02/19/1986 11/24/1987
0.15
.14
1.00
.10
4.52
2.15
0.32
.13
1.00
.14
5.82
2.00
Ratio to sodium in seawater
(mg/L)
0.04
.12
1.00
.04
.25
1.80
27

potassium:sodium and calcium:sodium ratios at McDonalds Branch are larger than those in seawater, indicating a mostly continental source for potassium and calcium. The sulfate:sodium ratio is much larger than the ratio in seawater, as a result of the strong input from anthropogenic (pollutant) sources of sulfur.
The concentrations of chemical constituents in wet precipitation at McDonalds Branch basin are plotted with respect to time in figures 5 and 6. The graphs show patterns that are similar to the patterns reported by Means and others (1981) for bulk-precipitation chemistry, but the graphs also demonstrate that the seasonal patterns are generalizations to which there can be numerous exceptions. For example, concentrations of calcium were larger in the summer than in the winter in 1987, as described by Means and others (1981) for 1971-72, but concentrations of calcium were larger in January than they were through most of the summer in 1985.
For most ions, variations in chemical constituents of bulk precipitation in McDonalds Branch basin paralleled variations in wet precipitation, although potassium was an exception. Concentrations of potassium in bulk precipitation peaked during the warmer months (figs. 7 and 8), as reported by Means and others (1981), but this peak is less pronounced or lacking in wet precipitation (figs. 5 and 6). This difference indicates that dry deposition may be responsible for the summer peak in potassium in bulk precipitation in the Pinelands. A number of researchers (Crozat, 1979; Lawson and Winchester, 1979; Stallard and Edmond, 1981) have postulated that potassium may be released as an aerosol from plants, and Crozat (1979) suggested that the formation of these aerosols may be favored by hot, humid conditions. The summer peaks in concentrations of potassium in bulk precipitation in the Pinelands, therefore, may result from local release from plants.
In figures 5 and 6, two ions, ammonium and fluoride, that were not monitored by Means and others (1981) are plotted. These ions indicated concentration peaks during the warmer months and declines in winter. Ammonium is a terrestrial ion that is released to the atmosphere by bacterial activity, by fertilizers, and by the burning of coal (Berner and Berner, 1987). Ammonium, therefore, would be expected to increase in the warm season due to the tendency for storms to move across the continent in the spring and summer. The warm-season ammonium peak also might result from local use of fertilizers and, thus, may be unrelated to storm track. Morgan and Good (1986) also reported a warm-season peak in ammonium in the Pinelands on the basis of data collected from July 1984 to June 1986. Little information is available about fluoride in precipitation, but data in figures 5 and 6 indicate that there may be a continental source.
Throughfall Chemistry
The USGS sampled throughfall under the following four canopy types in McDonalds Branch basin: cedar-swamp forest, hardwood-swamp forest (red
28

maple/black gum), pitch-pine/black-oak forest, and pitch pine/blackjack oak forest from October 1985 through March 1986. The sampling protocol and the analytical results are presented in Lord and others (1990).
Throughfall volumes were not measured until December 24, 1985, and vandalism precluded the collection of some data. Where volumes of precipitation and throughfall could be compared for the same time periods, the throughfall volumes collected were always less than the precipitation volumes collected. Throughfall volumes ranged from 66 to 89 percent of the precipitation volumes.
Throughfall sampling intervals were intended to correspond with precipitation sampling intervals so that throughfall chemistry could be compared directly with precipitation chemistry. Because of a variety of sampling problems, however, throughfall sampling corresponded with precipitation sampling during only four time intervals (table 4). In table 4, the results of throughfall sampling are compared with the results of bulk precipitation sampling during these four intervals.
Data in table 4 show that throughfall pH in the cedar swamp (median = 3.9) consistently was lower than bulk-precipitation pH (median = 4.5); in contrast, throughfall pH in the hardwood swamp (median =5.7) consistently was higher than bulk-precipitation pH. In the pitch-pine/black-oak forest, throughfall pH (median - 4.5) generally was similar to bulk precipitation pH, and in the pitch-pine/blackjack-oak forest, throughfall pH (median = 4.9) generally was similar to or somewhat higher than bulk-precipitation pH.
Despite the fact that these results were based on only fall and winter samples, they are similar to the results of a study of bulk precipitation and throughfall chemistry conducted by Turner (1983) from November 1979 through January 1982 at McDonalds Branch basin. Turner (1983) reported that the volume-weighted mean pH of throughfall in oak-pine forests and in the cedar swamp was lower than in bulk precipitation, whereas the volume- weighted mean pH in the hardwood swamp (black-gum/red-maple forest) was higher. Similar effects of deciduous and coniferous vegetation on throughfall pH were observed in the White Mountains by Cronan (1978), who reported that less neutralization of precipitation acidity took place in a coniferous zone than in a hardwood zone. Cronan (1978) suggested that possible mechanisms for the slight acidification of throughfall in a New England balsam-fir ecosystem included organic-acid leaching, dissolution of acid sulfate particles, or foliar exchange of hydrogen ions for cations or all three. The same mechanisms could be affecting throughfall acidity in coniferous stands at McDonalds Branch basin.
At all four throughfall sites at McDonalds Branch basin, throughfall was enriched in base cations (calcium, magnesium, sodium, and potassium) over bulk precipitation. Wang (1984, p. A. 17) suggests that enrichment of base cations in throughfall is due, in part, to impaction by aerosols on the canopy. Precipitation would then wash off dry-deposited substances. Furthermore, sublimation or evaporation from snow or dew on leaf surfaces may concentrate ions which are carried by throughfall that drips from the canopy. As shown in table 4, concentrations of base cations in throughfall
29

N UNITS cofc
pH
mmmmmmmmmmmmmmOT
IUS 01 oo 2ZW^OT
§IE8 -QUJ2OT 30
§8zSS5B| "I72QCQgsSg 10Q- l- .w
-J
z_________________ _____ ___ O JFMAMJJA SON D J F M ~
WJ^^^^^iS^^^M^iM
EXPLANATION
T NO PRECIPITATION V NO DATA
UJ
o
o o
00
QCO 0.4
_l_i 0.3
202
0-1
nirniiii 1 1MAGNESIUM
^^ VSODIUM
JFMAMJJASONDJ FM
Figure 5.--Variations in the concentrations of dissolved constituents in wet precipitation at McDonalds Branch basin, January 1985 through March 1986.
30

ccHI1- 0.1
OCHJQ.
co 0.0f\ A< ° 8
oc2 06
2 0.4
~ 02
Z
2 no
< 5ocI-zHJ
0 3Z
0 2 0
1
O
_ I L I I I I I I I IPOTASSIUM
-
:
ir|: : : :f
i; : ; : ; : : : ; : : : ; : : : :FH pn iii
_J : : : : : :] xx-x-| __ -:-:-:-:-:-: : :': : :'x : :-: : : : : : ::x : :-:-x-: : ::>x:x:x:x-x-:
:¥:¥:¥:::¥:¥:¥: : :¥:| ¥:¥:¥:¥:¥:¥:¥:¥:¥:¥:¥:¥:¥:¥:¥:¥:¥:¥:¥:¥:::¥:¥:¥¥fcfSSifcSSJSi:] 1 ::l:¥:¥: :i¥:¥:::l:¥:¥::|::¥:¥j:¥:¥: :l¥:¥:::l:::¥:¥f:¥:¥:li¥:
IT '
"
_
1
f¥iW
FFH 1 1 1 1 1 1 1 1 1
AMMONIUM "
I
_l I I I I I I I I I I I
-
;i|~ ^l
- Si:
sf
ps'ss'i
SULFATE,....,
^«-:«««-l::::*-:-:-:-s
rrr«i:i:i:i:i::¥:¥:¥:¥:¥:¥:¥:¥:
-
J" XvX'io^^Xvo^X'iXvX'j-Xv^^Xvi'i'XvX^vX'fXoxjX-X'i'fcX'XOj'X-X'jX-' . . . . ! . . . . .{ . . . . ». . . . . ] . . . - 3. . . . . ! . . . . .[ .-. . -.-I-. -.-.-. -.1 . . . . !;. . . .-.J-.-.-.-.-I.-.-
6
EHJ1- 4
CC 2
HJQ.
CO ° 2 006
oc oli 004
Z 002
2 ooo
< 4
cc
Z 3HJ
O
o 20
1
o
E
T I
prrrJ
1 1 I I I
J
I I I
CHLORIDE -
:¥:: : :! tiii-iL, |. , . . . ilJ:¥:¥:l¥:¥:::l¥:::-:|.:::::l:::?l¥:¥:::lx¥:¥t¥¥: : :f¥:¥:-l:¥::f:¥:¥l¥:¥: ; :l:¥:l
- T
i *;¥
1 1
n
I
its:;
I I
mmm
III III
FLUORIDE -
;X;Xv v!v : x : : : : : : : : : : : : :x :x : x : : : : : : : : x : : ""
iiiis^lssEggtgsixSsissJs:
~
__
~
-
-
__n ' I:.::¥l
ll
1 1
II iiiiii
I
|;i
i i
_ iiiijiiii;
I I IIINITRATE '
__
n;X
i¥ -
:SS
P|
%m m-rJ vX:X:::X; __ |:::X::;
prri E:: : : : : : : : : : : : : :x : : : : : ::::::|::::::::::>
JFMAMJJASONDJFM
Figure 5.- -Continued.
31
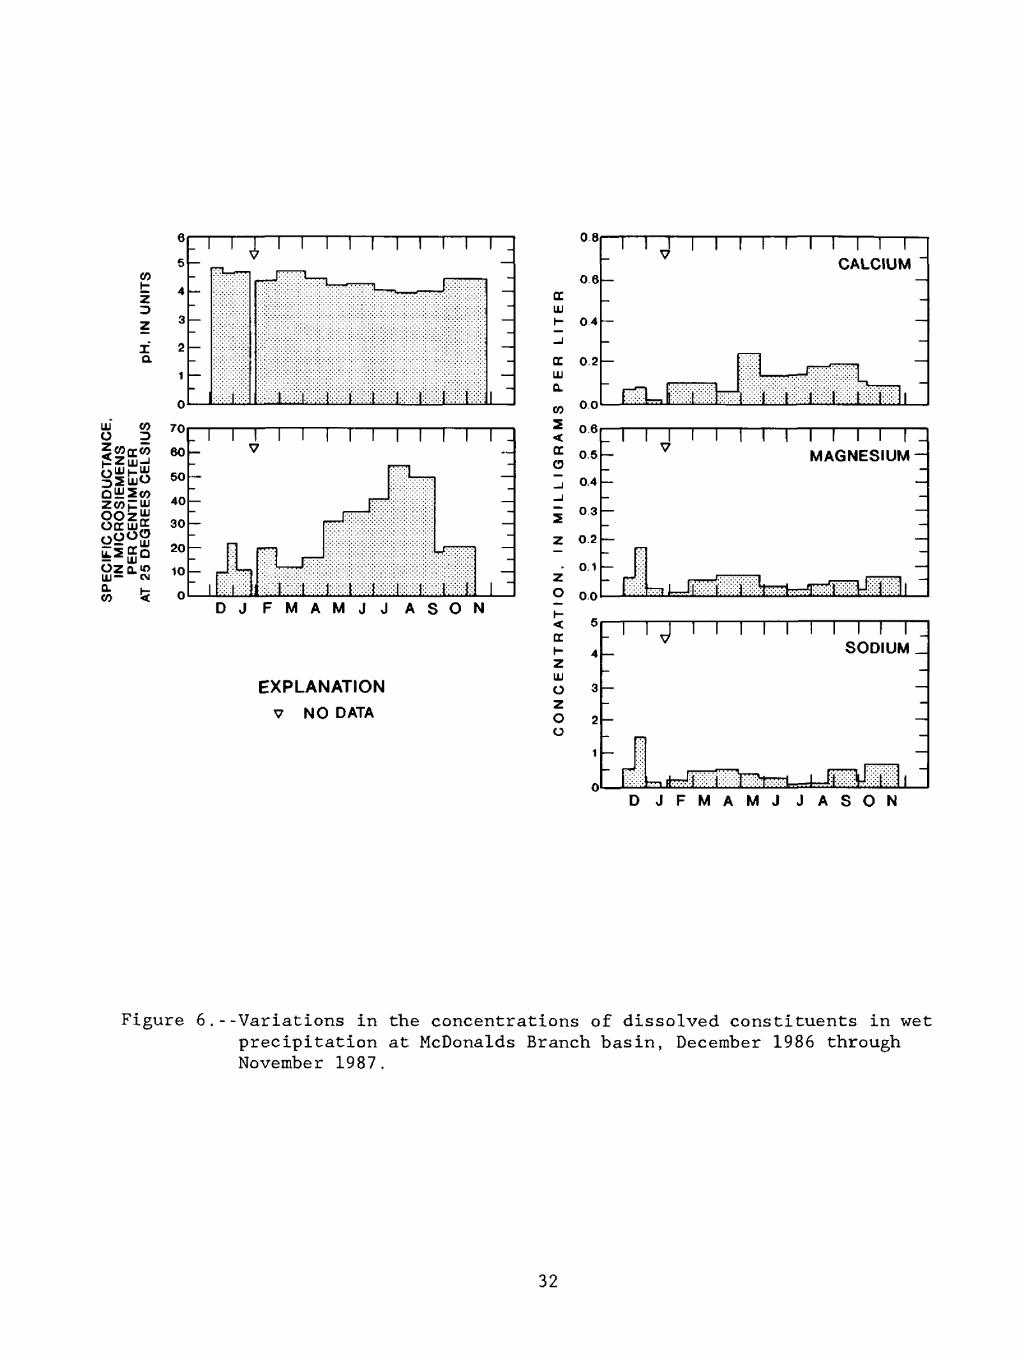
I 2 0.
1 1
UJ CO 700 2ICOCTCO 60
§SJ£S soOSSCO ,-ZCOH UJ 40«§i -ElilS *>
CO 5 0DJ FMAMJJ ASON
EXPLANATION
v NO DATA
d UJ 1-
crUJaCO
O
Z O
Z UJ 0 Z 0 O
08
0.6
04
02
0.0
0.6
0.5
04
0.3
02
0.1
00
5
4
3
2!
1
0
1 1 1 1 1 1 1 1 1 1CALCIUM
Illiliks
_ 1MAGNESIUM-
1 I 1 1 1 1 1 1 1 1 1 1 SODIUM
D JFMAMJ JASON
Figure 6.--Variations in the concentrations of dissolved constituents in wet precipitation at McDonalds Branch basin, December 1986 through November 1987.
32

OC HI
OC HIQ.
wZ <OCo
sz
z o
Z HI Oz o o
0.4
0.3
0.2
0.1
0.0
I I I I II II POTASSIUM
0.0
n r iV
I I I I I I ISULFATE
|@:il;;::::i:K:»^
OC HI
OC HIQ.
W
s<OCo
z oH
ocH Z HI Oz o o
10
8
8
4
2
0
0.06
0.04
0.02
0.00
IFlIII \\ IIIITCHLORIDE
ITJIIIIIIIIIIFLUORIDE
liiliiiiiiigg^
OJFMAMJJASON OJFMAMJ JASON
Figure 6.--Continued.
33

CO
z3
I Q.
S i 80zco^w
§|Es«QlilSOT
§Sig^ss- Srr^ 20
;;!;!;&^^
0.8
06
DC 111 H 04
OC 0.2111 Q.
co oo2 <OC
^TCALCIUM
oe
EXPLANATION
NO PRECIPITATION
0.5 u
3 04
2 03
Z 0.2
0.1Z
00JFMAMJJASONDJFM -
< 5tri- .z
I I I I I MAGNESIUM -
O 3Zo
1 I I ISODIUM _
JFMAMJJASONDJ FM
Figure 7.--Variations in the concentrations of dissolved constituents in bulk precipitation at McDonalds Branch basin, January 1985 through March 1986.
34
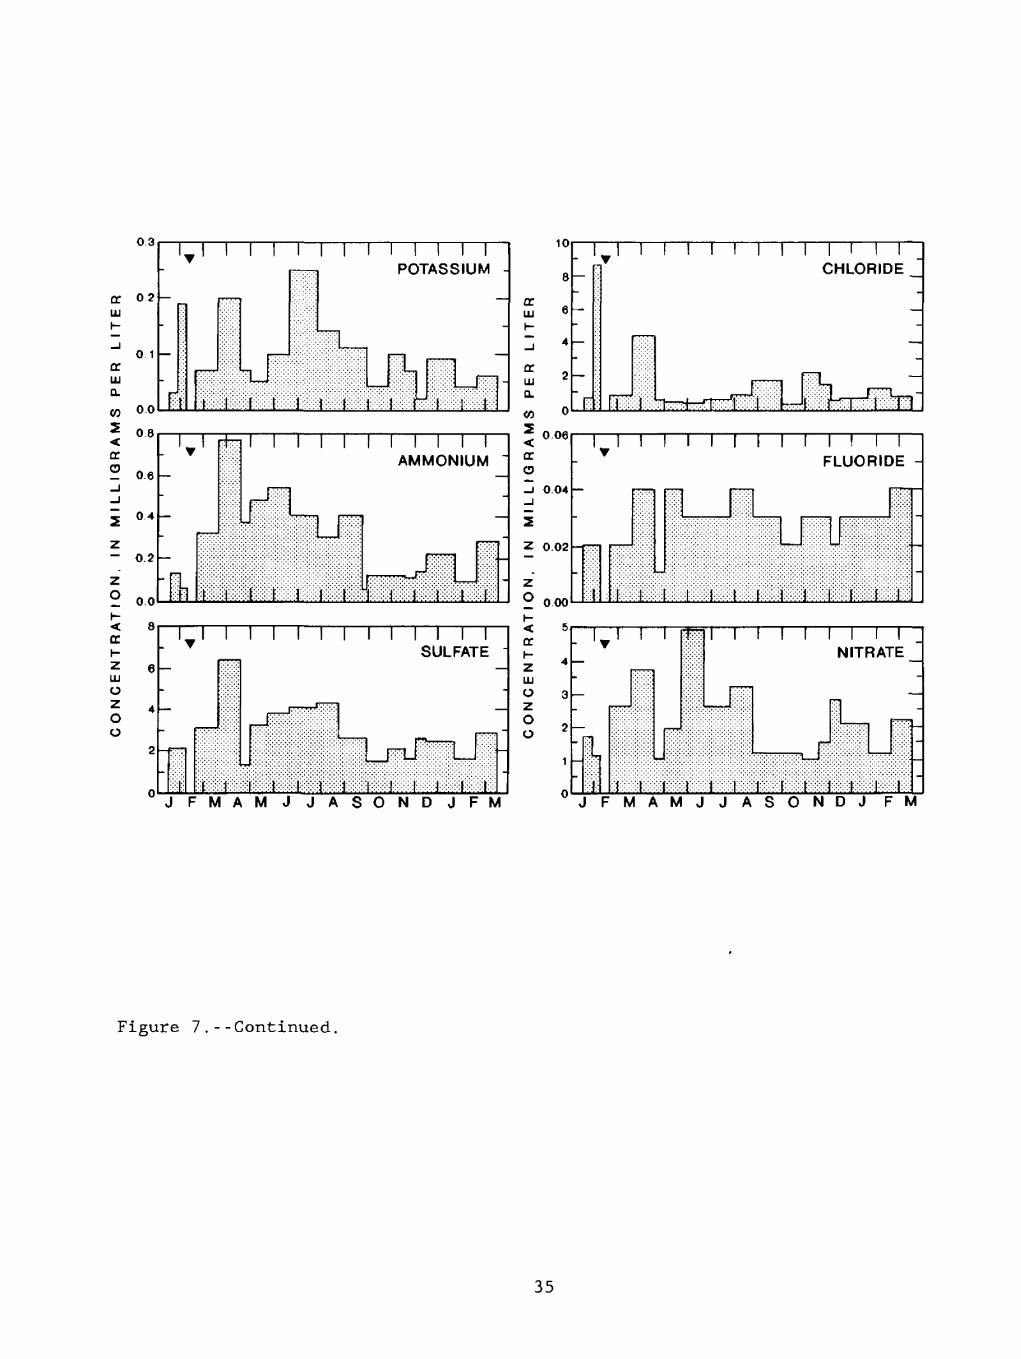
1 I f I I I I I
POTASSIUM -
a: LU
a: LU a.w
< a: o
z o
< cr
LUoz o o
8
aLU **1-
3 *a:LU *
a.to o< 0 06
cro 3 004
iZ 0.02
Z O n nn
-"
.
_
-
-
' :
1
I 1 i
ox"
|::jS:X:jx : :
I 1V
I
: :|xSx|X:X
1 1 1 1 1 III
CHLORIDE"
-"
\ ' '1
^J:;:xx:: HSxl prrriTrrr7frrfTx^^J:;:;:;:;:7^:;:;:Sf^^
1 1 1 1 1 III
FLUORIDE -
li Jl-
\mvm^wwmmwmmmmi.
JFMAMJJASONDJFM JFMAMJJASONDJ FM
Figure 7.--Continued.
35

CO(- z
zia
5
4
3
2
1
n
-
-
1 1 1 1 1 1 1 1 1 1 1
p .ijiaj::::::^ [ioxixl --^ pw.-.-. .-,'. ,]
wmmmm^iiii&mmMiil
^^^^^^m^mmi^0^m
~_ - ~
111 W 70o 260
§8! :°io
85 !c l:i;;8%:i^^DJ FMAMJJ ASON
tr ini-
ir in a.COscc o
_ I I I I I I I I I I I I I- CALCIUM
0.0
06
04
sZ 0.2
Zo
Z 111 Oz o o
0.0
1 I i i i r i i \ \ rMAGNESIUM
1 I I I I I I I I I I \ ISODIUM.
OJFMAMJ JASON
Figure 8.--Variations in the concentrations of dissolved constituents in bulk precipitation at McDonalds Branch basin, December 1986 through November 1987.
36

trLU 0.
CO2<ITo
z z.
z o
Oz o o
04
0.3
02
0.1
00
1 I I I I I I I 1 I I I I
POTASSIUM
mrnmrnmrnm
i i i i i i i i iSULFATE
I I I I I I I I CHLORIDE
I I I I I IFLUORIDE
DJFMAMJJASON DJFMAMJ JASON
Figure 8.--Continued.
37
tended to be larger at the cedar swamp than at the other throughfall sites, perhaps due In part to the larger surface area presented by the dense cedar canopy to intercept aerosols and also for leaching of Ions from needles.
Concentrations of aluminum in throughfall from the hardwood swamp (median -16.5 A*g/L) tended to be smaller than in throughfall from the three sites containing coniferous trees. Of the three coniferous sites, the cedar swamp throughfall yielded the largest concentrations of aluminum (median - 92 A*g/L). Turner (1983, p. 75) also determined larger concentrations of aluminum in coniferous stands (pine and white cedar) than in deciduous stands (oak and black gum/red maple) at McDonalds Branch basin.
At McDonalds Branch basin, sulfate and chloride were enriched in throughfall over precipitation, perhaps due to dry deposition. Concentrations of ammonium In throughfall generally were similar to those in precipitation. Concentrations in throughfall from the three sites containing hardwoods commonly were smaller than concentrations in precipitation; larger concentrations of ammonium were measured In throughfall from the cedar swamp than in precipitation. Concentrations of ammonium from all throughfall sites were substantially higher than precipitation concentrations during the period from December 17, 1985, through January 21, 1986, which included deer-hunting season. Thus, the increased ammonium concentrations may result from Increased human activity in the basin.
Throughfall generally was enriched In nitrogen, mostly as nitrate, over precipitation. The greatest enrichment was determined In cedar-swamp throughfall and the least in hardwood-swamp throughfall. The throughfall data reported by Turner (1983) for McDonalds Branch basin Indicate similar patterns. Because Turner collected throughfall data over a period of several years and sampled during all four seasons, It appears that the general trends observed during the fall and winter of 1985-86 in this study are not peculiar to season or year. Furthermore, Turner sampled throughfall under both pine and oak canopies; pine throughfall generally was enriched in nitrate over oak throughfall.
In a throughfall study at a site In Virginia, Puckett (1990) found that leaching rates from the canopy varied for some Ions from dormant through growing season. Throughfall at McDonalds Branch basin was collected only during the dormant season in this study; thus variations in throughfall chemistry cannot be ascribed to seasonal changes In uptake of ions or to changes in the canopy as the deciduous trees leaf out. Additionally, seasonal changes in leaching rates cannot be determined. Because throughfall volumes were not recorded throughout the entire period of sampling, nor was dry deposition measured, the relative contributions of dry deposition, foliar leaching, and evaporative concentration to throughfall chemistry are difficult to evaluate.
Overall, however, the throughfall data do indicate that vegetation plays an important role In determining the chemistry of water that reaches the soil in McDonalds Branch basin. The concentrations of most major ions are increased in throughfall over precipitation. Where canopies are dense, as in the cedar swamp, some ion concentrations in throughfall, such as aluminum
38

and nitrate, may increase by an order of magnitude over concentrations in precipitation. In coniferous stands, the acidity of rainfall increases as it passes through the canopy, but in hardwood stands, the acidity decreases. Because the throughfall collectors were installed above the level of most of the shrubs and above the grasses and forbs, the effects of these plants on meteoric water in the basin is not known.
Surface-Water Chemistry
Surface water was sampled on a monthly basis at the gaging station in the cedar swamp at McDonalds Branch (site S-10) from April 1984 through June 1988. A statistical summary of the dissolved constituents at this site is presented in table 5. In general, surface water at the cedar swamp is acidic (mean pH - 4.2), of low ionic strength, has fairly large concentrations of aluminum and iron (155 and 125 Mg/L, respectively), and has a mean DOC concentration of 5.1. The dilute nature of the surface water is apparent in table 6, where the concentrations of major constituents at McDonalds Branch are compared with concentrations in world average river water (Meybeck, 1979).
In table 7, an ion balance for surface water at the cedar swamp is presented. The main carriers of cationic charge are hydrogen ion and sodium, followed in decreasing importance by magnesium, calcium, aluminum, potassium, and iron. The main carrier of anionic charge is sulfate; chloride also is an important anion. The similarity in the sums of cations and anions suggests that organic anion is probably not a major carrier of charge in surface water at the McDonalds Branch cedar swamp.
Lord and others (1990) reported negative values of alkalinity based on Gran (1952) titrations of surface-water samples collected at the cedar swamp in 1985-86. Alkalinity values calculated by the computer program ARCHEM (Johnsson and Lord, 1987) for the site also were negative. These negative values of alkalinity indicate the presence of strong acidity and the lack of carbonate rocks and few weatherable silicate minerals in the basin.
In table 8, results of chemical analyses of surface water collected at an upstream site in the hardwood swamp from January 1985 through March 1986 and December 1986 through June 1988 are summarized. In table 9, hardwood swamp surface-water chemistry is compared with cedar swamp surface-water chemistry at site S-10 for the period from November 1986 through June 1988. Results of a two-sided Mann-Whitney test for difference between the two populations also are included in table 9. Data from 1985 were not compared in this table because dry conditions precluded sampling of the hardwood swamp during the summer of 1985. In general, table 8 shows that concentrations of DOC, magnesium, potassium, aluminum, and iron were considerably larger at the hardwood swamp than at the cedar swamp, whereas lab pH was lower. Field pH was not significantly lower at the hardwood swamp, perhaps as a result of the smaller sample size. Specific conductance of surface water in the hardwood swamp also was somewhat greater than that at the cedar swamp. Concentrations of dissolved oxygen (DO), calcium, sodium, sulfate, chloride, and silica were similar at the two sites. In table 7, an ion balance is calculated for surface water at the hardwood swamp for November 1986 through June 1988. The large cation excess at this
39
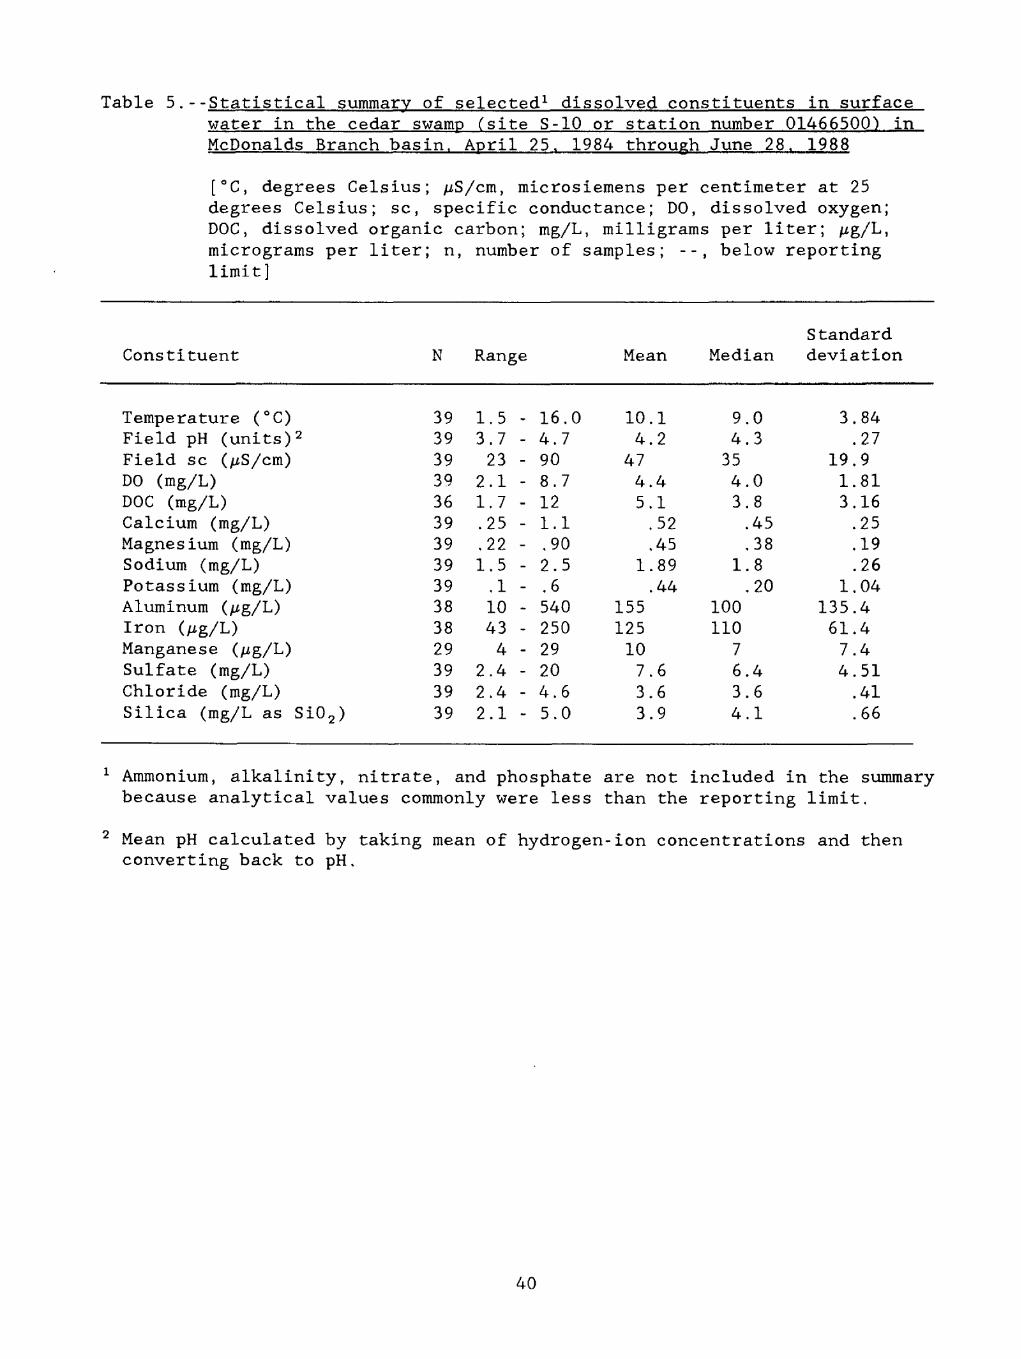
Table 5.--Statistical summary of selected 1 dissolved constituents in surface water in the cedar swamp (site S-10 or station number 01466500) in McDonalds Branch basin. April 25. 1984 through June 28. 1988
[°C, degrees Celsius; /iS/cm, microsiemens per centimeter at 25 degrees Celsius; sc, specific conductance; DO, dissolved oxygen; DOC, dissolved organic carbon; mg/L, milligrams per liter; /ig/L, micrograms per liter; n, number of samples; --, below reporting limit]
Constituent
Temperature (°C)Field pH (units) 2Field sc (/iS/cm)DO (mg/L)DOC (mg/L)Calcium (mg/L)Magne s ium ( mg/L )Sodium (mg/L)Potassium (mg/L)Aluminum (/ig/L)Iron (/ig/L)Manganese (/ig/L)Sulfate (mg/L)Chloride (mg/L)Silica (mg/L as Si0 2 )
N
393939393639393939383829393939
Range
13
21
1
222
.5
.723.1.72522.5.110434.4.4.1
- 16- 4.- 90- 8.- 12- 1.
.07
7
1
Mean
104
4745
- .90- 2.- .6
5
- 540- 250- 29- 20- 4.- 5.
60
1
15512510733
.1
.2
.4
.1
.52
.45
.89
.44
.6
.6
.9
Median
94
3543
1
100110
7634
.0
.3
.0
.8
.45
.38
.8
.20
.4
.6
.1
Standard deviation
3
1913
11356174
.84
.27
.9
.81
.16
.25
.19
.26
.04
.4
.4
.4
.51
.41
.66
1 Ammonium, alkalinity, nitrate, and phosphate are not included in the summary because analytical values commonly were less than the reporting limit.
2 Mean pH calculated by taking mean of hydrogen-ion concentrations and then converting back to pH.
40

Table 6.--Concentrations of major constituents at McDonalds Branch basin and concentrations in world average river water
[Concentrations reported in mg/L, milligrams per liter; Ca2 ,calcium; Mg2 , magnesium; Na , sodium; K , potassium;S04 2 ", sulfate; Cl", chloride; HC03 ", bicarbonate; Si0 2 , silica]
__________________Constituent________________
Ca2+ Mg2+ Na+ K+ S04 2 " Cl" HC03 " Si02
McDonalds Branch
World average.river water
0
14
.5
.7
0.5
3.7
1.9
7.2
0.4
1.4
7.
11.
6
5
3
8
.6
.3
3
53.0 10
.9
.4
Q. Alkalinity at McDonalds Branch generally is less than the reporting limit of , 1 or 0.5 mg/L as CaC03 , depending upon the analytical method used.
Data for world average river water from Meybeck (1979) and reproduced with permission from Masson S.A.
41
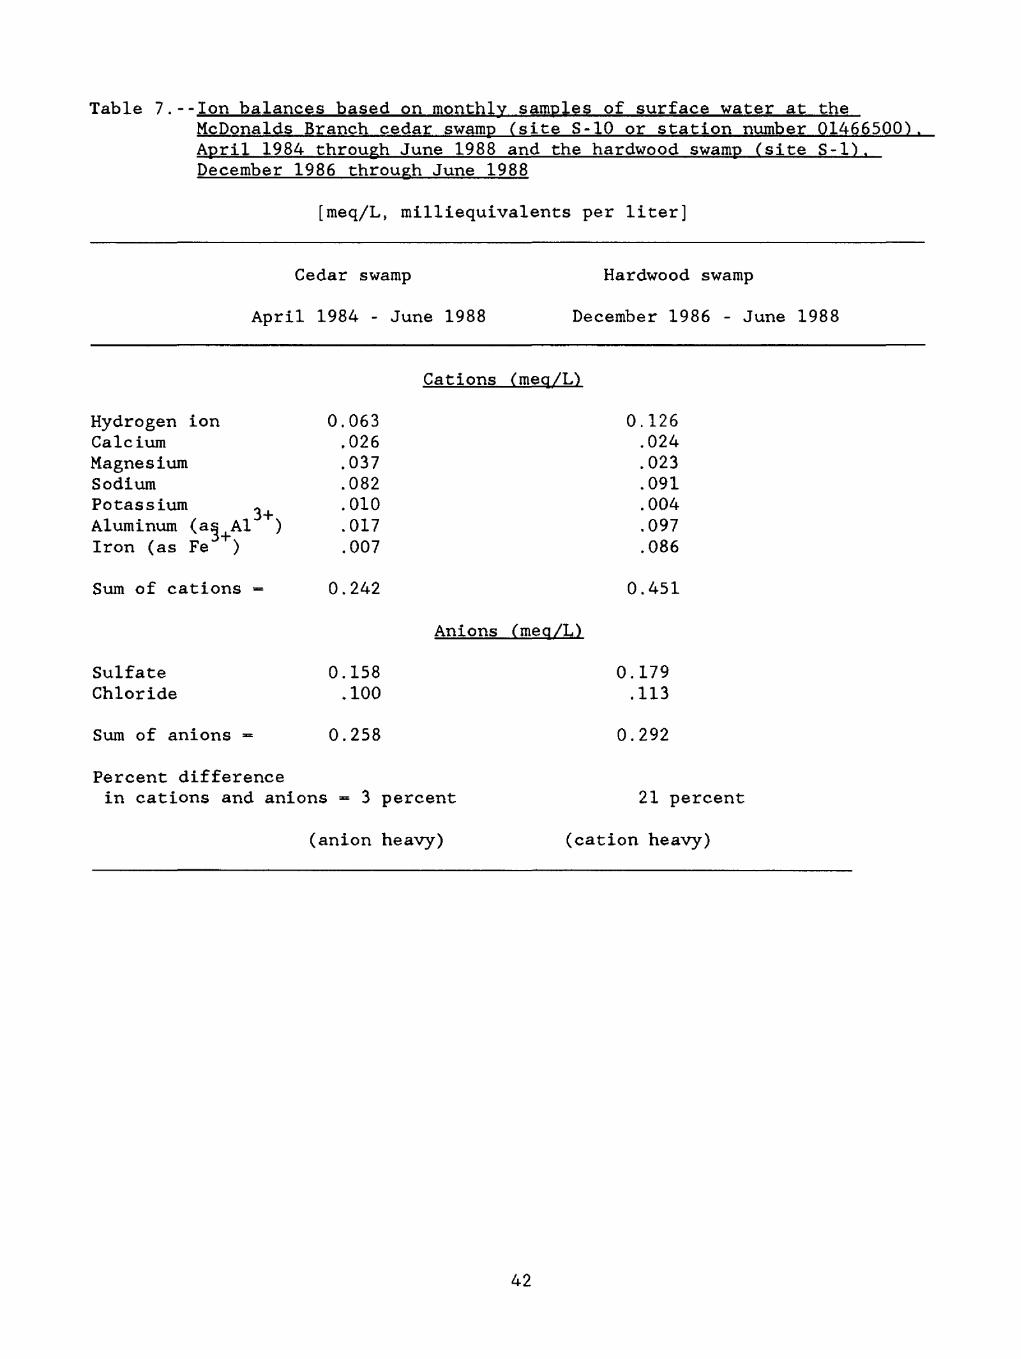
Table 7.--Ion balances based on monthly samples of surface water at theMcDonalds Branch cedar swamp (site S-10 or station number 01466500) April 1984 through June 1988 and the hardwood swamp (site S-l) . December 1986 through June 1988
[meq/L, milliequivalents per liter]
Cedar swamp
April 1984 - June 1988
Hardwood swamp
December 1986 - June 1988
Hydrogen ion CalciumMagnesium SodiumPotassium - Aluminum (as Al ) Iron (as Fe )
Cations (meq/L.)
0.063 .026.037 .082.010 .017 .007
0.126 .024.023 .091.004 .097 .086
Sum of cations - 0.242
Sulfate 0.158Chloride .100
Sum of anions - 0.258
Anions (meq/L)
Percent difference in cations and anions 3 percent
(anion heavy)
0.451
0.179.113
0.292
21 percent
(cation heavy)
42
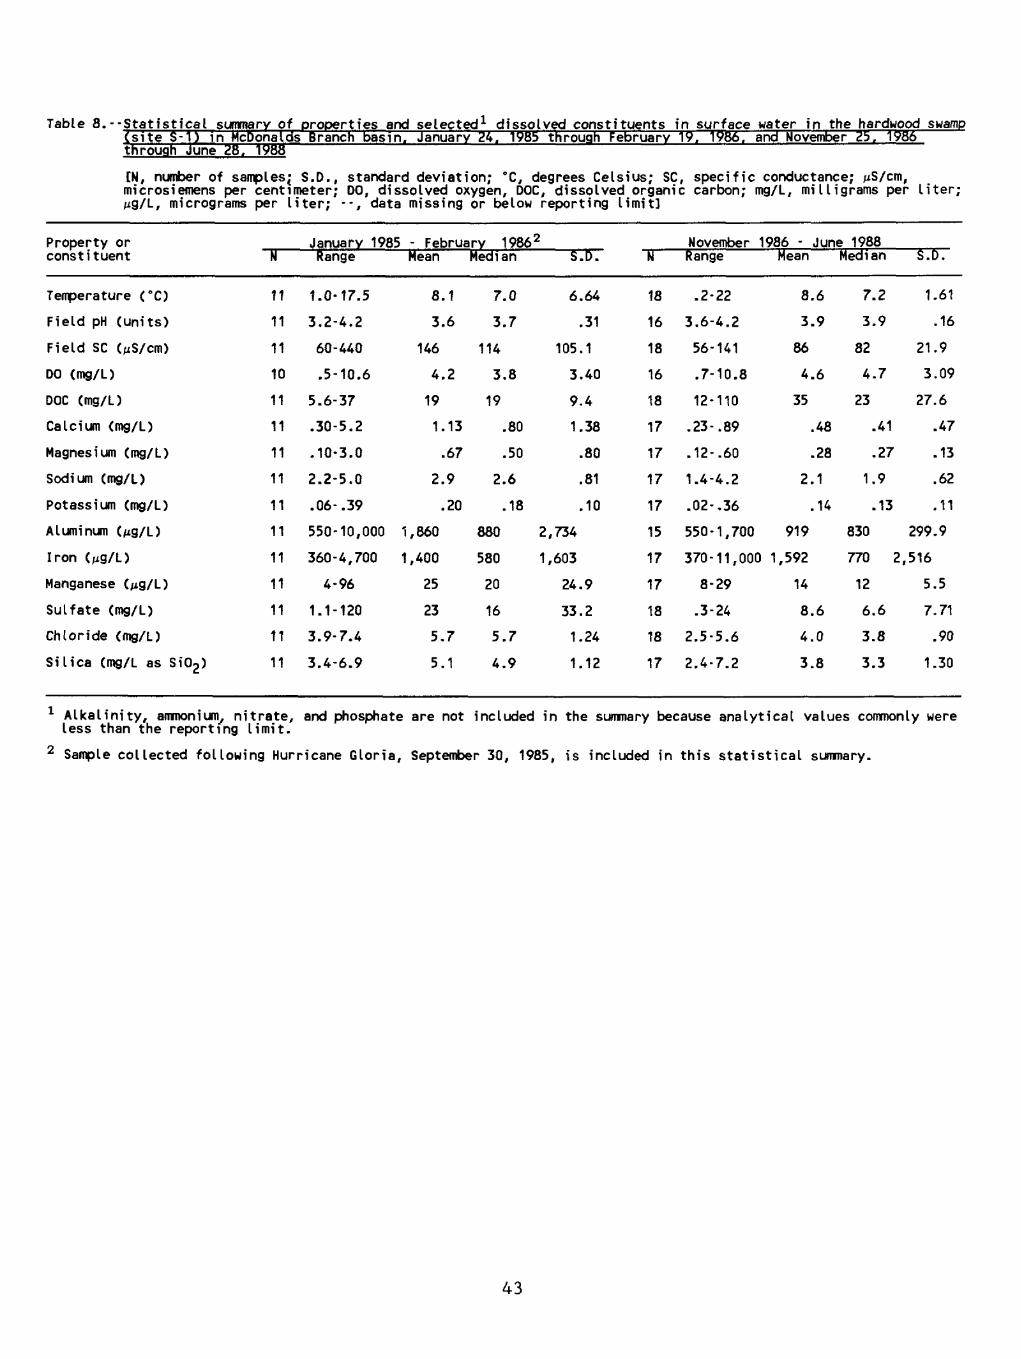
Table 8.--Statistical summary of properties and selected dissolved constituents in surface water in the hardwood swamp (site S-1) in McDonalds Branch basin. January Z4. 1985 through February 19. 1986. and November 25. 1986 through June Z8. 1988
[N, number of samples; S.D., standard deviation; °C, degrees Celsius; SC, specific conductance; jiS/cm, microsiemens per centimeter; DO, dissolved oxygen, DOC, dissolved organic carbon; mg/L, milligrams per liter;
L, micrograms per liter; -, data missing or below reporting limit]
Property or constituent
Temperature (°C)
Field pH (units)
Field SC (,iS/cm)
DO (mg/L)
DOC (mg/L)
Calcium (mg/L)
Magnesium (mg/L)
Sodium (mg/L)
Potassium (mg/L)
Aluminum (/*g/L)
Iron (^g/L)
Manganese (/*g/L)
Sulfate (mg/L)
Chloride (mg/L)
Silica (mg/L as Si02 )
January 1985 - February 1986 2N
11
11
11
10
11
11
11
11
11
11
11
11
11
11
11
Range
1.0-17.5
3.2-4.2
60-440
.5-10.6
5.6-37
.30-5.2
.10-3.0
2.2-5.0
.06-. 39
550-10,000
360-4,7004-96
1.1-120
3.9-7.4
3.4-6.9
Mean
8.1
3.6
146
4.2
19
1.13
.67
2.9
.20
1,860
1,400
25
23
5.7
5.1
Median
7.0
3.7
114
3.8
19
.80
.50
2.6
.18
880
580
20
16
5.7
4.9
S.
6.
.
105.
3.
9.
1.
.
.
.
2,734
1,603
24.
33.
1.
1.
D.
64
31
1
40
4
38
80
81
10
9
2
24
12
N
18
16
18
16
18
17
17
17
17
15
17
17
18
18
17
November 1986 - June 1988Range
.2-22
3.6-4.2
56-141
.7-10.8
12-110
.23-. 89
.12-. 60
1.4-4.2
.02-. 36
550-1,700
370-11,0008-29
.3-24
2.5-5.6
2.4-7.2
Mean
8.6
3.9
86
4.6
35
.48
.28
2.1
.14
919
1,592
14
8.6
4.0
3.8
Median
7.2
3.9
82
4.7
23
.41
.27
1.9
.13
830
770 2,
12
6.6
3.8
3.3
S.D.
1.61
.16
21.9
3.09
27.6
.47
.13
.62
.11
299.9
516
5.5
7.71
.90
1.30
1 Alkalinity, ammonium, nitrate, and phosphate are not included in the summary because analytical values commonly were less than the reporting limit.
2 Sample collected following Hurricane Gloria, September 30, 1985, is included in this statistical summary.
43
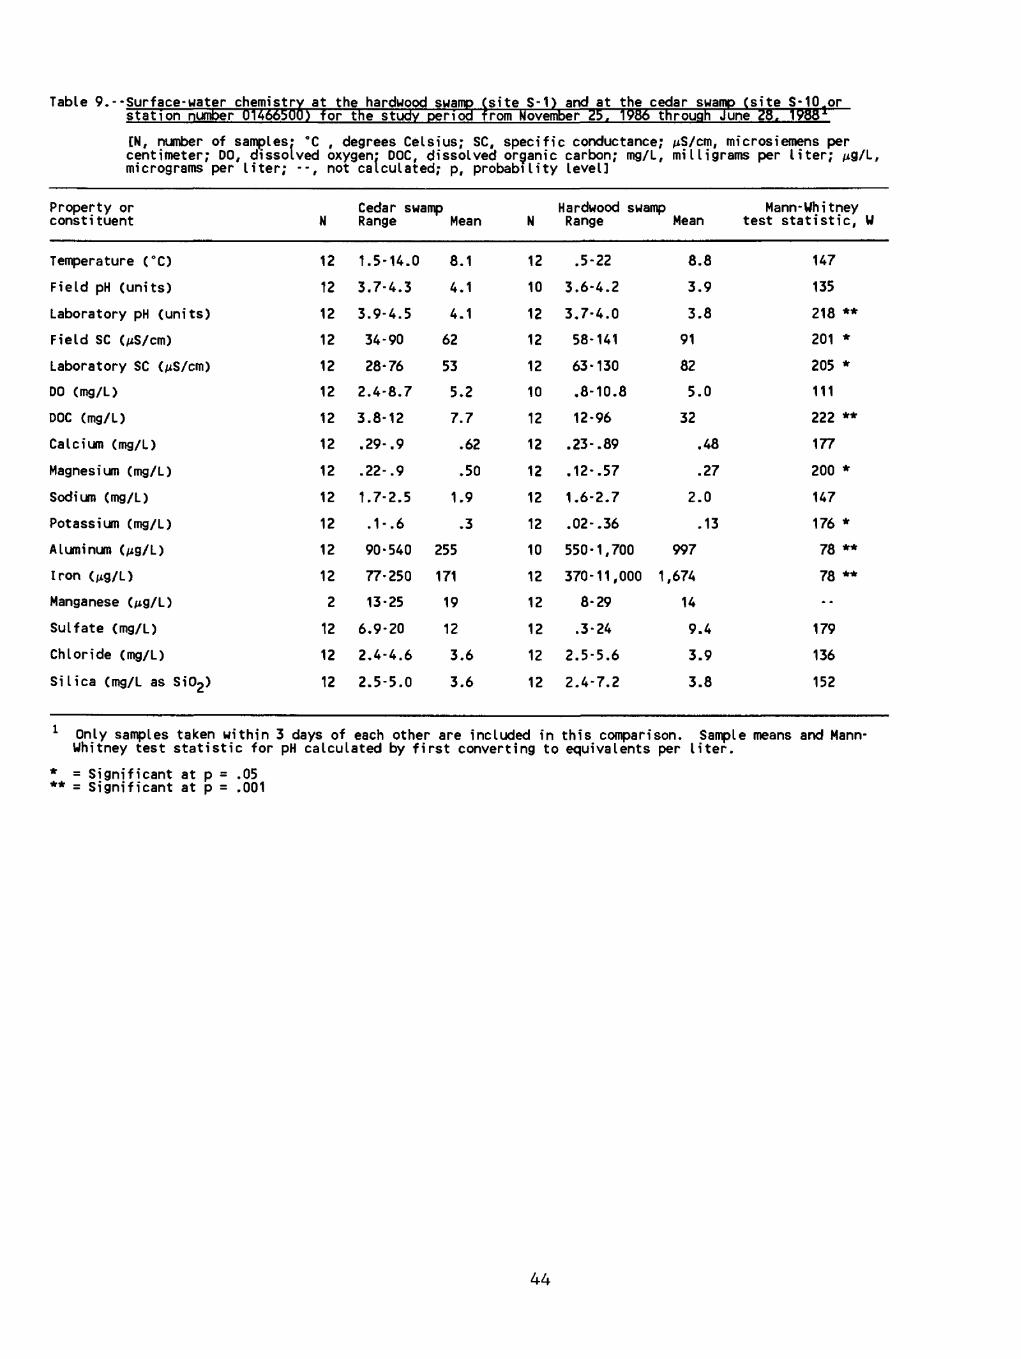
Table 9. --Surf ace-waterstation number
[N, number of centimeter; DO micrograms per
Property or constituent
Temperature (°C)
Field pH (units)
Laboratory pH (units)
Field SC (jiS/cm)
Laboratory SC (jiS/cm)
DO (mg/L)
DOC (mg/L)
Calcium (mg/L)
Magnesium (mg/L)
Sodium (mg/L)
Potassium (mg/L)
Aluminum (jig/L)
Iron (jig/L)
Manganese (jig/L)
Sulfate (mg/L)
Chloride (mg/L)
Silica (mg/L as Si02 )
chemistry at the hardwood swamp (01466500) for the study period f
site S-1) and at the cedar swamp (site S-10.orrom November 25, 1986 through
samples; °C , degrees Celsius; SC, specific conductance; , dissolved oxygen: DOC, dissolved organic carbon; mg/L, liter; --, not calculated; p, probability level]
Cedar swamp N Range Mean
12 1.5-14.0 8.1
12 3.7-4.3 4.1
12 3.9-4.5 4.1
12 34-90 62
12 28-76 53
12 2.4-8.7 5.2
12 3.8-12 7.7
12 .29-. 9 .62
12 .22-. 9 .50
12 1.7-2.5 1.9
12 .1-.6 .3
12 90-540 255
12 77-250 171
2 13-25 19
12 6.9-20 12
12 2.4-4.6 3.6
12 2.5-5.0 3.6
Hardwood swamp N Range
12 .5-22
10 3.6-4.2
12 3.7-4.0
12 58-141
12 63-130
10 .8-10.8
12 12-96
12 .23-. 89
12 .12-. 57
12 1.6-2.7
12 .02-. 36
10 550-1,700
12 370-11,000 1
12 8-29
12 .3-24
12 2.5-5.6
12 2.4-7.2
June 28. 1988-1
jiS/cm, microsiemens per milligrams per liter; jig/L,
Mean
8.8
3.9
3.8
91
82
5.0
32
.48
.27
2.0
.13
997
,674
14
9.4
3.9
3.8
Mann-Whitney test statistic, U
147
135218 **
201 *
205 *
111222 **
177
200 *
147
176 *78 **
78 **
--
179
136
152
1 Only samples taken within 3 days of each other are included in this comparison. Sample means and Mann- Whitney test statistic for pH calculated by first converting to equivalents per liter.
* = Significant at p = .05** = Significant at p = .001
44

site, coupled with the large concentrations of DOC, suggest that organic anion may be a more important component of surface water at the hardwood swamp than at the cedar swamp.
The difference in values of properties and concentrations of constituents--particularly lab pH, DOC, aluminum, and iron at the hardwood swamp and the cedar swamp probably is due, in large part, to the hydrologic differences between the two areas (discussed previously in Ground-water/ Surface-water relations). The cedar swamp at the gaging station appears to receive much of its water from ground-water discharge that originates in upland areas and moves beneath the clay lenses in the upper part of the basin. Surface water in the hardwood swamp receives water from shallow sub surface flow that moves above the clay lenses.
In figures 9 and 10, the variations in values of properties and concentrations of chemical constituents over time are plotted for the hardwood swamp (site S-l) and the cedar swamp (station 01466500, site S-10). Discharge at the cedar swamp (station 01466500) also is plotted for comparison. In figure 10, a surface-water sample collected at the cedar swamp (site S-10) during a special sampling round following Hurricane Gloria, on September 30, 1985, is included. The sample was not included in the statistical summaries presented in tables 5 and 9 because it was not part of the routine monthly benchmark sampling. At the cedar swamp, peak values of discharge, specific conductance, and concentrations of hydrogen ion (represented as declines in pH), DOC, calcium, magnesium, aluminum, and sulfate tend to occur in the winter and early spring of most years. However, little variation occurred during the 1985 drought, and large concentrations were found in samples collected after Hurricane Gloria. Concentrations of sodium, potassium, iron, chloride, and silica had more variable patterns from year to year. Concentrations of chloride decreased sharply during the first half of 1987. Concentrations of silica tended to decrease in the early spring during the period of study.
Comparison of chemical variations at the hardwood swamp and the cedar swamp is complicated by the fact that sampling was not designed to allow for the velocity of water and the traveltime between the two sites. Additionally, there were far fewer samples taken at the hardwood swamp than at the cedar swamp. Despite these problems, there seems to be a general tendency for variations in properties and concentrations at the hardwood swamp to parallel variations at the cedar swamp, although the actual concentrations of some constituents often varied by more than an order of magnitude. This parallel tendency appeared to be stronger during 1987 than 1985, although properties and concentrations could not be compared during the summer of 1985 as a result of dry conditions at the hardwood swamp. The difference in the magnitudes of species also tended to be greater during 1985 than 1987 (see graphs of pH and chloride in figs. 9 and 10). From May 1985 through January 1986, the open-channel area between the two swamps often was dry, so that the two parts of the stream were not connected. This lack of connection probably contributed greatly to the increased chemical variability between the two sites during this time.
45

CO2
llTeO OC-131115°ocfjjQJUJ
5§ -Q
Z
eo
z3Z
Ia
UJOzeooc
O«5MJ3 itQ=)±
8OZ OCUJ
o yo 30Ct UJlll~ a.eo
OC ZUJ~t z-1
PSjy, COONCENl
LIGRAM
0=1S
<3U
20
10
0 ___________________________ __
I I I-
» ~ *
* *"*
v .r. ! *tc111
4.4 H
4.2
40
38
36
3.4
3.2
Q A
iii. ** ** * * ** ** ~ , -'_ * j
iii"
~OC111a.eoS
OCo 1
i500
400
300
200
100
0 -- - f.
iii.
>- * * 0 ^»* . 00
I I I
z
zo1-
ocI-z111o
O
12 °10
8
6
4
2
0
II I
-DISSOLVED OXYGEN *
- . . ^ -
_
_
1 1 1
1ZU
100
80
60
40
20
0
1 I.I
-DISSOLVED ORGANIC . - ^CARBON J
-
~* . *. *. - * 0»«.»» -
* 1 .1 1
6
4
2
1 1 1 CALCIUM -
_. -
.
- . | |* * *! 0
4
3
2
1
1 1 1" MAGNESIUM
~ ~
-
** . r* > * . .. ! 0
6
5
4
3
2
1
i i i- . SODIUM.I- *
.
- *** ' ... / -i r *** * i1985 1986 1987 1988 1985 1986 1987 1988
Figure 9.--Monthly variations in properties and concentrations of dissolved constituents at the hardwood swamp (site S-l) at McDonalds Branch basin.
46

VD o
o B
CO
NC
EN
TR
AT
ION
, IN
M
ICR
OG
RA
MS
P
ER
L
ITE
R
t.
oo
jo
to
«
o>
po
o
_A CD 09 cn <D 09 en <D 09 -j CD 09 09
1 \
' I
' 1
' 1
'
,
:
.
/
__
- : l- $
f
Z
m CO m,1,1,1,1,
11 1
c i
z
c
CO
NC
EN
TR
AT
ION
, IN
M
ILL
IGR
AM
S P
ER
LIT
ER
o
p
p
p
ob
-*
ro
u
*1
I '
1.
' I
'
3
CO
CO
NC
EN
TR
AT
ION
, IN
M
ILL
IGR
AM
S
PE
R
LIT
ER
to
*
at
o?
o
ro
*
oo
oo
oo
so
oo
01
CBCO
U
<|
>01
OB
X
6 m1,1
,
:'

UIO<9Z<°
o 1"wQUJ
31-Oui
lozmi o1-
3
Ig|wUL|uj
^ -OUJjjj
z
wb z
z
iQ.
UJO<z a
§suliwpOCCUJ
s:i<r UJozSUJ Q.W
6
5
4
3
2
1
0
20
10
0
52
5.0
48
46
4.4
42
40
0 0O.O
100
80
80
40
20
I I I I
- ' ~
*. *-- ." "..
I I I I "
I I I I
' * ."*. . '
* * *
...» . *. «
.
* .i i r i
i i i i . . ._.....*.. _
* .* *** . . * _ . . ... . - .... i i i i
i i i i _
*
_ _. . .* % .""" *' i * i i
trUJi-
a.UJ Q.
w^^
IIo_J
iz_
0t-
scI-zUJ
oz 0o
10
8
6
4
2
14
12
10
8
6
4
2
0
1.2
1.0
08
06
04
0.2
1.0
08
0.6
04
02
1 1 1 1" DISSOLVED OXYGEN . - .
m "
*
% 1 .1 *" " 1 * * 1
1 1 1 1 . -DISSOLVED ' --ORGANIC CARBON .. -
r- . ~. . .. . -
. . . - * . "." * " ""*
i i i i
1 1 1 1 _CALCIUM . _
. . . . -
! " .1- ' . ' . -~ ".* * . ~
Y * i i i
i i i i' MAGNESIUM
. ... -
. -
_ .. _
.** * . 1 " 1 .'I . " 1
1984 1985 1988 1987 1988
Figure 10.--Instantaneous discharge at the cedar swamp and monthlyvariations in properties and concentrations of dissolved constituents at the cedar swamp (station 01466500, site S-10) at McDonalds Branch basin.
48

CO
NC
EN
TR
AT
ION
. IN
M
ICR
OG
RA
MS
P
ER
L
ITE
RC
ON
CE
NT
RA
TIO
N.
IN M
ILL
IGR
AM
S
PE
R
LIT
ER
OP C
_i
w
GO
Q
Q
Q
Q
2
S
^ h{
Q
O
O
O
O
O
O
O
O
O
O
O
-
S 1
i 0
O
->
3
CD(~
f *
*p
. O
l
C o-
£ 09 0» «D 09 CD 09 09
, |
, |
i
-.=
/
f.
r i
m
-
. '
f
.
.
, 1,1,
, I
, 1
i
. 5
O
- .
'
.f
- '
.*
\
.'
..
,1
,1
,
I ,
| ,
^
^ 1
.
z
c
-.
.
-s'
^ (
;
.
,1
,1
,
> O
O
O
O
O
O
-i
-i
-i
10
10
10
M'io
co
ika
ictW
ikctb
ob
w^ci
, 1
i I
, |
, |
i |
,T
}
-.
I-
.
co -
. :
! '
1 : 9
* *
. _
| '
.
,1,1,1,1,1,
i I
, I
, I
i i
, I
i0
0
* :
| _
l: ' . i
* -
. '
.
. :
.
.
"*
,1,1
,1,1
,1,
CO
NC
EN
TR
AT
ION
. IN
M
ILLIG
RA
MS
P
ER
L
ITE
R
a
OO
°
_*
CD
09 * CD 09 Ol
CD 09
0» CD 09 -J CD 09 09
1CO F O >
_".
'.
:
:. *
*
!
I*
, i
1 1
' 1
' O I
...
5 2 -
o
%
. .'
*
t
_
_
.
, 1,1,
1 i
' i
CO
c 2
t
-i -
*.
m , m-'
*
* *.
-
:
_
.
,1
,1
,
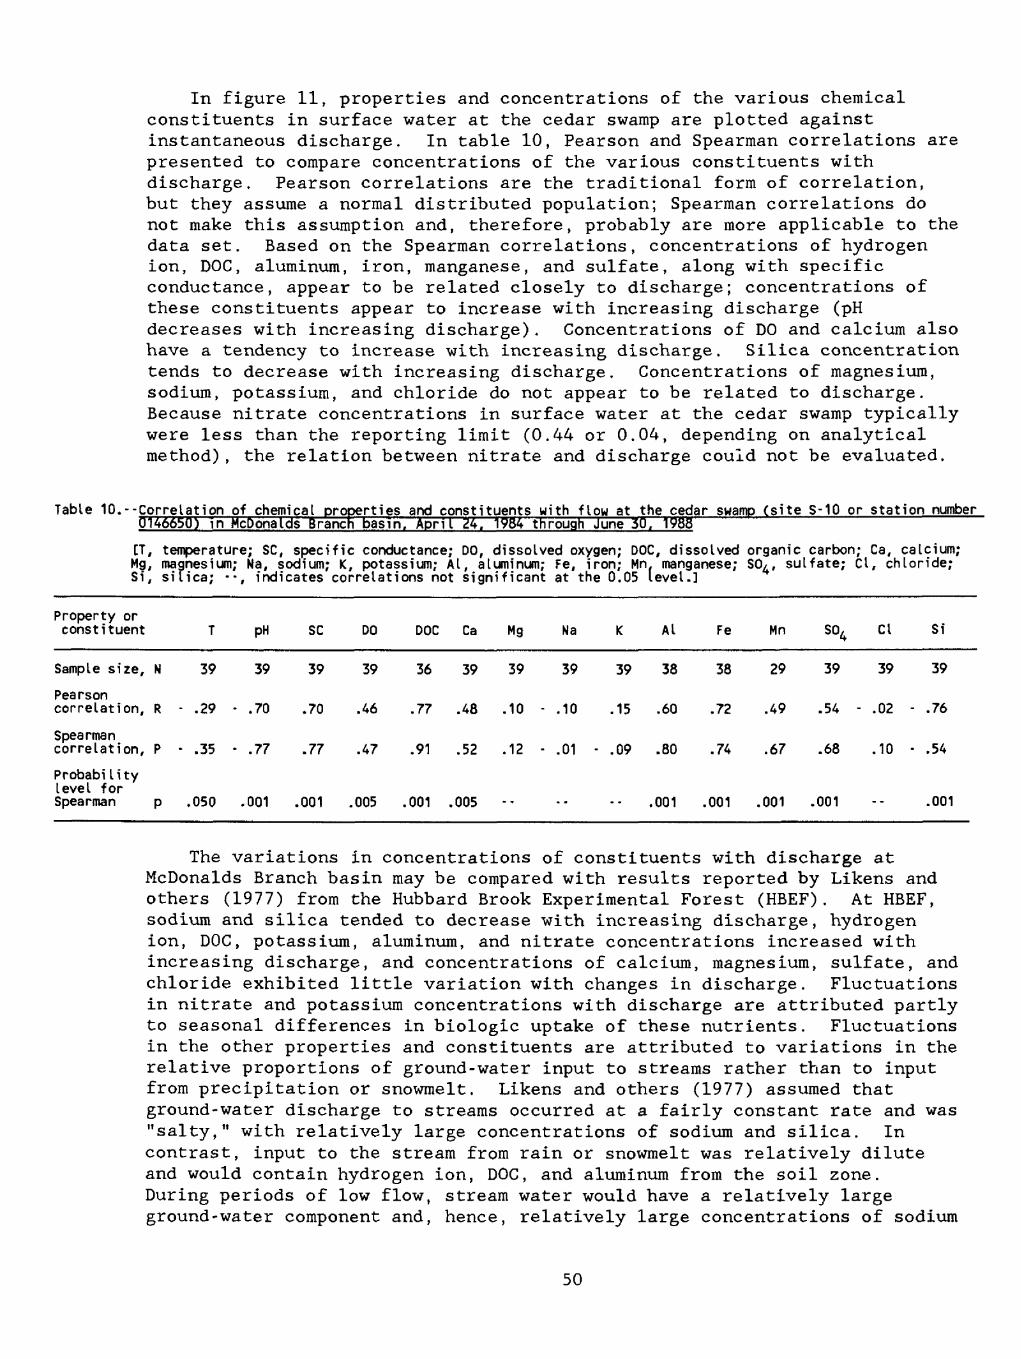
In figure 11, properties and concentrations of the various chemical constituents in surface water at the cedar swamp are plotted against instantaneous discharge. In table 10, Pearson and Spearman correlations are presented to compare concentrations of the various constituents with discharge. Pearson correlations are the traditional form of correlation, but they assume a normal distributed population; Spearman correlations do not make this assumption and, therefore, probably are more applicable to the data set. Based on the Spearman correlations, concentrations of hydrogen ion, DOC, aluminum, iron, manganese, and sulfate, along with specific conductance, appear to be related closely to discharge; concentrations of these constituents appear to increase with increasing discharge (pH decreases with increasing discharge). Concentrations of DO and calcium also have a tendency to increase with increasing discharge. Silica concentration tends to decrease with increasing discharge. Concentrations of magnesium, sodium, potassium, and chloride do not appear to be related to discharge. Because nitrate concentrations in surface water at the cedar swamp typically were less than the reporting limit (0.44 or 0.04, depending on analytical method), the relation between nitrate and discharge could not be evaluated.
Table 10.--Correlation of chemical properties and constituents with flow at the cedar swamp (site S-10 or station number 0146650) in HcDonalds Branch basin. April 24. 1984 through June 30. 1988
[T, temperature; SC, specific conductance; DO, dissolved oxygen; DOC, dissolved organic carbon; Ca, calcium;Mg, magnesium; Na, sodium; K, potassium; Al, aluminum; Fe, iron; Mn. manganese; SO/, sulfate; Cl, chloride;Si, silica; -, indicates correlations not significant at the 0.05 level.]
Property orconstituent
Sample size.
Pearsoncorrelation,
Spearmancorrelation.
N
R
P
T
39
- .29
- .35
PH
39
.70
- .77
SC
39
.70
.77
DO
39
.46
.47
DOC
36
.77
.91
Ca
39
.48
.52
Mg
39
.10
.12
Na
39
- .10
- .01
K
39
.15
- .09
Al
38
.60
.80
Fe
38
.72
.74
Mn
29
.49
.67
so4
39
.54
.68
Cl
39
- .02
.10
Si
39
- .76
- .54
Probabilitylevel forSpearman p .050 .001 .001 .005 .001 .005 -- -- -- .001 .001 .001 .001 -- .001
The variations in concentrations of constituents with discharge at McDonalds Branch basin may be compared with results reported by Likens and others (1977) from the Hubbard Brook Experimental Forest (HBEF). At HBEF, sodium and silica tended to decrease with increasing discharge, hydrogen ion, DOC, potassium, aluminum, and nitrate concentrations increased with increasing discharge, and concentrations of calcium, magnesium, sulfate, and chloride exhibited little variation with changes in discharge. Fluctuations in nitrate and potassium concentrations with discharge are attributed partly to seasonal differences in biologic uptake of these nutrients. Fluctuations in the other properties and constituents are attributed to variations in the relative proportions of ground-water input to streams rather than to input from precipitation or snowmelt. Likens and others (1977) assumed that ground-water discharge to streams occurred at a fairly constant rate and was "salty," with relatively large concentrations of sodium and silica. In contrast, input to the stream from rain or snowmelt was relatively dilute and would contain hydrogen ion, DOC, and aluminum from the soil zone. During periods of low flow, stream water would have a relatively large ground-water component and, hence, relatively large concentrations of sodium
50

and silica. During periods of high flow, stream water would contain a 'Large proportion of input from rain or snowmelt that had travelled through soil zones and, hence, relatively large concentrations of hydrogen ion, DOC, and aluminum.
At McDonalds Branch basin, the variations in concentrations of constituents with discharge also may be caused, in part, by variability in ground-water/surface-water relations. During low flow, in particular during the 1985 drought, surface water in the cedar swamp is derived mostly from ground water; at higher flow, input from the hardwood swamp and from soil zones are more important. The inverse relation between instantaneous discharge and concentrations of silica in stream water indicates that silica is derived mostly from the aquifer. In contrast, the direct relations between instantaneous discharge and concentrations of DOC, aluminum, iron, manganese, and sulfate, suggest that these constituents are derived mostly from soil zones within the basin. The inverse relation between instantaneous discharge and pH indicates that hydrogen ion increases as discharge increases and is, therefore, derived mostly from soil zones as well.
Ground-Water Chemistry
From January 1985 through February 1986, ground water was sampled on a monthly to a bimonthly basis at a total of approximately 25 wells located along 3 transects intersecting the hardwood swamp, the open channel, and the cedar-swamp parts of the stream. The transects comprised sets of shallow (just below surface of water table) and deep (approximately 20 ft below surface of water table) wells (see Lord and others, 1990). Results of this sampling are presented in Lord and others (1990). In general, this intensive sampling indicated that ground water at McDonalds Branch basin was acidic and had small concentrations of ions. DOC, aluminum, iron, and sulfate tended to be the most variable constituents over time and space; the largest concentrations of these components was found in shallow wells in lowland areas of the basin, particularly near or underlying the stream channel in the hardwood swamp and the open-channel areas (Lord and others, 1990).
In November 1986, bimonthly ground-water sampling was resumed at four shallow wells in the basin and continued until June 1988. The four wells (QWH-1A, QWH-4A, QWO-3A, QWC-1A, locations in fig. 2) were chosen to represent the range of chemistry in shallow ground water in the basin on the basis of data collected during the 1985-86 study. Well QWH-1A was located in the stream channel in the upstream part of the basin in the hardwood- swamp area. Well QWC-1A was located in the stream channel in the downstream part of the basin in the cedar-swamp area. Well QWO-3A and well QWH-4A were located in more upland areas of the basin that were characterized by pine- oak forests and Lakehurst soils.
Statistical summaries of chemical analyses of water samples collected from these four wells during the sampling periods are presented in tables 11 through 14.
51

CO
ijw§UJ
5CCu,TEMPE DEQREI
Z
CObz
z~
iQ.
m
ulo
gjjjSi^ 2UJQUJJ
zcop OOz OCCUJ
JTZCC
3s*Q. CO
£\J
10
0
' 1 ' 1 ' 1 ' | ' 1 '
"s" w
" .
t "
, 1,1:1,1,1,
CCUJi-
ccUJQ.
CO
5.2 "
5.0
48
4.6
4.4
4.2
4.0
38
- ' 1 ' I ' 1 ' 1 ' 1 ' -
*
M w
__ m __
* *
- , 1 , 1 ,' 1 ', 1 , 1 ' , -
"^
CCoIJ±X
z
z o1-
100 <
80
60
40
20
1 1 ' 1 ' 1 ' 1 ' 1 '
1 . : . J
.
" **«..!' ~, J*7", 1,1,1 i 1 ,
CC1- zUJoz oo
01 23456
14
12
10
8
6
4
2
0
- ' 1 ' 1 ' 1 ' 1 ' 1 '
. .
~
_
-_-
..' : * DISSOLVED ORGANIC- - '.'. » . CARBON- , 1 , 1 , 1 , 1 , 1 ,
12
1.0
0.8
0.6
0.4
0.2
-
1 1 ' 1 ' 1 ' 1 ' 1 ' CALCIUM-
. . ...
*
_ . . "
~ 'v' , T * '!' i , i , i , i i
1.0
0.8
0.6
0.4
0.2
1 1 ' 1 ' 1 ' 1 ' 1 '
- -
_-
MAGNESIUM
*
** *. "
i ? " ?' i .1 i i* i i r i01 2345
-
-
-
6
INSTANTANEOUS DISCHARGE. IN CUBIC FEET PER SECOND
INSTANTANEOUS DISCHARGE, IN CUBIC FEET PER SECOND
Figure 11.--Relations between properties and concentrations of dissolvedconstituents and discharge at McDonalds Branch basin, April 1984 through June 1988.
52
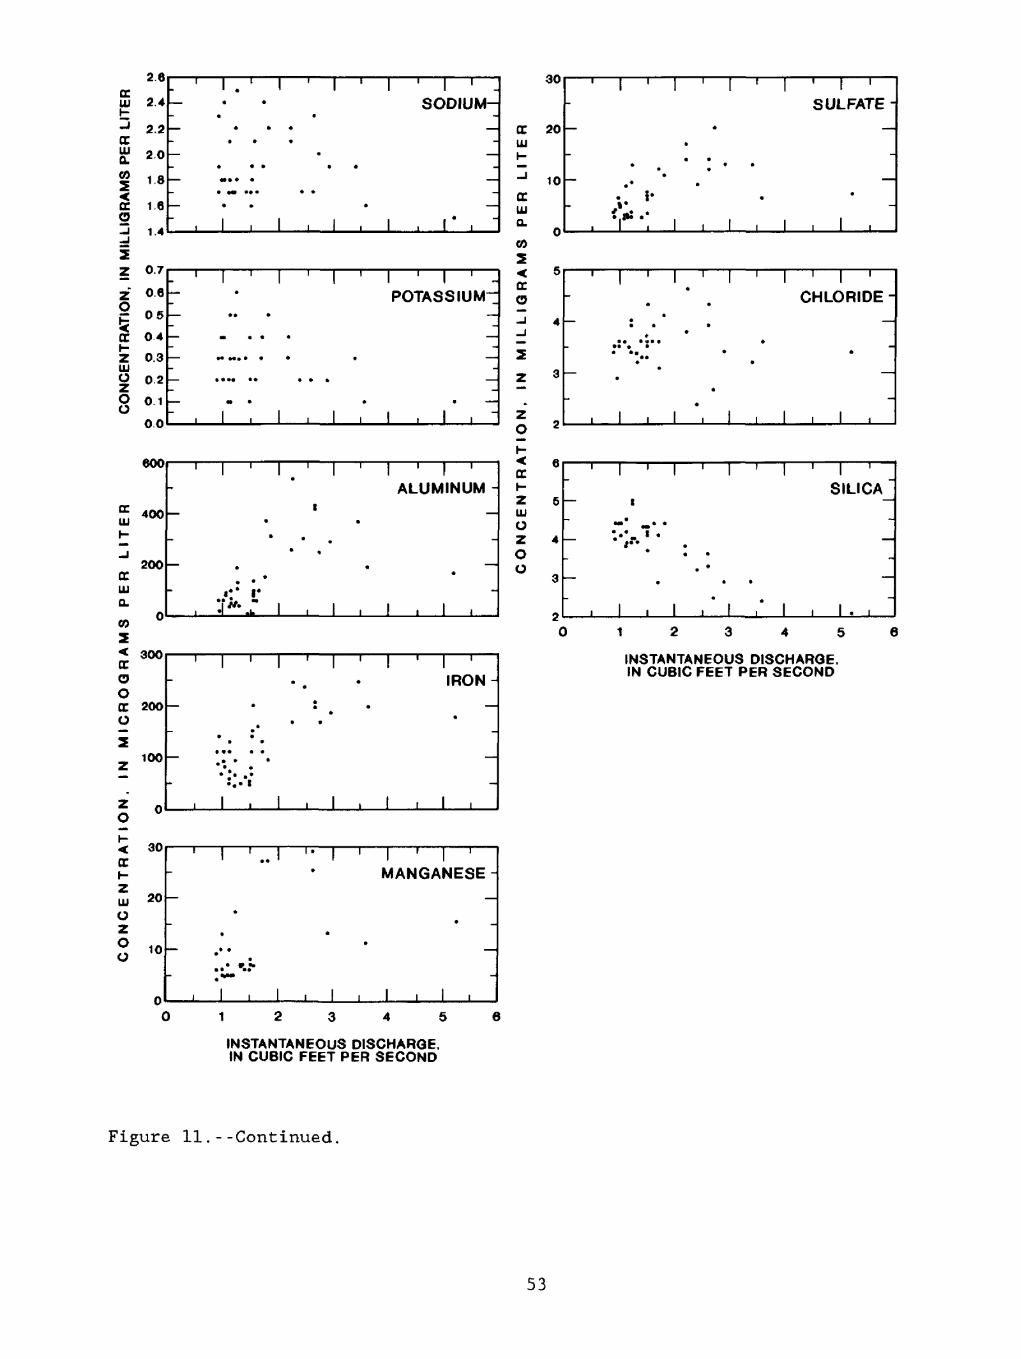
CC
Pcc 111Q.coXcc o
2 O
24
2.2
20
1.8
16
1 A
. ' 1 . ' 1 ' 1 ' 1 ' 1 ' .
SODIUM-_ ^
*
M* -
« * -
.
" , i , i , i , i , r , -
cc111H
_J
CC1110.
3O
20
10
n
1 1 ' 1 ' 1 ' 1 ' 1 '
SULFATE -_ . _
.
. . t . " t *
. j. . /**
, "f", 1 ! 1 , 1 , 1 ,
CO* *z 07 - *
Z" 06oP 05
OC 04^Z 0.3111 0 02
0 0.1
00
. ' 1 ' 1 ' 1 ' 1 ' 1 ' - r POTASS IUM- ... «... - « .« . . . ...... ... _ « » . . -,1,1,1,1,1,-
^ o
cc0
-1 4-J~ *2
Z 3MB
0 2
' . CHLORIDE -
: . " «
... . - . ' '
.-, 1 , 1 ', 1 , 1 , 1 ,
BOO
S«x>t-_j
200CC1110.
n
i | , | , | , | i | i
ALUMINUM -_ i _
*
*
. .
.
i"* i**\ tt* "* i i i ii ! .u 1 i 1 i 1 i 1 i
^,cc1-z 111oz0o
o
6
4
3
9
1 | 1 | , | 1 | I | ,
SILICA "1
r*! ~" * **j"' ' * i .
B . ...
, i , i , ' i ,' i , i . ,co
cc0occ0
X z
ITRATION,
inOZo0
3UU
200
100
0
30
20
10
O
1 1 ' 1 ' 1 ' 1 ' 1 '
IRON -
' :'; '. '
, 1,1,1,1,1,
MANGANESE -- -
_
.. ..-
, 1 , 1 i 1 , 1 , 1 ,
INSTANTANEOUS DISCHARGE. IN CUBIC FEET PER SECOND
INSTANTANEOUS DISCHARGE. IN CUBIC FEET PER SECOND
Figure 11.--Continued.
53
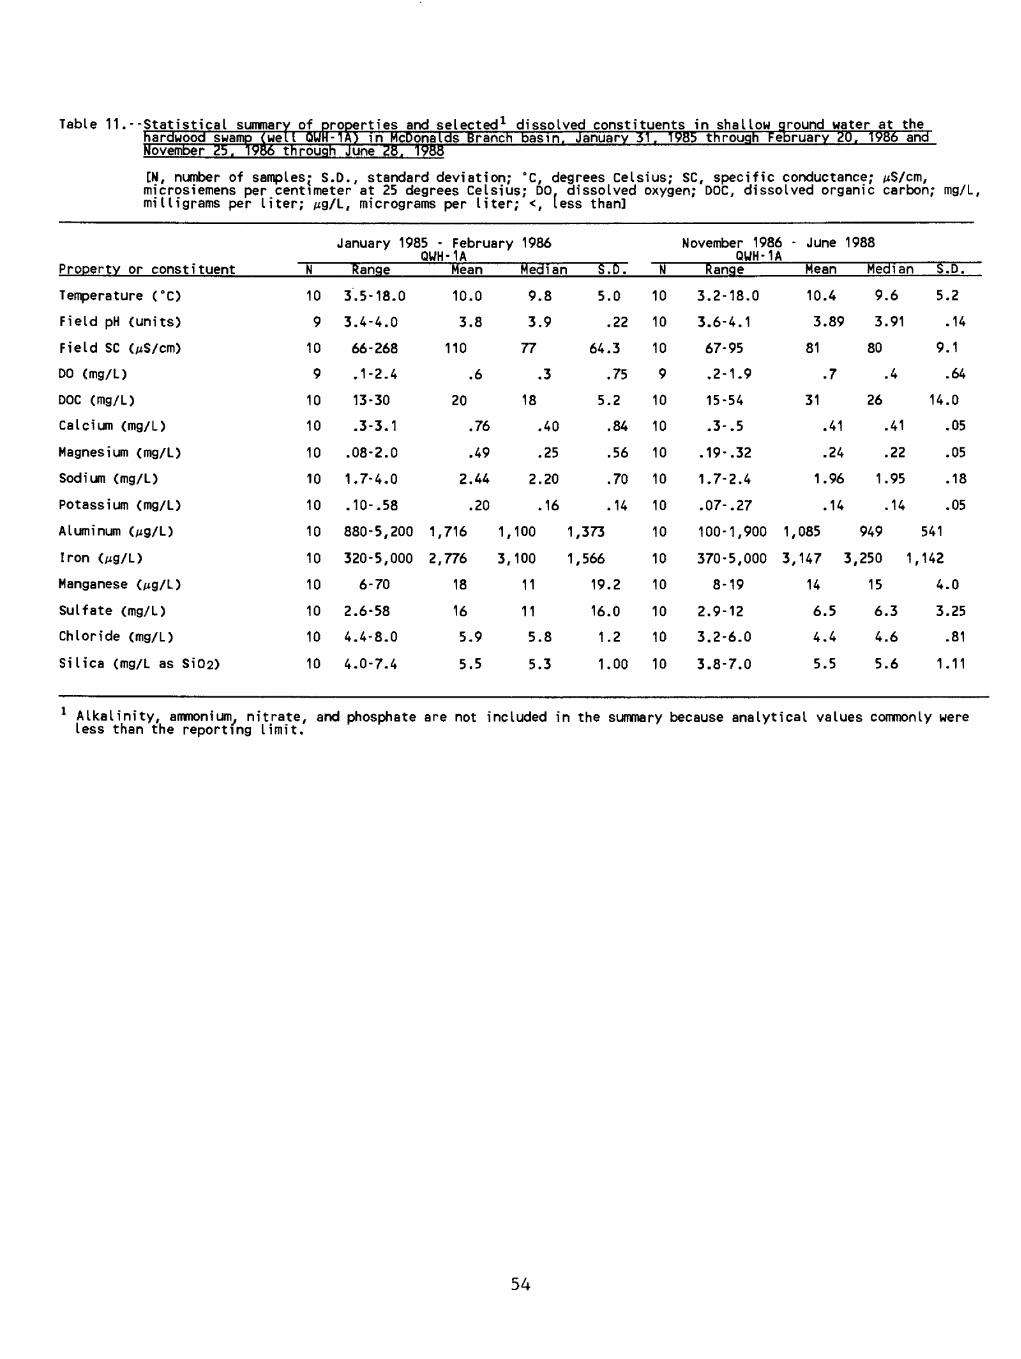
Table 11 .- -Statistical summary of properties and selected dissolved constituents in shallowhardwood swamp (iNovember 25. 198<
^ell QUH-1A) in McDoj through June 28. 1
nalds Branch basin.988
ground water at theJanuary 31. 1985 through February 20 . 1986 and
[N, number of samples; S.D., standard deviation; °C, degrees Celsius; SC, specific conductance; /jS/cm, microsiemens per centimeter at 25 degrees Celsius; DO. dissolved oxygen; DOC, dissolved organic carbon; mg/L, milligrams per liter; /^g/L, micrograms per liter; <, less than]
Property or constituent
Temperature (°C)
Field pH (units)
Field SC (/iS/cm)
DO (mg/L)
DOC (mg/L)
Calcium (mg/L)
Magnesium (mg/L)
Sodium (mg/L)
Potassium (mg/L)
Aluminum (/^g/L)
Iron (/ig/L)
Manganese (/^g/L)
Sulfate (mg/L)
Chloride (mg/L)
Silica (mg/L as Si02)
January 1985 - February 1986 QWH-1A
N
10
9
10
9
10
10
10
10
10
10
10
10
10
10
10
Range
3.5-18.0
3.4-4.0
66-268
.1-2.4
13-30
.3-3.1
.08-2.0
1.7-4.0
.10-. 58
880-5,200
320-5,0006-70
2.6-58
4.4-8.0
4.0-7.4
Mean
10.0
3.8
110
.6
20
.76
.49
2.44
.20
1,716
2,776
18
16
5.9
5.5
Median
9.8
3.9
77
.3
18
.40
.25
2.20
.16
1,100 1
3,100 1
11
11
5.8
5.3
S.D.
5.0
.22
64.3
.75
5.2
.84
.56
.70
.14
,373
,566
19.2
16.0
1.2
1.00
N
10
10
10
9
10
10
10
10
10
10
10
10
10
10
10
November 1986 - June 1988 QWH-1A
Range
3.2-18.0
3.6-4.1
67-95
.2-1.9
15-54
.3-. 5
.19-. 32
1.7-2.4
.07-. 27
100-1,900
370-5,000
8-19
2.9-12
3.2-6.0
3.8-7.0
Mean
10.
3.
81
.
31
.
.
1.
.
1,085
3,147
14
6.
4.
5.
4
89
7
41
24
96
14
3
5
4
5
Median
9.6
3.91
80
.4
26
.41
.22
1.95
.14
949
,250 1,
15
6.3
4.6
5.6
S.D.
5.2
.14
9.1
.64
14.0
.05
.05
.18
.05
541
142
4.0
3.25
.81
1.11
Alkalinity, ammoniurn, nitrate, and phosphate are not included in the summary because analytical values commonly were less than the reporting limit.
54

Table 12. --Statistical summary of properties and selected 1 dissolved constituents in shallow ground water atan upland area (well QUH-4A) in McDonalds Branch basin, January 30, 1985 through February 20,and November 25.
19861986 through Hay 31. 1988
[N, number of samples; S pS/cm, microsiemens per organic carbon; mg/L, mi less than]
.0., standard deviation; °C. degrees centimeter at 25 degrees Celsius; 00 Uigrams per liter; pg/L, micrograms
January 1985 - Feb
Property/const i tuent
Temperature (°C)
pH (units)
Field SC (/iS/cm)
00 (mg/L)
DOC (mg/L)
Calcium (mg/L)
Magnesium (mg/L)
Sodium (mg/L)
Potassium (mg/L)
Aluminum (pg/L)
Iron (mg/L)
Manganese (pg/L)
Sulfate (mg/L)
Chloride (mg/L)
Silica (mg/L as SiOa))
N
10
10
10
10
10
10
10
10
10
10
10
10
10
10
10
Range
10.5-14.0
4.7-5.1
33-38
7.2-8.7
.3-2.0
1.6-2.0
.5-1.0
1.6-2.1
.23-. 36
110-370
<2-22
73-87
7.1-7.7
3.1-3.9
2.7-3.0
QWH-4A Mean
11.6
4.8
36
8.0
1.0
1.8
.7
1.9
.29
192--
83
7.4
3.4
2.8
Celsius; SC, specific conductance; , dissolved oxygen; DOC, dissolved per liter; --, not calculated , <,
ruary 1986
Median
11.0
4.9
36
8.2
.8
1.8
.70
1.9
.29
190
11.5
84
7.3
3.3
2.8
S.O.
1.1
.15
1.5
.59
.54
.12
.15
.18
.04
74--
4.0
.18
.22
.10
N
10
9
10
9
10
10
10
10
10
9
10
10
10
10
10
November 1986
Range
10.0-14.5
4.6-5.0
27-50
6.6-11
.8-2.2
1.1-2.2
.33-. 67
1.4-2.5
.18-. 39
310-5605-88
7-110
6.4-8.9
2.7-5.3
2.0-3.1
QWH-4A Mean
11.5
4.77
38
8.7
1.3
1.7
.53
1.9
.29
430
20
85
7.9
3.6
2.8
- May 1988
Median
11.1
4.77
39
8.9
1.2
1.7
.56
1.9
.30
430
12.5
97
8.1
3.3
2.9
S.O.
1.5
.11
7.6
1.5
.48
.36
.12
.39
.08
97
24.8
31.0
.81
.86
.33
1 Alkalinity, ammonium, nitrate, and phosphate are not included in the summary because analytical values
commonly were less than the reporting limit.
2 No value was calculated because analytical values were below the reporting limit.
55

Table 13. Statistical summary of properties and selected 1 dissolved constituents in shallow ground water at an upland area (well QWO-3A) in McDonalds Branch basin. February 4. 1985 through February Z1. 1986 andNovember 25. 1986 through June T988
[N, number of samples; S.D., standard deviation; °C, degrees Celsius; SC, specific conductance; microsiemens per centimeter at 25 degrees Celsius: DO, dissolved oxygen; DOC, dissolved organic carbon; mg/L, milligrams per liter; jig/L, micrograms per liter; --, not calculated''; <, less than]
February 1985 - February 1986 QWO-3A
Property/const i tuent
Temperature (°C)
Field pH (units)
Field SC (/iS/cm)
Dissolved oxygen (mg/L)
Dissolved organic carbon (mg/L)
Calcium (mg/L)
Magnesium (mg/L)
Sodium (mg/L)
Potassium (mg/L)
Aluminum (^g/L)
Iron (jig/L)
Manganese (/ig/L)
Sulfate (mg/L)
Chloride (mg/L)
Si lica (mg/L as Si02)
N
10
10
10
10
10
10
10
10
10
10
10
10
10
10
10
Range
9.5-U
4.4-4.6
44-49
7.3-8.8
.7-2.0
1.2-1.4
.39-. 43
1.8-2.0
.13-. 20
970-1,100
<2-44
81-91
9.9-11
3.2-4.1
2.0-2.4
Mean
11.0
4.5
48
8.2
1.3
1.3
.40
2.0
.17
970
--
86
10
3.6
2.3
Median
10.5
4.5
48
8.4
1.3
1.3
.40
2.0
.17
975
20
86
10
3.6
2.3
S.D.
1.5
.07
1.4
.57
.33
.06
.01
.07
.02
61.8
11.8
3.1
.45
.31
.11
N
10
10
11
10
111111111110
1111111111
November 1986 - QUO-3A
Range
9.0-14.0
4.0-4.6
31-56
7.3-10.5
1.0-11.0
1.1-1.2
.34-. 37
1.7-2.7
.14-. 18
890-1,100
3-44
82-93
9.2-12
3.3-4.9
2.1-2.6
Mean
11.
4.
47
9.
2.
1.
.
2.
-
1,004
17
87
9.
3.
2.
5
35
3
4
1
35
1
22
1
9
9
3
June 1988
Median
11.8
4.49
48
9.4
1.4
1.1
.35
2.1
.17
,000
11
86
9.8
3.8
2.3
S.D.
1.8
.03
6.6
1.1
2.9
.05
.01
.37
.03
77.2
14.8
3.3
.74
.63
.14
Alkalinity, ammonium, nitrate, and phosphate are not included in the summary because analytical values commonly were less than the minimum reporting limit.
No value was calculated because analytical values were below the reporting limit.
56

Table 14. --Statistical summary of orooerties and selecthe cedar swampand November 25
(well QWI:-1A) in McDonalds. 1986 through June 1. 1988
ted 1 dissolved constituents in shallow ground water atBranch basin. February 7. 1985 through February 24. 1986
[N, number of samples; S.D., standard deviation; °C. degrees Celsius; SC, specific conductance; /iS/cm, microsiemens per centimeter at 25 degrees Celsius; DO, dissolved oxygen; DOC, dissolved organic carbon; mg/L, milligrams per liter; ^g/L, micrograms per liter; --, not calculated 2 ; <, less than]
Property/const i tuent
Temperature (°C)
Field pH (units)
Field SC (/iS/cm)
DO (mg/L)
DOC (mg/L)
Calcium (mg/L)
Magnesium (mg/L)
Sodium (mg/L)
Potassium (mg/L)
Aluminum (^g/L)
Iron (^g/L)
Manganese (^g/L)
Sulfate (mg/L)
Chloride (mg/L)
Silica (mg/L as SiOs)
February 1985 - February 1986 QWC-1A
N
10
10
10
10
10
10
10
10
10
10
10
10
10
10
10
Range
8.0-13.5
4.4-5.0
26-31
.6-3.7
.2-1.6
.66-1.0
.60-1.0
1.7-2.1
.20-. 40
120-160
<2-18
19-27
4.5-5.5
3.0-3.8
3.7-4.1
Mean
10.0
4.7
30
1.9
.8
.75
.72
1.8
.33
140
--
23
4.9
3.2
3.8
Median
10.0
4.8
30
1.5
.7
.70
.70
1.80
.34
140
6.5
23
4.8
3.2
3.8
S.D.
1.82
.18
1.43
1.14
.44
.10
.12
.14
.05
13.3
--
2.8
.27
.24
.15
N
10
10
10
9
10
10
10
10
10
10
10
10
10
10
10
November 1986 QWC-1A
Range
8.4-14.0
4.25-4.84
33-44
.9-8.8
.7-2.2
.78-1.2
.77-1.3
1.8-2.5
.25-. 52
80-230
2-19
25-41
5.5-10
3.0-3.8
3.7-5.2
Mean
10.5
4.65
38
3.2
1.1
.95
.95
2.05
.40
177
8.6
33
7.1
3.4
4.2
- June 1988
Median
10.6
4.72
37
1.9
1.0
.93
.92
2.00
.40
185
7.5
34
6.7
3.3
4.1
S.D.
1.93
1.83
3.98
2.96
.44
.15
.18
.23
.08
49.6
5.15
5.93
1.53
.25
.45
1 Alkalinity, ammonium, nitrate, and phosphate are not included in the summary because analytical values commonly were less than the minimum reporting limit.
2 No value was calculated because analytical values were below the reporting limit.
57

Differences in water quality among the four shallow wells are presented graphically in figure 12. Mean values of properties and concentrations of chemical constituents are plotted on the basis of data collected during the study period from November 1986 through June 1988. Data in this figure show that concentrations of sodium, potassium, and chloride tended to differ only slightly with location in the basin. Concentrations of calcium, magnesium, and sulfate also differed little; however, there was a consistent pattern in that the smallest mean concentration of all three of these constituents was found in water from the shallow hardwood -swamp well. Water from the shallow hardwood- swamp well also had the largest mean concentration of silica, a constituent that, in general, differed little among the four wells over time .
In contrast, pH, DO, DOC, aluminum, iron, and manganese tended to show much greater spatial variability within the basin. Water from the shallow upland wells (QWH-4A and QWO-3A) had similar mean concentrations of DO, DOC, iron, and manganese; however, the mean pH of water from well QWH-4A (4.77) was greater than the mean pH of water from well QWO-3A (4.35), and the mean concentration of aluminum was smaller (430 Mg/L at QWH-4A and 1,004 Mg/L at QWO-3A), probably as a result of decreased aluminum solubility at the higher pH.
With respect to the properties and constituents pH, DO, DOC, aluminum, iron, and manganese, water from the shallow hardwood- swamp well (QWH-1A) appeared to be distinct chemically from water collected at the two upland wells. Ground-water samples from well QWH-1A had considerably lower mean values of pH, smaller mean concentrations of DO and manganese, and much larger mean concentrations of DOC and iron, than water from the two upland wells. In general, ground water from the shallow hardwood- swamp well was chemically similar to surface water in the hardwood swamp. For example, mean pH of surface water and ground water during this study period was approximately 3.9, DOC concentration averaged 35 mg/L (milligrams per liter) in surface water and 31 mg/L in ground water, and aluminum concentration averaged 868 Mg/L in surface water and 1,085 Mg/L in ground water. Mean DO concentration was larger, however, in surface water (4.6 mg/L) than in ground water (0.7 mg/L), and the more reducing nature of the ground water was indicated by a larger mean concentration of iron in ground water (3,147
than in surface water (1,592 Mg/L).
Ground-water samples from the shallow cedar -swamp well (QWC-1A) had DO and manganese concentrations that were intermediate between the concentrations of these constituents in samples from the upland wells and the hardwood- swamp well. Samples from this well (QWC-lA) also had fairly high pH and relatively small concentrations of DOC, aluminum, and iron compared with samples from the shallow hardwood- swamp well.
In figures 13 and 14, variations in water level, field characteristics, properties, and chemical constituents with time are plotted for the two shallow upland wells (QWO-3A and QWH-4A) . At these wells, water levels varied cyclically from the fall of 1986 to the spring of 1988; the highest levels occurred in the late winter to early spring (March to May) and lowest levels in the late summer to early winter (September to January) . These variations in water levels agree with the observations of Rhodehamel (1979b, p. 152, fig. 4), who reported that lowest mean monthly water levels in an
58
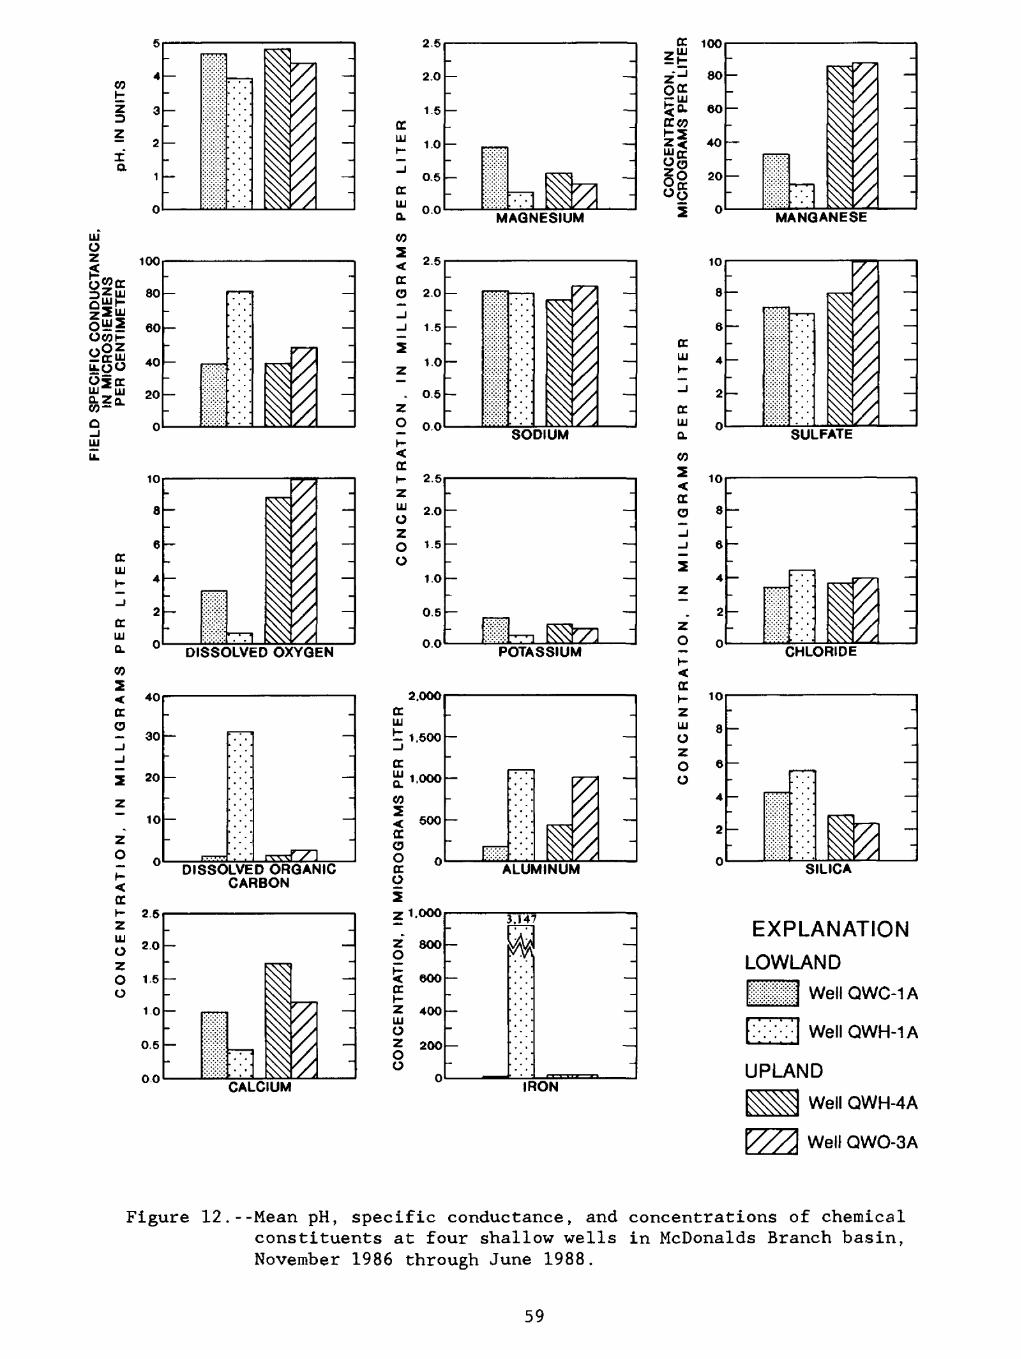
ifHI Oz
OWK
0_lHI
ou
6O
40
20
o
-
-
i1
'/'1.
-
-
CC HI
CC HI CL
CO
-
-
DISSOLVED OXYGEN
< 4Ucc o- 30
_J
i 20
Z
~ 10
z0 n
-
- :,,,...
-
: -
'. -
J r^ttDISSOLVED ORGANIC
CARBON
Z 111
2.5
2.0
O 15 O
1.0
0.5
00CALCIUM
2.5
2.0
1.5
1.0
0.5
0.0
^ 25
CC< } 2.0
_J-J 1.5
iz 10
. 0.5Z
o o.o
ccHI CL
m2
MAGNESIUM
mSODIUM
ALUMINUM
CCK 2.5
ZO 1.6
0
1.0
0.5
0.0
- -
-
_ _
it j_, ^vi POTASSIUM
z.uuuCC HI
t 1,500
CCIII nnr.
m< 500CCo
-
-
' f!m 1^
-
-
-
Z i,w\i
Z 8OOO
<C 600CCKZ 400HI0Z 200O0 o 1
3.147
v!.
_
.
_
~
"
\A -*
_'
_
~"
'
IRON
Z' 80QCC
g£ 60ccwZ< 40j"cc00 §0 20
10
8
e
4
2
0
ccHI
ccHI CL
m
MANGANESE
SULFATE
CONCENTRATION, IN MILLIGRA 3 N) * 00 CD O O W * Of CO C
-
1ICHLORIDE
-
i''/,
-
-
-
-
EXPLANATION
LOWLAND
WellQWC-1A
UPLAND
^^ Well QWH-4A
\///\ Well QWO-3A
Figure 12.--Mean pH, specific conductance, and concentrations of chemical constituents at four shallow wells in McDonalds Branch basin, November 1986 through June 1988.
59
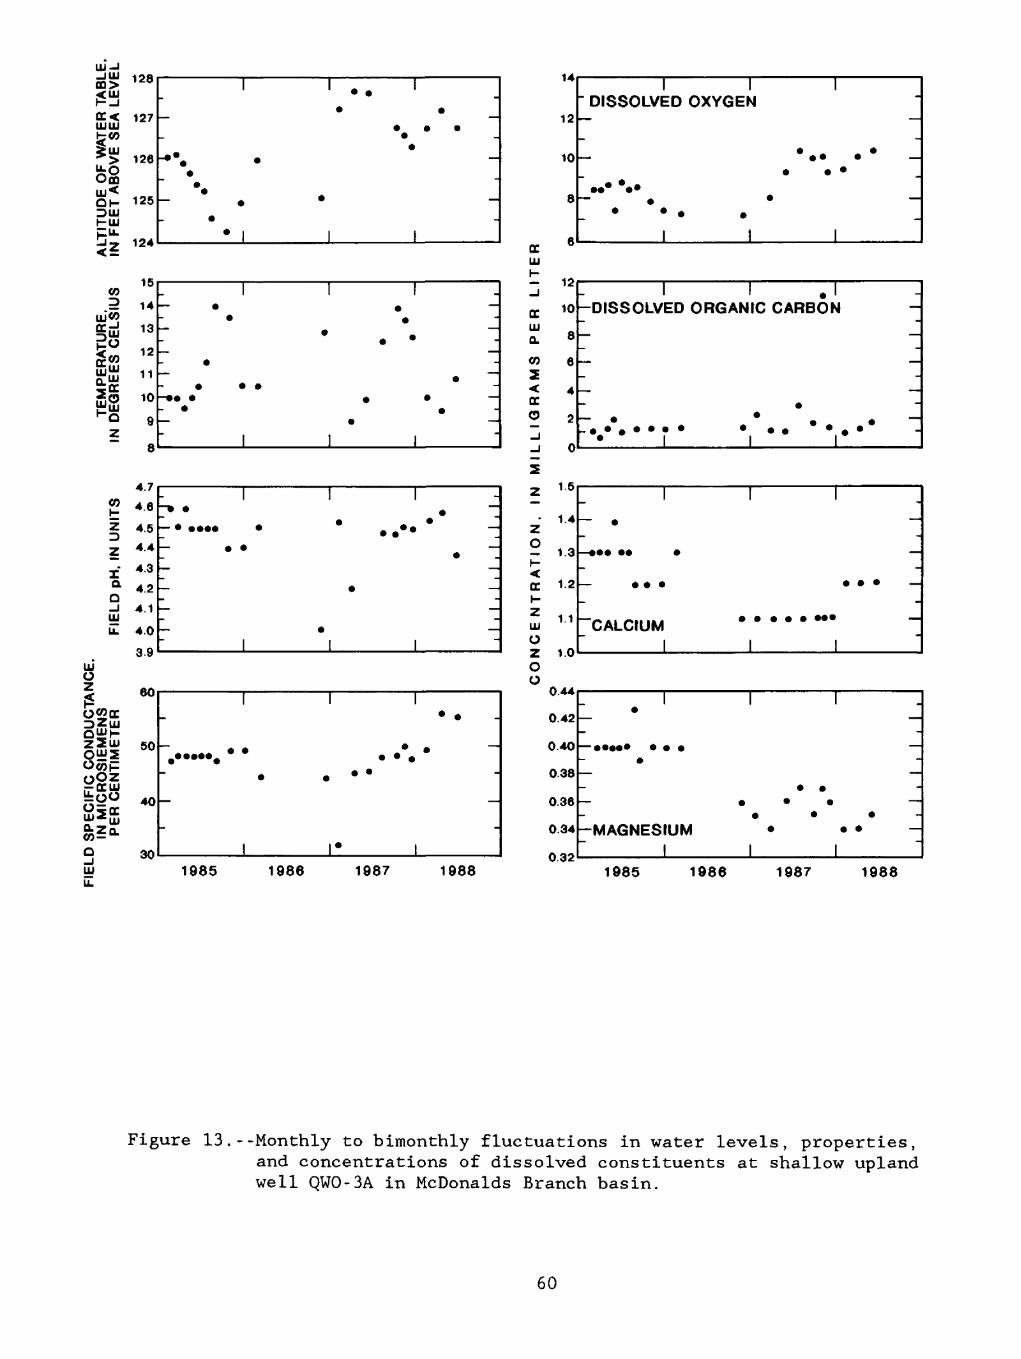
8
UJ-I -JUJffl>?liitr<ww
*>On
Ql-DWI-UJ
51V)D
DC-j
ofeQT CO^s~ DC
?sz
0}i-z
zIaoUJ
i*jZuj5uj|_ :Zuj? ?iOZ
EgS z£i
l^O
127
126
125
124
15
14
13
12
11
10
9
I I I*
_ * * _
* * *
" *
e
*
I I I
III.
0
r**.* * * ~- III"
trUJi-
ocUJa.tn s.<tro-j
8 _
s4.7
4.6
4.5
4.4
4.3
4.2
4.1
4.0
III-
_ -- »* ~
r . -:- _ - iii"
z
zoH
DCt-ZUJ
0
OO
60
50
40
30
i i i .
~ . . *
-i i* i
14
12
10
8
6
12
10
8
6
4
2
I 1 1' DISSOLVED OXYGEN
-
*
-
I
__
*.. * -
1 1
I I .1 -DISSOLVED ORGANIC CARBON
-
,
_
-
* I0
1.5
1.4
1.3
1.2
'
1
-... ..-
CALCIUM
11.0
0.44
0.42
0.40
0.38
0.36
0.34
n QO
1
-
-
~
.
. ,
1 1*
1 1, _ ,
.-
_
1 1
1 1
e _-
. * *. -
-MAGNESIUM -
1 1 11985 1986 1987 1988 1985 1986 1987 1988
Figure 13.--Monthly to bimonthly fluctuations in water levels, properties, and concentrations of dissolved constituents at shallow upland well QWO-3A in McDonalds Branch basin.
60

CO
NC
EN
TR
AT
ION
, IN
M
ICR
OG
RA
MS
PE
R
LIT
ER
CO
NC
EN
TR
AT
ION
, IN
MIL
LIG
RA
MS
PE
R L
ITE
R^
05
^
o
"
"n>
p
O
O
OH
* co
oe
to
to
-»r*>
o^oi<
5o5Q
Q
-»
ro
ro
^
.
. O
g O
O
l O
O
.O
OO
OO
OO
OO
OO
M
flt>
O
fc
flt>
O
*
OS
C
t-i (D
-
(Di _
> oo
. i O O
-»3
<D
rt
»5
'
C CD a<D 00 (D
00
00
z
. >
. *
o
Z
-
m
m
9
,
«
....
1 ..
.. 1
.
, i
,
1 1
' 1
' 1
' l
'
^
1,
1 ,
1 ,
1 ,
|Z,
' ' '
J
' '
>
' ' .'
i-
^ . «.
"-.
.1.1
.1.
1 '.'
;
. §
.
co.
CO
c-
2
^
.. *
, I.I.
, |
, |
,
CO 0
o
C z
_
"-
. "
, I.I,
CO
NC
EN
TR
AT
ION
, IN
MIL
LIG
RA
MS
PE
R L
ITE
R
(id
^
Ol
flD
O
M
(
<D 00 Ol
(D 00 a> (D ao (D ao ao
'
' 's
.
F.
o
s
g
m
-
_ . /
9
1
1 1
' 1
' 1
'C r
3^ m
* .
, *
_
'\
,1,1.1.

FIE
LD
SP
EC
IFIC
CO
ND
UC
TA
NC
E,
IN M
ICR
OS
IEM
EN
S
PE
R C
EN
TIM
ET
ER
FIE
LD
pH
, IN
UN
ITS
TE
MP
ER
AT
UR
E,
AL
TIT
UD
E O
F W
AT
ER
TA
BL
E,
IN
DE
GR
EE
S C
EL
SIU
S
IN F
EE
T A
BO
VE
SE
A L
EV
EL
(D t-'
£
O
XD
O
rt
>
rt
rt
O
p-
3rt
S
H
. o
S
o
3
O
3
rt
G
w ff
o
h->
30
V!
B)
H)
I-1
H)
O.
O.
I-1
w
p-
C
w
o
W
w
rt
i-!
o
C
ft)
i-1
ft)
3
<
rt
O
(D
p-
y p
. o
3
cr
r>
wft)
O
(n
3 p-
p-
(n
33
rt
p-
s;
rt
ft)
C
rt(D
(D
3
i-!
rt
(n
P> (Dft)
<!
(n
(n3-.
ft) O
O
s: T) (D
C
I-!
t3
rt
M p
- ft)
o>
3
w
O--
CO
00 01 CO 00 0> _k CO 00 ->l -Jt
CO 00 00
C N
-Jt
CO at 01 CO
00 0> ^ CO 00 CO 00 00
3 §
§ S
81
1 '.
1 '
1 '
_
0
_ .
,1,1
,1
,
> o
o
o
-
> *
<«
oo
6
N1
1 ^
1 1
1 ,
1 ,
*
y
-I
- .
i.
_
_
» »_
,1,1
,1,1
,
> C
CO
> Ck
**»*U
lO
!C
.
nco
^ic
oco
b-r.
' 1
' J
' 1
' 1
' 1
' 1
'
.
.
~
,1
,1
,1
,1
,1
,1
,
NC
EN
T R
AT
ION
, Ih
) M
^
00
CD
6
M
*
1 |
, |
, |
, |
, |
, |
,
- /«
-
.
_
_
_
~
*
~
, 1
, 1
I 1
, 1
, 1
, 1
,
n >
0
J M
l
> e0
O
M
CO
^
C
1 i
' i ;
i
' i
' i
'"\
~
,1,1
,1,1
,1,
LLIG
RA
MS
P
ER
L
) -
M
C.
1 1
' 1
' E*
. .
co
o S-
0 O o
0
o
^ ^ CD
o
z
,1
,1
,
» t
ITE
> <3
M
M
M
M
CO
0.
1 00
xj
00
CD
O
^
' 1
' 1
' 1.'
1 '
1 '
0.»
,1
,1
,1
,1
,1
,
R D
x|
0»
<D
O
-
, |
, |
1 |
' |
1
E
co
':
§ S-
o O X ^
0
m
-f 9
_
"
,1,1
,1,1
,
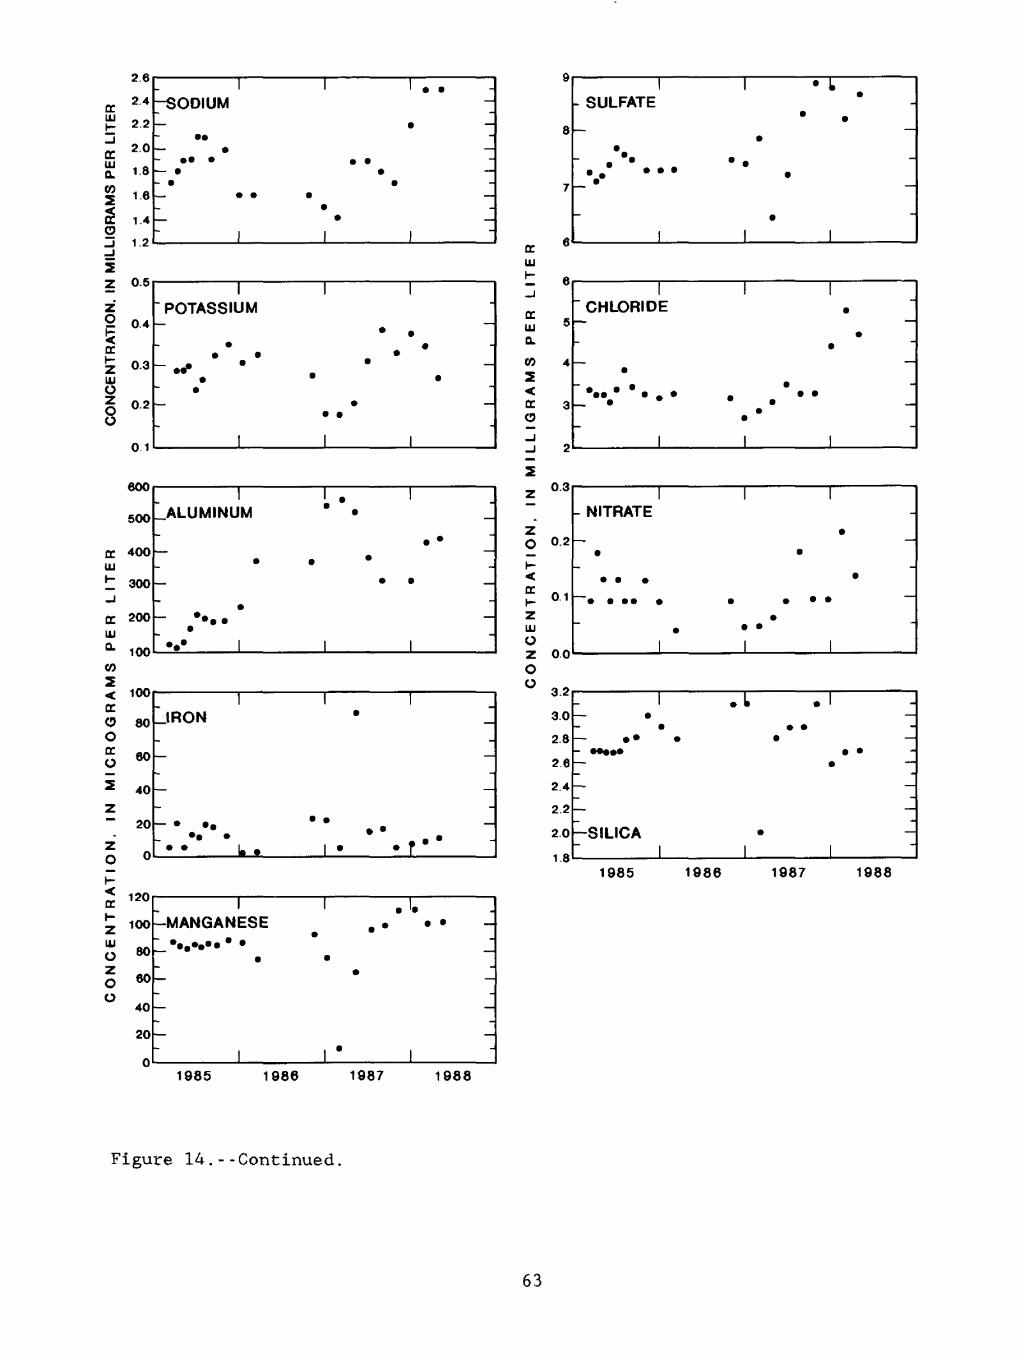
CO
NC
EN
TR
AT
ION
, IN
M
ICR
OG
RA
MS
P
ER
L
ITE
RC
ON
CE
NT
RA
TIO
N,
IN M
ILL
IGR
AM
S P
ER
LIT
ER
Oq
ro
*
a
o»
O
ro
ro
*
a
oo
o
000008
P
P
P
P
P
T'ri
ri:*
rO
fOfO
r0
C
ooooooo
oo
oo
oo
oooooo
->
ro
co
*
en
ro*<
BG
ooro*a<
t"i
l_>
CD
£-
00
. 01
1 1 o 0 a rt
asr-
» 00
3
oo
<t>
CO oo CO oo oo
, 1
1 1
, 1
1 1
, 1
I
z
m
CO m
"
-"
"-.~ ,1
,1,1
.1,1
,
1 1
1 1
I 1
1 1
1
.
55 0 z
r
m -
."" .
""\ ,
1 i
1 ,
1 i
1 i
,,,,,,,,, |
Z
-."
B
, 1
1 1
1 1
, 1
,
CO
. »
~"
c
^
*
".
.
.
, 1
,1
,1
,
1 i '
i '
i '
i '
i '
i '
CO o
:« i
^
"
."
1 1 , i
, 1 1 1
, i , i
,
CO
NC
EN
TR
AT
ION
, IN
M
ILLIG
RA
MS
P
ER
L
ITE
R
-iro
ro
ro
ro
ro
co
co
o
O
O
OGO
o
ro
*
CD
GO
o
ro
o
*
ro
co
ro
co
*
01
CD
cb
H
oo
<£
CO oo Ol
CO oo 00 CO oo CO oo oo
' I
' 1
' 1
' 1
' 1
' 1
'
-
$F
J
o
* ."-
_
.
.
,1,1
,1,1
,1,1
.
'I'l
1
2
!
33
. !
-
, i.i,
1 1
1 I'l'
£"
)
-.
g
30 5_
- .
'
.
,1,1,1,
i 1^
1 |
. F
n
>
m_
-
i l
i 1
,

upland well in the Pinelands occurred in the fall and winter and highest mean monthly water levels occurred during March through June. Overall, the water levels appeared to reflect precipitation rates, coupled with increased evapotranspiration rates during the summer.
During 1985, the pattern of water levels was altered by the drought conditions that lasted through the spring and summer and were followed by Hurricane Gloria, which deposited approximately 3.5 in. of rain to the basin during 2 days at the end of September. From January through September, water levels decreased steadily--no spring peak occurred despite fluctuations in monthly precipitation to the basin. During this time, most precipitation to the basin probably was lost through evapotranspiration in the unsaturated zone and did not penetrate to recharge the aquifer. Following Hurricane Gloria, water levels increased from October at least until ground-water sampling was discontinued in February 1986.
As shown in figures 13 and 14, ground-water temperature at upland shallow wells (QWO-3A and QWH-4A) peaked during the summers and was lowest during the winters in the study periods (January 1985 through February 1986 and November 1986 through June 1988). Variations in other properties and constituent concentrations were not as straightforward as variations in temperature (figs. 13 and 14). To some extent, these variations might be related to differences in hydrology between drought and nondrought conditions; specifically, to the relative quantity of input from the soil zone to the shallow aquifer. For example, concentrations of chloride appeared to be negatively correlated with water level during drought conditions, but chloride did not appear to be correlated with water level during nondrought conditions (tables 15 and 16). During drought conditions, the increase in chloride concentrations with decreasing water level might have been caused by increased evaporative concentration of chloride. During nondrought conditions, chloride concentrations in ground water might also have been affected by variations in chloride concentrations in wet and dry deposition to the basin, which would pass through soils and eventually into the aquifer.
Temporal variations in aluminum concentrations also differed during drought and nondrought conditions. Data collected during the fall of 1986 through the spring of 1987 indicate that concentrations of aluminum can be elevated in the late winter to the spring, but the data from 1985 do not show this spring peak. Correlation coefficients for concentrations of aluminum as a function of water level were positive and statistically significant at the 97.5 percent level at these wells during nondrought conditions, but negative and statistically significant at the 97.5 percent level at well QWH-4A and nonsignificant at well QWO-3A during the 1985 drought (tables 15 and 16). The processes controlling concentrations of aluminum, therefore, appeared to be different during drought compared with nondrought conditions. During drought conditions, the negative correlation of aluminum with water level at well QWH-4A might have resulted from evaporative concentration of aluminum in ground water. However, during nondrought conditions, aluminum concentrations in ground water might have been controlled by the volume of water passing through the soil zone, because the soil zone contains a pool of exchangeable aluminum.
64

Table 15.--Correletion of properties and chemical constituents with water level at upland well QWO-3A in McDonalds Branch basin
[ T, temperature; SC, specific conductance; DO, dissolved oxygen; DOC, dissolved organic carbon;
su(Speermansignificant at the 0.05 level]
T, temperature; su, specific conductance; DO, dissolved oxygen; DDL, dissolved organic caroon; 3. calcium; Mg. magnesium; Na, sodium; K, potassium; Al. aluminum: Fe, iron; Mn, manganese; SO/, Jifate; Cl, chloride; f, fluoride; NOi, nitrete; PO/, phosphate; Si, silica; N, sample number; P, peerman's correlation coefficient; p, probability level; --, indicates correlations not
T pH SC DO DOC Ca Mg Na K Al Fe Mn S04 Cl F NOj P04 Si
Drought conditions. February 4. 1985 through February 21. 1986
N777777777777777777
P -.929 -.386 -.216 -.800 .054 .267 -.134 -.359 -.414 .296 .288 .382 -.020 -.847 -.060 .144 .289 -.478
p .005 - .025 -- -- -- -- -- -- -- -- .025 --
Nondrought Conditions. November 25. 1986 through June 1. 1988
N 13 13 13 11 13 13 13 13 13 12 13 13 13 13 13 13 13 13
P -.302 .582 -.533 .254 -.636 -.408 -.757 -.036 .034 .755 -.167 -.636 -.088 -.195 -.028 .240 -.400 -.477
p -- .025 .050 -- .025 -- .005 -- -- .005 -- .025 --
65
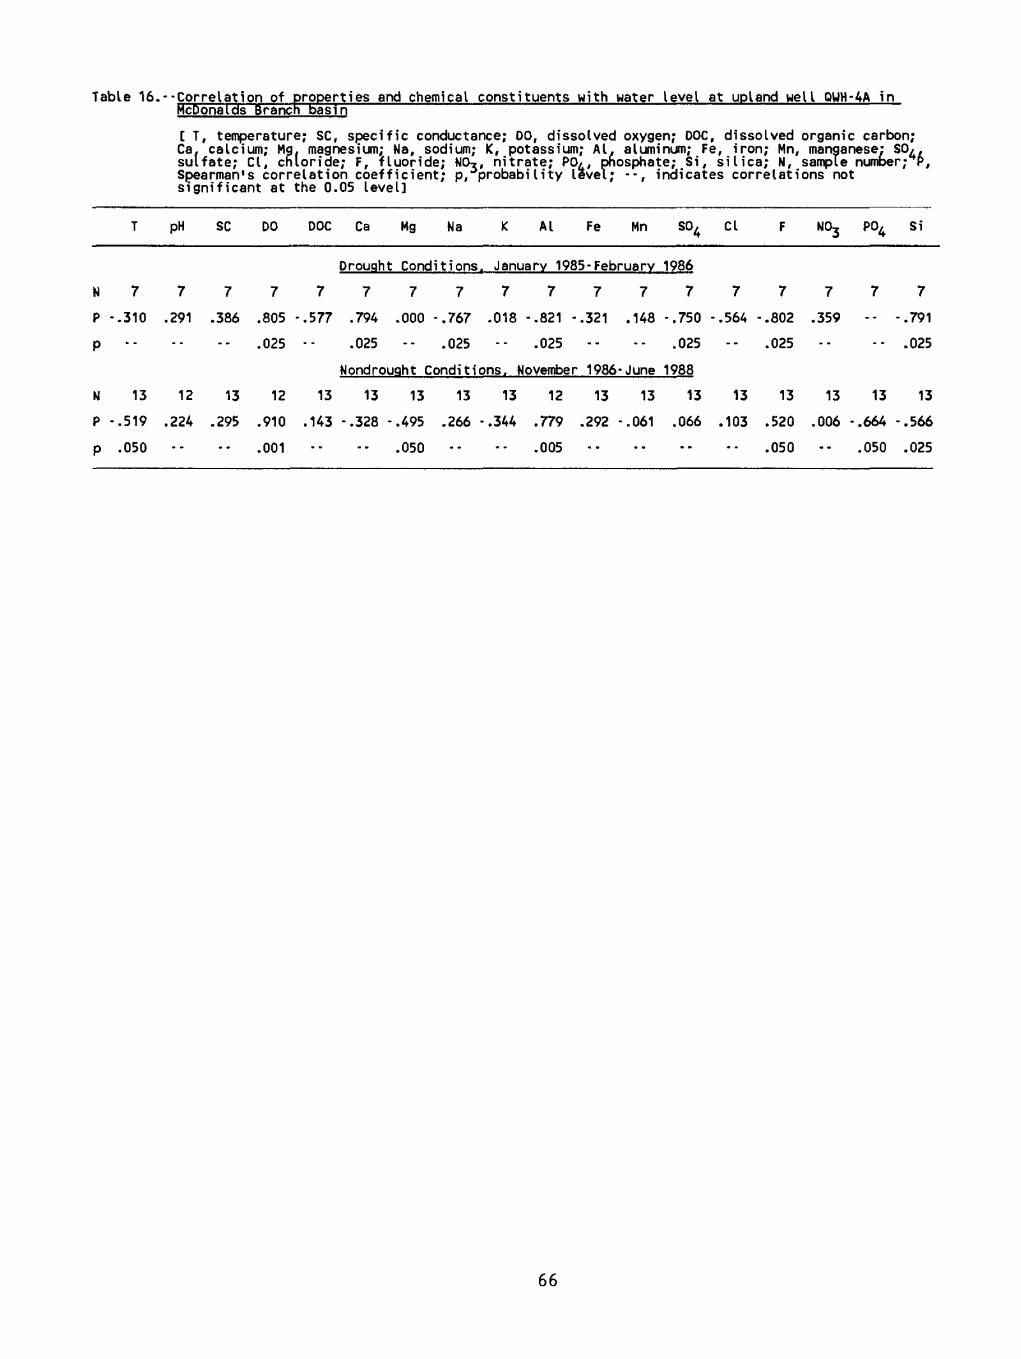
Table 16. Correlation of properties and chemical constituents with water level at upland well QWH-4A in McDonalds Branch basin
[ T, temperature; SC, specific conductance; DO, dissolved oxygen; DOC, dissolved organic carbon; Ca. calcium; Mg. magnesium; Na, sodium; K, potassium; Al, aluminum; Fe, iron; Mn, manganese; SO/, sulfate; Cl, chloride; f, fluoride; NOT, nitrate; PO/, phosphate; Si, silica; N, sample number; P, Spearman's correlation coefficient; p, probability level; -, indicates correlations not significant at the 0.05 level]
T pH SC DO DOC Ca Mg Na K Al Fe Mn SO^ Cl f NOj P04 Si
Drought Conditions. January 1985-February 1986
N777777777777777777
P -.310 .291 .386 .805 -.577 .794 .000 -.767 .018 -.821 -.321 .148 -.750 -.564 -.802 .359 -- -.791
p -- -- -- .025 -- .025 -- .025 -- .025 -- -- .025 -- .025 -- -- .025
Nondrouaht Conditions. November 1986-June 1988
N 13 12 13 12 13 13 13 13 13 12 13 13 13 13 13 13 13 13
P -.519 .224 .295 .910 .143 -.328 -.495 .266 -.344 .779 .292 -.061 .066 .103 .520 .006 -.664 -.566
p .050 -- .001 -- - .050 - .005 -- -- -- .050 -- .050 .025
66

Other properties and constituents show equally complex variations (figs. 13 and 14 and tables 15 and 16). This chemical complexity indicates that a number of processes may be involved in controlling values of properties and concentrations of chemical constituents in shallow ground water, and that these processes may differ in space and time. Any further study of hydrological, geochemical, or biological processes that control shallow ground-water chemistry in the Pinelands, therefore, needs to take possible changes over time and space into consideration.
HYDROGEOCHEMICAL PROCESSES
Retention and Release of Chemical Constituents
Likens and others (1977) demonstrated that input-output budgets of chemical constituents can provide valuable information on the cycling of chemical constituents within a forested ecosystem, as well as insight into potential geochemical or biochemical processes that may occur within the ecosystem. These authors chose HBEF as a study site because an "impermeable" basement theoretically precluded ground-water recharge or discharge. Therefore, chemical inputs were assumed to be limited to precipitation and chemical outputs were assumed to be limited to streamflow. The location of McDonalds Branch basin in a ground-water-recharge area makes the calculation of chemical input-output budgets a difficult task, because the output of chemical constituents in ground water cannot be quantified easily. However, qualitative information on uptake and release of constituents within the basin can be obtained with the use of ion ratios. Ion ratios to chloride have been used by a number of authors (for example, Stallard and Edmond, 1981) to identify possible chemical processes occurring within watersheds, because chloride appears to be a conservative ion in areas where evaporite minerals are sparse or lacking (Feth, 1981).
Comparison of mean concentrations of chloride in surface waters and ground waters, as presented in table 17, indicates that chloride probably is conservative at McDonalds Branch, because the concentrations of chloride are similar at all of the sites. Additional evidence for conservative behavior of chloride in the Pinelands was provided by Yuretich and others (1981), who found that precipitation input of chloride was equal to output in rivers on the basis of sampling done in 1971-72 in a number of basins in the Pinelands.
In table 17, weight ratios of ions to chloride ion in bulk precipitation are compared with weight ratios of ions to chloride ion (and equivalent ratios for hydrogen ion to chloride ion) in surface water at the hardwood swamp and the cedar swamp and ground water at wells QWH-lA, QWH-4A, QWO-3A, and QWC-lA (locations in fig. 2) for a study year from November 25, 1986, through November 24, 1987. The ratios for precipitation are based on mean volume-weighted concentrations, but the surface-water and ground-water concentrations were not volume-weighted because of inherent difficulties. For example, discharge was not measured in the hardwood swamp, and stream- stage measurements could not be made during periods of low flow. The ion ratios in surface water at the cedar swamp do not include most samples from the summer because samples collected during the summer tended to have large cation-anion imbalances.
67

Table 17.--Ratios of ions to chloride Ion in surface water and ground water at McDonalds Branch basin and ratios in bulk precipitation. November Z5. 1986 through November Z4. 1987
Surface water Ground water
Ion
Hydrogen*Dissolvedorganiccarbon
CalciumMagnesiumSodiumPotassiumAmmoniumAluminumIronManganeseSilicaSulfate*****ChlorideNitratePhosphate
Bulk precip itation
3.03
. .****
.30
.10
.68
.13
.49
. . ****
. . ****
. . ****
. . ****
4.131.002.75.35**
Cedar swamp
Site S-10
1.11
2.40.17.13.50.06. . ***
.08
.05
. . ****
.983.031.00. . ***. . ***
Hardwood swamp
Site S-1
1.25
8.75.10.07.52.03.02.30.48.004
1.022.041.00. _***. . ***
In- stream wells Cedar swamp Hardwood swamp Site QWC-1A Site QWH-1A
0.29
.32
.30
.30
.63
.12
.005**
.09
.001
.0021.292.231.00.04. . ***
0.75
7.61.10.06.44.03.06.30.70.003
1.151.471.00
. . ***
.010
Upland
Site QUH-4A
0.22
.38
.50
.15
.54
.09.003**
.14
.009
.025
.902.441.00.03. . ***
wells
Site QUO-3A
0.45
.80
.31
.10
.55
.05
.003**
.28
.006
.025
.662.761.00.09**. . ***
Mean chloride concentration .63 3.67 3.93 3.41 4.43 3.14 3.60
* Ratio of equivalents used rather than ratio of weights.** 1 to 3 values below reporting limit of 0.003 mg/L. Value of 0.003 used in these instances.
*** Most values below reporting limit.**** Constituent generally not analyzed at this site.***** Sulfate/chloride ratio f9r surface water in the cedar swamp may be incorrectly high;
see previous discussion in quality assurance section, above.
68

Caution needs to be exercised in interpreting the ion ratios because they are based on data for a single year and may not be representative of long-term relations in the basin. Additionally, the ratios reflect changes that might occur anywhere along the hydrologic flow path leading from precipitation to the sampling site; for example, ground-water ratios would reflect chemical changes within the canopy, the forest floor, the mineral soil horizons, and the shallow aquifer over varying periods of time.
Comparison of ion ratios in surface-water and shallow ground-water sites with the ratios in precipitation indicates that substantial accumulation of hydrogen ion, potassium, ammonium, sulfate, and nitrate occurred in the basin during the study year, and that sodium also accumulated, but to a lesser extent. Substantial accumulation of calcium and magnesium occurred in some areas but substantial release occurred in others. The variability in calcium:chloride and magnesium:chloride ratios emphasizes the importance of ground-water sampling to the understanding of chemical cycling. Analysis of surface-water chemistry at the cedar swamp would indicate a net substantial retention of calcium and a slight release of magnesium within the basin, but ground-water outflow from the basin might reverse these relations. Precipitation was not analyzed for DOC, aluminum, iron, manganese, and silica; however, concentrations of these constituents in precipitation probably are small. Turner (1983) monitored aluminum, iron, and manganese concentrations in bulk precipitation at McDonalds Branch basin from November 1979 to January 1982 and reported mean concentrations of 0.012 mg/L for aluminum, 0.023 mg/L for iron, and 0.006 mg/L for manganese. DOC, aluminum, iron, manganese, and silica in surface water and ground water appear to be released within the basin.
Accumulation of calcium, magnesium, sodium, potassium, nitrogen (deposited as ammonium and nitrate), and phosphorus (deposited as phosphate) probably is largely a result of uptake of these nutrients by plants within the basin. As demonstrated by Wang (1984), the highly weathered, quartz- dominated soils in the basin provide few weatherable nutrients, so that wet and dry deposition are relatively important sources of nutrients to the ecosystem. The relatively high calcium:chloride and magnesium:chloride ratios in some surface water and ground water in the basin indicate that calcium and magnesium are released by weathering in quantities great enough that input through deposition and weathering exceed uptake by plants in some parts of the basin.
Sulfate accumulation may be due to several processes. Spratt and others (1987) demonstrated that seasonal sulfate reduction was an important sink for sulfate in the cedar swamp at McDonalds Branch basin. The low sulfate:chloride ratio in surface water at the hardwood swamp indicates that sulfate reduction may be occurring within the hardwood swamp, as well. The low sulfate:chloride ratios in upland shallow ground water (sites QWH-4A and QWO-3A) indicates that other processes, such as uptake by plants, also may be contributing to the retention of sulfate. Likens and others (1977) reported that approximately 10 percent of the sulfur added to the ecosystem in wet or dry deposition or released by weathering at the HBEF was stored by living or dead biomass within the system. According to Van Breemen and others (1983), sulfate adsorption on hydrous oxides of aluminum and iron may be an important mechanism for removal of dissolved sulfate and hydrogen ion at pH values less than 5. The low pH of surface water and ground water in
69

the basin and the presence of iron-hydroxide cements indicates that such sulfate adsorption could occur at some locations within the basin.
Numerous processes can serve as sources and sinks for hydrogen ions in forested ecosystems; an excellent review of these processes is provided by Van Breemen and others (1983). In general, the complexity of the hydrogen cycle in a forested ecosystem makes evaluation of the relative roles of hydrogen-releasing and accumulating processes a difficult task. At McDonalds Branch basin, there appears to be substantial accumulation of hydrogen-ion throughout the system; however, this accumulation probably is the net result of a variety of hydrogen-releasing and hydrogen-accumulating processes. Potential mechanisms for retention of hydrogen ion include sulfate reduction to hydrogen sulfide (H^S) or pyrite (FeS ? ), weathering of clay minerals, sulfate adsorption, exchange with metal ions in soils, reduction of iron hydroxides, denitrification, decomplexation of metal ions on organic ligands, and protonation of organic anions. Potential mechanisms for hydrogen-ion release include dissociation of organic acids, uptake of cations by plants, complexation of metal ions by organic ligands, and oxidation of hydrogen sulfide and ferrous iron. Additionally, Sphagnum mosses and peat, which are present in the basin, can take up metal ions from solution and release hydrogen ion.
Concentrations of the trace elements aluminum, iron, and manganese in surface water and ground water in the basin are derived from soils and geologic materials; input as wet and dry deposition probably is minimal. The transport of these trace elements as organic or inorganic forms is discussed in detail in the following section.
Transport of Trace Elements
Concentrations of dissolved aluminum, iron, and manganese correlate well with DOC in surface water from sampling sites in the cedar swamp (fig. 15 and table 18). In previous studies at McDonalds Branch basin, Turner (1983) reported a correlation between aluminum and dissolved organic matter in surface water at the cedar swamp, and Swanson and Johnson (1980) reported a correlation between iron and dissolved organic matter. Crerar and others (1981) studied surface-water chemistry at several locations in the Pinelands. On the basis of results of gel-filtration-chromatography analysis, these authors determined that from 10 to 70 percent of total dissolved iron in the less than 0.2- urn fraction was associated with DOC, "presumably as organo-metallic complexes" (Crerar and others, 1981, p. 23). Beck and others (1974, p. 358) reported that aluminum and iron correlated well with dissolved organic matter in several low-ionic-strength, organic- rich rivers in the Coastal Plain of southeastern Georgia, and they suggested that some of the metal-organic association appeared to be colloidal, whereas "appreciable amounts of dissolved organic complexes are also present."
Although aluminum, iron, and manganese correlate well with DOC in surface water at the cedar swamp, these trace elements do not appear to correlate well with DOC in surface water from elsewhere in the basin, or in ground water (table 18). Additionally, the ion ratios of these trace elements to chloride (table 17) tend to be lower in surface water at the cedar swamp than at the hardwood swamp or in most ground waters, indicating that a large part of the trace elements that are mobilized in the basin
70

QC111
mQC111CLCO2QCCD
-1
IZy1
O
QCKZ111OZooZomQC
goZ
CDQCOQLLI>
OCOCOQ
it
^2
10
8
6
4
2
0c
14
12
10
8
6
4
2
0(
14
12
10
8
4
2
n
i i i i i i i i i _
- -" "" ~
9 - -
* .
-! * -
~~ili l i i i i iii
) 100 200 300 400 500 6(ALUMINUM CONCENTRATION,IN MICROGRAMS PER LITER
i i i i i
: :-.
_
* * 9
* " ***. *
_ i i i i) 100 200 3(
IRON CONCENTRATION,IN MICROGRAMS PER LITER
-
~-
_9
9
-
: ~i i L « . « _
t i , i i
)0
DO
10 20MANGANESE CONCENTRATION,
IN MICROGRAMS PER LITER
30
Figure 15.--Relation of concentration of dissolved organic carbon toconcentrations of aluminum, iron, and manganese in surface water at the McDonalds Branch cedar swamp, April 1984 through June 1988.
71

become immobilized before water leaves the basin as surface-water runoff in the cedar swamp. Whether large concentrations of trace elements are leaving the basin in ground-water recharge to the deeper system is not known for certain. The higher pH of deep ground water would be expected to contribute to the immobilizing of trace elements. However, during the 1985 study at McDonalds Branch basin, Lord and others (1990) determined that up to 1,200 ;ug/L aluminum and 2,700 ;ug/L iron were present in the deepest ground water sampled (approximately 20 feet below elevation of the water table) at some sites even though concentrations of trace elements generally decreased with depth in ground water. Further study of concentrations of trace elements in deeper ground water beneath McDonalds Branch basin, therefore, is warranted.
Table 18.--Spearman correlation coefficients for trace elements aluminum, iron, and manganese compared withdissolved organic carbon in surface water and shallow ground water at McDonalds Branch basin, based on analyses of samples collected from April 1984 through June 1988
[N, number of samples; P, Spearman correlation coefficient; p, probability level; -, represents coefficients not significant at the 0.05 level]
Surface water Shallow ground water
Cedar swamp
N P p
Aluminum Iron Manganese
36 0.89 36 .78 29 .78
0.001 .001 .001
Hardwood
N P
28 0.30 28 .62 28 -.51
swamp
P
.001
.005
QUH-1A
N
19 19 19
P p
0.32 -- -.29 --.02 --
QUH-4A
N P
20 0.44 20 .12 20 .28
P
0.050
QWO-3A
N
19 20 20
P p
-0.30 -- .28 -- .00 --
QWC-1A
N P
20 0.16 20 -.27 20 .48
P
.025
Large concentrations of dissolved aluminum in some surface water and ground water in the basin may be of environmental concern, because aluminum in its ionic form has been shown to be extremely toxic to fish at concentrations as small as 200 ;ug/L (Schofield and Trojnar, 1980; Driscoll and others, 1980). Additionally, Ulrich and others (1980) reported that large concentrations of aluminum in soil solution may adversely affect tree growth. The toxicity of aluminum probably is determined by the speciation; aluminum bound to organic ligands or to fluoride potentially is less toxic than free aluminum. In order to assess the potential toxicity of aluminum, the distribution of aluminum into inorganic and organic, total and monomeric forms was determined on the basis of a special sampling round in October 1987. Results of this sampling are presented in Appendix D and are summarized graphically in figure 16.
The aluminum-fractionation results are only estimates at this time because of a number of factors. Sample replicates appeared to be in good agreement with each other; however, several of the ground-water samples had slightly larger concentrations of monomeric aluminum than concentrations of total aluminum. The reason for this discrepancy is not understood at this time. Additionally, concentrations of aluminum in various fractions may not be representative of concentrations of aluminum in ground water throughout the basin because the ground-water sites sampled in October 1987 were chosen on the basis of prior indications that they contained large concentrations of aluminum.
72

TOTAL MONOMERIC ALUMINUM TOTAL ALUMINUM
CEUJ
a.UJaCO2 < CE O
0.8
08
04
0.2
SURFACE WATER SURFACE WATER
Z UJ OzO O
Z
i
00
1.2
1.0
08
08
04
02
0.0
\\\
(Values below
reporting limit)
HARDWOOD OPEN CHANNEL CEDAR SWAMP SWAMP
ATSION SOIL WATER
O HORIZON E HORIZON B HORIZON
GROUND WATER
CE UJ
CO2
CE O
2
Z
Z O
Z UJOZ O O
Z
i
u.o
06
04
02
n n
-
-
-
-
-
-
l^^^l
1.2
1.0
0.8
0.8
0.4
0.2
00
HARDWOOD OPEN CHANNEL CEDAR SWAMP SWAMP
ATSION SOIL WATER
o HORIZON E HORIZON B HORIZON
GROUND WATER
QWO-2A QWO-2B QWO-3A QWH-8A QWO-2A QWO-2B QWO-3A QWH-8A
EXPLANATION
LABILE (INORGANIC) MONOMERIC ALUMINUM (MIAL)
NONLABILE MONOMERIC ALUMINUM (MOAL)
TOTAL INORGANIC ALUMINUM (TIAL)
TOTAL ORGANIC ALUMINUM (TOAD
Figure 16.--Concentrations of monomeric and total organic and inorganic aluminum in surface, soil, and ground water at McDonalds Branch basin, October 1987.
73

Surface water was sampled in the hardwood swamp (site S-l) and the cedar swamp (site S-10), as well as in the intervening open-channel area (site S- 5); the locations are in fig. 2. Results of sample fractionation indicated that the total reactive aluminum concentration (TAL) was approximately 0.30 mg/L in the hardwood swamp; approximately one-third of this aluminum was present as MIAL (inorganic monomeric forms), one-third as MOAL (organic monomeric forms), and one-third as TAL-MAL (colloidal polymeric aluminum or strong alumino-organic complexes). Concentration of TAL in surface water from the open-channel area was approximately 0.60 mg/L and was divided approximately equally into the same three fractions. TAL concentrations in the cedar-swamp sample, however, was only 0.10 mg/L, and all of the aluminum appeared to be present as colloidal polymeric aluminum or strong alumino- organic complexes. The results of the aluminum-fractionation studies, therefore, agree well with the results of correlations with DOC (table 17)-- aluminum correlates well with DOC at the cedar swamp but only weakly with DOC at the hardwood swamp. Surface water was not sampled routinely in the open channel in 1987, so a correlation coefficient could not be calculated for the open-channel site. The contrast in dissolved MIAL at the hardwood swamp and the cedar swamp may be related to differences in pH. During the October 1987 sampling period, the pH of surface water at the hardwood swamp was 4.13, and the pH of surface water at the cedar swamp was 4.35 (see Appendix G).
The TAL concentration in water from the shallow upland well, QWO-3A, ranged from approximately 0.80 to 1.00 mg/L; most of the aluminum appeared to be present as MIAL. This result agrees well with correlation analysis-- there was a weak negative correlation between aluminum and DOC at this site. In contrast, TAL concentration in water from shallow well QWH-8A, which is located in a swampy area near the hardwood swamp, was approximately 1.10 mg/L; more than two-thirds of the aluminum was present as MOAL, the remainder as MIAL. Approximately 1.60 mg/L TAL was present in water from well QWO-2A, a shallow well located near the open channel; approximately one-half was present as MIAL and one-third as colloidal polymeric or strong alumino-organic complexes. Minor amounts of inorganic forms also were present. In contrast, ground water at a deeper well (QWO-2B) located at the same site contained approximately 1.00 mg/L TAL, all of which appeared to be present as inorganic monomeric forms. Ground water was not routinely sampled at sites QWH-8A, QWO-2A, and QWO-2B in 1987, so that correlations of aluminum with DOC were not calculated for these sites.
Soil solutions were sampled using zero-tension lysimeters installed in the 0, E, and Bh horizons of an Atsion soil. The Atsion soil series, consisting of poorly drained Aerie Haplaquods, tends to occupy lowland and wetland parts of the basin where the water table is at or near the land surface during winter and spring. The soil appeared to be saturated at the time of sampling. As shown in figure 16, concentrations of TAL increased with depth from 0.34 mg/L in the 0 horizon to 0.97 mg/L in the Bh horizon. The increase in concentration of TAL appeared to be caused solely by an increase in inorganic monomeric forms; concentration of TOAL, which includes organic monomeric and colloidal and strong alumino-organic complexes, remained constant at approximately 0.20 mg/L. Analysis of dissolved constituents in soil solution (Appendix H) from the E and Bh horizons indicated that the DOC concentration remained approximately constant, at 6.3 and 6.0 mg/L, respectively, and the sulfate concentration also remained
74

approximately constant, at 8.5 and 8.4 mg/L, respectively. Dissolved iron concentration was 680 Mg/L i-n the E horizon soil solution and 480 Mg/L in the Bh horizon soil solution. 0-horizon soil solution pH was 4.30; soil- solution pH of the E and Bh horizons was 4.45 and 4.49, respectively. Additional inorganic analysis could not be done on soil solution from the 0 horizon because of the small sample size. C-horizon soil solution was not sampled. Overall, the results of the soil-solution analyses show that aluminum was mobilized within the Atsion soils and that pore water derived from this soil series was a potential source of inorganic and organic aluminum to nearby surface waters in the hardwood swamp and open-channel areas. Unfortunately, upland soil solutions were not sampled because lysimeters located in upland regions generally did not produce adequate sample volumes.
In general, the results of aluminum fractionations demonstrated that some surface waters, soil waters, and ground waters have fairly large concentrations of inorganic monomeric aluminum. These large concentrations of inorganic monomeric aluminum could potentially be toxic to plant and aquatic life. Whether or not the aluminum is adversely affecting the biotic system at McDonalds Branch basin remains to be determined.
Variations in Surface-Water Chemistry Caused by Drought
The distributions of cations and anions in samples of bulk precipitation and upstream and downstream surface water are summarized in graphical form in figure 17; the samples were collected in March and October 1985 and March and October 1987. The graphs in figure 17 show the differences between spring and fall surface-water chemistry during a drought year (1985) and a year with average precipitation (1987). In this figure, ionic concentrations (in microequivalents per liter) are estimated from total concentrations of constituents; for example, all dissolved aluminum is oresumed to be present as the aluminum ion Al 3 . This method of ionic estimation may introduce error into the distribution diagrams because, for example, aluminum may be present not only as Al 3 but also as less highly charged species such as Al(OH) 2 . Organic-anion concentration is estimated as the difference between total cations and total anions, where cationic charge is in excess of anionic charge. Finally, iron is assumed to be present as Fe(II) in ground water and as Fe(III) in surface water. Madsen and others (1986) reported that most of the iron present in the McDonalds Branch stream is present as Fe(III). The assumption that virtually all iron is present as Fe(II) in ground water may be incorrect in some areas, if iron is organically bound.
Data in the graphs in figure 17 demonstrate the differences between surface-water chemistry at the upstream hardwood swamp and at the downstream cedar swamp, resulting from differences in ground-water/surface-water relations at the two parts of the basin. The hardwood swamp is located in an area that is underlain by impermeable muck and clay deposits and that receives water from direct precipitation on the stream channel, from intermittent tributaries draining upland bog areas, and from shallow subsurface stormflow. In contrast, the downstream cedar swamp receives discharge from a deeper part of the ground-water flow system. Variations in vegetation in the hardwood swamp and the cedar swamp also could account, in part, for the differences in surface-water chemistry between these two parts of the basin.
75

BULK PRECIPITATION 1985 AND 1987200
DC LU
DC LU 0.COI-zLU
DoLUODC O
z o
Z LU O Z Oo oz o
100 --
Spr 19
NH4
H
Cb
ing 85
N03
Cl
S04
Fall 1985
NH4
H
Cb
N03PI
Spr 19
NH4
H
Cb
ing 87
F
N0?
Cl
S04
Fall 1987
NH4
N03 . H Cl
Cb S 4
1,200
1,000
800
600
400
200
0
SURFACE WATER 1985
Spring
- Fe OA/ /Al
- H
- Cb
Cl
S04 H-AI+Fe
/
CbCl
SO4
Fe
Al
H
Cb
OA
Cl
S04
Fall
AI+Fe OA,l ' ' __ .
^ ClCb Q ~ SO4
HARDWOOD CEDAR HARDWOOD CEDAR SWAMP SWAMP SWAMP SWAMP
SURFACE WATER 1987I,£UU
1,000
800
600
400
200
r»
u
Spring Fall
.i Fe
_t
,_
/
Al
Cb
OA
Cl
SO4
FeAl- r.l
H Pa Al+F© Al Fe OA H /
Cb _. ci SO, pK*-*D / * *-*u 304
EXPLANATION
Cb Base cations Ca. Mg, Na. K
OA Organic anion
HARDWOOD SWAMP
CEDAR SWAMP
HARDWOOD SWAMP
CEDAR SWAMP
Figure 17.--Spring and fall distributions of cations and anions in bulk precipitation and in upstream (S-l, hardwood swamp) and downstream (S-10, cedar swamp) surface water during a drought year (1985) and a year with average precipitation (1987).
76

In 1985, drought conditions caused the water level in the stream channel to drop, so that the open-channel area between the hardwood swamp and the cedar swamp was dry or nearly dry from March 1985 through January 1986. The low-flow conditions in the open-channel area connecting the two swamps led to wide variability in surface-water chemistry between the swamps--that is, the chemistry of water at the upstream hardwood-swamp area indicated mostly contributions from soils and ground-water shallow processes, and chemistry of water at the downstream cedar-swamp area indicated mostly the contribu tion of deeper ground water to the stream channel. Upstream surface water6 had greater concentrations of organic anion, aluminum, and iron, and greater sulfate/chloride ratios than downstream surface water. Additionally, the ratio of hydrogen ion to base cations (calcium, magnesium, sodium, potassium) was considerably greater at the upstream site than at the downstream site.
The differences in surface-water chemistry at the two sites were far smaller during the normally wet year of 1987 compared to the dry year 1985. In 1987, the open-channel area was filled with water, and surface water at the cedar swamp (site S-10, station 01466500) site, therefore, was a combination of surface water flowing from upstream sources and ground-water discharge.
Surface-water samples from the hardwood-swamp area contained anomalously large concentrations of major constituents and trace elements in October 1985 and for at least a month thereafter. The large concentrations apparently were the result of the flushing of lowland soils and bog areas by Hurricane Gloria, a storm that moved up the Atlantic coastline and delivered heavy rainfall to the basin at the end of September. Prior to Hurricane Gloria, rainfall to the basin had been well below average for several months, causing both ground-water and surface-water levels to drop throughout the basin. As suggested in the sections on ground-water chemistry and hydrology, described previously, most of the precipitation deposited in the basin during the drought probably was removed by evapotranspiration within the soils, so that recharge to the aquifer was minimal. The rapid rates of evapotranspiration and the lack of flushing of soil waters would lead to an accumulation of atmospherically deposited materials in the soil zone. Additionally, dry-deposited materials would be expected to accumulate on ground and vegetation surfaces. The large concentrations of chloride in water from the hardwood swamp--8.1 mg/L--is indicative of the accumulation of constituents due to enhanced evaporative concentration and decreased flushing of soils and surfaces during the drought.
6 Generally site S-l was sampled, but in October 1985 this site was nearly dry. Therefore, a second site, S-2, located farther downstream within the hardwood swamp, was sampled. Surface-water chemistry at S-2 is a good approximation to chemistry of water at S-l, because surface water at the two sites was reported to have comparable chemistry during several 1985-86 sampling periods. See Lord and others, 1990.
77

Hydrogeochemical processes in the basin apparently differed between the drought year (1985) and the year of normal precipitation (1987), as shown by a comparison of equivalent-ion ratios to chloride in surface-water samples collected during the spring and fall of the 2 years (fig. 17 and table 19). In the spring of 1987, sulfate was the dominant anion in upstream and downstream surface water, whereas in the fall, concentrations of sulfate were greatly reduced and chloride was the dominant anion. Yet, bulk precipitation had a greater sulfate:chloride ratio during October than during March. (See figure 17.) This variability in the sulfate:chloride ratio in surface waters probably is related to seasonal variations in sulfate-reduction rates in the basin. Morgan and Good (1988) studied sulfate reduction in the cedar swamp at McDonalds Branch and determined that sulfate reduction was seasonal; minimum rates occurred in the winter and maximum rates occurred in the late summer to early fall. Sulfur compounds in peat included reduced inorganic species (for example, H 2 S, FeS, FeS 2 ), reduced organosulfur compounds, elemental sulfur, ester sulfates, and sulfate.
Table 19.--Ion ratios to chloride ion (based on concentrations in equivalents per liter) in precipitation and surface water in McDonalds Branch basin. March and October 1985 and March and October 1987
[Base cations are calcium, magnesium, sodium, potassium; --, indicates concentration below reporting limit]
Ion/ chloride rat i o
(equivalents)
Hydrogen Base cations Aluminum Iron Sulfate
Bulk Precipitation 1985 1987
March October March
1.19 2.31
2.72
4.68 1.33
3.67
0.49 2.33
1.12
October
4.70 2.30
4.48
Hardwood 1985
March October
1.57 1.10 1.55 1.33 .69 .73 .16 1.90
2.78 3.65
Surface swamp
1987 March October
3.25 0 .62
1.47 .63
2.51
.64
.75
.36
.70
.18
water Cedar swamp
1985 1987 March October March October
0.31 1.40 .04 .02 .78
0.33 1.74 .07 .06 .78
1.43 1.94 .36 .10
3.00
0.38 .93 .84 .06 .46
In 1985, the relation between spring and fall sulfate:chloride ratios at the hardwood swamp was the reverse of the relation observed in 1987. In October 1985, the equivalent sulfate:chloride ratio at the hardwood swamp had an extremely large value of 3.65 (equal to a weight ratio of 4.94). This value is similar to the average ratio in precipitation (table 18) and much larger than the ratio during the spring of 1985 or the spring or fall of 1987. Apparently, the lowering of the water table in the basin and the drying out of parts of the stream channel caused normally reducing areas to become oxidizing areas and prevented the transformation of sulfate into less mobile, reduced forms. Some previously reduced sulfur also might have been oxidized during the drought periods, according to the scenario proposed by Gorham and others (1984). The large concentration of sulfate was accompanied by a low pH (large hydrogen-ion concentration), and by elevated concentrations of base cations, aluminum, iron, and chloride. If the increased concentration of chloride is taken to be indicative of increased evaporative concentration during the drought conditions, then comparison of the ion ratios to chloride ion in October 1985 and in October 1987 indicates that the increased concentrations of hydrogen ion, base cations, aluminum, and iron in October 1987 did not result from evaporative concentration alone.
78

An increase in concentrations of hydrogen ion and sulfate during autumn flushes that follow dry summers has been observed in other basins containing freshwater wetlands that receive acidic deposition in Norway (Braekke, 1981) and eastern Ontario (Lazerte and Dillon, 1985). The increase in concentration of hydrogen ion appears to be characteristic of watersheds affected by acid deposition; Bayley and others (1986) reported that autumn sulfate pulses in a wetland in northwestern Ontario receiving less acidic precipitation than Norway or eastern Ontario (pH approximately 5) were accompanied by increases in concentrations of calcium and magnesium, but were not accompanied by increased concentrations of hydrogen ion. In comparing the site in northwestern Ontario with the sites in Norway and eastern Ontario, Bayley and others (1986) concluded that increased concentrations of hydrogen ion accompanying autumn flushes are a consequence of depletion of calcium and magnesium sources resulting from the effects of acidic deposition.
The fact that the sulfate pulse at McDonalds Branch basin was accompanied not only by an increase in base cations but also by increases in hydrogen ion, aluminum, and iron indicates that acid rain may be causing base cations to be leached from soils and sediments. The situation in the swamps and bogs at McDonalds Branch basin may not be directly comparable to the other acid-rain-affected wetlands as a result of differences in the geologic settings. The surficial geology at McDonalds Branch basin is dominated by highly weathered sands and gravels that do not contain a ready supply of weatherable minerals, whereas the wetlands in Ontario and Norway are located in areas with crystalline bedrock. Therefore, the large concentrations of hydrogen ion, aluminum, and iron that accompanied the autumn sulfate pulse at McDonalds Branch basin may be related in part to the "naturally" leached nature of the sediments, as well as to additional leaching of base cations caused by acidic deposition. Determination of the role of acidic deposition in the leaching of base cations within the basin might be facilitated by comparison studies of water quality in an area that is similar geologically to the Pinelands but receives less acidic precipitation.
Input from intermittent tributaries draining nearby perched bogs also might have contributed to the anomalous surface-water conditions in the hardwood swamp during the autumn of 1985. As shown in figure 18, water from an upland bog that was sampled in October 1987 contained large concentrations of hydrogen ion and sulfate.
At the cedar swamp, the sulfate:chloride and hydrogen-ion:chloride ratios were the same in March 1985 as in October 1985. During these samplings, surface water in the cedar swamp probably was composed primarily of ground-water discharge. Therefore, the hydrogen-ion:chloride and sulfate:chloride ratios, coupled with the similarity in base- cation: chloride, aluminum:chloride, and iron:chloride ratios indicate that the chemistry of ground-water discharge at the cedar swamp (site S-10, station number 01466500) is relatively invariable.
79

UJ OL»L»h-
_J
- uj 600^ Q-2 co
£ 5 400t _i2 <UJ >
§ O 200
DC
n
-
-
Base cations^ Ca, Mg, Na, K \
Fe
Al
H
xF
Cl
S04
-
-
BOG-WATER SAMPLE, OCTOBER 1987
Figure 18.--Equivalent concentrations of cations and anions in a bog-water sample from October 1987.
80

Hydrogeochemical Controls of Acidity
The weight ratios of selected ions to chloride ion (table 17) indicate that a large part of the acidic components that are deposited on the basin in bulk precipitation are retained within the basin. However, the ratios (in particular, sulfate:chloride), coupled with the evidence of large concentrations of sulfate following the 1985 drought, also indicate that a component of the sulfate deposited in the basin ultimately leaves the basin in surface water and ground water. Determination of the role of atmospherically deposited sulfate in creation of the highly leached soils in the basin, in the mobilization of trace elements such as aluminum, and in the acidification of surface and ground water is difficult. The difficulty arises because there may be natural sources of sulfate in the basin (for example, pyrite), and because the lack of weatherable minerals in the geologic substrate and the large concentrations of organic acids might have led to a naturally acidic, leached environment. Additionally, observations of changes in water chemistry through the ecosystem in USGS studies, as well as in past studies in other wetland environments, indicate that a complex array of processes may be working to determine the acidity of waters in the basin and the acid-neutralizing capacity of soils. This complexity makes determination of the importance of any one process acting within the basin a difficult task.
Excellent reviews of geochemical processes and reactions that may occur within a forested ecosystem have been provided by Van Breemen and others (1983), Stumm and Morgan (1981), and Gorham and others (1984). A conceptual model of how water and chemical constituents enter, flow through, and leave the basin is presented in figure 19. A preliminary summary of processes that may affect water quality in the various ecosystem compartments at McDonalds Branch basin is presented in figure 20 and table 20.
As shown in figure 19, chemical constituents enter the basin in precipitation or dry deposition and leave the basin generally in the form of streamflow or ground-water recharge. Some H 2 S may leave the basin as a result of outgassing in wetland regions; however, the extent of H2 S removal has not been determined. Additional water leaves the basin by evaporation and transpiration; such water would be expected to have small concentrations of dissolved constituents.
Within the basin, water interacts with plant life, which may take up or release constituents either on plant surfaces (for example, throughfall) or in the soil zone (root uptake and exudation). Most of the water entering the basin passes through upland or lowland soils, where a variety of chemical processes (for example, podzolization, sulfate reduction, organic- matter decomposition) can occur. Some precipitation falling on the basin is deposited directly on the stream or on upland perched bogs (not shown in fig. 17), which can at times of high flow become connected with the stream either through runoff in intermittent tributaries or through elevation of the water table. From the soil zone, water can pass into the aquifer and from there either leaves the basin as ground-water recharge to the regional flow system or flow into the stream channel as ground-water discharge. Chemical processes occurring within the geologic matrix of the aquifer may alter water chemistry (for example, interaction with clay lenses and iron hydroxides). Within the stream channel, water chemistry may be altered by
81

EX
PLA
NA
TIO
N
Str
ea
m
Cla
y
len
s
Wate
r ta
ble
Wa
ter
ente
ring
and
movin
g
thro
ugh
syste
m
Wate
r le
avin
g
syste
m
Movem
ent
of
dry
-de
po
site
d
or
outg
assed
constitu
ents
PR
EC
IPIT
AT
ION
TR
AN
SP
IRA
TIO
N
DR
Y
DE
PO
SIT
ION
PR
EC
IPIT
AT
ION
00
NJ
*4tf
rfr
JLS
t.-
.-
-
Jf
EV
AP
OT
RA
NS
PIR
AT
ION
GR
OU
ND
-WA
TE
R
DIS
CH
AR
GE
GR
OU
ND
-WA
TE
R
RE
CH
AR
GE
CE
DA
R
SW
AM
PO
PE
N
CH
AN
NE
LH
AR
PW
OO
P
SW
AM
PT
RA
NS
ITIO
NP
INE
/OA
K.
UP
LA
NP
NOT TO SCALE
Figure 19.--Preliminary model of the
entry, through-flow,
and exit of water
and chemical constituents from the
McDonalds Branch basin.

INP
UT
TO
BA
SIN
DR
Y
DE
PO
SIT
ION
MA
RIN
E A
ND
CO
NTI
NE
NTA
L A
ER
OS
OLS
AN
D P
AR
TIC
IPA
TE
S
WA
SH
ED
OU
T O
F A
TM
OS
PH
ER
E
THR
DU
GH
FALL
A
NC
^STE
MFL
OW
\->
ui O
LIT
TE
RF
A?L
NU
TR
IEN
TS
TA
KE
N U
P-
PA
RT
ICLE
S W
AS
HE
D F
RO
M L
EA
VE
S-
MA
TE
RIA
L LE
AC
HE
D F
RO
M L
EA
VE
S
INC
RE
AS
ES
CO
NC
EN
TRA
TIO
NS
OF
CO
NS
TIT
UE
NT
S
RO
OT
UP
TAK
E A
ND
EX
UD
AT
ION
- B
AC
TE
RIA
L A
CTI
ON
SO
IL-Z
ON
E R
EA
CTI
ON
S A
ND
M
INE
RA
L W
EA
TH
ER
ING
RO
OT
UP
TAK
E A
ND
EX
UD
AT
ION
- B
AC
TE
RIA
L A
CTI
ON
EX
CH
AN
GE
OF
ME
TA
LS O
N
SP
HA
GN
UM
MO
SS
RE
DO
X R
EA
CT
ION
S
(MX
®
0:
ION
EX
CH
AN
GE
WIT
H
AQ
UIF
ER
MA
TE
RIA
LS
RE
DO
X R
EA
CT
ION
S
.OU
TP
UT
FR
OM
BA
SIN
A
S S
TR
EA
M F
LOW
OU
TPU
T FR
OM
BA
SIN
AS
G
RO
UN
D-W
AT
ER
RE
CH
AR
GE
Fig
ure
20.-
-Pote
nti
al
bio
geo
chem
ical
pro
cess
es
and re
acti
on
s th
at
may
occ
ur
wit
hin
a
fore
sted
se
cti
on of
McD
onal
ds
Bra
nch
basi
n.
(Num
bers
re
fer
to
table
20.)
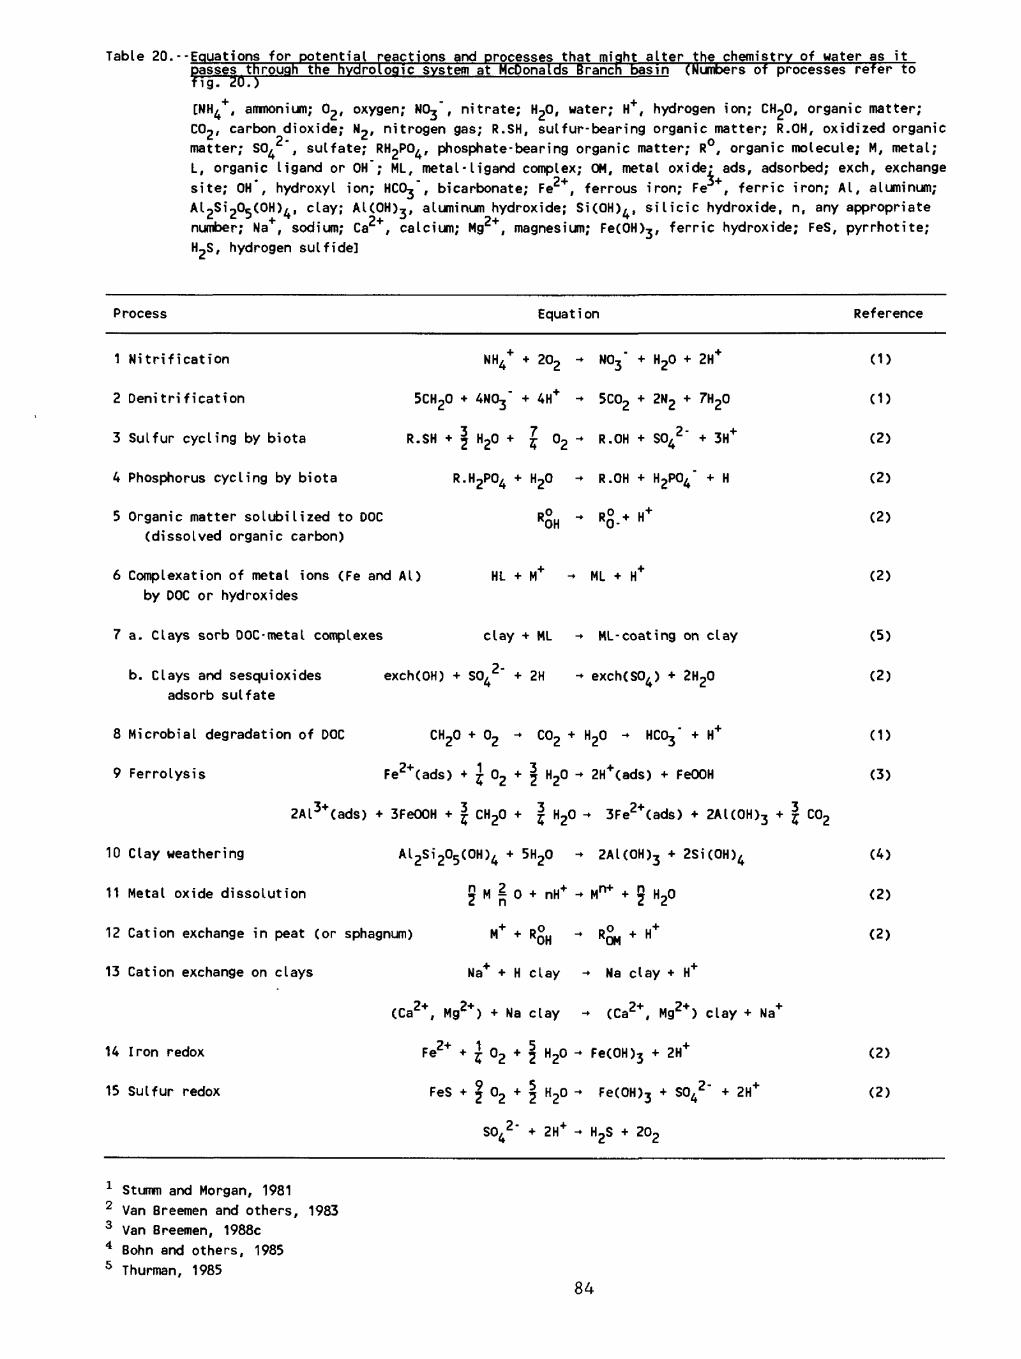
Table 20.--Equations for potential reactions and processes that might alter the chemistry of water as it passes through the hydroLogic system at McDonalds Branch basin(Numbers of processes refer to fig. 20.)
[NH4+ , ammonium; 02 , oxygen; NO^", nitrate; H20, water; H+ , hydrogen ion; CH20, organic matter; COp, carbon dioxide; N2 , nitrogen gas; R.SH, sulfur-bearing organic matter; R.OH, oxidized organic matter; SO/ , sulfate; RHpPO/, phosphate-bearing organic matter; R°, organic molecule; M, metal; L, organic ligand or OH"; ML, metal-ligand complex; OM, metal oxide- ads, adsorbed; exch, exchange site; OH", hydroxyl ion; HCO^", bicarbonate; Fe2+ , ferrous iron; Fe , ferric iron; Al, aluminum; Al 2Si 2Og(OH)4 , clay; Al(OH)3 , aluminum hydroxide; Si(OH)4 , silicic hydroxide, n, any appropriate number; Na+ , sodium; Ca , calcium; Mg , magnesium; Fe(OH)3 , ferric hydroxide; FeS, pyrrhotite; HpS, hydrogen sulfide]
Process Equation Reference
1 Nitrification NH4+ + 202 -> N03 " + HjO + 2H* (1)
2 Denitrification 5CH20 + 4N03 " + 4H* - 5C02 + 2N2 + 7H20 (1)
3 Sulfur cycling by biota R.SH + j HjO + | 02 -> R.OH + SO^2 " + 3H+ (2)
4 Phosphorus cycling by biota R.H 2P04 + H20 -> R.OH + H 2P04 " + H (2)
5 Organic matter solubilized to DOC R° -» R°. + H+ (2)un \t~(dissolved organic carbon)
6 Complexation of metal ions (Fe and Al) HL + M+ -> ML + H+ (2) by DOC or hydroxides
7 a. Clays sorb DOC-metal complexes clay + ML -> ML-coating on clay (5)
b. Clays and sesquioxides exch(OH) + SO^2 " + 2H -> exch(S04 ) + 2H20 (2) adsorb sulfate
8 Microbial degradation of DOC CH20 + 02 -> C02 + H20 * HCOj" + H+ (1)
9 Ferrolysis Fe2+ (ads) + | 02 + j H20 - 2H+ (ads) + FeOOH (3)
2Al 3+ (ads) + 3FeOOH + j CH20 + | H20 - 3Fe2+(ads) + 2Al(OH)3 + | C02
10 Clay weathering Al 2Si 205 (OH)4 + 5H20 - 2AKOH)3 + 2Si(OH)4 (4)
11 Metal oxide dissolution !J M 2 o + nH+ -> Mn+ + j H20 (2)
12 Cation exchange in peat (or sphagnum) M+ + R£H -> R^ + H+ (2)
13 Cation exchange on clays Na+ + H clay -> Na clay + H+
(Ca2*, Mg2*) + Na clay - (Ca2+ , Mg2*) clay + Na+
14 Iron redox
15 Sulfur redox
Fe * * °2 + iFeS + £ 02 + ;
S042 " H
J H20 - Fe(OH)3 + 2H
J H20 - Fe(OH)3 + S042 " + 2H+
- 2H+ - H2S + 202
(2)
(2)
1 Stumm and Morgan, 19812 Van Breemen and others, 19833 Van Breemen, 1988c4 Bohn and others, 19855 Thurman, 1985
84

interaction with underlying muck soils. Exchange of metals on sphagnum mosses within the stream channel also may be particularly important.
One means of evaluating the relative importance of geochemical and biological processes within the basin might be to construct a hydrogeochemical model for the basin which would be designed to mimic the changes through the hydrologic system shown in figures 19 and 20; the model would use equations for reactions and processes as presented in table 20. The construction of such a model would require more detailed study of the individual processes and would be complicated by potential nonsteady-state conditions that could result from the fluctuations in saturated and unsaturated conditions that occur in soils and peats. Casey and Lasaga (1987) showed that the assumption of steady state was not justified for many marsh soils which, like the wetland soils at McDonalds Branch basin, undergo periodic drying. The potential for nonsteady-state conditions at McDonalds Branch basin might require the development of new techniques for estimating reaction rates.
SUMMARY AND CONCLUSIONS
In order to provide an improved understanding of hydrogeochemical processes in the Coastal Plain and to create a foundation for future research on the potential effects of acid rain on the freshwater reserves of the Pinelands, the U.S. Geological Survey conducted studies from 1984-88 at McDonalds Branch basin, a small watershed in the Pinelands region of the New Jersey Coastal Plain. McDonalds Branch basin contains freshwater wetlands and is located in a regional ground-water recharge area. In contrast to most other basins that have been the subjects of detailed watershed studies (for example, the Hubbard Brook Experimental Forest Study), the basin overlies unconsolidated, highly weathered sands with interbedded clays rather than crystalline bedrock. Results of hydrologic studies indicated that the upstream hardwood swamp part of the McDonalds Branch stream generally drains to ground water, the downstream cedar swamp is a ground- water discharge area, and the midstream open channel has variable hydrology.
The Geological Survey studies demonstrated that the basin receives strongly acidic deposition (acid rain); mean pH values of wet and bulk precipitation are approximately 4.3. Sulfate and nitrate contribute approximately 75 percent of the anionic charge in precipitation. Precipitation chemistry also shows the effect of oceanic sources in the form of fairly large concentrations of sodium and chloride, particularly during the winter when many storms move along the Atlantic Coast.
As precipitation passes through canopy vegetation in oak-pine forests and the Atlantic cedar swamp, pH decreases; in contrast, pH increases as precipitation passes through the hardwood swamp canopy. In all of the forests, precipitation becomes enriched in most cations and in sulfate, chloride, and nitrate during throughfall; however, throughfall tends to be slightly depleted in ammonium.
Surface-water sampling in 1987 in the two swamps indicated that hardwood-swamp water had low pH (mean = 3.8) and large concentrations of DOC, aluminum, and iron, indicating input from organic soil horizons. Cedar-swamp water had smaller concentrations of DOC, aluminum, and iron, and
85
higher pH (mean - 4.1) as a result of ground-water discharge. Monthly water-quality samples and instantaneous discharge measurements at the cedar swamp showed that concentrations of DOC, aluminum, iron, manganese, and sulfate increased with increasing discharge; pH and silica concentration decreased; and concentrations of calcium, magnesium, sodium, potassium, and chloride were unrelated to discharge.
A drought in 1985 permitted observation of water-quality responses to drought hydrology. During the summer, ground-water levels dropped, and the open-channel area of the stream became dry. These conditions caused normally reducing areas to become oxidizing. Runoff of precipitation generated by a fall hurricane caused flushing of oxidized zones in soils and peats and consequently, anomalously large concentrations of sulfate at the hardwood swamp. Chemical changes in cedar-swamp water were more subtle, presumably because of the moderating effect of ground water.
Chemical input/output budgets for the basin were not calculated because of uncertainty in the quantity and chemistry of water leaving the basin as recharge to the regional flow system. Ion ratios to chloride provided qualitative information on the uptake and release of constituents within the basin, however. On the basis of calculations of ion ratios during a year with approximately average precipitation (November 25, 1986 through November 24, 1987), hydrogen ion, potassium, ammonium, sulfate, and nitrate appeared to have accumulated substantially within the basin. Magnesium and calcium were accumulated in some areas and released in others. DOC, aluminum, iron, manganese, and silica apparently were released within the basin. Because these input-output relations are based on data for a single year, these relations may not be representative of long-term conditions in the basin.
Relatively large concentrations of aluminum, iron, and manganese are present in some basin waters. Concentrations of aluminum, iron, and manganese correlated well with DOC concentration in surface water at the cedar swamp (site S-10), but concentrations of these trace elements did not appear to correlate well with DOC concentration in most other surface water and ground water in the basin. Preliminary investigations of aluminum distributions into organic and inorganic forms indicated that aluminum was present in organic and inorganic forms in surface water in the hardwood swamp and the open channel. Surface water in the cedar swamp contained only 0.10 mg/L of aluminum, all of which appeared to be present as colloidal polymeric aluminum or strong alumino-organic complexes and, thus, would have a low potential for toxicity to plant and animal life. Concentrations of total dissolved aluminum and distributions of aluminum into organic and inorganic forms differed spatially in ground water. Perhaps the most striking concentrations of aluminum were in deep (20 feet below the water table) well QWO-2B, which contained approximately 1.00 mg/L aluminum; all of which appeared to be present as inorganic monomeric forms. Such a large concentration of inorganic, monomeric aluminum would have a great potential for toxicity. Whether or not such a large concentration of inorganic, monomeric aluminum is present in ground water recharging the regional flow system remains to be determined.
In conclusion, surface water and ground water in the basin are acidic and dilute, and values of properties and concentrations of constituents vary through space and time. The U.S. Geological Survey studies demonstrated
86

that hydrology can exert important effects on surface-water quality, and that basin hydrology, therefore, needs to be taken into consideration in any study of anthropogenic effects on surface-water quality in the basin. The studies further revealed the spatial and temporal variability in surface - and ground-water quality that may occur in a small watershed in the New Jersey Pinelands over the course of a few years. The variability indicates that a diverse group of hydrological, geochemical, and biochemical processes work together to define the chemistry, and, in particular, the acidity of waters of the Pinelands. Although the relative importance of the individual processes cannot be determined at this time, these studies may serve as a framework for reassessing previous investigations in the Pinelands and for monitoring future anthropogenic effects.
87
REFERENCES CITED
Bacho, A.B., Jr., 1955, A geologic and preliminary hydrologic comparison of McDonalds Branch and Middle Branch watersheds, Lebanon State Forest, New Jersey: Iowa City, University of Iowa, unpublished M.S. thesis, 58 p.
Barnes, R.A., 1975, The determination of specific forms of aluminum in natural water: Chemical Geology, v. 15, p. 177-191.
Bauersfeld, W.R., Moshinsky, E.W., Pustay, E.A., and Jones, W.D., 1987,Water resources data, New Jersey, Water Year 1986, Volume 2--Delaware River Basin and tributaries to Delaware Bay: U.S. Geological Survey Water-Data Report NJ-86-2, 197 p.
Bayley, S.E., Behr, R.S., and Kelly, C.A., 1986, Retention and release of S from a freshwater wetland: Water, Air and Soil Pollution, v. 31, no. 1/2, p. 101-114.
Beck, K.C., Reuter, J.H., and Perdue, E.M., 1974, Organic and inorganicgeochemistry of some Coastal Plain rivers of the southeastern United States: Geochimica et Cosmochimica Acta, no. 3, v. 38, p. 341-364.
Berner, E.K., and Berner, R.A., 1987, The global water cycle--Geochemistry environment: Englewood Cliffs, N.J., Prentice-Hall, Inc., 397 p.
Bohn, H.L., McNeal, B.L., and Connor, G.A., 1985, Soil chemistry (2 ed.): New York, John Wiley, and Sons, Incorporated, 341 p.
Braekke, F.H., 1981, Hydrochemistry of high altitude catchments in south Norway, Volume 1--Effects of summer droughts and soil-vegetation characteristics: Ar, Norway, Norwegian Forest Research Institute, v. 36, no. 8, 26 p.
Casey, W.H., and Lasaga, A.C., 1987, Modeling solute transport and sulfate reduction in marsh sediments: Geochimica et Cosmochimica Acta, v. 51, no. 5, p. 1,109-1,120.
Cleaves, E.T., Godfrey, A.E., and Bricker, O.P., 1970, Geochemical balance of a small watershed and its geomorphic implications: Geological Society of America Bulletin 81, no. 10, p. 3,015-3,032.
Crerar, D.A., Means, J.L., Yuretich, R.F., Borcsik, M.P., Amster, J.L., Hastings, D.W., Knox, G.W., Lyon, K.E., and Quiett, R.F., 1981, Hydrogeochemistry of the New Jersey Coastal Plain, II--Transport and deposition of iron, aluminum, dissolved organic matter, and selected trace elements in stream, ground-, and estuary water: Chemical Geology, v. 33, no. 1-2, p. 23-44.
Cronan, C.S., 1978, Solution chemistry of a New Hampshire subalpineecosystem: Biogeochemical patterns and processes: Hanover, N.H., Dartmouth College, Ph.D. dissertation, 248 p.
88
REFERENCES CITED--Continued
Cronan, C.S., 1980, Solution chemistry of a New Hampshire subalpineecosystem--A biogeochemical analysis: Oikos, v. 34, no. 3, p. 272-281.
Cronan, C.S., and Schofield, C.L., 1979, Aluminum leaching response to acid precipitation--Effects of high-elevation watersheds in the Northeast: Science, v. 204, no. 4,390, p. 304-306.
1985, Albios field sampling protocol: Unpublished manuscript on filein Department of Botany and Plant Pathology, University of Maine at Orono, p. 12-16.
Crozat, G., 1979, Sur 1'emission d'un aerosol riche en potassium par la foret tropical [On the emmission of a potassium-rich aerosol in the tropical forest]: Tellus, v. 31, p. 52-57.
Douglas, L.A., and Trela, J.J., 1979, Mineralogy of Pine Barrens soils, in Forman, R.T.T., ed., Pine Barrens--Ecosystem and landscape: New York, Academic Press, p. 95-109.
Driscoll, C.T., 1984, A procedure for fractionation of aqueous aluminum in dilute acidic waters: International Journal of Environmental and Analytical Chemistry, v. 16, no. 4, p. 267-283.
Driscoll, C.T., Baker, J.P., Bisogni, J.J., and Schofield, C.L., 1980, Effects of aluminum speciation on fish in dilute acidified water: Nature, v. 284, p. 161-164.
Feth, J.H., 1981, Chloride in natural continental water--A review: U.S. Geological Survey Water-Supply Paper 2176, 30 p.
Galloway, J.N., Likens, G.E., Keene, W.C., and Miller, J.M., 1982, Thecomposition of precipitation in remote areas of the world: Journal of Geophysical Research, v. 87, no. 11, p. 8,771-8,786.
Galloway, J.N., Schofield, C.L., Hendrey, G.R., Peters, N.E., and Johannes, A.H., 1980, Sources of acidity in three lakes acidified during snowmelt, in Drablos, Dagfinn, and Tollan, Aarne, eds., Ecological impact of acid precipitation, Sandefjord, Norway, Proceedings: Olso, Norway, SNSF Project, p. 264.
Gorham, E., Bayley, S.E., and Schindler, D.W., 1984, Ecological effects of acid deposition upon peatlands: A neglected field in "acid-rain" research: Canadian Journal of Fisheries and Aquatic Sciences, v. 41, p. 1256-1268.
Gran, G., 1952, Determination of the equivalence point in potentiometric titrations, Part II: The Analyst, v. 77, p. 661-671.
Havens, A.V., 1979, Climate and microclimate of the New Jersey PineBarrens, in Forman R.T.T., ed., Pine Barrens--Ecosystem and landscape: New York, Academic Press, p. 113-131.
89
REFERENCES CITED--Continued
Hem, J.D., 1985, Study and interpretation of the chemical characteristics of natural water: U.S. Geological Survey Water-Supply Paper 2254, 263 p.
Illinois State Water Survey, 1986, Development of standard methods for the collection and analysis of precipitation: U.S. Environmental Protection Agency Report EPA/600/4-86/024, 186 p.
Johannessen, M., 1980, Aluminum, a buffer in acidic waters, in Drablos, Dagfinn, and Tollan, Arne, eds., Ecological impact of acid precipitation, Sandefjord, Norway, Proceedings: Oslo, Norway, SNSF Project, p. 222-223.
Johnson, A.H., 1979a, Evidence of acidification of headwater streams in the New Jersey Pinelands: Science, v. 206, no. 4420, p. 834-836.
____ 1979b, Acidification of headwater streams in the New Jersey PineBarrens: Journal of Environmental Quality, v. 8, no. 3, p. 383-386.
Johnson, D.W., Henderson, G.S., and Todd, D.E., 1981, Evidence of modernaccumulation of adsorbed sulfate in an east Tennessee forested Ultisol: Soil Science, v. 132, no. 6, p. 422-426.
Johnson, D.W., and Reuss, J.O., 1984, Soil-mediated effects ofatmospherically deposited sulphur and nitrogen: London, Philosophical Transactions Royal Society London, ser. B, v. 305, no. 1124, p. 383-392.
Johnsson, P.A., and Lord, D.G., 1987, A computer program for geochemicalanalysis of acid-rain and other low-ionic strength, acidic waters: U.S. Geological Survey Water-Resources Investigations Report 87-4095A, 42 p.
Johnston, R.H., 1986, Relation of ground water to surface water in foursmall basins of the Delaware Coastal Plain: Newark, Delaware Geological Survey Report of Investigations, no. 24, 56 p.
Katz, B.C., Bricker, O.P., and Kennedy, M.M., 1985, Geochemical mass-balance relations for selected ions in precipitation and stream water, Catoctin Mountains, Maryland: American Journal of Science, v. 285, no. 10, p. 931-962.
Knapp, G.N., 1904, Underground waters of New Jersey--Wells drilled in 1903, in Annual Report to State Geologist, Trenton, New Jersey: New Jersey Geological Survey, 1903 pp. 75-93.
Lawson, D.R., and Winchester, J.W., 1979, Sulfur, potassium, and phosphorus in aerosols from South American tropical rain forests: Journal of Geophysical Research, v. 84, no. C7, p. 3,723-3,727.
Lazerte, B.D., and Dillon, P.J., 1985, Chemical transformations. V. Chemical transformations of stream and soilwater flowing through Sphagum conifer swamps of Central Ontario: Mukoka, Ont., International Symposium on Acidic Precipitation, p. 207.
90

REFERENCES CITED--Continued
Likens, G.E., Bormann, F.H., Pierce, R.S., Eaton, J.S., and Johnson, N.M., 1977, Biogeochemistry of a forested ecosystem: New York, Springer- Verlag, 146 p.
Lord, D.G., Barringer, J.L., Johnsson, P.A., and Schuster, P.P., 1986,Effects of acid precipitation on surface and ground waters in the New Jersey Pinelands: EOS, Transactions, American Geophysical Union, v. 67, no. 16, p. 282.
Lord, D.G., Barringer, J.L., Johnsson, P.A., Schuster, P.P., Walker, R.L., Fairchild, J.E., Sroka, B.N., and Jacobsen, E., 1990, Hydrogeochemical data from an acidic deposition study at McDonalds Branch basin in the New Jersey Pinelands, 1983-86: U.S. Geological Survey Open-File Report 88-500, 132 p.
Lynch, J.A., Hanna, C.M., Corbett, E.S., 1986, Predicting pH, alkalinity, and total acidity in stream water during episodic events: Water Resources Research, v. 22, no. 6, p. 905-912.
Madsen, E.L., Morgan, M.D., and Good, R.E., 1986, Simultaneousphotoreduction and microbial oxidation of iron in a stream in the New Jersey Pinelands: Limnology and Oceanography, v. 31, no. 4, p. 832-838.
Markley, M.L., 1955, National cooperative soil studies, watershed research project areas, Middle Branch and McDonalds Branch, Lebanon State Forest, New Jersey: New Brunswick, New Jersey Soil Conservation Service, 8 p.
____ 1971, Soil survey of Burlington County, New Jersey: U.S. SoilConservation Service, 120 p.
____ 1979, Soil series of the Pine Barrens, in Forman, R.T.T., ed., Pine Barrens--Ecosystem and landscape: New York, Academic Press, p. 81-93.
Martin, Mary, 1990, Ground-water flow in the New Jersey Coastal Plain aquifers: U.S. Geological Survey Open-File Report 87-528, 182 p.
McCormick, J.S., 1955, A vegetation inventory of two watersheds in the New Jersey Pine Barrens: New Brunswick, N.J., Rutgers University, Ph.D. dissertation, 125 p.
____ 1979, The vegetation of the New Jersey Pine Barrens, in Forman,R.T.T., ed., Pine Barrens--Ecosystem and Landscape: New York, Academic Press, p. 229-243.
Means, J.L., Yuretich, R.F., Crerar, D.A., Kinsman, D.J.J., and Borcsik,M.P., 1981, Hydrogeochemistry of the New Jersey Pine Barrens: Trenton, New Jersey, Department of Environmental Protection, New Jersey Geological Survey Bulletin 76, 107 p.
91
REFERENCES CITED--Continued
Meybeck, M., 1979, Concentration des eaux fluviales en elements majeurs et apports en solution aux oceans [Major element concentrations in rivers and dissolved supply to the ocean]: Revue Geologie Dynamique et Geographie Physique, v. 21, no. 3, p. 215-246.
Minard, J.P., 1966, Sandblasted blocks on a hill in the Coastal Plain of New Jersey: U.S. Geological Survey Professional Paper No. 550-B, p. B87- B90.
Morgan, M.D., 1984, Acidification of headwater streams in the New Jersey Pinelands--A re-evaluation: Limnology and Oceanography, v. 29, no. 6, p. 1,259-1,266.
Morgan, M.D., and Good, R.E., 1986, Impact of acid precipitation on stream water chemistry in the New Jersey Pinelands, final report: New Brunswick, N.J., Rutgers University, Center for Coastal and Environmental Studies, 34 p.
_____ 1988, Stream chemistry in the New Jersey Pinelands: The influence ofprecipitation and watershed disturbance: Water Resources Research, v. 24, no. 7, p. 1,091-1,100.
National Oceanic and Atmospheric Administration, 1982, Monthly normals of temperature, precipitation, and heating and cooling degree days 1951- 1980, New Jersey, in Climatography of the United States, no. 81: Asheville, N.C., National Climate Center, 9 p.
National Research Council, 1986, Acid deposition--Long-term trends: Washington, D.C., National Academy Press, 506 p.
Owens, J.P., and Minard, J.P., 1975, Geologic Map of the Surficial Deposits in the Trenton area, New Jersey and Pennsylvania: U.S. Geological Survey Miscellaneous Geologic Investigations Map 1-884, scale 1:48,000.
Owens, J.P., and Sohl, N.F., 1969, Shelf and deltaic paleoenvironments in the Cretaceous-Tertiary formations of the New Jersey Coastal Plain, in Subitsky, Seymour, ed., Geology of selected areas in New Jersey and eastern Pennsylvania and guidebook of excursions: New Brunswick, N.J., Rutgers University Press, p. 235-278.
Puckett, L.J., 1990, Estimates of ion sources in deciduous and coniferous throughfall, Atmospheric Environment, v. 24A, no. 3, p. 545-555.
Rhodehamel, E.G., 1970, A hydrologic analysis of the New Jersey Pine Barrens region: Trenton, New Jersey Division of Water Policy Water Resources Circular no. 22, 35 p.
_____ 1979a, Geology of the Pine Barrens of New Jersey, in Forman, R.T.T.,ed., Pine Barrens--Ecosystem and landscape: New York, Academic Press, p. 39-60.
92

REFERENCES CITED--Continued
____ 1979b, Hydrology of the New Jersey Pine Barrens, in Forman, R.T.T., ed., Pine Barrens--Ecosystem and landscape, New York: Academic Press, p. 147-168.
Ryan, J.N., and Gschwend, P.M., 1990, Colloid mobilization in two Atlantic Coastal Plain aquifers: Water Resources Research, v. 26, no. 2, p. 307-322.
Schofield, C.L., and Trojnar, J.R., 1980, Aluminum toxicity to brook trout (Salvelinus fontinalis) in acidified waters, in Toribara, T.Y., Miller, M.W., and Morrow, P.E., eds., Polluted rain: New York, Plenum Press, p. 341-366.
Smith, R.A., and Alexander, R.B., 1983, Evidence for acid-precipitation- induced trends in stream chemistry at hydrologic benchmark stations: U.S. Geological Survey Circular 910, 12 p.
Sokolov, A.A., and Chapman, T.G., 1974, Methods for water balancecomputations: An international guide for research and practice: Paris, The UNESCO Press, 127 p.
Spratt, H.G., Jr., Morgan, M.D., and Good, R.E., 1987, Sulfate reduction in peat from a New Jersey Pinelands cedar swamp: Applied and Environmental Microbiology, v. 53, no. 7, p. 1,406-1,411.
Stallard, R.F., and Edmond, J.M., 1981, Geochemistry of the Amazon 1-- Precipitation chemistry and the marine contribution to the dissolved load at the time of peak discharge: Journal of Geophysical Research, v. 86, no. 10, p. 9844-9858.
Stumm, Werner, and Morgan, J.J., 1981, Aquatic chemistry--An introduction emphasizing chemical equilibria in natural waters (2d ed.): New York, John Wiley, 780 p.
Swanson, K.A., 1979, Trace metal budgets for a forested watershed in the New Jersey Pine Barrens: Philadelphia, University of Pennsylvania, M.A. thesis, 96 p.
Swanson, K.A., and Johnson, A.H., 1980, Trace metal budgets for a forested watershed in the New Jersey Pine Barrens: Water Resources Research, v. 16, no. 2, p. 373-376.
Thurman, E.M., 1985, Organic geochemistry of natural waters: Dordrecht, the Netherlands, Martinus Nijhoff/Dr. W. Junk, 497 p.
Turner, R.S., 1983, Biogeochemistry of trace elements in the McDonaldsBranch watershed, New Jersey Pine Barrens: Philadelphia, University of Pennsylvania, unpublished Ph.D. dissertation, 321 p.
Turner, R.S., Johnson, A.H., and Wang, D., 1985a, Biogeochemistry of lead in McDonalds Branch watershed, New Jersey Pine Barrens: Journal of Environmental Quality, v. 14, no. 3, p. 305-314.
93

REFERENCES CITED--Continued
____ 1985b, Biogeochemistry of aluminum in McDonalds Branch watershed, New Jersey Pine Barrens: Journal of Environmental Quality, v. 14, no. 3, p. 314-323.
Ulrich, B., Mayer, R., and Khanna, P.K., 1980, Chemical changes due to the acid precipitation in a loess-derived soil in central Europe: Soil Science, v. 130, no. 4, p. 193-199.
Van Breemen, N., 1988a, Effects of seasonal redox processes involving iron on the chemistry of periodically reduced soils, in Stucki, J.W., Goodman, B.A., and Schwartmann, U., eds. , Iron in soils and clay minerals: Dordrecht, The Netherlands, D. Reidel Publishing Company, p. 797-809.
____ 1988b, Redox processes of iron and sulfur involved in the formation of acid sulfate soils, in Stucki, J.W., Goodman, B.A., and Schwartmann, U., eds., Iron in soils and clay minerals: Dordrecht, The Netherlands, D. Reidel Publishing Company, p. 825-841.
____ 1988c, Long-term chemical, mineralogical, and morphological effects of iron-redox processes in periodically flooded soils, in Stucki, J.W., Goodman, B.A., and Schwartmann, U., eds., Iron in soils and clay minerals: Dordrecht, The Netherlands, D. Reidel Publishing Company, p. 811-823.
Van Breemen, N., Mulder, J., and Driscoll, C.T., 1983, Acidification and alkalinization of soils: Plant and Soil, v. 75, no. 3, p. 283-308.
Wang, Deane, 1984, Fire and nutrient dynamics in a pine-oak forest ecosystem in the New Jersey Pine Barrens: New Haven, Conn., Yale University, Ph.D. dissertation, 217 p.
Yuretich, R.F., Crerar, D.A., Kinsman, D.J.J., Means, J.L., and Borcsik,M.P., 1981, Hydrogeochemistry of the New Jersey Coastal Plain, l--Major- element cycles in precipitation and river water: Chemical Geology, v. 33, no. 1-2, p. 1-21.
94

Table 4.--Throughfall and precipitation chemistry for four sampling periods in 1985 and 1986
[Site PPT-1BC is bulk precipitation at the cedar-hill site, TF-1C is cedar-swamp throughfall, TF-3H is hardwood-swamp throughfall, TF- 2PB is pitch-pine/black-oak-forest throughfall, TF-4PBJ is pitch- pine/blackjack-oak-forest throughfall; fiS/cm, microsiemens per centimeter at 25 degrees Celsius; mg/L, milligrams per liter; micrograms per liter; <, less than]
Site name
Sampling Period Sampling Period
10/01/1985- 10/29/1985- 12/17/1985- 01/21/1986- 10/29/1985 11/19/1985 01/21/1986 02/19/1986 Median
PPT-1BCTF-1CTF-3HTF-2PBTF-4PBJ
PPT-1BCTF-1CTF-3HTF-2PBTF-4PBJ
4.5 4.4 5.7 4.6 5.1
Laboratory pH
4.7 4.433.9 3.55.8 4.64.5 4.15.1 4.4
4.493.95.64.54.7
1942201920
Laboratory Specific Conductance (/uS/cm)
17118408748
26231306361
2295163633
4.5 3.9 5.7 4.5 4.9
21107252841
Calcium (mg/L)
PPT-1BCTF-1CTF-3HTF-2PBTF-4PBJ
PPT-1BCTF-1CTF-3HTF-2PBTF-4PBJ
<0.01 1.3 1.3 1.0 1.0
0.03 .22 .30 .20 .24
0.153.31.42.01.3
Magnesium
0.13.80.50
1.1.70
0.319.21.31.52.2
(mg/L)
0.071.8
.30
.48
.82
.25 2.3 .38 .76 .82
0.102.2 .17 .29 .32
.20 2.81.3 1.3 1.2
0.091.3 .30 .39 .51
95

Table 4.--Throughfall and reciitation chemistr for four samlin periods in1985 and 1986-
Site name
PPT-1BCTF-1CTF-3HTF-2PBTF-4PBJ
Sampling
10/01/1985- 10/29/1985
0.1.
1.1.
180300
-Continued
Period
10/29/1985- 11/19/1985
14273
Sodium
.2
.2
.9
.5
.8
Sampling Period
12/17/1985- 01/21/1986- 01/21/1986 02/19/1986 Median
(mg/L)
0.3.
1.1.
711634
01
11
.96
.9
.8
.5
.5
0.2.
t
1.1.
85745
Potassium (mg/L)
PPT-1BCTF-1CTF-3HTF-2PBTF-4PBJ
PPT-1BCTF-1CTF-3HTF-2PBTF-4PBJ
0.
1.
< 1031152130
048049070
012
1
1284187958
.10
.7
.1
.90
.6
Aluminum
0.2.1.
1.
(/*g
173904796
140
Ammonium (mg/L
PPT-1BCTF-1CTF-3HTF-2PBTF-4PBJ
PPT-1BCTF-1CTF-3HTF-2PBTF-4PBJ
0.
t
1.5.2.3.3.
1422030301
52801
0
214464
.14
.31
.08
.14
.04
Sulfate
.1
.0
.2
.5
0.
0970385
;A)
as NH 4 )
2470213553
0
8100115457
0
.04
.31
.19
.37
.10
.10
.12
.09
.09
0.1.1.
.1.
_ _
92176758
0.
0772641
1427101207
(mg/L)
2.162.5.7.
5
839
19234
.6
.6
.0
.5
.0
1.122.4.4.
9
843
96
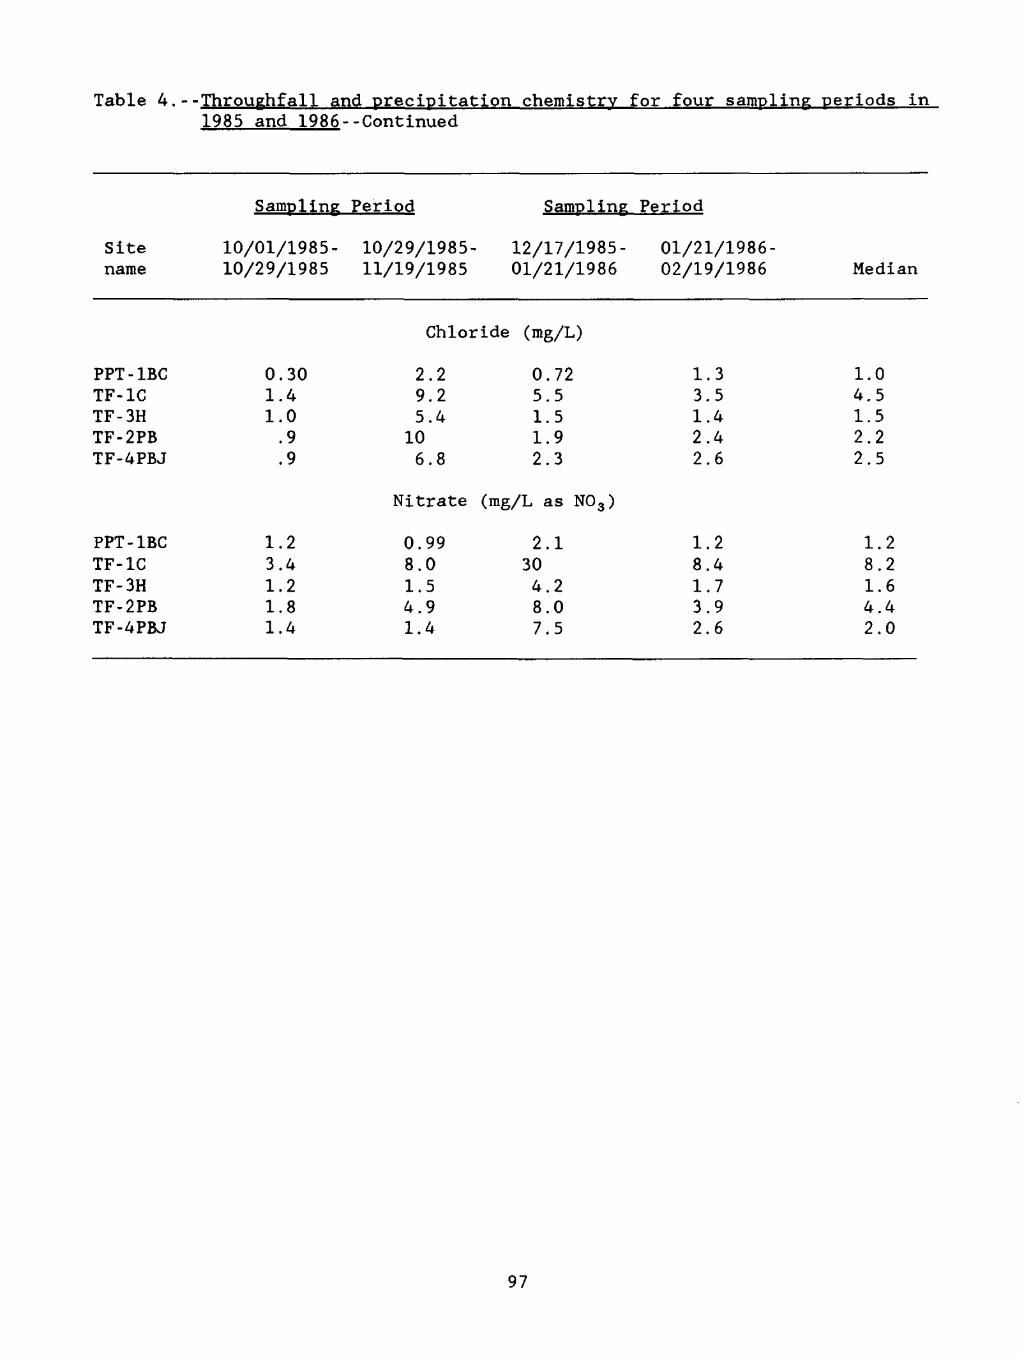
Table 4.--Throughfall and precipitation chemistry for four sampling periods in 1985 and 1986--Continued
Sampling Period Sampling Period
Site 10/01/1985- 10/29/1985- 12/17/1985- 01/21/1986- name 10/29/1985 11/19/1985 01/21/1986 02/19/1986 Median
PPT-1BCTF-1CTF-3HTF-2PBTF-4PBJ
0.301.41.0.9.9
Chloride (mg/L)
2.29.25.4
106.8
0.725.51.51.92.3
1.3 3.5 1.4 2.4 2.6
1.0 4.5 1.5 2.2 2.5
Nitrate (mg/L as N0 3 )
PPT-1BCTF-1CTF-3HTF-2PBTF-4PBJ
1.2 3.4 1.2 1.8 1.4
0.998.01.54.91.4
2.1304.28.07.5
1.2 8.4 1.7 3.9 2.6
1.2 8.2 1.6 4.4 2.0
97

APPENDIXES
98

Appendix A. -Chemical analyses of wet (PPT-1WC) and bulk (PPT-1BC) precipitation in HcDonalds Branch basin. December Z. 1986 through December 4. 1987
[ml. mill lifters; nS/cm, microsiemens per centimeter at 25 degrees Celsius; mg/L, milligrams per liter; District lab. New Jersey District laboratpry; NWQL, U.S. Geological Survey National Water-Quality Laboratory, Arvada Co.; ---, indicates missing data; <, indicates value below reporting limit]
PH Specific conductance(units) (uS/cm)
Sitename
PPT-1WCPPT-1WCPPT-1WCPPT-1WCPPT-1WCPPT-1WCPPT-1WCPPT-1WCPPT-1WCPPT-1WCPPT-1WCPPT-1WCPPT-1WCPPT-1WC
PPT-1BCPPT-1BCPPT-1BCPPT-1BCPPT-1BCPPT-1BC .PPT-1BCX9PPT-1BCPPT-1BCPPT-1BCPPT-1BCPPT-1BCPPT-1BCPPT-1BCPPT-1BCPPT-1BC
Sample- co I lectiondates
12/02/1986-12/16/198612/19/1986-12/30/198612/30/1986-01/20/198701/27/1987-02/24/198702/24/1987-04/01/198704/01/1987-04/29/198704/29/ 1 987- 05/26/1 98705/26/1987-06/30/198706/30/1987-07/28/198707/28/ 1 987- 08/25/ 1 98708/25/1987-09/29/198709/29/1987-10/13/198710/13/1987-11/24/198711/24/1987-12/04/1987
12/02/1986-12/16/198612/16/1986-12/23/198612/23/1986-12/30/198612/30/1986-01/20/198701/20/1987-01/27/198701/27/1987-02/24/198702/27/198702/24/1987-04/01/198704/01/1987-04/29/198704/29/1987-05/26/198705/26/1987-06/30/198706/30/ 1 987- 07/28/ 1 98707/28/1987-08/25/198708/25/1987-09/29/198709/29/1987-10/13/198710/13/1987-11/24/1987
Sample volume District NWQL(mL)
685.7157.2775.4327.8618.3876.5408.6665.3945.6
1,245686.0395.2624.5198.0
512.4160.7147.8731.0
338.6395.3595.3668.0418.8500.2752.9
1,048529.1315.5458.9
lab
4.684.764.274.374.524.574.264.234.244.054.084.534.584.63
4.674.304.584.544.314.395.804.704.424.224.244.384.074.024.604.55
4.854.624.664.374.734.464.204.154.063.943.984.454.464.71
4.884.704.534.774.734.385.654.934.474.244.194.113.933.974.434.54
Districtlab
113710.52616213631374846171922
1217341012282
182032323749482018
NWQL
1022112012163135415550182023
111726101021
1131731353955531818
Sitename
PPT-1WCPPT-1WCPPT-1WCPPT-1WCPPT-1WCPPT-1WCPPT-1WCPPT-1WCPPT-1WCPPT-1WCPPT-1WCPPT-1WCPPT-1WCPPT-1WC
PPT-1BCPPT-1BCPPT-1BCPPT-1BCPPT-1BCPPT-1BCPPT-1BCX3PPT-1BCPPT-1BCPPT-1BCPPT-1BCPPT-1BCPPT-1BCPPT-1BCPPT-1BCPPT-1BC
Sample-collectiondates
12/02/1986-12/16/198612/19/1986-12/30/198612/30/1986-01/20/198701/27/1987-02/24/198702/24/1987-04/01/198704/01/1987-04/29/198704/29/1987-05/26/198705/26/1987-06/30/198706/30/1987-07/28/198707/28/1987-08/25/198708/25/1 987- 09/29/ 1 98709/29/1987-10/13/198710/13/1987-11/24/198712/01/1987-12/04/1987
12/02/1986-12/16/198612/16/1986-12/23/198612/23/1986-12/30/198612/30/1986-01/20/198701/20/1987-01/27/198701/27/1987-02/24/198702/27/198702/24/1987-04/01/198704/01/1987-04/29/198704/29/1987-05/26/198705/26/1987-06/30/198706/30/1987-07/28/198707/28/1987-08/25/198708/25/1987-09/29/198709/29/1987-10/13/198710/13/1987-11/24/1987
Calcium,dissolved
(mg/L)
0.07.08.02.10.10.06.24.13.14.18.19.11.09.09
.12
.10
.12
.16
.08
.30< .01
.42
.12
.30
.19
.15
.21
.23
.12
.12
Magnesium,dissolved
(mg/L)
0.06.17.02
< .01.05.07.07.03.02.04.05.02.07.23
.08
.12
.18
.02
.02< .01< .01
.09
.07
.10
.05
.03
.04
.07
.03
.09
Sodium,dissolved
(mg/L)
0.551.5.14.22.48.54.41.27.07.12.51.17.67.51
.711.21.7.21.20.33.03.60.57.49.26.08.14.70.20.68
Potassium,dissolved
(mg/L)
0.01.06
< .01.01.03.03.05.09.03.02.32.03.02.07
.02
.03
.08< .01
.01
.04< .01
.08
.04
.22
.13
.10
.02
.29
.04
.04
Ammonium,dissolved(mg/L as NH 4)
0.0424.180.022.296.117.068.399.411.386.373.489.15.10.01
.045
.036
.219
.035
.033
.386
.004
.154
.129
.386
.591
.874
.373
.566
.155
.095
99
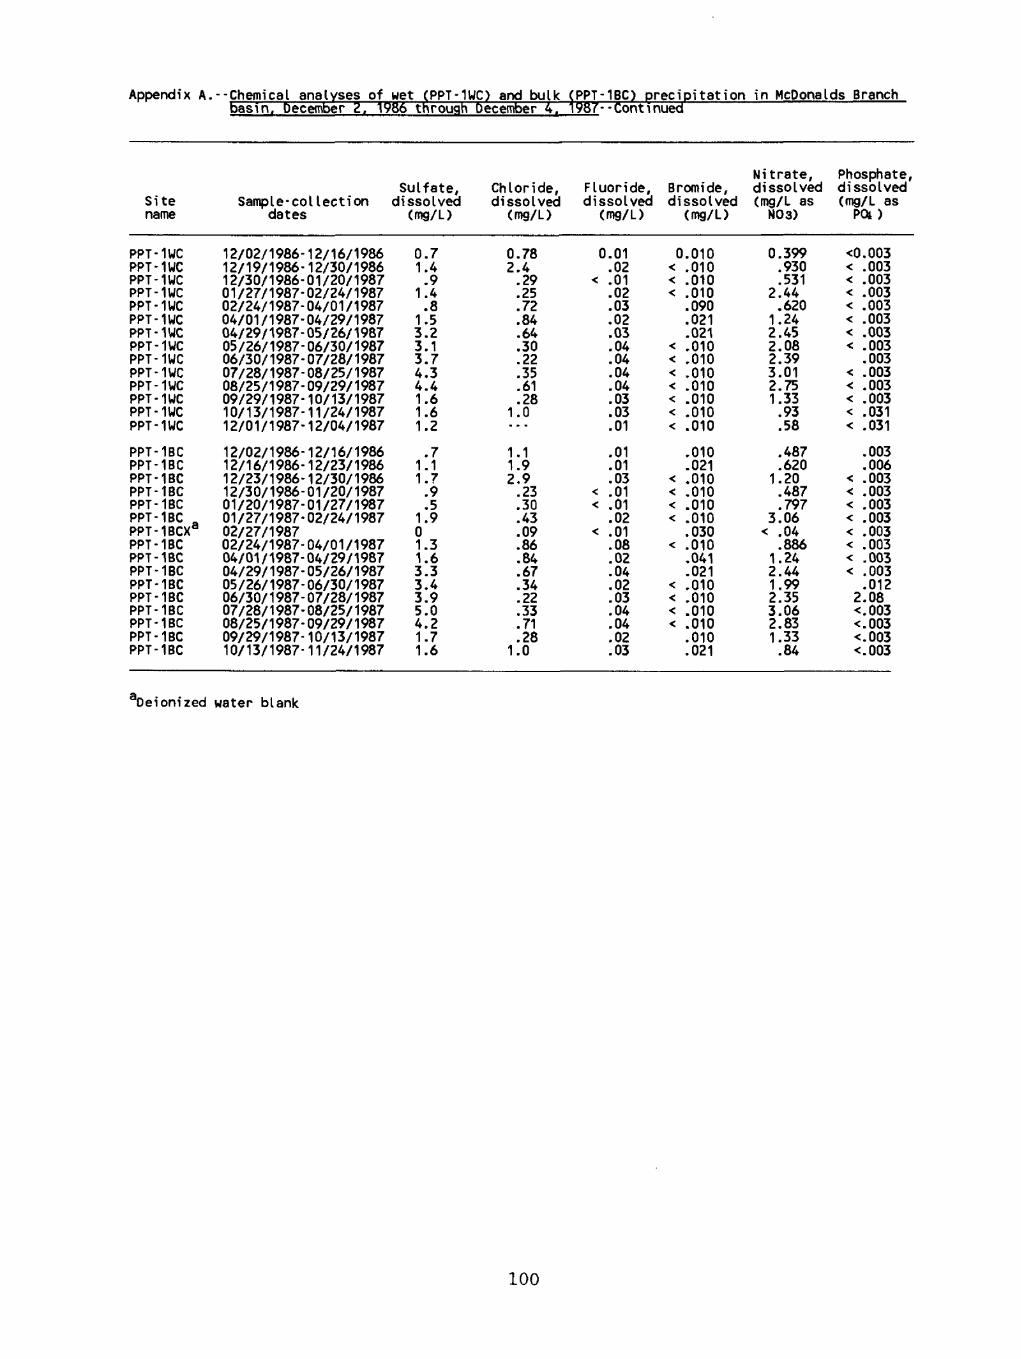
Appendix A
Sitename
PPT-1WCPPT-1WCPPT-1WCPPT-1WCPPT-1WCPPT-1WCPPT-1WCPPT-1WCPPT-1WCPPT-1WCPPT-1WCPPT-1WCPPT-1WCPPT-1WC
PPT-1BCPPT-1BCPPT-1BCPPT-1BCPPT-1BCPPT-1BC PPT-1BCX8PPT-1BCPPT-1BCPPT-1BCPPT-1BCPPT-1BCPPT-1BCPPT-1BCPPT-1BCPPT-1BC
.--Chemical analyses of wet (PPT-1WC) and bulkbasin. December 2. 1986 through December 4.
Sample-collectiondates
12/02/1986-12/16/198612/19/1986-12/30/198612/30/1986-01/20/198701/27/1987-02/24/198702/24/1987-04/01/198704/01/1987-04/29/198704/29/1987-05/26/198705/26/1987-06/30/198706/30/1987-07/28/198707/28/1987-08/25/198708/25/1987-09/29/198709/29/ 1 987 - 1 0/ 1 3/ 1 98710/13/1987-11/24/198712/01/1987-12/04/1987
12/02/1986-12/16/198612/16/1986-12/23/198612/23/1986-12/30/198612/30/1986-01/20/198701/20/1987-01/27/198701/27/1987-02/24/198702/27/198702/24/1987-04/01/198704/01/1987-04/29/198704/29/1987-05/26/198705/26/1987-06/30/198706/30/1987-07/28/198707/28/1987-08/25/198708/25/1987-09/29/198709/29/1987-10/13/198710/13/1987-11/24/1987
Sulfate,dissolved
(mg/L)
0.71.4.9
1.4.8
1.53.23.13.74.34.41.61.61.2
.71.11.7.9.5
1.901.31.63.33.43.95.04.21.71.6
Chloride,dissolved
(mg/L)
0.782.4.29.25.72.84.64.30.22.35.61.28
1.0
1.11.92.9.23.30.43.09.86.84.67.34.22.33.71.28
1.0
(PPT-1BC) precipitation in McDonalds Branch1987 --Continued
Fluoride,dissolved
(mg/L)
0.01.02
< .01.02.03.02.03.04.04.04.04.03.03.01
.01
.01
.03< .01< .01
.02< .01
.08
.02
.04
.02
.03
.04
.04
.02
.03
Bromide,dissolved
(mg/L)
0.010< .010< .010< .010
.090
.021
.021< .010< .010< .010< .010< .010< .010< .010
.010
.021< .010< .010< .010< .010
.030< .010
.041
.021< .010< .010< .010< .010
.010
.021
Nitrate,dissolved(mg/L asN03)
0.399.930.531
2.44.620
1.242.452.082.393.012.751.33.93.58
.487
.6201.20.487.797
3.06< .04
.8861.242.441.992.353.062.831.33.84
Phosphate,dissolved(mg/L as
POt )
<0.003< .003< .003< .003< .003< .003< .003< .003
.003< .003< .003< .003< .031< .031
.003
.006< .003< .003< .003< .003< .003< .003< .003< .003
.0122.08<.003<-003<.003<-003
aDeionized water blank
100

from the Belfort event -recording rain gage at site PPT-'
[All values in inches; --, no data
DAY
12345678910111213141516171819202122232425262728293031
Total
DEC
0.001.80a.40.00.00.00.00.00
1.45.00.55.03.00.00.00.00.00
1.17b.00.00.00.00.00.35.60.00.00.00.00.00.00
6.35
JAN
0.002.25.05.00.00.00.00.00.00.22.03.00.00.00.08.00.00.95.93.18.00
1.05.10.00.00.83.00.00.00.18.02
6.87
FEB
0.00.04.00.00.00.00.00.00.40.00.00.15.00.00.00.00.00.00.00.00.00.00
1.23.00.00.00.00.00 - -
1.82
MAR
0.88.00.00.00.00.00.00.00.00.00.00.20.18.00.00.00.00.00.00.00.02.05.00.00.02.00.00.55.00.00
1.43
3.33
APR
0.00.00.00
2.60.25.50.05.00.00.00.00.05.00.00.00.05.82.00.05.00.00.00.00.13.35.00.00.10.17.00
5.12
MAY
0.00.20.20
1.05.05.00.00.05.00.00.00.28.00.00.10.00.00.00.15.58.22.03.00.00.00.00.13.00.00.00.00
3.04
JUNE
0.00.00.00.00.90.00.02.00.00.00.00.00.00.50.00.00.00.00.00.00.10.05.65.00.00.18
1.08.00.00.00
3.48
1WC
because date not included in month]
JULY
0.002.35.05.00.45.00.03.20.30.00.58.00.00
1.20.25.00.00.00.00.00.00.00.00.00.00.00.00.00.00
2.10.50
8.01
AUG
0.00.00.00.00.05.20.00.00
1.103.15.00.00.14.00.00.00.00.00.00.00.00.10.00.00.00.00.80.50.35.00.00
6.39
SEPT
0.68.00.00.00.00.00.00.20.05.00.00.00.25.00.00.03.00.45.10.05.00.45.00.00.05.00.00.00.00.00--
2.31
OCT
0.00.00.50
1.08.00.00.40.00.00.00.00.00.00.00.00.00.00.00.00.00.05.00.00.00.00.00.00
1.00.00.00.00
3.03
NOV
0.00.00.00.00.00.00.00.00.00
1.10.53.00.00.00.00.00.00.13.00.00.00.00.00.00.00.00.00.00.75.38
2.89
DEC
0.00.00.00.05.00.00.00.00.00.05.50.00.00.00.75.05.00.00.00.38.00.00.00.00.20.20.00.00.33.00.02
2.53
JAN
0.00.00.68a.00.00.00.00.60.00.00.00.00.03.00.00.00.00.35.00.78.00.00.00.00.50.10.00.00.00.00.00
3.04
FEB
0.00.50.20.45.00.00.00.00
8Estimate, but agrees well with Lebanon State Forest Data (Christian Bethman, Lebanon State Forest auperintendent, written commun., October 1988).
Rain-gege pens malfunctioned. Used data from Lebanon State Forest (Christian Bethman, Lebanon State Forest Superintendent, written commun., October 1988).
101

Appendix C.--Chemical analyses of surface water at site S-1 in the hardwood swamp at McDonalds Branch basin. November 25. 1986 through June 28. 1988
[°C, degrees Celsius; /iS/cm, microsiemens per centimeter at 25 degrees Celsius; mg/L, milligrams per liter; M9/L, micrograms per liter; ---, indicates missing data; <, indicates value below reporting limit]
Sample- Site collection name date
S-1 11/25/1986 S-1 12/30/1986s-s-s-s-s-s-s-s-s-s-s-s-s-s-s-s-s "
01/28/198702/24/198704/01/198704/30/198705/26/198708/25/198709/29/198710/29/198711/24/198712/22/198701/26/198802/23/198803/29/198804/26/198804/26/198805/31/198806/28/1988
Temper ature
6.0 .5
2.0.2
7.012.015.016.522.07.93.62.81.83.27.410.810.817.817.9
Specific pH conductance
(units) (/iS/cm) Field Lab Field Lab
3.643.903.733.643.783.854.034.193.98...3.783.873.813.873.953.954.094.08
3333333334333333433
.65 141
.70 120
.77 112
.80 109
.80 85
.83 85
.93 73
.93 74
.99 58
.04 56
.92 72
.83 83
.82 92
.82 76
.85 92
.89 81
.01 81
.96 69
.95 76
130 1079192837566746357688982827470706373
Dissolved Alkalinity oxygen (mg/L as (mg/L) CaCOa)
5.2 8.1
5.87.64.21.21.0...1.93.86.510.88.15.43.04.70.70.8
<0
<<<<<<<<<<<<<<<<*
.5
.5
.5
.5
.5
.5
.5
.5
.5
.5
.5
.5
.5
.5
.5
.5
.5
.5
.5
Dissolved organic carbon (mg/L)
22 292118262428
1106732122120192218183696
Sample- Site collectionname dates
S-1 11/25/1986S- 1 12/30/1986S-1 01/28/1987S-1 02/24/1987S-1 04/01/1987S-S-s-s-
1 04/30/19871 05/26/19871 08/25/1987
09/29/1987S-1 10/29/1987S- 1 11/24/1987S-1 12/22/1987S-S-
01/26/198802/23/1988
S-1 03/29/1988S-S-S-
04/26/198804/26/198805/31/1988
S-1 06/28/1988
Calcium, dissolved
(mg/L)
0.89.64.41.61.37.37.23
.32
.33
.39
.66
.61
.53
.69
.40
.41
.25
.46
Magnesium dissolved(mg/L)
0.57.35.29.60.21.19.12
.17
.20
.27
.35
.33
.29
.28
.21
.21
.13
.23
, Sodium, dissolved(mg/L)
2.72.11.84.21.61.71.7
1.81.42.02.01.91.91.92.01.91.92.2
'otassium, dissolved(mg/L)
0.14.02.05.18.05.04.16....33.08.15.25.07.05.09.13.13.31.36
Ammonium,dissolved (mg/L as
NH4)
0.027.032.024.042.078.064.087....108.001.014
< .003< .001
.042
.027
.028
.028
.035
.240
Aluminum, Iron, dissolved dissolved(M9/D
1,3001,2001,100920930790900
1,700710
600790760710550540830
(M9/D
1,
2,
1,
2.11;
820370770560830670900
620100520640140770840610610900000
Manganese, dissolved(M9/D
2914121410118
2017152115128
111299
Sample-Site collectionname dates
Sulfate,dissolved(mg/L)
Chloride,dissolved(mg/L)
Fluoride,dissolvec(mg/L)
BromideNitrate,
. dissolveddissolved (mg/L as(mg/L) NOa)
Phosphatedissolvec(mg/L asas POj )
iS i 1 i ca
dissolved(mg/L)
S-1S-1S-1S-1S-1S-1S-1S-1S-1S-1S-1S-1S-1S-1S-1S-1S-1S-1S-1
11/25/198612/30/198601/28/198702/24/198704/01/198704/30/198705/26/198708/25/198709/29/198710/29/198711/24/198712/22/198701/26/198802/23/198803/29/198804/26/198804/26/198805/31/198806/28/1988
242221198.56.02.70.40.32.15.98.98.58.67.25.65.72.70.9
5.65.13.55.22.52.63.33.64.54.54.34.63.23.13.34.03.73.64.7
0.10< .10< .10< .10
.03
.05
.10< .01
.04
.05
.05
.10
.07
. 12< .05a
.06
.06
.05< .01
0.030.074.071.034
< .010< .010< .010
.110
.10
.050
.030< .010< .010< .010< .05< .01< .01< .01< .01
<0.4< .4< .4< .4
.13
.89< .044< .044< .044< .044< .044< .044< .044< .044< .221 a< .044< .044< .044< .044
0.006< .003< .003< .003< .003< .003< .003< .003< .003
.13
.015
.006< .003< .006
.006< .003< .003< .003
.015
4.93.32.92.92.42.53.4
7.24.94.73.83.22.82.93.03.03.75.7
a Change in laboratory procedure resulted in a higher reporting limit for these constituents.
102

Appendix D.--Stage measurements at McDonalds Branch basin. November 25. 1986 through June 1. 1988
[MP, altitude of measuring point, provided for sites that were resurveyed in 1988. Original surveys in 1985 were used in Lord and others, (1990).]
Date of measurement
Water- surf ace altitude
(feet above sea level)
Date of measurement
Water- surf ace altitude (feet above sea level)
Hardwood-swamp staff gage, site SG-H Open-channel staff gage, site SG-OC
11/25/1986 12/30/1986 01/28/1987 02/24/1987 03/31/1987 04/01/1987 04/10/1987 04/30/1987 05/27/1987 05/28/1987 06/30/1987 07/28/1987 07/30/1987 08/25/1987 09/29/1987 09/30/1987 10/08/1987 10/29/1987 11/24/1987 12/22/1987 01/26/1988 01/28/1988 03/29/1988 03/30/1988 04/26/1988
132.34 132.32 FROZEN 132.43 132.72 132.52 132.40 132.37 132.29 132.28 132.10 131.95 131.88 132.14 132.07 132.11 132.32 132.40 132.40 132.43 FROZEN 132.62 132.51 132.47 132.40
04/04/1987 07/30/1987 09/30/1987 10/08/1987 11/23/1987 01/26/1988 03/29/1988 MP
TOO DEEP126.29126.31126.46126.39126.77126.71125.089
Cedar-swamp staff gage, site SG-CQ
01/28/1987 02/24/1987 05/28/1987 07/29/1987 09/29/1987 11/24/1987 01/27/1988 03/29/1988 06/01/1988 MP
FROZEN FROZEN 125.20 125.12 125.24 125.08 FROZEN 125.23 125.14 124.639
103

Appendix E.--Chemical analyses of ground water at sites OWC-1A, QWH-1A. QWO-3A and QWH-4A in HcDonalds Branch basin. November 26. 1986 through June 1. 198g
t°C, degrees Celsius; ^S/cm, microsiemens per centimeter at 25 degrees Celsius; mg/L, milligrams per liter; Mg/L, micrograms per liter; ---, indicates missing data; <, indicates value below reporting limit]
Site name
QWC-1AQWC-1AQWC-1AQWC-1AQWC-1AQWC-1AQWC-1AQWC-1AQWC-1AQWC-1AQWC-1A
QWH-1AQWH-1AQWH-1AQWH-1AQWH-1AQWH-1AQWH-1AQWH-1AQWH-1AQWH-1AQWH-1A
QWH-4AQWH-4AQWH-4AQWH-4AQWH-4AQWH-4AQWH-4AQWH-4AQWH-4AQWH-4AQWH-4A
QWO-3AQWO-3AQWO-3AQWO-3AQWO-3AQWO-3AQWO-3AQWO-3AQWO-3AQWO-3AQWO-3AQWO-3A
Sample- collection
date
11/26/198601/28/198704/01/198705/28/198707/29/198709/30/198711/25/198701/27/198803/30/198806/01/198806/01/1988
11/25/198601/28/198703/31/198707/28/198709/29/198710/14/198711/24/198701/26/198803/29/198805/31/198805/31/1988
11/25/198601/28/198704/01/198705/28/198707/28/198709/29/198711/24/198701/26/198803/29/198805/31/198805/31/1988
11/25/198601/27/198704/01/198705/27/198707/29/198709/30/198710/14/198711/24/198701/27/198803/30/198806/01/198806/01/1988
Temper ature
12.09.08.510.412.514.011.38.68.410.710.7
10.04.08.018.016.513.39.13.26.515.015.0
13.011.010.010.412.014.512.710.110.011.111.1
13.0
9.010.012.514.013.412.710.09.410.910.9
pH (units)
field lab
4.254.404.754.734.704.674.704.744.764.844.89
3.643.753.753.883.863.944.004.014.004.064.06
4.684.62...
4.754.774.744.774.804.805.015.01
4.004.544.20
4.484.474.514.494.534.584.364.36
5.085.125.204.885.224.954.844.955.044.835.14
3.793.883.893.843.833.843.984.203.893.953.85
5.004.874.784.934.884.944.804.924.934.93
4.574.614.574.574.534.494.514.524.554.574.534.56
Specific conductance (MS/cm)
field lab
4338404439363333353438
9580828078766772879595
3027323440423842485050
443145454848504749565555
4335403844333432323433
10083817878746671677372
3635333537394042434545
464646474747495150495151
Dissolved oxygen (mg/l)
0-111387311
100001
6
10107877999
7-8910101099101010
.9
.0
.0
.9
.2
.8
.3
.8
.0
.2
.4
.7
.5
.3
.5
.2
.9
.3
.4
.4
.6
.1
.1
.8
.9
.2
.4
.0
.1
.1
.3
.2
.4
.5
.0
.1
.3
.4
.1
.3
.3
Dissolved Alkalinity organic (mg/L as carbon CaCOs) (mg/L)
<0.5< .5< .5< .5< .5< .5< .5< .5< .5< .5< .5
< .5< .5< .5< .5< .5< .5< .5< .5< .5< .5< .5
< .5< .5< .5< .5< .5< .5< .5< .5< .5< .5< .5
< .5< .5< .5< .5< .5< .5< .5< .5< .5< .5< .5< .5
11
21
11
1519184354483920242828
11
21
111
121131
1111111
.0
.1
.9
.7
.2
.1
.7
.8
.9
.3
.5
.1
.3
.8
.8
.2
.3
.9
.9
.5
.9
.2
.4
.3
.1
.0
.1
.6
.4
.0
.2
.7
.6
104

Appendix
Sitename
QWC-1AQWC-1AOUC-1AQWC-1AQWC-1AQWC-1AQUC-1AQUC-1AQUC-1AQUC-1AQWC-1A
QUH-1AQUH-1AQWH-1AQWH-1AQUH-1AQUH-1AQUH-1AQUH-1AQUH-1AQWH-1AQUH-1A
QUH-4AQWH-4AQUH-4AQUH-4AQUH-4AQWH-4AQWH-4AQWH-4AQWH-4AQWH-4AQWH-4A
QWO-3AQWO-3AQWO-3AQUO-3AQUO-3AQWO-3AQWO-3AQUO-3AQUO-3AQWO-3AQWO-3AQWO-3A
E. --Chemical analyses of groundBranch basin. November 26.
Sample- collection
date
11/26/198601/28/198704/01/198705/28/198707/29/198709/30/198711/25/198701/27/198803/30/198806/01/198806/01/1988
11/25/198601/28/198703/31/198707/28/198709/29/198710/14/198711/24/198701/26/198803/29/198805/31/198805/31/1988
11/25/198601/28/198704/01/198705/28/198707/28/198709/29/198711/24/198701/26/198803/29/198805/31/198805/31/1988
11/25/198601/27/198704/01/198705/27/198707/29/198709/30/198710/14/198711/24/198701/27/198803/30/198806/01/198806/01/1988
Calcium, dissolved
(mg/L)
.2
.1
.1
.0
.0
.86
.78
.80
.83
.83
.83
.47
.46
.49
.4
.44
.41
.34
.37
.37
.38
.38
.6
.4
.2
.1
.6
.82.22.11.91.81.8
1.11.11.11.11.1.1.1.1.2.2.2
1.2
Magnesiunr dissolved(mg/L)
1.31.11.11.01.0.84.81.77.82.79.80
.30
.32
.28
.21
.21
.21
.19
.21
.22
.22
.21
.51
.40
.36
.33
.55
.59
.66
.67
.62
.56
.56
.36
.35
.34
.36
.37
.35
.37
.36
.34
.34
.35
.34
water at sites QUC-1986 through June 1.
, Sodium, dissolved(mg/L)
2.52.12.22.32.11.91.91.91.81.81.8
2.42.01.91.91.91.81.72.02.02.02.1
1.6.5.4.9.9.8
1.72.22.52.52.5
1.71.71.72.02.02.12.22.52.72.62.42.6
Potassiurr dissolved(mg/L)
0.52.40.45.46.44.25.36.39.40.32.34
.14
.07
.09
.15
.27
.16
.11
.13
.14
.11
.11
.28
.18
.18
.21
.31
.39
.33
.38
.35
.27
.27
.19
.16
.22
.17
.17
.22
.18
.15
.19
.19
.14
.14
1A, QWH-1A. QWO-3A and QUH-4A in McDonalds1988 --Continued
Ammonium,, dissolved
(mg/L asNH4)
0.027.013.039.023.005
< .003< .003< .001
.005< .003< .003
.167
.108
.141
.30
.334
.309
.334
.270
.284
.270
.26
.017
.006
.002
.017
.003
.008< .003< .001
.012
.002< .003
.014
.019
.015
.009< .002
.017< .003< .003< .001
.015< .003< .003
Aluminum, dissolved(Mg/D
219180230220180180
180190190190
7501,000920
1,6001,9001,800
...910890978990
369550560520380310
310430440450
9501,1001,1001,1001,000910890...970
1,0001,0201,010
Iron, dissolved
(M9/L)
14115
197
10728319
5,0003,0002,9003,600
3703,6003,1003,3003,4003,2003,100
24235
881517578
106
333846
441610113
1436
Manganese, dissolved(M/L)
3834403541363225252728
1215191519188
1191513
92737
649598
11011099100100
868582848687899391869089
105

Appendix E.- Chemical analyses of ground water at sites QWC-1A, QWH-1A. QWO-3A and QWH-4A in HcDonalds Branch basin. November Z6. 1986 through June I. 1988--Continued
Nitrate, Phosphate,Sample Sulfate, Chloride, Fluoride, Bromide, dissolved dissolved Silica,
Site collection dissolved dissolved dissolved dissolved (mg/L as (mg/L as dissolved name date (mg/L) (mg/L) (mg/L) (mg/L) N03) Put) (mg/L)
QWC-1AQWC-1AQWC-1AQWC-1AQWC-1AQWC-1AQWC-1AQWC-1AQWC-1AQWC-1AQWC-1A
QWH-1AQWH-1AQWH-1AQWH-1AQWH-1AQWH-1AQWH-1AQWH-1AQWH-1AQWH-1AQWH-1A
QWH-4AQWH-4AQWH-4AQWH-4AQWH-4AQWH-4AQWH-4AQWH-4AQWH-4AQWH-4AQWH-4A
QWO-3AQWO-3AQWO-3AQWO-3AQWO-3AQWO-3AQWO-3AQWO-3AQWO-3AQWO-3AQWO-3AQWO-3A
11/26/198601/28/198704/01/198705/28/198707/29/198709/30/198711/25/198701/27/198803/30/198806/01/198806/01/1988
11/25/198601/28/198703/31/198707/28/198709/29/198710/14/198711/24/198701/26/198803/29/198805/31/198805/31/1988
11/25/198601/28/198704/01/198705/28/198707/28/198709/29/198711/24/198701/26/198803/29/198805/31/198805/31/1988
11/25/198601/27/198704/01/198705/27/198707/29/198709/30/198710/14/198711/24/198701/27/198803/30/198806/01/198806/01/1988
9.67.3
106.87.06.36.26.06.15.55.3
1210103.83.22.93.56.56.16.76.4
7.57.47.96.47.28.38.98.88.28.78.8
109.9129.29.79.69.39.8
10109.89.9
3.53.73.83.33.23.23.23.03.23.43.4
6.03.73.44.74.54.14.74.73.24.74.8
3.22.72.93.13.53.33.34.45.34.74.8
3.33.33.43.33.43.83.84.54.94.74.54.5
0.01.02.05.05.05.03.04.03
< .05a.03.05
.03
.04
.05
.06
.03
.02
.04< .01< .05 a
.05
.05
.04
.05
.07
.06
.05
.10
.06
.06< .05 a
.05
.05
.02
.04
.04
.04
.04
.04
.02
.0403< !os a.04.05
0.041.041.030.021.030.030.030
< -010=< .050a
.010< .010
.041
.030
.021
.080
.080
.100
.050
.041.< .050a< .010< .010
.030
.021
.021
.021
.021
.030
.030< .010=< .050a
.010< .010
.030
.021
.021< .010
.030
.030
.021
.030< .010=< .050a
.010< .010
0.093.044.133.133.177.182.133-133=
< .221 a.133.093
< .044< .044< .044< .044< .044
.132< .044< .044.< .221 a< .044< .044
.093
.044
.044
.132
.089
.182
.093
.093.
.221 a
.133
.093
< .044.044.044.088.093.093.182.093.093
< .221 a.093.093
<0.003< .003< .003< .003< .003
.006
.012< .003
.003< .003< .003
.039
.015
.028
.046
.046
.049
.074
.040
.049
.064
.064
< .003< .003< .003< .003< .003< .003
.009< .003< .003< .003< .003
< .003< .003< .003< .003< .003
.006
.009
.009< .003< .003< .003< .003
5.24.64.54.14.14.04.23.93.73.83.9
6.13.83.96.06.67.06.55.24.95.25.2
3.13.12.92.82.92.93.12.62.72.72.7
2.62.32.32.22.42.42.42.42.22.22.12.1
Change in laboratory procedure resulted in a higher reporting limit for these constituents.
106
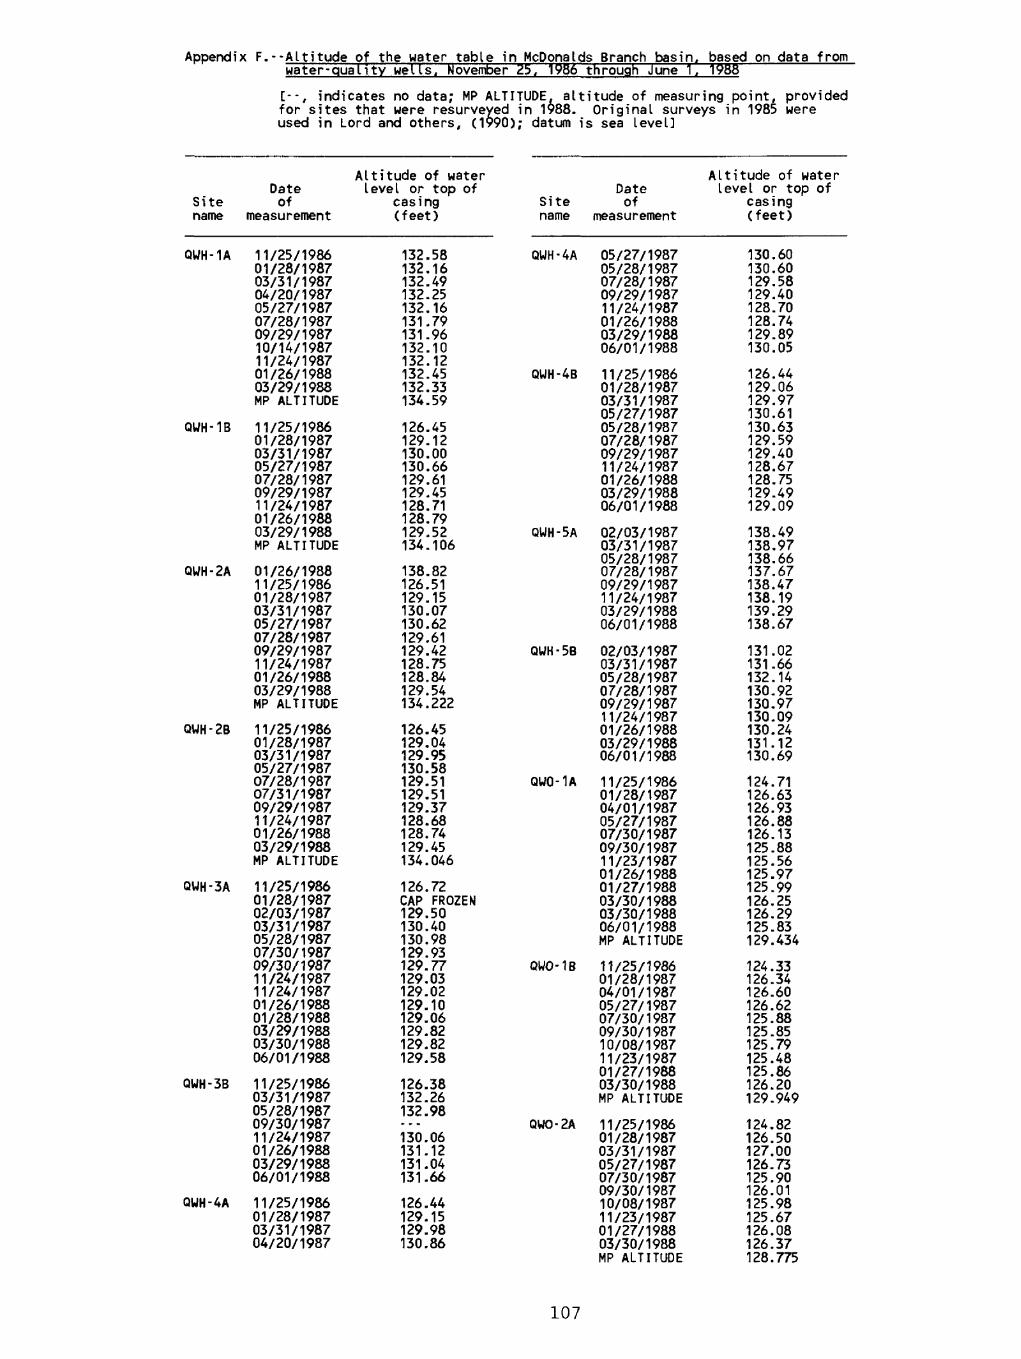
Appendix F.--Altitude of the water table in McDonalds Branch basin, based on data from water-quality wells. November Z5. 1986 through June 1. 1955
[--, indicates no data; MP ALTITUDE, altitude of measuring point, provided for sites that were resurveyed in 1988. Original surveys in 1985 were used in Lord and others, (1990); datum is sea level]
Site name
QWH-1A
QWH-1B
QWH-2A
QUH-2B
QUH-3A
QWH-3B
QWH-4A
Altitude of water Date level or top of of casing
measurement (feet)
11/25/198601/28/198703/31/198704/20/198705/27/198707/28/198709/29/198710/14/198711/24/198701/26/198803/29/1988MP ALTITUDE
11/25/198601/28/198703/31/198705/27/198707/28/198709/29/198711/24/198701/26/198803/29/1988MP ALTITUDE
01/26/198811/25/198601/28/198703/31/198705/27/198707/28/198709/29/198711/24/198701/26/198803/29/1988MP ALTITUDE
11/25/198601/28/198703/31/198705/27/198707/28/198707/31/198709/29/198711/24/198701/26/198803/29/1988MP ALTITUDE
11/25/198601/28/198702/03/198703/31/198705/28/198707/30/198709/30/198711/24/198711/24/198701/26/198801/28/198803/29/198803/30/198806/01/1988
11/25/198603/31/198705/28/198709/30/198711/24/198701/26/198803/29/198806/01/1988
11/25/198601/28/198703/31/198704/20/1987
132.58132.16132.49132.25132.16131.79131.96132.10132.12132.45132.33134.59
126.45129.12130.00130.66129.61129.45128.71128.79129.52134.106
138.82126.51129.15130.07130.62129.61129.42128.75128.84129.54134.222
126.45129.04129.95130.58129.51129.51129.37128.68128.74129.45134.046
126.72CAP FROZEN129.50130.40130.98129.93129.77129.03129.02129.10129.06129.82129.82129.58
126.38132.26132.98
130.06131.12131.04131.66
126.44129.15129.98130.86
Sitename
QWH-4A
QUH-4B
QUH-5A
QWH - 5B
QWO-1A
QUO-IB
QWO-2A
Altitude of water Date level or top of of casing
measurement (feet)
05/27/198705/28/198707/28/198709/29/198711/24/198701/26/198803/29/198806/01/1988
11/25/198601/28/198703/31/198705/27/198705/28/198707/28/198709/29/198711/24/198701/26/198803/29/198806/01/1988
02/03/198703/31/198705/28/198707/28/198709/29/198711/24/198703/29/198806/01/1988
02/03/198703/31/198705/28/198707/28/198709/29/198711/24/198701/26/198803/29/198806/01/1988
11/25/198601/28/198704/01/198705/27/198707/30/198709/30/198711/23/198701/26/198801/27/198803/30/198803/30/198806/01/1988MP ALTITUDE
11/25/198601/28/198704/01/198705/27/198707/30/198709/30/198710/08/198711/23/198701/27/198803/30/1988MP ALTITUDE
11/25/198601/28/198703/31/198705/27/198707/30/198709/30/198710/08/198711/23/198701/27/198803/30/1988MP ALTITUDE
130.60130.60129.58129.40128.70128.74129.89130.05
126.44129.06129.97130.61130.63129.59129.40128.67128.75129.49129.09
138.49138.97138.66137.67138.47138.19139.29138.67
131.02131.66132.14130.92130.97130.09130.24131.12130.69
124.71126.63126.93126.88126.13125.88125.56125.97125.99126.25126.29125.83129.434
124.33126.34126.60126.62125.88125.85125.79125.48125.86126.20129.949
124.82126.50127.00126.73125.90126.01125.98125.67126.08126.37128.775
107

Appendix F.--Altitude of the water table in McDonalds Branch basin, based on data fromwater-quality wells, November
Sitename
QUO-2B
QUO-3A
QUO-3B
QWC-1A
QUC-1B
QUC-2A
Dateof
measurement
11/25/198601/28/198709/30/198710/08/198711/23/198701/27/198703/30/1987MP ALTITUDE
11/25/198601/27/198702/03/198704/01/198705/27/198709/30/198710/14/198711/24/198701/27/198803/30/198806/01/1988
11/25/198609/30/198711/24/198701/26/198803/30/198806/01/1988
11/26/198601/28/198704/01/198705/28/198707/29/198709/30/198711/25/198701/26/198801/27/198803/30/198806/01/1988MP ALTITUDE
11/26/198601/28/198704/01/198705/28/198707/29/198709/30/198711/25/198701/27/198803/30/198806/01/1988MP ALTITUDE
11/26/198602/03/198704/01/198705/27/198707/29/198709/30/198710/08/198711/23/198701/26/198803/29/1988MP ALTITUDE
Altitude of waterlevel or top of
casing(feet)
124.39126.40125.91125.87125.55125.94126.27128.641
125.04127.25127.23127.73127.67126.77126.61126.25126.76127.19126.77
124.47
126.30128.52127.91128.09
124.32125.41125.58125.42125.16125.21125.08125.38125.38125.44125.18129.784
124.05125.86126.03125.90125.24125.16124.96125.38124.68125.35128.584
124.90125.77125.99125.86125.57125.64125.62125.42125.71125.83128.556
25. 1986 through June 1. 1988 --continued
Altitude of waterDate
Site ofname measurement
QWC-2B 11/26/198602/03/198704/01/198705/27/198707/29/198709/30/198710/08/198711/23/198701/26/198803/29/1988MP ALTITUDE
QWC-3A 01/28/198704/01/198705/27/198707/29/198709/30/198711/23/198701/26/198803/29/1988MP ALTITUDE
QWC-3B 11/26/198601/28/198704/01/198707/29/198711/24/198701/27/198803/29/198806/01/1988MP ALTITUDE
QUC-4 11/26/198601/28/198704/01/198705/27/198707/29/198709/30/198711/23/198701/26/198803/29/1988
QUC-5A 11/26/198602/03/198704/01/198705/27/198707/29/198709/30/198711/23/198701/26/198803/29/1988MP ALTITUDE
QWC-5B 11/26/198602/03/198704/01/198705/27/198707/29/198709/30/198711/23/198701/26/198803/29/1988MP ALTITUDE
level or topcasing(feet)
124.00125.77125.85125.85125.21125.23125.17124.95125.25125.61127.851
125.71125.93125.90125.24125.28124.91125.26125.63139.58
124.23126.03126.13126.53125.19125.56125.88125.61139.577
124.96126.91127.31127.38126.63126.46126.04126.10126.98
125.46126.96127.39127.16126.49126.40126.07126.38126.91133.947
123.75125.50125.58125.55124.93124.95124.63125.01125.31133.144
of
108

Appendix G.- Results of aluminum fractionation of surface-water, soil-water, and ground-water samples at McDonalds Branch basin. October t787
[mg/L, milligrams per liter; TAL, total reactive aluminum; TOAL, total organic aluminum; TIAL, total inorganic aluminum (TAL-TOAL); HAL. total monomeric aluminum; MOAL, organic monomeric aluminum; MIAL, inorganic monomeric aluminum (MAL-MOAL); UR, value below reporting limit; --, analysis not performed; pptn, parts per million]
Site or Aluminum,, sample dissolved name (mg/L)
Blank 0.1 ppm1 ppm3 ppm
S-1AS-1B
S-5
S-10 hS-10.2Ub
Pit-8-AuO
Pit-8-AuA
Pit-8-AuB
QUO-2A AQUO-2A B
QUO-2B
QUO-3A AQWO-3A B h QWO-3A.21T
QWH-8A
--
* *
.360, .370
.670
.090
-
.740
.860
1.800--
1.000
.890
--
1.200
TAL (mg/L)
0.0 .10
1.022.99
0.330.31
0.62
.09
.10
.34
.65
.97
1.621.62
1.04
.84
.85
.83
1.10
TOAL (mg/L)
0.02.04.02
.27
.29
.42
.11
.07
.19
.20
.18
1.561.56
.04
.04
.07
.04
.81
TIAL (mg/L)
0.08.98
2.97
.06
.02
.20
02 ***.03
.15
.45
.79
.06
.06
1.00
.80
.78
.79
.29
MAL (mg/L)
0.0 .10.97
3.03
.19
.22, .20
.43, .46
URUR
.32, .33, .31
.53, .60
.89
1.001.09
1.28, 1.19
1.141.08 .90
1.22, 1.22
MOAL (mg/L)
UR.01
" "
.15
.11
.25, .15
URUR
.10
.16, .16
.06
.89
.81
.01
.02
.08UR
.79
MIAL*
(mg/L)
0.100.96
, . **
.04
.10
.25
.22
.41
.83
.11
.20
1.22
1.131.07
.43
Analysis performed at U.S. Geological Survey National Water Quality Laboratory. Concentrations reported in micrograms per liter and converted to milligrams per liter in this table.
Sample filtered through 0.2 micrometer filter.
Concentrations of inorganic monomeric aluminum tended to be larger than concentrations of total inorganic aluminum. Also, concentrations of total monomeric aluminum sometimes tended to be larger than concentrations of total reactive aluminum.
Results of sample standards passed through ion exchange resin indicate that 0.01 to 0.04 ppm aluminum might have bled off from or passed through the column. Thus, MOAL and TOAL concentrations may be larger by as much as .04 ppm.
* Values near reporting limit--smallest concentration of standard was 0.1 ppm aluminum.
109

Appendix H.--Results of chemical analyses of surface-water, soil-water, and ground-water samples from McDonalds Branch basin. October 1987
[°C, degrees Celsius; nS/cm, microsiemens per centimeter at 25 degrees Celsius; mg/L, milligrams per liter; Mg/L, micrograms per liter; --, no data; <, less than]
Sitename
S-1S-1S-5S-10Pit-8- AuAPit-8-AuBQWO-2AQWO-2BQWO-3AQWH-8A
Samplecollection
dates
10/13/198710/13/198710/13/198710/13/198710/13/198710/13/198710/13/198710/14/198710/14/198710/14/1987
Spec i f i c pH conductance
Temperature (units)(°C)
9.09.09.010.5
15.012.813.414.3
Field
4.134.134.114.35
4.504.514.02
(«S/cm)Lab Field Lab
4.17 524.08 524.02 694.33 394.454.493.74 864.53 454.51 503.91 62
454858344242101444972
Alkalinity Dissolved (mg/L as Dissolved organicCaCOa)Lab
<0.5<0.5<0.5<0.5<0.5<0.5<0.5<0.5<0.5<0.5
oxygen(mg/L)
1.51.59.44.4
0.66.910.10.7
carbon(mg/L)
1819163.56.36.0471.7
1119
Sitename
S-1S-1S-5S-10Pit-8-AuAPit-8-AuBQWO-2AQWO-2BQWO-3AQWH-8A
Sample- collectiondates
10/13/198710/13/198710/13/198710/13/198710/13/198710/13/198710/13/198710/14/198710/14/198710/14/1987
Calcium, dissolved
(mg/L)
0.20.18.33.29
1.1.56.21.72
1.1.25
Magnesium dissolved
(mg/L)
0.11.11.15.32.26.17.20.33.37.16
, Sodium, dissolved
(mg/L)
1.41.41.51.61.31.01.91.82.21.9
Potassium, dissolved
(mg/L)
0.27.27.15.22.27.14.10.18.18.07
Ammonium,dissolved (mg/L as
NH 4 )
0.017.012.257.003.004
< .001.125
< .003< .003
.021
Aluminum, dissolved(Mg/D
37036067090740860180010008901200
I ron. Manganese, dissolved dissolved(Mg/L) (Mg/D
1500 81500 8990 11130 8680 23480 15
9200 1910 5110 89
2100 8
Sitename
S-1S-1S-5S-10Pit-8-AuAPit-8-AuBQWO-2AQWO-2BQWO-3AQWH-8A
Sample-col lectiondates
10/13/198710/13/198710/13/198710/13/198710/13/198710/13/198710/13/198710/14/198710/14/198710/14/1987
Sulfate,dissolved(mg/L)
1.01.02.43.18.58.4
128.89.36.0
Chloridedissolved
(mg/L)
4.14.24.64.22.93.03.73.33.83.3
, Fluoride,dissolved
(mg/L)
0.04.04.04.03.06.04.04.02.02.02
Bromide,dissolved(mg/L)
0.06.06.07.02.05.05.06.02.02.05
Nitrate,dissolved(mg/L asN0 3)
< 0.04.22.22.04
< .04.13.09.13.18
Phosphate,dissolved(mg/L asPC*)
<0.003.006
< .003< .003
.582
.138
.025< .003
.009
.015
110

Appendix I.--WATSTORE site-identification numbers and site descriptions for water-quality sites in HcDonalds Branch basin
Site WATSTORE site- name 1 identification number 2 Site description
Precipitation sites
PPT-1WC 395304074300931 Wet precipitation, cedar hill sitePPT-1BC 395304074300932 Bulk precipitation, cedar hill sitePPT-2W 395153074290731 Wet precipitation, Rogers Road site
Throughfall sites
TF-1C 395302074295021 Cedar-swamp forest
TF-2PB 395232074295421 Pine-oak forest (pitch pine/black oak)
TF-3H 395216074294121 Hardwood-swamp forest
TF-4PBJ 395203074283521 Pine-oak forest (pitch pine/blackjack oak)
Soil-water sites
PIT-8-AuA 395218074290212 Atsion sand, loamy substratum, A horizon PIT-8-AuB 395218074290213 Atsion sand, loamy substratum, B horizon
Surface-water sites
S-1 395216074294000 Surface water in hardwood swamp at well transect S-2 395220074294500 Surface water at hardwood swamp just upstream
from Butler Place RoadS-5 395250074295500 Surface water in middle of open channel at well transect S-10 01466500 Surface water at gaging station (collected by project personnel)
Ground-water sites
QWC-1A 395302074295001 Shallow well in cedar-swamp forest, cedar transect; NJUID 050837* QWC-1B 395302074295002 Deep well in cedar-swamp forest, cedar transect; NJUID 050838*
QWC-2A 395302074295101 Shallow lowland well in cedar transect; NJUID 050839* QWC-2B 395302074295102 Deep lowland well in cedar transect; NJUID 050840*
QWC-3A 395301074295301 Shallow upland well in cedar transect; NJUID 050841* QWC-3B 395301074295302 Deep upland well in cedar transect; NJUID 050842*
QWC-4 395300074295401 Shallow upland well in cedar transect; NJUID 050843*
QWC-5A 395302074295301 Shallow upland well in cedar transect; NJUID 050844* QWC-5B 395302074295302 Deep upland well in cedar transect; NJUID 050845*
QWO-1A 395250074295501 Shallow well in open chamel, open-channel transect; NJUID 050831* QUO-IB 395250074295502 Deep well in open channel, open-channel transect; NJUID 050832*
QWO-2A 395250074295503 Shallow lowland well in open-channel transect; NJUID 050833* QWO-2B 395250074295504 Deep lowland well in open-channel transect; NJUID 050834*
QWO-3A 395245074295201 Shallow upland well in open-channel transect; NJUID 050835* QWO-3B 395245074295202 Deep upland well in open-channel transect; NJUID 050836*
QWH-1A 395216074294101 Shallow well in hardwood-swamp forest, hardwood transect; NJUID 050846* QWH-1B 395216074294102 Deep well in hardwood-swamp forest, hardwood transect; NJUID 050847*
QWH-2A 395217074294101 Shallow lowland well in hardwood transect; NJUID 050848* QWH-2B 395217074294102 Deep lowland well in hardwood transect; NJUID 050849*
QWH-3A 395217074293701 Shallow upland well in hardwood transect; NJUID 050850* QWH-3B 395217074293702 Deep upland well in hardwood transect; NJUID 050851*
QWH-4A 395218074294001 Shallow upland well in hardwood transect; NJUID 050852* QWH-4B 395218074294002 Deep upland well in hardwood transect; NJUID 050853*
QWH-5A 395231074291501 Shallow well adjacent to clay lens underlying upland swamp; NJUID 051072* QWH-5B 395231074291502 Deep well adjacent to clay lens underlying upland swamp; NJUID 051073*
QWH-8A 395214074292101 Shallow in hardwood-swamp transect well; NJUID 050863*
* Site locations are shown in figure 2.z WATSTORE site identification number (latitude, longitude, and sequence number) is used for the U.S. Geological Survey WATSTORE computer storage and retrieval system.
* NJUID is the New Jersey unique well identifier.
Ill