weston public schools fy 2018 budget recommendation€¦ · · 2017-01-11weston public schools fy...
TRANSCRIPT

Weston Public Schools FY 2018 BudgetRecommendation
JANUARY 10, 2017
1

Executive Summary
The recommended budget reflects several months of careful work by District and School administrators to develop a financial plan for the 2017-18 Academic Year that simultaneously advances educational excellence and fiscal responsibility.
FY 2018 Operating Budget is $50,046,915
FY 2018 Operating Budget Increase is $1,357,200 or 2.79%
Tough Decisions – We identified significant reductions, which decreased the rate of growth from a roll-over figure of 4% to the recommended 2.79% increase.
2

Budget Review Timeline
Budget Presentation January 10, 2017
Q & A Session January 17, 2017
Q & A Session # 2 January 19, 2017
Board of Education Approval of Recommended Budget January 23, 2017
Board of Selectman Review February 7, 2017
Board of Finance Review March 8, 2017
Board of Finance Public Review March 29, 2017
Board of Finance Deliberations April 4, 2017
ATBM April 19, 2017
Budget Referendum April 27, 2017
3

Key Budget Driver: Enrollment
0
100
200
300
400
500
600
700
800
900
Pre-K Hurlbutt Hurlbutt Weston Intermediate Weston Middle School Weston High School
25
416
521585
814
28
431
499
570
810
Enrollment
FY 17 FY 18
-22 -15-4
4
Represents a net reduction of 26 students K-12
OrA net reduction of 23 students Pre-K-
12
+15
+3

Budget Summary
5
Contractual Increases, $1,062,764 , 48%
Health Insurance Increases, $510,376 ,
23%
New Investments, $455,736 , 21%
Enrollment Pressures, $156,712 , 7% State & Federal Aid
Reductions, $29,255 , 1%
Budget Summary
Contractual Increases Health Insurance Increases New Investments
Enrollment Pressures State & Federal Aid Reductions
Before reductions, the budget increase was$2,214,843.
After reductions of $857,643…
the total increase is $1,357,200.

Strategy and Goals
Framed by Weston’s Strategic Goals, the FY 2018 Operating Budget will accelerate the district as a place known for intellectual rigor and caring. Four goals are paramount:
◦ Developing Global Citizens
◦ Providing a Healthy Learning Environment
◦ Supporting Digital Learning
◦ Gauging Student Progress with Multiple Measures
In terms of maintaining excellence, the proposed budget ensures that:◦ Academic and co-curricular programs continue with the same robust offerings;
◦ Social, emotional and physical well-being is bolstered by ample staffing and support systems;
◦ Competitive class-sizes and adult: student ratios enable vital educational connections between professionals and students,
◦ The campus and facilities remain as attributes compared to other towns and districts.
6

Targeted InvestmentsWhile emphasizing fiscal efficiency, the administration identified five areas for targeted investments:
1. Digital Learning & Technology
2. Professional Learning & Growth
3. Healthy Learning Environment
4. Special Education
5. Strengthening Elementary Administrative Support for Schools
7

Investment Area # 1
8
DIGITAL LEARNING & TECHNOLOGY

Digital Learning & Technology
Digital Learning & Technology is the featured investment, with a new multi year financial and implementation plan designed to systemize previous and future work to blend digital resources in teaching and learning. The plan has five major elements:
1. Direct Access to Digital Devices
2. Comprehensive Staff Support
3. Implementing Learning Management System
4. Continuing Refresh Cycle for Technology
5. Changing Acquisition of Technology
9

Direct Access to Digital Devices (1:1)WIS, WMS & HES: Students have access to the same device
WIS – FY 2017
WMS – FY 2018
HES – FY 2019
Expand from current 3 iPads per classroom
◦ Effective Teacher Planning
◦ Better use of instructional time
Weston High School: Students have access to a variety of devices
◦ Under development for 2019
◦ Students have high availability of devices available for specific subjects they are taking. Allows for common teacher planning
◦ BYOD
◦ Encouraged as needed for specific courses or grades
◦ Students learn on a familiar device
◦ Students learn the technology that will be used in college
10
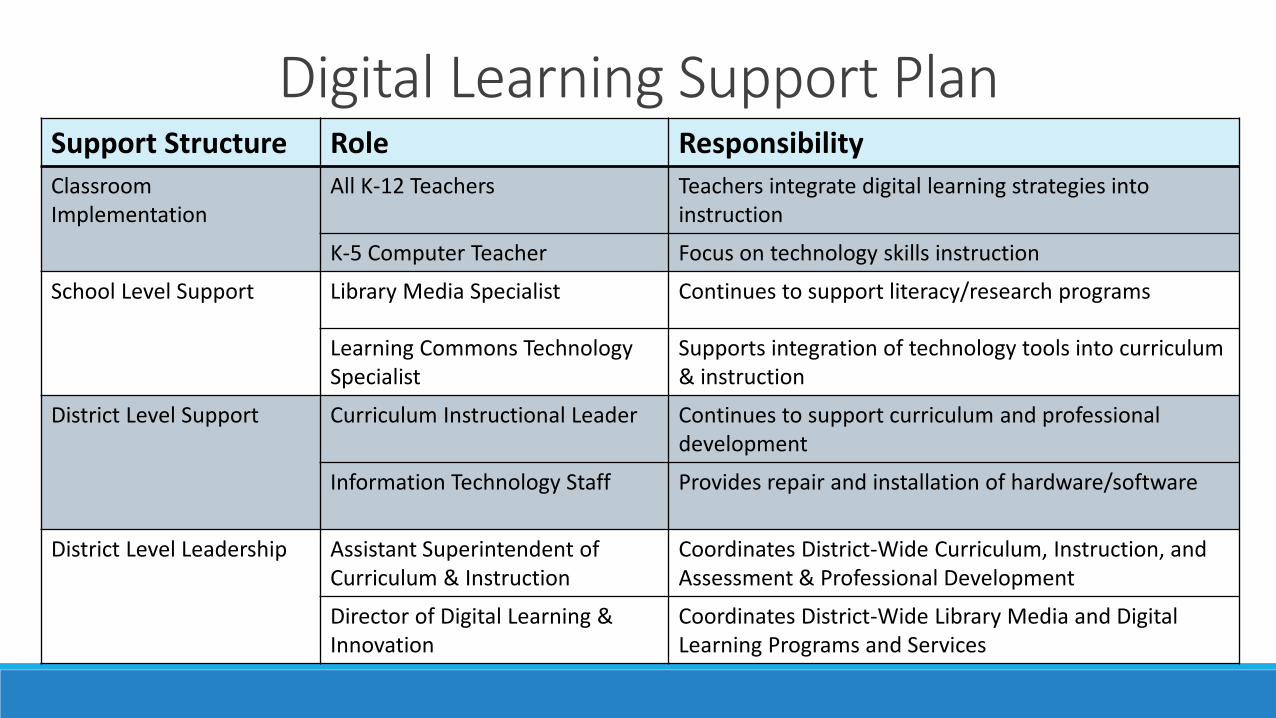
Digital Learning Support PlanSupport Structure Role Responsibility
ClassroomImplementation
All K-12 Teachers Teachers integrate digital learning strategies into instruction
K-5 Computer Teacher Focus on technology skills instruction
School Level Support Library Media Specialist Continues to support literacy/research programs
Learning Commons Technology Specialist
Supports integration of technology tools into curriculum & instruction
District Level Support Curriculum Instructional Leader Continues to support curriculum and professional development
Information Technology Staff Provides repair and installation of hardware/software
District Level Leadership Assistant Superintendent of Curriculum & Instruction
Coordinates District-Wide Curriculum, Instruction, and Assessment & Professional Development
Director of Digital Learning & Innovation
Coordinates District-Wide Library Media and Digital Learning Programs and Services

Implementing Learning Management System
Implementation of a Learning Management System (LMS) will allow for:
1. Provide the district with a digital platform for organizing, supporting and delivering curriculum and instruction.
2. Better communication with parents and students
3. Reduce the burden of updating a website for many teachers
12

Continuing Refresh Cycle for TechnologyThe “Refresh Cycle” ensures continued support of our current infrastructure, devices and systems used by students and staff. Specific elements include:
1. Access Points $21,000
2. Server Upgrades $15,000
3. Server Storage Upgrades $6,000
4. Staff Technology Replacement $46,250
5. SmartBoard Refresh Cycle $50,000
6. Weston High School iPads $12,000
7. Weston High School Laptop Replacement $9,600
Total: $159,850
Lease over 3 year period at a total estimated annual cost of $55,450 ($166,350 over three years).
13

Technology Lease vs. Cash
Current Technology Purchasing Practice: The district finances technology purchases over 4 years through a loan from a private bank such as TD Bank, Chase or First
Niagara.
These loans carry an interest rate that over the past 4 years have ranged from 1.66% to 2.14%
The operating budget under equipment rental contains 4 annual payments from 4 different leases. For example the FY 17 equipment rental contains: Lease Payment # 4 from FY 14
Lease Payment # 3 from FY 15
Lease Payment # 2 from FY 16
Lease Payment # 1 from FY 17
These loan payments from 4 different leases are what create the volatility in the operating budget along with the different interest rates associated with each loan.
From FY 14 to FY 17 the equipment rental line within the operating budget has increased 12.5% while actual purchases have increased only 3.7%.
That means the operating budget has increased $46,803 while funds available for purchasing have only increased 15,110.
14

Recommendation for Technology Equipment Purchasing
The phase out of borrowing funds from Private Banks to fund Technology Equipment, which is done by:
FY 18: Finance Infrastructure Refresh and Instructional Refresh over 3 Years instead of 4 years to time the last payment with FY 17 last bank payment in FY 20.
FY 18: Purchase New Instructional Equipment through Cash
Eliminate Interest Payments to Banks by the end of FY 2020
Create a long-term base budget of Technology Purchases of $435,000 of cash only starting in FY 2019 to allow implementation of 1:1 at HES in Future Years.
15

3 Year Technology Budget ProjectionFY 2017 Budget FY 2018 Request FY 2019 Projection FY 2020 Projection
Total Budget $1,732,351 $1,917,626 $2,056,276 $1,910,601
$ Increase $185,275 $138,650 $(145,675)
% Increase 10.73% 7.2% -7.1%
16
Assumptions:
The district will move towards cash purchasing of technology and shift away from borrowing funds and establish an annual technology budget for equipment of $435,000.
Staffing will remain flat until FY 2020 when 1 additional technician will be added due to change in the Phone System and the shift to 1:1
The district will implement a Hybrid PBX Phone System in FY 2020.
Software will increase by 3% per year with an investment in a data analysis software for assessments in FY 19.

Purchasing Power vs. Budget Request
$436,619 $435,000 $435,000
10.73%7.20%
-7.10%
-10.00%
-5.00%
0.00%
5.00%
10.00%
15.00%
20.00%
$400,000
$405,000
$410,000
$415,000
$420,000
$425,000
$430,000
$435,000
$440,000
FY 18 FY 19 FY 20
Purchasing Power vs. Budget Request
Purchasing Power Budget Request
17

Benefits of Changing Purchasing Methodology
Long-term Financial Savings:
Eliminates interest payments to banks and re-allocates those resources to direct purchases of items that impact the classroom. A typical lease pays approximately $27,520 of interest over the life of the lease. Under cash purchasing this interest can be re-directed to purchase technology.
For example, $27,520 would fully fund WHS Science Laptops, WMS and HES Visual Arts Technology and WHS Videography Purchases.
Future Base Budget Reductions: In FY 19 ($91,896), FY 20 ($125,400) and FY 21 ($166,585) we will be able to have base budget reductions to help limit further budgetary growth in the operating
budget as historical lease obligations extinguish.
Interest Rate Fluctuation: A 1% increase in interest rates will cost approximately an additional $11,000 over the life of each lease.
18
Fiscal Year Cash Purchase of Equipment
Lease Purchase of Equipment
Variance
2018 $332,219* $453,696 $(123,477)
2019 $435,000 $477,430 $(42,430)
2020 $435,000 $467,660 $(32,660)
2021 $435,000 $462,520 $(27,520)
2022 $435,000 $462,520 $(27,520)
$2,072,219 $2,323,826 $(251,607)
*Includes 3 year lease items of infrastructure and instructional refresh

Investment Area # 2
19
PROFESSIONAL LEARNING & GROWTH

Professional Learning & Growth
Funding would support curriculum and professional development in several core areas:1. Developing Global Citizens:
◦ Critical and Creative Thinking
◦ Effective Communications
◦ Literacy (Reading and Writing Instruction with Teachers College Assistance)
◦ Math
2. Revisions of the Science Curriculum to align with Next Generation Science Standards
3. Gauging Student Progress:◦ Use of data and information by teachers and school administrators to help improve student outcomes
4. Tri-State Consortium◦ Site visit to review writing program
5. Digital Learning Professional Development for teachers and administrators with the 1:1 initiative and implementation of the Learning Management System
20

Investment Area # 3
21
HEALTHY LEARNING ENVIRONMENT

Healthy Learning Environment
22
• Emotional Intelligence is a central element of Health Learning Environments• A three year plan is underway to incorporate district-wide the concepts and approaches of Emotional Intelligence
• FY 2017--training staff at WIS and WMS, as well as planning for District implementation. • FY 2018--training staff at HES and WHS, and begin implementation with students at WIS and WMS• FY 2019—begin implementation with students at HES and WMS, while continuing work at WIS and WMS• The roll-out plan is summarized in the following table.
Healthy Learning Environment
Emotional Intelligence Implementation Schedule
2016-2019
YearDevelopment Phase Implementation Phase
Schools Activity Schools Activity
2016-17 WIS, WMSTrain school-based teams and
faculties2017-18 HES, WHS WIS, WMS
Roll out to students
2018-19 HES, WHS

Healthy Learning Environment
23
Healthy Learning Environment also is addressed by increased scheduling flexibility for WHS juniors and seniors.
• The flexibility would be obtained by reducing credit requirements in Physical Education (PE).
In a plan supported by WHS administrators and teachers, and now under review by the Board of Education for
ultimate approval, the new requirements would reduce PE credits from 1.4 to 1.0, eliminating one quarter of class
time during the junior and senior years.
We currently are over the state requirement for PE, allowing us to make this reduction.
The change would provide juniors and seniors valuable choice and flexibility in their schedule, ideally mitigating
stress during an especially intense phase in high school.
We would encourage students to avail themselves of the weight room and dance/exercise room, so that exercise
would be encouraged as a life habit for stress management.
The change would provide a budget saving of 0.5 FTE.

Investment Area # 4
24
SPECIAL EDUCATION

Special Education Spending DRG A Comparison (FY 17)
DRG A District % of Budget
Ridgefield 16%
Westport 18%
New Canaan 19%
Weston 20%
DRG A Average 21%
Easton-Redding-Region 9
22%
Darien 23%
Wilton 25%
25
0%
5%
10%
15%
20%
25%
Ridgefield Westport NewCanaan
Weston DRG AAverage
ER9 Darien Wilton
SPED Spending as % of Budget
Ridgefield Westport New Canaan Weston DRG A Average ER9 Darien Wilton
Special Education Recommendations
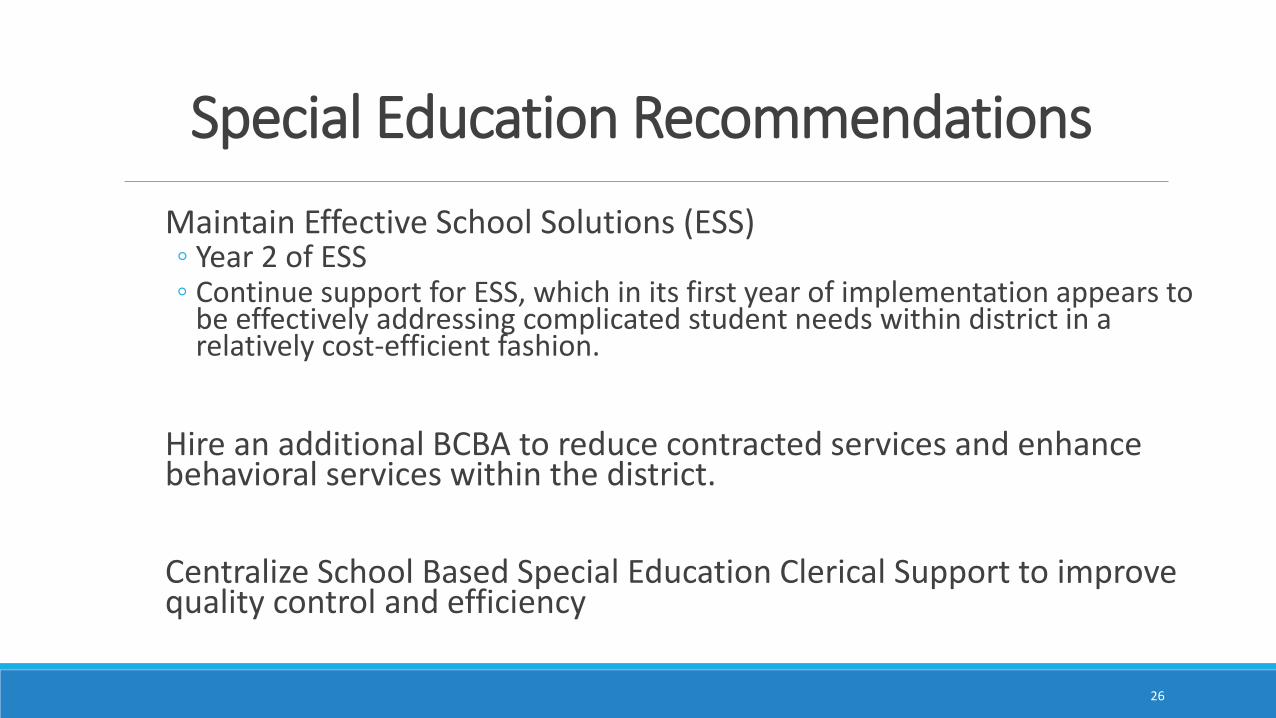
Maintain Effective School Solutions (ESS) ◦ Year 2 of ESS◦ Continue support for ESS, which in its first year of implementation appears to
be effectively addressing complicated student needs within district in a relatively cost-efficient fashion.
Hire an additional BCBA to reduce contracted services and enhance behavioral services within the district.
Centralize School Based Special Education Clerical Support to improve quality control and efficiency
26

Special Education Efficiencies & Reductions
Eliminate contracted services for Behavioral Services in Special Education and hire an additional BCBA employee.◦ Contracted Cost: $(150,000)
◦ BCBA (excluding health benefits) $83,206
◦ Net Savings: $(66,794)
Reduction in Special Education Tuition due to students either aging out or graduating◦ Tuition Reduction: $(349,366)
◦ Reduction of 2.0 FTE Para Educators (Excluding Health Benefits) $(78,400)
◦ Reduction in Excess Cost: $125,000
◦ Net Savings: $(302,766)
Eliminating School Based Special Education Secretary’s and creating 1 centralized Special Education Administrative Assistant based in WIS◦ Reduction of 1.3 FTE (Excluding Health Benefits) $(69,036)
◦ 1.0 FTE Centralized Administrative Assistant (Excluding Health Benefits) $53,346
◦ Net Savings: $(15,690)
Increase in IDEA Grant and Carry-over Funds available $(24,111)
Net Savings within Special Education: $(409,361)
27

Investment Area # 5
28
STRENGTHENING ELEMENTARY
ADMINISTRATIVE SUPPORT FOR SCHOOLS
Elementary Administrative Support
29
Recommend increasing the Assistant Principal position at Hurlbutt Elementary School from its current 0.6 FTE to 1.0 FTE. Three facts are
paramount:
1. The position was reduced when it was anticipated that Hurlbutt enrollment would be decreasing markedly. Instead, Pre-K through 2
enrollment is projected to increase to 459 in FY 2018.
2. Assistant principals play an essential role in instructional leadership, school climate and operations & management in our schools.
Several responsibilities address State mandated tasks, such as teacher evaluations, administration of PPTs (as part of SPED), bullying and
behavioral investigations, and Safe School Climate oversight.
3. DRG A schools with enrollment comparable to Hurlbutt all have a 1.0 FTE assistant principal.
• No elementary school in DRG A with more than 370 students has less than a 1.0 FTE assistant principal.
• With just a 0.6 FTE assistant principal at Hurlbutt, Weston has the third highest enrollment to assistant principal FTE ratio in DRG A,
with a 1:628 ratio compared to the average of 1:498 students.
• If Weston increases the Hurlbutt Assistant Principal to 1.0 FTE, we would drop to a 1:481 ratio, a position approximate to the DRG A
average.

Importance of Assistant Principals
30
Instructional Leadership
• Supervises and evaluates certified and non certified staff
• Conducts Teacher Evaluations*
• Conducts classroom walkthroughs
• Serves as an administrator for PPT’s*
School Climate
• Manages student discipline
• Conducts Bullying Investigations*
• Serves as Safe Climate Specialists*
• Serves at Title IX Coordinator
• Handles school related transportation issues (arrival, dismissal, behavior)
Operations
&
Management
• Creates school master schedules and duty roster
• Facilitates safety and security meetings and drills
• Serves as Tools for School Liaison
• Handles facility related requests and coordinates with Facilities Department.
• Serves as administrator in charge when principal is out of the building.
• Manages lunch and recess
*State mandated responsibilities that must be handled by an administrator.

DRG A Comparison for Elementary Assistant Principal
District School Enrollment Assistant Principal
Enrollment/AP FTE
Westport Coleytown 381 2 191
Westport Green Farm 383 2 192
Westport Saugatuck 488 2 244
Westport Kings Hwy. 501 2 251
Westport Long Lot 531 2 266
Wilton Miller Driscoll 730 2 365
Wilton Cider Mill 832 2 416
Darien Royle 433 1 433
Darien Ox Ridge 456 1 456
Darien Holmes 462 1 462
Darien Tokeneke 470 1 470
Darien Hindley 501 1 501
Weston WIS 521 1 521
New Canaan South 537 1 537
New Canaan East 544 1 544
New Canaan West 547 1 547
Ridgefield Veterans Park 299 0.5 598
Redding Redding 615 1 615
Ridgefield Barlow 322 0.5 644
Ridgefield Ridgebury 330 0.5 660
Ridgefield Farmingville 331 0.5 662
Easton Staples 665 1 665
Ridgefield Branchville 365 0.5 730
Weston Hurlbutt 441 0.6 735
Ridgefield Scotland 370 0.5 74031
No Elementary School with more than 370 students in DRG A has less than a FT Elementary Assistant Principal.
Hurlbutt has the 2rd highest Enrollment to FTE in DRG A) only behind Scotland Elementary in Ridgefield).
Hurlbutt Projected Enrollment in FY 18 is 459

Elementary Enrollment to Assistant Principal FTE
229
391
464 481 543
615 628665 672
498 498 498 498 498 498 498 498 498
100
200
300
400
500
600
700
800
900
100
200
300
400
500
600
700
800
900
Westport Wilton Darien Weston withChange
New Canaan Redding Weston Easton Ridgefield
Enrollment to FTE Average
32

HURLBUTT ELEMENTARY SCHOOL
Weston students begin their journey of learning at Hurlbutt Elementary School
33

Hurlbutt Elementary SchoolHighlights
Welcoming, Safe and Secure Educational Setting
Growing Enrollment – PreK-2 Increasing by 15 Students to 459
Restoration of Assistant Principal to 1.0 FTE –◦ Aligns position with essential role in Instructional Leadership, School Climate and Operations and Management of
School
◦ Aligns position with average adult: student ratios in DRG A districts
Robust intellectual work and support via Classroom Teachers, Interventionists and Para-Educator’s in reading, writing and math
Embedded digital resources and technology through Learning Resource Center and classrooms
Implement Emotional Intelligence Initiative for professionals (with expansion to students in subsequent year)
34
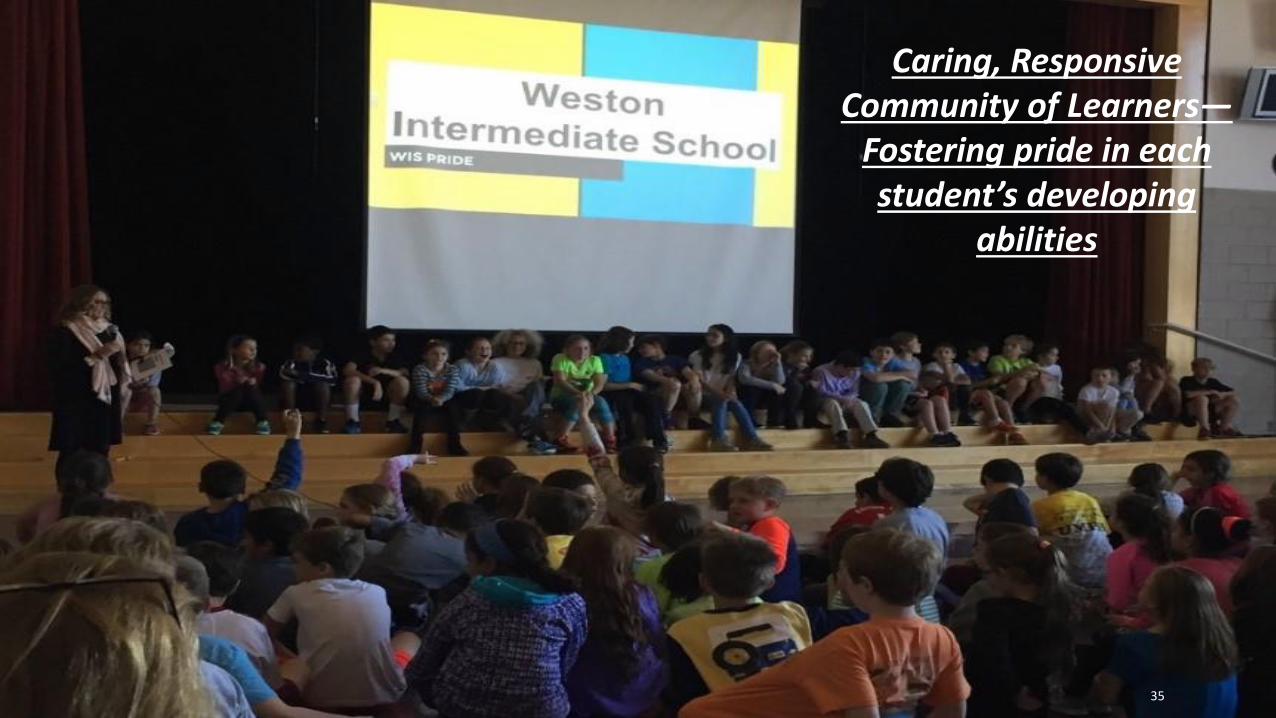
Caring, Responsive Community of Learners—
Fostering pride in each student’s developing
abilities
35

WESTON INTERMEDIATE SCHOOLHighlights
Highest Intellectual Development Priorities◦ Implementation of revised reading curriculum, aligned with current writing curriculum – within the Reading and Writing Workshop
model of instruction (Teachers College)
◦ Ongoing implementation of math curriculum
◦ Continuation of 1:1 Digital Learning as tool for robust teaching and learning
◦ Increased use of student data to provide individualized instruction
◦ Support 21st Century Skills by embedding AIM (Academic Innovation and Measurement) outcomes across curriculum
◦ Enrichment opportunities to extend learning beyond the classroom
Top Healthy Learning Environment Priorities◦ Implement Social-Emotional Learning (SEL) curriculum through Positive Behavioral Interventions and Supports (PBIS)
◦ Expansion of Emotional Intelligence Initiative from professionals to students
36
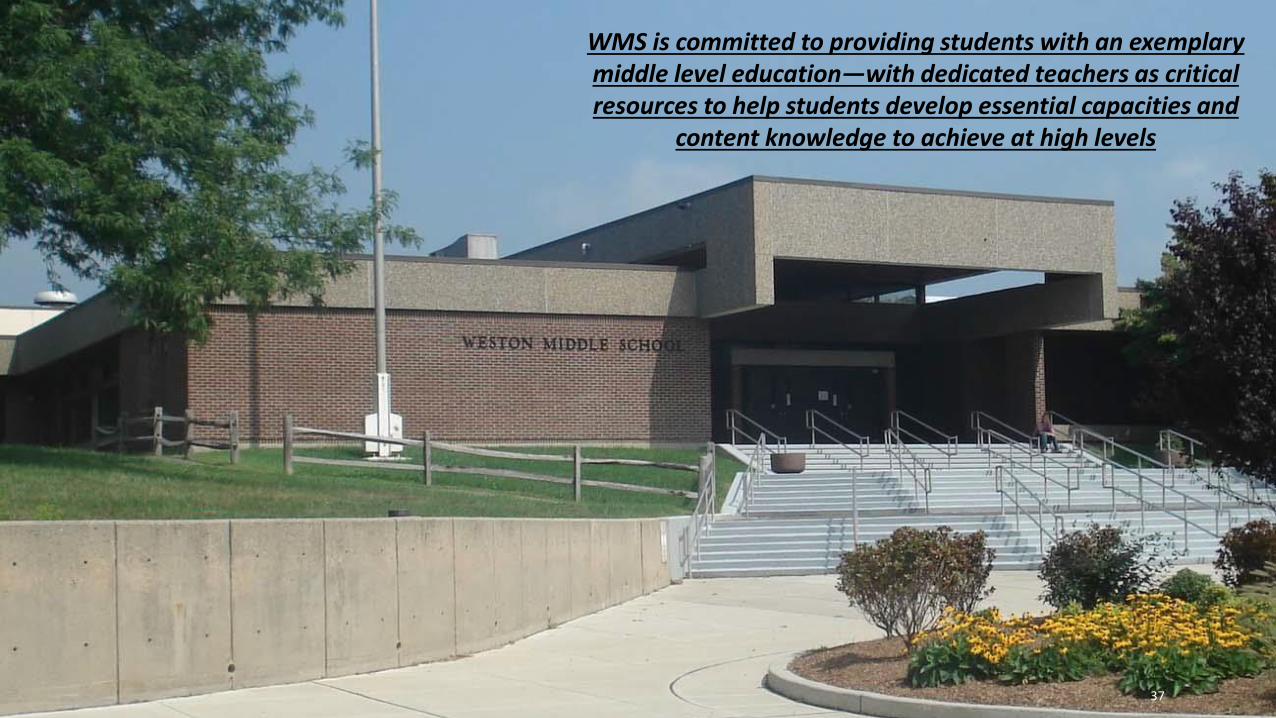
WMS is committed to providing students with an exemplary middle level education—with dedicated teachers as critical resources to help students develop essential capacities and
content knowledge to achieve at high levels
37

WESTON MIDDLE SCHOOLHighlights
WMS faculty & staff believe that middle school years are key to academic growth and social-emotional development.
Intellectual Development Priorities◦ Teaming model remains paramount as component of effective instruction, drawing on
interdisciplinary team that share same students for core academic subjects◦ Intervention and support programs will continue in reading, as well as Organization and Study Time◦ Practical and Fine Arts augment core academic work to develop critical thinkers, creative problem
solvers and effective communicators◦ Digital Learning & Technology
◦ Launch implementation of 1:1 digital tools for all grades to strengthen teaching and learning
Healthy Learning Environment Priorities◦ Expansion of Emotional Intelligence Initiative from professionals to students◦ Revision of Co-Curricular Programs to meet needs and interest of all students
◦ Added School Newspaper, Gay/Straight Student Alliance, and Chess Club
38

WESTON HIGH SCHOOLWeston High School focuses on rigorous instruction that will prepare students to graduate ready to thrive in an increasingly complex world. On several indexes, WHS repeatedly ranks as one of the premier secondary schools in Connecticut and nationally.
39

WESTON HIGH SCHOOLHighlights
Intellectual Development Priorities ◦ Continue comprehensive program of studies, including 19 AP courses and a wide range of challenging courses in all
academic disciplines
◦ Growing demand for Mandarin Chinese, Spanish and Project Lead the Way (pre-engineering)
◦ Continued support of digital citizens through integration of skills including critical thinking, communications, collaboration and innovative design
Healthy Learning Priorities◦ Alleviate student stress.
◦ Provide more open time during junior and senior years with modification of Physical Education requirement to better align with state and competing districts
◦ Implement Emotional Intelligence Initiative for professionals (with expansion to students in subsequent year)
Cross-Cutting Priority◦ Continue vigorous opportunities in Athletics, Visual and Performing Arts, co-curricular programs and Community Service
40
FY 2018 RECOMMENDED OPERATING BUDGET
41

Fiscal Year 2018 Recommended BudgetCategory Fiscal Year 2017 Fiscal Year 2018 % Increase
Salaries & Wages $30,768,762 $31,551,837 2.55%
Benefits $8,840,388 $9,395,674 6.28%
Professional Technical Services $1,365,721 $1,244,622 -8.87%
Property Services $2,017,657 $1,997,394 -1.00%
Other Services $4,017,133 $3,748,698 -6.68%
Supplies & Materials $2,505,289 $2,603,602 3.92%
Equipment $25,730 $306,917 1,093%
Other Objects $95,633 $101,083 5.70%
Revenue $(946,597) $(902,911) -4.62%
Total $48,689,715 $50,046,916 2.79%
42

Weston’s Historical Budget Appropriations
Fiscal Year Approved Budget $ Increase % Increase
2010 $43,975,602
2011 $44,697,024 $721,422 1.64%
2012 $45,166,337 $469,313 1.05%
2013 $45,587,192 $420,855 0.93%
2014 $45,575,418 $(11,774) -0.03%
2015 $47,364,855 $1,789,437 3.93%
2016 $48,503,782 $1,138,927 2.40%
2017 $48,689,715 $185,933 0.38%
43
Average 7 Year increase 1.47%Average 5 Year Increase 1.52%Average 3 Year Increase 2.24%
Excluding FY 2015 average increase in Weston’s Budget has been 1.06%

Contractual Budget Pressures (Excluding Insurance)
Contractual Budget Increases:
◦ WTA $587,778
◦ WAA $56,443
◦ AFSCME $143,760
◦ Unaffiliated $67,099
◦ FICA and Pension $80,452
◦ Transportation $30,653
◦ Shamrock, City Carting, Zenon Plant, CIRMA $28,003
◦ Electricity and Heating Expenses $68,576
Total Contractual Budget Increases $1,062,764
44

Impact of Increased EnrollmentEnrollment (2.0 FTE Teachers added in FY 17) $118,881
Kindergarten Para Educator due to enrollment $29,375
Team Leader Restoration $8,456
Total Budget Increase due to Enrollment: $156,712
45
Excludes Health Insurance

Impact due to Reduction in State and Federal Aid
ERATE Reduction $19,255
CEN (Internet) Reduction $10,000
Total $29,255
Current ECS Funding $381,480
State Reduction to ECS Funding $(118,049)
Remaining ECS Funding as of January 2017* $263,431
*Further Reductions Possible
46

Educational Cost Sharing (ECS)
Fiscal Year ECS Funding
FY 2018* $263,431
FY 2017 $263,431
FY 2016 $845,528
FY 2015 $948,564
FY 2014 $948,564
FY 2013 $948,564
FY 2012 $948,564
FY 2011 $948,564
FY 2010 $948,564
FY 2009 $948,564
47
$200,000
$300,000
$400,000
$500,000
$600,000
$700,000
$800,000
$900,000
$1,000,000
$1,100,000
$1,200,000
FY 2009 FY 2010 FY 2011 FY 2012 FY 2013 FY 2014 FY 2015 FY 2016 FY 2017 FY 2018
ECS Funding
ECS Funding
In FY $2017, Weston Public Schools received an ECS reduction of $464,048 or 55% of its total ECS Funding. This reduction resulted in budgetary cuts of:
• $248,620 of capital projects (Air Conditioning, Library Learning Commons)• $215,428 of operating expenses (Technology Integrator, Applications Specialists,
Groundskeeper, Supplies, Facilities Projects)*Projected ECS Funding

Budget Requests
Staffing Requests:
◦ Increase the Hurlbutt Assistant Principal to 1.0 FTE $55,374
◦ Additional FTE for Math Intervention at WIS $11,398
◦ Assistant Varsity Coaches (Cheerleading, Girls Basketball) $8,154
◦ Total Staffing Requests: $74,926
Technology Requests:
◦ 1:1 at Weston Middle School $210,705
◦ New Staff Technology and Science Laptops $51,000
◦ Visual Arts and Videography Technology $8,230
◦ Technology Refresh $55,450
◦ Learning Management System $20,123
◦ New Software (Tableu, Talent Ed, CABE Meeting Manager) $21,750
Total Technology Requests: $367,258
Other Requests:
◦ Easton Re-enactment Group, Magnetic Whiteboards, Cafeteria Table at HES, Wooden Art Benches at WHS, Minority Outreach $13,552
Total Other Requests $13,552
Total Requests $455,736
48

Personnel Reductions & Re-Allocation’sStaffing Reductions:
◦ Technology Integrators $(151,513 )
◦ Special Education Para Educators $(78,400)
◦ Eliminate 0.5 FTE copy center clerk and staff copy center with 1 individual $(29,869)
◦ Centralized Special Education Clerical Staff $(15,690)
◦ Technology Reorganization $(25,260)
◦ Security Reorganization $(65,984)
◦ Custodial/Maintenance Reorganization $(1,592)
◦ 0.15 FTE Certified Staff Reduction at WHS $(21,526)
◦ 0.46 FTE Clerical Staff Reduction at WHS $(21,479)
Total Staffing Reductions: $(411,313)
Staffing Re-Allocations:
◦ Staff Accountant Re-allocated from Business Office to Weston High School $0
◦ Copy Center Clerk Re-allocated from Copy Center to Weston High School $46,418
◦ Transfer Special Education Clerical to Copy Center $0
Total Staffing Re-allocations: $46,418
49

Additional ReductionsSpecial Education Reductions:
Special Education Out of District Tuition $(224,366)
Special Education Contracted Services◦ Reduction to Contracted Services (CCCD) $(150,000)◦ Additional BCBA $83,206Total Special Education Contracted Services Reduction: $(66,794)
Total Special Education Reductions: $(291,162)
Revenue Increases:• IDEA Grant Increase $(24,111)• Strategically increase open choice students $(75,000)• Request Board of Finance to retain all non resident student tuition $(35,000)• Change in Facility Rental Billing Structure and Accounting• Increase Athletics Administrative Assistant from 0.83 FTE to 1.0 FTE and transfer Facility Rental Responsibilities $8,839◦ Allocate clerical charge to Facilities to partially offset existing employees salary $(17,500)Net Revenue: $(8,661)
Total Revenue Increases: $(142,772)
50
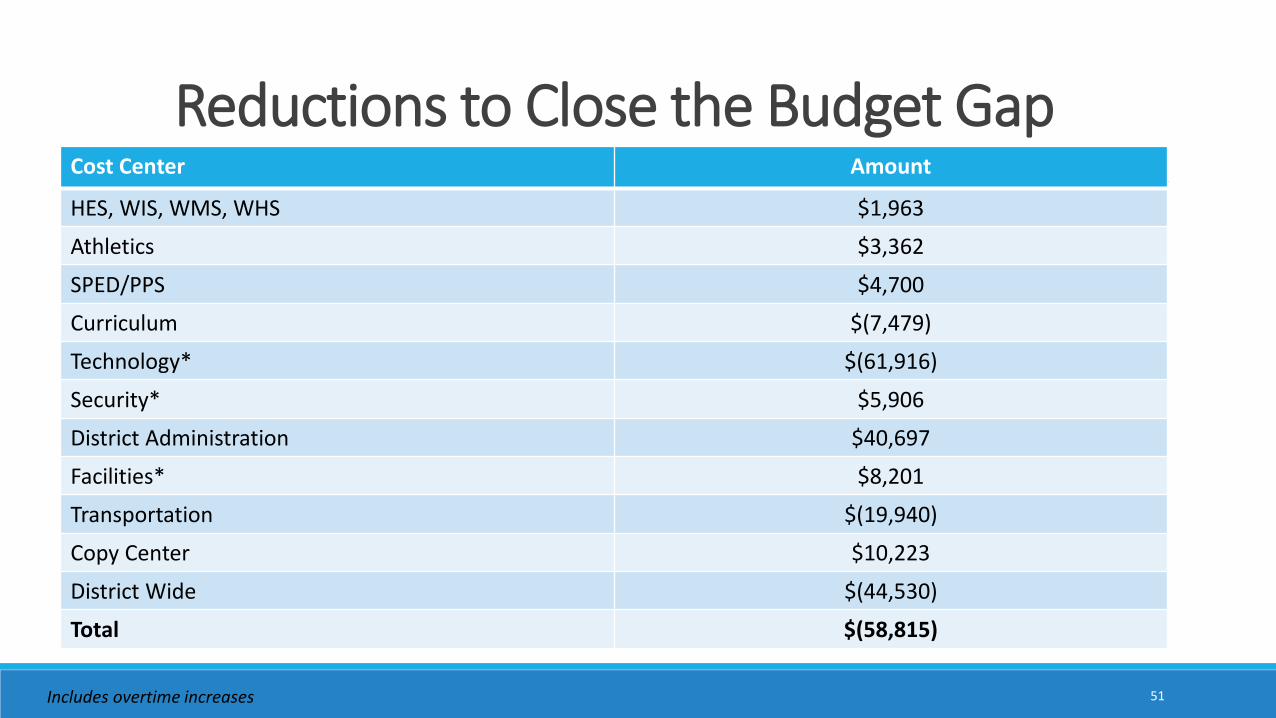
Reductions to Close the Budget Gap
51
Cost Center Amount
HES, WIS, WMS, WHS $1,963
Athletics $3,362
SPED/PPS $4,700
Curriculum $(7,479)
Technology* $(61,916)
Security* $5,906
District Administration $40,697
Facilities* $8,201
Transportation $(19,940)
Copy Center $10,223
District Wide $(44,530)
Total $(58,815)
Includes overtime increases

FY 2018 Budget Excluding Internal Services Fund
FY 2017 Budget $48,689,715
(Less FY 17 Internal Services Contribution) $(6,349,035)
FY 2017 Budget $42,340,680
Contractual Budget Pressures $1,062,764
Enrollment Budget Pressures $156,712
State and Federal Aid Budget Pressures $29,255
Budget Requests $455,736
Total Budgetary Increases: $1,704,467
Budget Reductions: $(857,643)
FY 2018 Budget (Excluding Internal Services Fund) $43,187,504 or 2.00%
FY 2018 Budget (Excluding Internal Services Fund & Enrollment Pressures) $43,030,792 or 1.63%
52

INTERNAL SERVICES FUND
53

Insurance
The Internal Services Fund is projected to need a budget increase of $510,376. The main drivers of this increase include:Expenditures:
◦ Medical Claims + Reduction in Staff: $548,986
◦ Stop Loss Insurance: $115,346
What is Stop Loss Insurance: Medical stop loss is an insurance product that provides protection against catastrophic or unpredictable losses above $175,000 for each individual. It is purchased by employers who have decided to self-fund their employee benefit health plans, but do not want to assume 100% of the liability for losses arising from the plans.
Weston:
54
High Claim Cost # of High Claimants
Total Claims High Claims as a % of Total Claims
FY 14 $2,611,051 22 $6,098,739 43%
FY 15 $2,227,217 16 $5,535,569 40%
FY 16 $3,390,267 24 $6,397,506 53%
FY 17* $960,504 9 $2,172,678 44%
*Represents only 4 months in FY 17
High Claimants ($50,000 or higher for an individual) has caused stop loss insurance to increase 23%. These claimants have spiked in FY 16 and the first half of FY 17. This population makes up approximately 7% of our total insured population.

Stop Loss Insurance
55
Fiscal Year
Stop Loss % of ISF Expenditures
FY 2018 $622,000 7%
FY 2017 $506,654 6%
FY 2016 $455,288 6%
FY 2015 $368,868 5%
FY 2014 $328,874 4%
$328,874 $368,868
$455,288 $506,654
$622,000
$-
$100,000
$200,000
$300,000
$400,000
$500,000
$600,000
$700,000
FY 2014 FY 2015 FY 2016 FY 2017 FY 2018
Stop Loss
Stop Loss
Stop Loss Insurance has been a growing expenditures within the Internal Services Fund as increased 89% since FY 2014.

Internal Services Fund Balance
Fiscal Year Fund Balance
% of Claims
FY 18 Projected $1,981,657 28%
FY 17 Projected $2,435,815 38%
FY 16 $2,793,243 44%
FY 15 $2,702,892 49%
FY 14 $1,668,288 27%
FY 13 $2,184,405 38%
FY 12 $2,554,225 46%
Average Fund Balance
$2,331,504 38%
56
Internal Services Fund Balance is intended to protect against:
-Aggregate Stop Loss- Aggregate Stop-Loss Insurance is a policy designed to limit
claim coverage (losses) to a specific amount. This type of coverage is to ensure that catastrophic numerous claims (aggregate stop-loss), do not upset the financial reserves of a self-funded plan. This is 15% of expected claims.
-IBNR- Incurred but not reported (IBNR) claims is the amount owed by an insurer to all
valid claimants who have had a covered loss but have not yet reported it. Since the insurer knows neither how many of these losses have occurred, nor the severity of each loss, IBNR is an estimate. This has averaged 12.75% over the last three fiscal years.
FY 2018 Expected Claims: $7,141,106
Aggregate Stop Loss Reserves: $1,071,166IBNR Reserves: $910,491Total Reserves Recommended: $1,981,657

DRG A Fund Balance ComparisonDistrict Fund Balance % of Claims Rank
New Canaan 10.10% 5
Easton-Redding-Region 9 11.86% 4
Westport 16.21% 3
Wilton 20.00% 2
Weston 27.75% 1
Average 17.18%
57
Darien and Ridgefield are fully insured.

FY 2018 Budget with
Internal Services Fund Contribution
FY 2017 Budget $48,689,715
(Less FY 17 Internal Services Contribution) $(6,349,035)
FY 2017 Budget $42,340,680
FY 2018 Budget (Excluding Internal Services Fund) $43,187,504 or 2.00%
Internal Services Contribution $6,859,411
FY 2018 Budget Recommendation $50,046,915 or 2.79%
58

CAPITAL BUDGET REQUEST
59

Capital Budget Request (Tier 1)
60
Tier 1 FY 2018
Air Conditioning for South House and East House Classrooms with Electrical Upgrade (21 classrooms)
$280,000
Engineering Study for Knee Walls at Weston Intermediate School $15,000
Removal and Replacement of Oil Tank at Hurlbutt $60,000
Refinish New Gym Floor at Weston High School $35,000
Chevy Suburban replacement Special Education Vehicle* $0
Replace Cove Base and Ceiling Tiles in Hallways at Weston Middle School $27,000
9-11 Enable Device for Telephone System $30,000
Energy Management Upgrade at WMS $15,000
HVAC Controls for G Wing at WMS $20,600
Total $482,600
*Also included is $52,250 for a replacement Chevy Suburban Special Education vehicle to be funded out of the town vehicle sinking fund.

Capital Budget Request (Tier 2)
61
Tier 2 FY 2019
Repair Knee Wall at Weston Intermediate School $300,000
Replacement of Turf Field* $315,000
Replacement and Relocation of the NOC $25,000
Removal and Replacement of Oil Tank at WMS and WHS $125,000
Total Tier 2 $765,000
*The balance of funds for the Turf Field Replacement will come from the Sinking Fund.

Capital Budget Request (Tier 3)Tier 3 FY 2020
Upgrade Bathrooms in Academic Area at Weston Middle School $300,000
Ventilation in Team Rooms at Weston High School $30,000
Art and Science Room sink replacement at Weston Middle School $20,000
Hybrid PBX Phone System $225,785
Master Plan Sinking Fund $330,000
Total Tier 3 $905,785
62

Concluding Statement
Investing in Excellence with Compassion
◦ Advancing Intellectual Rigor and Caring Community
◦ Framed by Strategic Goals
◦ Funding to Maintain Excellence
◦ Targeted Investments
◦ Tough Decisions on Reductions
63