world bank document · public disclosure authorized public ... the construction of the road section...
TRANSCRIPT

World Bank Loan Project R-254REVISED VOL. 3
.ZHANGZHOU-ZHAOAN EXPRESSWAY.4;. . . .. . B .
Fujian Provincial Highway Project 1Tongjiang-Sahya
National Highway:Trunk Line
People's Republic of China
STATEMENT OF..
.-ENVIRONMENTAL IMPACT-ASSESSMENT.'
- ,~ ~ ~~~~-
. . . .;. ...
t .. - - . - . . ..
Ri~ ighw*ay, ranspoqrtsitionUniest
[~ ~~- - -Z~~# . -- -- -& 4SAEM N OF*
I~~- . . . . . . . .. . .. .
#, . . . . . . .- . -. .;. - : .- . :. .:
S~ ~ - ::9 . ' -. ' . . * . . _ _ .
__ , , , , . ._ ..
l; - - -- ~~~~~;Z.,', .,,~~~~~ ~.
Pub
lic D
iscl
osur
e A
utho
rized
Pub
lic D
iscl
osur
e A
utho
rized
Pub
lic D
iscl
osur
e A
utho
rized
Pub
lic D
iscl
osur
e A
utho
rized
Pub
lic D
iscl
osur
e A
utho
rized
Pub
lic D
iscl
osur
e A
utho
rized
Pub
lic D
iscl
osur
e A
utho
rized
Pub
lic D
iscl
osur
e A
utho
rized

World Bank Loan Project
ZHANGZHOU-ZHAOAN EXPRESSWAY
Fujian Provincial Highway Project IITongjiang-Sanya
National Highway Trunk Line
People's Republic of China
STATEMENT OF
ENVIRONMENTAL IMPACT ASSESSMENT
Xian Highway Transportation University
April 1999

Statement-making Unit: Xian Highway Transportation University
Legal Person: Chen Yinsan (President)
Chief Engineer: Zhang Yufen
EIA Director: Deng Shunxi
Person in Charge of the EIA: Cao Shencun
Project Participants:Cao Shencun, Zhao Jianqiang, Liu Shan, Liu Yingling,
Zhao Aiqi, Shang Lian, Zhao Meixin, Zhen Xiaolu,
Xie Weidong, Zhang Yufen
Members of the EIA Team:Statement Compiler:
Cao Shencun Associate Professor
Subject of Atmospheric Environmental Impact:Liu Shan Lecturer
Subject of Acoustic Environmental Impact:Zhao Aiqi Engineer
Liu Yingling Master of Environmental Engineering
Subject of Ecological Environmental Impact:
Cao Shencun Associate Professor
Subject of Water Environmental Impact:
Zhao Jianqiang Associate Professor
Subject of Social Economic Environmental Impact:
Zhao Aiqi Engineer
Liu Yingling Master of Environmental Engineering
Present Situation Monitoring Unit:Environmental Monitoring Station of Zhangzhou City

Preface
Zhangzhou - Zhaoan Expressway is one of the important sections of the nationaltrunk line (Tongjiang in Heilongjiang Province - Sanya in Hainan Province) located inFujian Province, which will speed up the formation of the main traffic artery in coastalareas of China. In the north, it will connect with Xiamen-Zhangzhou Expressway (40km),Quanzhou-Xiamen Expressway (81km), and Fuzhou-Quanzhou Expressway (165km) ofFujian Province; while in the south it will connect with Shantou-Chaozhou-FenshuiguanExpressway and Shantou-Shenzhen Expressway of Guantong Province. The high-speeddirect passages from the capital of Fujian Province (Fuzhou) to Guangdong Province,
Hong Kong, and Macao will be constructed, which will join the Zhujiang Delta area tothe southeastern part of Fujian Province as a whole coastal area of reforn and opening.As a result, a relatively integrated expressway net will be formed involving the fourSpecial Economic Zones of our country (Xiamen, Shantou, Zhuhai, and Shenzhen) andthe Hong Kong Special Administrative Region. The function of the special region actingas a window in the opening of the country will be fully utilized, which will greatlypromote the economic development of Fujian and Guangdong Province and thesoutheastern coastal areas of our country.
The total length of the proposed Highway is 140.459 km. The investment in theproject is 5054 million RMB yuan. According to the concerning regulations from
"Environmental Protection Law of the People's Republic of China", "Methods ofEnvironmental Protection for Project Constructions" with reference number of 003 bythe State Environmental Protection Agency (SEPA), and "Methods of EnvironmentalProtection for Traffic Project" with reference number of 17 by Ministry ofCommunication (MOC), the Environmental Impact Assessment (EIA) works of thisproject are carried out.
The construction of the road section KO+000-K8+000 and the proposedenvironmental protection mitigation measures in the EIA/EAP of the road sectionKO+000-K8+000 will not be financed by the World Bank Loan for this project. However,Fujian Provincial Communication Department (FPCD) will implement the environmental
protection mitigation measures of this road section according to the requirements of the
EIA/EAP.The preliminary work of Zhangzhou - Zhaoan Expressway was entrusted to the
Fujian Provincial Communication Planning and Design Institute (FPCPDI) by the FujianProvincial Expressway Construction Directorate Office (FPECDO) in 1993. Complementand revision were made to the pre-feasibility study report in 1994 and 1997. In Oct. 1997,

Xian Highway Transportation University was entrusted by the FPECDO to undertake theEIA work of this project. An on-the-spot survey along the proposed highway was doneby the EIA working team from Xian Highway Transportation University in Nov. 1997,assisted by FPECDO, FPCPDI, Expressway Directorate Office of Zhangzhou City, andEnvironmental Monitoring Station of Zhangzhou City. The situations of environmentalsensitive sports, environmental condition, and economic development were investigated.A large amount of concerning informnation was resembled. Then the EIA Outline for thisproject was compiled in Dec. 1997, which passed the inspection by SEPA on Jan. 4 1998.Revision of the EIA Outline was done based on the suggestion of SEPA, which wasauthorized again with by the NEPB on Feb. 19, 1998. According to the EIA Outline, andthe assessment standards authorized by Fujian Provincial Environmental ProtectionBureau (FPEPB), we began the work of EIA.
Upon consideration that this project is a World Bank (WB) financed project, wecarried out our EIA work, observing both the regulations of our country and the demandsof WB. The EIA is compiled based on the discussions and consultations withconstruction unit and designing unit, and it is revised and amended based on thesuggestions of WB experts. The version of EIA in Dec. 1998 was up dated according tothe newest version of Engineering Feasibility Study Report (April 1998) and itssupplementary materials in Sep. 1998. The revision of this EIA has been done followingthe suggestions of WB experts in Nov. 1998, Jan. 1999, and in Mar. 1999. This version ofEIA (Mar. 1999) is the newest version of EIA.
We would like to be in acknowledgement of the concerning agencies: SEPA,Environmental Protection Office in MOC, FPEPB, FPECDO, FPCPDI, ExpresswayDirectorate Office of Zhangzhou City, Environmental Protection Bureau of ZhangzhouCity, and the governmental and the administrative agencies in Longhai County, ZhangpuCounty, Yunxiao County, Zhaoan County, etc., which provide assistance and convenience
to the EIA works.The present monitoring data used in this statement are provided by Environmental
Monitoring Station of Zhangzhou City.

CONTENT
1 INTRODUCTIONN ............................................................ 11.1 Source and Characteristic of the Project and It's Preliminary Work .................. 11.2 Categories and Classifications of EIA ........ ........................................... 21.3 Objectives of EIA ............................................................ 21.4 Bases of EIA ........................................................... 31.5 Scope and Standards of EIA ............................................................. 31.6 Procedure and Phase of EIA ............................................................ 61.7 Technologies and Methodologies in EIA ................................................ 71.8 Content, Key Points and Targets to be protected in EIA .............................. 7
2 ENGINEERING DESCRIPTION & POLLUTION SOURCE ANALYSIS.....92.1 Engineering Description ............................................................ 92.1.1 Alignment and Geographical Position ................................................. 92.1.2 The Recommended Alignment Scheme and Main Controlling Points ............ 92.1.3 Construction Scope and Technical Standards ....................................... 102.1.4 Traffic Volume Prognosis ............................................................ 122.1.5 Land Acquired for the Project and Resettlement ................................... 122.1.6 Engineering Investment and Working Schedule .................................... 122.2 Pollution Source Analysis ............................................................ 132.2.1 Analysis of Pollution Source during Construction Phases ........................ 132.2.2 Analysis of Pollution Source during Operation Phases ............................ 14
3 PRESENT ENVIRONMRNTAL ASSESSMENT . . 173.1 Status Quo of Natural Environment along the Proposed Highway .. 1 73.1.1 Land Features and Topography ........................................................ 173.1.2 Meteorology ............................................................. 173.1.3 Hydrogeology ............................................................ 173.1.4 Vegetation ............................................................ l183.2 Present Assessment of Ecological Environment . .1 83.2.1 Status Quo of Environment and Sampling Analysis Methods ..................... 183.2.2 Assessment of Status Quo of Soil Pollution ......................................... 193.2.3 Wild Plants and Animals ............................................................ 203.3 Assessment of Status Quo of Soil Erosion ............................................. 203.4 Assessment of Status Quo of Social Environment . . 213.4.1 Present Situation of Social Environment ............................................. 213.4.2 Sensitive Spots along the Proposed Highway ....................................... 223.5 Assessment of Status Quo of Acoustic Environment . . 253.5.1 Investigation and Monitoring of Present Acoustic Environment . ...... ...... 25

3.5.2 Statistic Data of Present Acoustic Environmental Noise at Sensitive Spots .... 263.5.3 Assessment of Present Environmental Noise along the Alignment ............... 273.6 Assessment of Present Atmospheric Quality .......................................... 303.6.1 Present Air Environmental Quality and Assessment ................................ 303.6.2 Meteorological Features ......................................................... 333.7 Present Water Environment and Assessment .......................................... 373.7.1 River Regimes & Hydrogeology ...................................................... 373.7.2 Assessment On Present Surface Water Environment .............................. 383.7.3 Assessment of Present Surface Water Quality ....................................... 40
4 PREDICTED ENVIRONMENTAL IMPACTS & MITIGATION MEASURE..... 43
4.1 Analysis of Impacts on the Ecosystem ................................................. 434.1.1 Prediction and Assessment of Impacts of Lead Content in Soil .................. 434.1.2 The Potential Impact of the Alignment on the Farming along the Project ...... 464.1.3 Protection of Wild Animals and Plants ............................................. 494.1.4 Protection Measures for Ecological Environment .................................. 494.1.5 Measures and Suggestions about Vegetation Restoration .......................... 494.2 Prediction of Soil Erosion during Construction Phase . . 514.2.1 Prediction Model for Soil Erosion .................................................... 514.2.2 Value of Various Factors Adopted in EIA ............................................ 514.2.3 Calculation of Soil Erosion ........................................................ 524.2.4 Earthwork Balance of Subgrade Works ............................................... 544.2.5 Impacts of Poor Geology on the Project ............................................. 564.2.6 Plan of Prevention of Soil Erosion .................................................... 564.3 Impact Analysis of Social Environment ................................................ 624.3.1 Beneficial Analysis of Social Environment .......................................... 624.3.2 Impact Analysis of Highway Construction on Life of Residents ................. 634.3.3 Risk Analysis of Accidents ........................................................ 654.3.4 Cultural & Historical Relics Investigation ............ ttt....-....................... 684.3.5 Mitigation Measures of Impacts on Social Environment ........................ 704.3.6 Impact of Transportation of Construction Materials & Mitigation Measure . 724.4 Prediction and Assessment of Traffic Noise Impact on Environment .. 754.4.1 Prediction and Calculation of Traffic Noise ......................................... 754.4.2 EIA of Traffic Noise ................................................ 794.4.3 Analysis of Environmental Impact during Construction Phase ................... 854.4.4 Assessment and Conclusion of Acoustic Environment ............................ 864.4.5 Mitigation Measures of Acoustic Environment Impact ........................... 874.5 Prediction and Assessment of Impact on Ambient Air . . 934.5.1 Prediction Model ................................................ 934.5.2 Identification of Various Parameters in Prediction Model ......................... 934.5.3 Prediction of Concentration of CO and NOx ........................................ 954.5.4 Assessment of Impact on Ambient Air Quality in the Study Areas ............ 1034.5.5 Prediction Analysis of CO Concentrations in Tunnel ............................. 108
II

4.5.6 Analysis of Impact of Flying Dust on Environment during Construction ...... 1114.5.7 Assessment and Conclusion and Environmental Protection Measures ....... 1114.6 Prediction and Assessment of Impact on Water ......................... 1134.6.1 Analysis of Pollution Source Strength .............................................. 1134.6.2 Prediction and Assessment of Impact on Water Environment ................... 1164.6.3 Conclusion of Water Quality Analysis .............................................. 1214.6.4 Environmental Protection Measures and Suggestions ............................ 1214.7 Environmental Protection of Interchanges and Link Roads . ................. 1234.7.1 Interchanges ............ 1234.7.2 Dongyuan-Fugong Link Roads ..................................................... 1244.7.3 Huxi(Zhaojiabao)-Fuotan Link Roads .............................................. 128
5 ALTERNATIVE SCHEMES ....................................................... 1315.1 Introduction to Engineering Schemes ................................................. 1315.2 Environmental Comparison of Schemes .............................................. 1335.3 Comparison Analysis on Alternate Schemes of Sensitive spots ................... 138
6 ANALYSIS ON LOSS AND BENEFIT OF ENVIRONMENT .................. 1426.1 Economic Benefit Analysis of the Project ............................................ 1426.2 Analysis of Economic Sensibility ...................................................... 1436.3 Estimation of EP Investment ...................................................... 1446.4 Cost-Benefit Analysis of Environmental Protection Investment .................. 146
7 ENVIRONMENTAL MANAGEMENT AND MONITORING PLAN ........ 1487.1 Environment Management Agencies and Responsibilities ......................... 1487.2 EP Agencies and Their Functions During Operation Phase ..................... 1487.3 Major Issues in Environmental Protection Management Plan ........... 1517.4 Environmental Protection Supervision Plan ....................................... 1567.5 Environmental Protection Staff Training ............................................. 1577.6 Environmental Monitoring Plan ..................................................... 1587.6.1 Environmental Monitoring Plan in Construction Phase ........................... 1587.6.2 Environmental Monitoring Plan in Operation Phase ........................... 1597.6.3 Equipment, Expenditure and Reporting of Monitoring .......................... 159
8 PUBLIC PARTICIPATION ....................................................... 1618.1 Early Stage Work of the Project ...................................................... 1618.2 Investigation Subjects and Ways of Participation ................................. 1618.3 Examples of Typical Consultations and Hearings ................................... 1628.4 Statistic Results of Public Participation and Opinion Treatment ....... I .......... 164
9 CONCLUSIONS ...................................................... 1689.1 Alignment Scheme Selection ...................................................... 1689.2 EIA on Ecological Environment ...................................................... 1689.3 EIA on Social Environment ...................................................... 169
111

9.4 EIA on Acoustic Environment .......................................... ...... 1699.5 EIA on Environmental Air Quality .1709.6 EIA on Surface Water Environment .1709.7 Environmental Impact of Interchanges and Link Roads .171
REFERENCES. 173
APPENDIX MAP1. Sketch Map of the Distribution of Agriculture Area2. Sketch Map of the Alignment & Environmental Monitoring Spots for Zhangzhou-
Zhaoan Expressway3. Sketch Map of the Layout of the Piling Sites of Construction Materials4. Sketch Map of the Sensitive Spots along Zhangzhou-Zhaoan Expressway
& Monitoring Spots of the Environmental Action Plan
IV

m1-l gt /4 it/9 R/ 4f iFigure 1-1 Location Map of Fujian Provincial Highway Project II
Zhangzhou-Zhaoan Expressway & the Other Road Projects
' It / X \ i w f -A -.
~~~~~~ ._
4~~~~~~~~~~~~~~
ua71lgdon~~~~~~~~~~~~~~~~~~~~d irdun Ar5n0* -
.. )Ylhd-hebG I §f %//7
F~~~~~~~~~~~~~~~~~~~~~~~~~~~~~. ~ ~ ~ ~ ~ ~ ~ ~ ~ ~ ~ ~~F
2 F / ?S- Ui T Y a E '.p Z
Cl^ \g * ,.
N4 NN ihwy 1 jjiJ) F Wiotil ,ni
X 1 \< q F *t
Prov. L '~~~~~flIhfl Indnmial Amhi Thizj~ ~ ~ ~~~~a Ooimtya yAmii
~~ IRL~~ ~ * 4-I ~ ~ ~ IA.I
ldT*m1.uidP#uci~m I A . _ i

1 INTRODUCTION
1.1 Source and Characteristic of the Project and It's Preliminary Work
Zhangzhou-Zhaoan Expressway is one of the important sections of the national trunk
line ( Heilongiang-Hainan Province ) in Fujian Province, which will speed up the
formation of the main traffic artery in coastal areas of China. In the reform and the
opening-up of the country, the economy of Fujian province has been developed greatly in
recent years. Construction of this project will promote the economic development of
coastal areas and the areas along the line especially. The area under jurisdiction of
Zhangzhou City where the said project is located is a main part of southeastern area of
Fujian, and is also a critical region in the distribution of productive forces of the whole
country. Southeastern area of Fujian is designated as one of the seven economic hot
regions in the National Ninth Five-Year Plan (1996-2000). The State Council referred
Zhangzhou as a foreign-oriented agricultural model region of state level in 1994. The
foundation of Agricultural Cooperation Experimental Region (between the main land and
Taiwan) was authorized by the National Ministry of Foreign Trade. the National Ministry
of Agricultural, and the Taiwan Affairs Office in August, 1997. The Construction of
Zhangzhou-Zhaoan Expressway is to meet the needs of the fast growing traffic volume.
Based on the data in 1996, the yearly average traffic volume is 7606 v. /d. (when
converted into medium sized car). The crowding degree is 1.69, which shows a saturation
state has been witnessed. From the analysis above, the construction of Zhangzhou-
Zhaoan Expressway is essential and urgent. The Fujian Provincial Expressway
Construction Directorate Office (FPECDO) carried out the preliminary work in 1993.
The pre-feasibility study report and the preliminary work of the project feasibility study
were revised and amended in 1994 and 1997.
Zhangzhou-Zhaoan Expressway is a new project. On Feb. 21 1997, Fujian Provincial
Planning Commission submitted a report on the project to the State Planning
Commission officially in the No. 018, 1997 document "Suggestion of Zhangzhou-
Zhaoan Expressway Project". On Oct. 31, 1997, Xian Highway University was entrusted
to undertake EIA by FPECDO. World Bank will list Zhangzhou-Zhaoan Expressway as
the second highway loan project in Fujian province. Experts from WB identified this
project in Nov. 1997. Specific demands were put forward by the environmental
protection expert from WB for the Fujian Highway Project II. In May 1998, WB
mission consulted in Fujian Province for the loaning and environmental protection of this
project.

The Outline of EIA was submitted to WB before Feb. 20 1998. The first version of
EIA, EAP, and Summary of EIA had been planned to be submitted to WB before Aug. 1
1998. The EIA is compiled based on the discussions and consultations results with
construction unit and designing unit, and it is revised and arnended based on the
suggestions of WB experts. The version of EIA in Dec. 1998 was up dated according tothe newest version of Engineering Feasibility Study Report (April 1998) and its
supplementary materials in Sep. 1998. The revision of this EIA has been done following
the suggestions of WB experts in Nov. 1998, Jan. 1999, and in Mar. 1999. This version of
EIA (Mar. 1999) is the newest version of EIA.
1.2 Categories and Classifications of EIA
According to the EIA management regulations of Fujian Province and the EIA
categories for construction projects of the World Bank, highway projects belong to class
A assessment and more detailed classifications of the EIA special subjects have been
made in our country. Considering the characteristics of the highway project and the
environment of the local area, EIA classification of this project is specified as follows:
Because of the great variety of building structure, the huge amount of earthwork and
stonework, the large area of land occupation (fields and orchards), the complexity of land
feature, and the 4-year-long construction term, the project will unavoidably bring about
serious impact on the surface ecological environment. Therefore, the assessment of
ecological and social environment is the focal point in EIA, which is decided as class 1
assessment.
The economy along the proposed expressway is well developed, with a lot of
residential sites, primary schools and secondary schools. The assessment of acoustic
environment is decided as class I assessment.
There are densely distributed rivers in the affected area. Some of the rivers are for
navigation and aquatic culture with tidal influence. The assessment of surface water
environment is decided as class 3 assessment.
As to the atmospheric assessment, TPS pollution in construction phase will be
serious, but in a rather short period of time. And tail gas pollution in operation phase will
deteriorate the atmosphere of the areas with a high background level to some extent. The
assessment of atmospheric environrnent is decided as class I assessment.
1.3 Objectives of EIA
The objectives of EIA for Zhangzhou-Zhaoan Expressway are to utilize the land
resource and to present better conditions for the harmonious development of economic
activities and residential environment. We will take the advantage of EIA to assure the

balance of development, to minimize the unfavorable impact of the construction. In order
to achieve the goal, the following works are carried on: investigation and assessment of
the present environmental background (natural and social environment, ecosystem, noise,
surface water and atmosphere); prognosis and analysis of the seriousness and scope of
the environmental impact resulting from the proposed expressway in construction and
operation phases; analysis and study of the enviromnental protection measures to be
taken and its technical feasibility and economic reasonableness. We deduce the alignment
rationality of the expressway from the point of view of enviromnental protection. A set
of environmental engineering mitigation measures has been put forward as the base for
leaders' decision, engineering design and environmental management.
1.4 Bases of EIA
1. " Zhangzhou-Zhaoan Expressway Engineering Feasibility Report ", April, 1998,
Fujian Provincial Communication Planing and Design Institute (The scales of the maps
are 1/10000 and 1/2000 respectively);
2. " Application Document for Zhangzhou-Zhaoan Expressway Project ", Ref No.
018, 1997, Fujian Provincial Planning Committee;
3. " EP Management Regulations in Construction Projects ", Ref. No. 003, 1986,
SEPA;
4. " EP Management Regulations in Communications Construction Projects ", issued
by MOC as Ref. No. 17 Order;
5. "EIA Specifications for Highway Construction Projects (trial) ", JTJ 005-96;
6. " On Strengthening Management of EIA of the Projects Using Loans from
International Financing Institutes ", a Circular Ref. No 324, 1993, SEPA;
7. " EIA Technology Guide ", HJ/T 2.1-2.3;
8. " EIA Outline of Zhangzhou-Zhaoan Expressway " authorized by SEPA, Feb. 19,
1998.
9. "World Bank OD 4.01", Oct.1991, and WB EIA Handbook;
10. Laws and Standards Concerning Environmental Protection including " Water and
Soil Protection Act of PRC "," Land Management Act of PRC ", " Environmental Noise
Standards in Urban Areas ", " Environmental Air Quality Standards ", " Seawater
Quality Standards", etc.
1.5 Scope and Standards of EIA
According to the reply document Ref. No. 032 [1998] from FPEPB, the assessment
scope and standard are decided as follows for specified EIA subjects.
1. Assessment Scope

Social environment-Directly impacted areas on both side of the expressway;
Social economy- Directly and indirectly impacted areas;
Ecological, acoustic, atmospheric and surface water environment - Areas within
200m from both sides the expressway. Earth borrowing and spoil sites should be
involved in the assessment scope.
2. Assessment Standards
Considering the characteristics of EIA of' expressway project and the natural
environment in different sections, EIA of this project is based on the following standards:
(1) For ecosystem"Standard for Soil Environment Quality " GB15618-1995, Class 2, the lead content
in soil is limited as PbA350mg/kg.
" National Food Sanitation Standard of Lead Limitation " GB 14935-94, lead content
in crops is limited as follows: for beans: PbA0.8mg/kg, for potatoes: Pb•0.4mg/kg, for
vegetables: Pb•0.2mg/kg, for cereals: Pb 0.4mg/kg.
(2) For noise
" Environrmental Noise Standards in Urban Areas ", GB 3096-93.
Class I standard ( 55dB in daytime, 45dB in nighttime ) is adopted for schools and
hospitals;
Class 2 standard ( 60dB in daytime. 50 dB in nighttime ) is adopted for densely
residential sites between 100 - 200m from the road side;
Class 4 standard (standard 70dB in daytime, 55 dB in nighttime ) is adopted for
residential sites within I OOm from the road side.
(3) For surface water quality
" Surface Water Quality Standards " Class II and Class III in GB3838-88 (Table
1-1), " Seawater Quality Standards " GB3097-97 (Table 1-2), and " Fishery Water
Quality Standards ", GB11607-89 ( Table 1-3) are used. Because there is no SS
(Suspended Solid) standard for surface water, the SS of irrigation water is used. The
limitations are: 150mg/I for water farming irrigation water, 200 mg/l for dry farming
irrigation water, and 100 mg/l for vegetable irrigation water.
Table 1-1 Surface Water Quality Standards GB3838-88
Factors CODM,, pH Oil DO(mg"i) (mg,,) (mg/I)
Class If 4 6.5-8.5 <0.05 >6
Class III S6 6.5-8.5 S0.05 >5
Note: CODMn - Chemical Oxygen Demand determined by the method of Potassium Permanganate oxidation
DO---Dissolved Oxygen

Table 1-2 Sea water Quality Standards GB3097-97
Classification pH SS (mg/I) CODMn (mg/I) DO (mg/l) Oil (mg/I)
Class 1 7.5-8.5 •10 I2 >6 •0.05
Class 2 7.5-8.5 •50 •3 >5 •0.05
Class 3 6.8-8.8 <100 •4 >4 •0.30
Note: SS---Suspended Solid
Table 1-3 Fishery Water Quality Standards GB11607-89Items Standard
Artificially imposed amount< 10mg/l, and the deposited SS should not haveunfavorable impact on aquatic plants and animals.
pH Freshwater 6.5-8.5 , Seawater 7.0-8.5
DO In the 24 hours in every day, at least in 16 hours >5mg/l,, and in any other times ¢3mg/I, for water bodies have salmon B4mg/l at any time.
Oil •0.05mg/I
Jiuzhen Port and other ports adopt Class 2 in " Seawater Quality Standards ";
Jiulongjiang River and Zhangjiang River adopt Class III in " Surface Water Quality
Standards " and Class 2 in " Seawater Quality Standards ";
Yangmei Reservoir: Class II in " Surface Water Quality Standards ".
(4) Atmosphere" Environmental Air Quality Standards " GB3095-1996, see Table 1-4
Table 1-4 Environmental Air Quality Standards GB3095-1996
Items Sampling Time Standard II Unit of Concentration
TSP daily average 0.30
daily average 0.10NOX hourly average 0.15 mg/Nm3
co daily average 4.00hourly average 10.00
Note: TSP--Total Suspended ParticlesNO--Nitrogen OxidesCO-Carbon monoxide

1.6 Procedure and Phase of EIA
EIA Phases of this project are:
1. Construction phase: July 1, 1 999-Dec. 31, 2002
2. Short term phase of operation: 2003-2005
3. Mid term phase of operation: 2005%2010
4. Long term phase of operation: 2010-2020
According to the regulations of the National Environmental Protection Agency
( SEPA ) and the Ministry of Communication, the EIA procedure of this project is
specified in Figure 1-2.
Entrustment
On-the-spot survey &
data collection
Compilation of EIA Outline
I Approva by SEPA Public Participation
| Signature of EIA contract Survey of present environment |
EP | Engineering__
measures | analysis impact analysis & prognosis Present environment monitoring
Target of protection Feasibility assessment Prognosis calculation
Compilation of report
| Pre-examination by EP Division of MOC
Final Approval by SEPA
Figure 1-2 Procedures of EIA

1.7 Technologies and Methodologies in ETA
Since the highway construction project is situated in a vast and belt-shaped area, weintegrate the specific study of spots along the line with the synthetic study of the wholeline in the work of EIA. The assessment by model calculation is used in the prognosis on
acoustics, atmosphere, water, soil erosion and lead content in soil. Assessment on social
environment, wild animals & plants, public participation, alternative scheme, economic
environment and cost-benefit analysis are carried out by using the methods of
investigation, consultation, and analysis.
1.8 Content, Key Points and Targets to be protected in EIA
Based on the distinguished and screened environmental impact elements, the main
content of EIA in this project is:
1. EIA of ecosystem:
Assessed objects are: during construction phase: soil erosion and vegetation
deterioration caused by construction, agriculture loss caused by land acquisition; during
operation phase: pollution by lead particles in tail gas, vegetation recovery.
2. EIA of society:
House demolishing and resettlement, village separation, life quality, land acquisition,
traffic accident, benefits to the development of economy, etc.
3. EIA of acoustics:
During construction phase: assessed objects include noise of construction machines,
acoustic environment of residential region near construction section;
During operation phase: assessed objects include acoustic environments along the
proposed highway, noise of traffic trunk line and sensitive spots.
4. EIA of surface water: assessment element: CODmn, pH, Oils, DO, SS
5. EIA of atmosphere:
Assessment element: for present quality assessment are CO, NOx, TSP; for
prognosis assessment are CO, NOx.
6. Public participation.
7. Alternative scheme.
8. Environmental protection measures.
Key points in EIA:
1. EIA of ecosystem: Since the expressway project belongs to an exploiting projectcausing natural environmental deterioration resulting from land acquisition, large

volumes of earthwork & stonework, vegetation deterioration, soil erosion, agriculture
loss, the impact on ecosystem is rather important in EIA.
2.EIA of society and economy: People can receive great benefits from the
construction of the project, which will play an important role in promoting the economic
development in the region, however, at the same time they will suffer from decrease of
land, house demolition and resettlement, traffic separation between villages and
environmental deterioration, etc.
3.EIA of acoustics at the sensitive spots along the expressway: There are 13 schools
(prim. or mid.) and I hospital in the assessment scope. Because of the great traffic
volume of the expressway, attention should be paid to adverse effect of the traffic noise
on the sensitive spots.
4.Environmental impact from the construction of tunnels, large bridges, asphalt
mixing plants, service regions should be the key points in the assessment.
Targets of Environmental Protection:
I.There are 65 villages, 14 schools and one hospital in the EIA scope. Residential
houses within IOOm, and schools or hospitals within 200m from both sides of the road
are all listed in the targets of environmental protection.
2.Orchards and aquatic product plants are targets to be protected, which are main
economic resources for local residents.
3.The vegetation recovery and treatment of soil erosion at the spoil sites for tunnel
construction wastes and borrow pits are also listed as the targets to be protected.

2 ENGINEERING DESCRIPTION & POLLUTION SOURCE
ANALYSIS
2.1 Engineering Description
2.1.1 Alignment and Geographical PositionThe whole line of Zhangzhou-Zhaoan expressway is located in the area under the
jurisdiction of Zhangzhou City. It passes through Longhai City, Zhangpu County,Yunxiao County, and Zhaoan County. The position of the expressway is at the southerntip of Fujian Province, and between 117°5'- 117°38' east longitude and 24° 8'-25° 8'north latitude. Section K8-K23 is in heavy rolling area. Section K74-K90 is on slopes, atthe foot of the slopes is paddy fields. Other sections of the expressway are in light rolling
plain. For alignment and geographical position, see rigure 1-1.
2.1.2 The Recommended Alignment Scheme and Main Controlling PointsSee Figure 2- 1.The starting point of the expressway is at Beitou, Longhai City ( at K41+605 of the
Xiamen-Zhangzhou Expressway). Extending southeastward, the line passes byDongyuan Village, Jiangcuo. Then, it flies over Xinxu Extra-large Bridge, passes byXifengling, Yangmei Reservior, Xinzhong, Hekeng, via Zhaojiaqiao interchange. Afterpassing through Kuzhishan Tunnel (2580m), Jiuzhen Port, via Duxun Interchange, itpasses by Gaoshan Village. From there on, it passes by Tangli, Wutian Village, viaYunxiao interchange, Dabushan Tunnel (2000m), Shudong Village, to Changshan. Afterpassing through Yancang Village, the line is in Zhaoan County. It goes on passing byTianpu, north of Yuanqian Village, and via Xishan Interchange, south of WaifenglouVillage, then passes Wuozitou Large Bridge,via Zhaoan interchange and 324 NationalHighway, though north of Shangying Village, north of Houling Village, north ofChongpai Mountain, getting to the ending point of the expressway. The total length of theroute is 140.459km.
The major controlling points are Beitou, Dongyuan, Xinxu, Xifengling, Youkeng,Huxi, Mt. Kuzhishan, Jiuzhen, Cili, Guanyinting, Dabushan, Lintou, Xishan, Waifenglou,Changmaolin, Houling in Zhaoan, then connects Shantou-Chaozhou-FenshuiguanExpressway of Guangdong Province at the inter-provincial boundary.

There two major link road: 5km Dongyuan-Fugong Link Road is access-controlledclass 1 highway; 8km Huxi-Fuotan Link Road is class 2 highway.
2.1.3 Construction Scope and Technical StandardsThe project is an access-controlled, grade-separated expressway with divided two
lanes in each direction and with a total length of 140.459km.The major construction scope and technical indexes for the expressway are shown in
Table 2-1 & 2-2 where the Data in the table are taken from the April 1998 version ofEngineering Feasibility Study Report.
Table 2-1 Engineering Work Amounts (April 1998)
No. Items Units Quantity
1 Total length of the line km 140.459
2 Volume of earthwork & stonework 10,00o |n 1780.053
3 Subgrade drainage & protection work 1 0,00o m 1 92.443
4 Soft subsoil treatment km j 27.57
5 High grade pavement I OOOm2 2877.204
6 Culvert No. 445
7 Small and medium bridge m No. 3044/71
8 Large bridge m No. 1835/10
9 Extra-large bridge m No. 6322/7
10 Tunnel m No. 4580/2
11 Interchange No.9
12 Grade separation No. 79
13 Underpasses No. 292
14 Land acquisition mu 19282
15 Demolished house m2 70097
16 Link road km 5.0+8.0
10

Table 2-2 Major Technical Indices (April 1998)
Road classification Class I highway Class 2 highway\vExpressway v= 100km/h v=4Okm/h
\Beitou-H1o00kmh (Dongyuan-Fugong (Huxi-Fuotan
Indices \ (Beitou-Houling) link road) link road)
Length (km) 140.459 5.0 8.0
Designed speed (km/h) 100 100 40
Subgrade width (m) 26.0 25.5 12.0
1. Lane (m) 2 X 7.5 2 X 7.5 9.0
2.Division (in) 3.5 (separation and road 3.0 (separation and roadc2.Division (m).
_. __ ~~~~~~~~margiii) margin)
m 3. Road shoulder (m) 2 X 3.75 2 X 3.75 2X 1.5
Designed standard axle load Designed standard axle Designed standard axle Designed standardof subgrade load 100KN load 100KN axle load IOOKN
Ordinary minimum radius 700 700 100of horizontal curve (m)
Limited minimum radius of 4horizontal curve (m) 4
Sight stopping distance (m) 160 160 40
Max. longitudinal (%) 4 4 7
Designed flood frequency of 1/100 1/100 1/50subgrade (%)
Designed flood frequency of 1/300 1/300 1/100Extra-large bridge (%)
Designed flood frequency of 1/100 1/100 1/100
medium or large bridge (%)
Designed flood frequency of 1/100 1/100 1/50small bridge and culvers(%)
Truck super-20, Truck super-20, Truck super-20,Designed truck load trailer- 120 trailer- 120 trailer- 120
Toll station,management station,
communication system, Essential safety facilities Essential safety
Traffic engineering & safety surveillance system, and service facilities facilities will beservice facilities power supply system, will be established established
safety facilities, servicefacilities will be
established

2.1.4 Traffic Volume Prognosis
Traffic volume prognosis on the proposed highway has been made, see Table 2-3.
Road sections in Table 2-3 can be found in Figure 2-1.
Table 2-3 Traffic Volume Prognosis on the Proposed Highwayunit: v./d. (standard car) (April 1998)
Road section 2003Yr. 2005Yr. 201 OYr. 2015Yr. 2020Yr. 2023Yr
Dongyuan(Gangwei) Interchange- 20592 25452 35897 45298 55608 60975
Zhaojiabao Interchange
Zhaojiabao Interchange- ~20913 25855 36529 46475 57319 63321Zhangpu Interchange
Zhangpu Interchange - 17360 21751 31767 40774 49922 56563
Duxun Interchange
Duxun Interchange - 16873 21098 30863 39653 48187 54082
Yunxiao Interchange
Yunxiao Interchange - 16283 20396 29959 38580 47981 52824
Changshan Interchange
Changshan Interchange- 14186 18826 27321 37728 46695 50943Lintou Interchange
Lintou Interchange - 16151 21157 30397 41696 52926 56960
Xishan Interchange
Xishan Interchange- 20578 24383 33276 41917 51706 56439Zhaoan Interchange
Average volume of the whole line 18124 22654 32393 41890 51527 56971
2.1.5 Land Acquired for the Project and Resettlement
The permanent land use for this project includes 11580 mu cultivated land and
4602 mu uncultivated land, while the temporary land to be used is 3100 mu.
Although efforts have been made to keep the route line away from cities, towns
and industrial zone, some residents in the villages will have to be resettled. Altogether
70097m2 houses will be removed.
2.1.6 Engineering Investment and Working Schedule
The total construction cost is estimated to be RMB 5054 million yuan, including
the funds financed by the World Bank loan amount to RMB 1.65 billion yuan, which
was listed in the Alternative Project Plan to be financed by WB for 1997-1999 fiscal
year, and approved in the official document by SPC with a reference number of [1996]
2960; subsidy from MOC amounts to RMB 1.1 billion yuan; national bank loan

amounts to RMB 1.3 billion yuan; the fund raised in Fujian amount to RMB 1004.22
million yuan.
Working schedule:
Engineering Feasibility Study: Jan. 1997-Jun. 1997
Preliminary Design: Apr. 1997-Sep. 1998
Detailed Design: Sep. 1998-Aug. 1999
Construction Period: July 1, 1999-Dec. 31, 2002
2.2 Pollution Source Analysis
This highway project will impact the environment in many ways to some extent, the
impacts during various phases are analyzed bellow:
2.2.1 Analysis of Pollution Source during Construction Phases
1. Noise sources
During the construction period of the expressway, there are many kinds of
construction machines, for example, in the treatment of subsoil, there are pile drivers,
drilling machines, pumps, mixers, etc; in the construction of earth subgrade, there are
bulldozers, loaders, road graders, rollers, etc; in the construction of bridges, there are pile
driver, hoisters, bulldozers, loaders, etc; in the construction of the highway surface course,
there are scrapers, road graders, rollers, pavers, etc. The construction machines will
produce noise ranging from 95-105dB at 15 meters away from the noise sources when
they are being operated, All these disruptive unstable noise sources will seriously impact
the acoustic environment.
Traffic noise on the major construction materials hauling roads may cause adverse
impact on the local acoustic environment.
2. Air pollution source
(1) Dust pollution
During the construction of subgrade, the loading, transporting and mixing of
construction materials will cause large amount of dust floating in the air. Dust pollution
will be induced by of wind during the piling of construction materials. Especially when
the wind velocity is rather high, and in the loading and unloading of the materials, or
during the transportation by vehicles travelling at fast speed, the dust pollution will be
even more serious. The value of dust source strength in the construction section or on the
access roads where the vehicles go to and fro causing dust flotation will depend on the
distance from the pollution sources. According to the tests result of Xian Highway
Transportation University in March 1996, when the distance is Om, the source strength
will be 11.03mg/Nm3 ; when the distance is 20m, the source strength will be
2.89mg/Nm3 ; when the distance is 50m, the source strength will be 1.15mg/Nm3 .

(2) Asphalt smokeThe asphalt smoke containing THC (Total Hydrocarbons), TSP(Total Suspended
Particles), BaP (Benzoapyrene), and other poisonous substances comes from the heating,mixing, and paving of asphalt, which will damage the health of operating workers andlocal residents.
3. Water environment pollution source
-() Oil pollution by the oil leaking from the construction machines and washed awayby rains.
(2) Water body pollution by domestic sewage and garbage from the constructioncamps.
(3) Water body pollution caused by the materials from the piling, which are washedaway by rains.
4. Impact on ecosystem because of the construction(1) Cutting and filling in the construction will destroy the vegetation along the
proposed highway. Farmland will be occupied. The structure of local ecosystem will bechanged to some extent because of the uncovering of land. Soil erosion will occur whenthe subgrade of surface is uncovered and washed away by the raining water. As a result,the fertility of the land will be decreased, the stability of land ecosystem will beimpacted.
(2) Because of the construction, some irrigation channels will be relocated; theoriginal irrigation facilities will be impacted, which induced an unfavorable impact onthe agricultural production.
(3) Construction of tunnels may impact the quality of underground water.(4) The absolute amount of farrnland will be decreased because of the land
acquisition for the highway construction.
2.2.2 Analysis of Pollution Source during Operation PhasesDuring this period, the highway construction is completed, construction workers and
facilities are withdrawn. The land affected by the construction activities are rehabilitated.So, the vehicles running on the highway will be the major impact element on theenvironment.
1. Traffic noise source
(1) The traffic noise sources caused by the running vehicles on the highway isunstable sources. During operation of the highway, the engine, the cooling system, thetransmission system of the vehicles will cause noises. In addition, the gas turbulence,discharging system, abrasion between tyres and the road surface will induce noises.
(2) Because of the roughness of the pavements, the vehicles running on theexpressway will produce noise.
"EIA Specifications for Highway Construction Projects (trial) " has regulated the
14

calculation of average radiation noise level Li, as follows:
Large vehicles: LWL=7 7 .2 X 0.1 8 VL
Medium vehicles: LwM=6 2 .6 X 0.32 VM
Small vehicles: Lws=59.3 X 0.23Vs =77.2 X 0.18 Vs
Among which, VL, VM, VS represent the velocity of large vehicles, medium vehicles,
small vehicles respectively.
2. Environmental air pollution
Pollution caused by exhaust waste gas -of vehicle mainly comes from the gas
leakage of crankcase, volatilization of combustion system and discharging of exhaust
pipe. However, most part of the CH substances and almost all of the NOx substances and
CO come from the exhaust pipe. CO is a product of incomplete combustion, which
depends on the ratio of air to fuel and the even distribution of fuel in various kind of
cylinders. NO,, is produced by oxygen in overdose air reacting with nitrogen in cylinder
with high temperature and high pressure. Tempering of the inner surface of the cylinder
and the incomplete combustion of mixed gas produces CH.
Beginning from Jan. 2000, only lead-free petrol can be used all over the country.
Therefore the exhausting gas from traffic vehicles will not result in lead pollution to air
and soil.
The recommended source strength value of exhausting gas in " EIA Specifications
for Highway Construction Projects (trial) " is shown in Tab.2-4. The data shown that the
emission numbers for CO and THC for Large vehicles is smaller than for small and
medium vehicles. And the numbers of CO for large vehicle are erratic at high speeds.
Explanations given by the researchers are: the large vehicle as 5t, 8t or heavier using
diesel oil. The combustion mechanism is different from the medium and small vehicles.
The source strength values are obtained based on experimental research and realistic
situation investigations of traffic vehicles.
Table 2-4 Recommended source strength value unit: (g/km .v)Average speed 40 50 60 70 80 90 100
(kmlh)_ _ _ ____
CO 31.34 23.68 17.90 14.76 10.24 7.72THC 8.14 6.70 6.06 5.30 4.66 4.02
Small veh. NOx 1.77 2.37 2.96 3.71 3.85 3.99
CO 30.18 26.19 24.76 25.47 28.55 34.78
Med.veh. THC 15.21 12.42 11.02 10.10 9.42 9.11NOx 5.40 6.30 7.20 8.30 8.80 9.30
CO 5.25 4.48 4.10 4.01 4.23 4.77THC 2.08 1.79 1.58 1.45 1.38 1.35
Lurg.veh. NOx 10.44 10.48 11.10 14.71 15.64 18.38
Note: CO--Carbon monoxideTHC-Total HydrocarbonsNOx-Nitrogen oxides

3. Lead source strength of unit vehicle
In the recommended source strength calculation formula of " EIA Specifications forHighway Construction Projects (trial) ", the yearly exhaust lead particle of med. vehicle
is 0.000051lmg/kg.v
4. Volume of domestic sewage and car washing waste water(1) Volume of domestic sewage can be determined according to the volume of
supplying water.
Domestic sewage COD=500mg/L, BOD5=220mg/L, Oils=lOOmg/L.
(2) Pavement runoff pollution caused by rain. Pavement runoff pollution factors
include rainfall intensity, duration of rain, volume of traffic, interval between two
rainfalls, width of pavement, length of the pollution accepted sections, etc. The
cpncentrations of pavement pollutants are shown in Table 2-5.
Table 2-5 Pollutants Concentration of Pavement Runoff
Iten PH CODcr(mg/L) Oils (mg/L) Pb (mg/L)
Average of runoff in 7.4 107 7.0 0.19120 minutes 1 7 0
(3) Volume of car washing wastewater is based on the following standard:
Car: 250-400 L/v; Passenger bus & freight truck: 400-600 L/v.
(4) Polluted water caused by cleaning of the leakage and spilling of poisonous and
harmnful substances from transport vehicles in traffic accidents
16

3 PRESENT ENVIRONMRNTAL ASSESSMENT
3.1 Status Quo of Natural Environment along the Proposed Highway
3.1.1 Land Features and TopographyThe topographical terrain of the expressway rises from southeast to northwest. It is a
rolling area in southeast part of Fujian Province, which is an extending part of Daiyun(north) & Buoping (northwest) Mountains. Geology of these areas where the rout linewill go through belongs to low-hill rolling areas, terra rossa terrace & plain.
3.1.2 MeteorologySituated in the subtropical climate with marine seasonal winds, the regions along the
expressway are mild & humid, with abundant rainfall. For farm crops there are threeharvest seasons a year. For the meteorology information along the line, see Table 3-1-1.
Table 3-1-1 Meteorology Information
Average Aea Average Average RelativeM o y rAverage Yearly Max wind Max wind foggy days tempcratureMeteorology temperature precipitation precipitation velocity in fogylayotmpraur
Station in years in years ) yelm iy m velocit years in years(0 (mm)mm years ( (d) (%)
Longhai 21 1374.7 1848.7 2.8 28 12.6 80
City
Zhangpu 21 1427 2101.7 2.5 21 11.1 78
County
Yunxiao 21.2 1712.5 2493.2 2.7 34 7.5 79
County__ _ _ _
Zhaoan 21.3 1420.8 2024.4 2.9 34 10.2 78County__ _ _ _ __ _ _ _ _ _ _ _ _ _
3.1.3 HydrogeologyThe major water systems consist of Jiulongjiang River (Nanxi Stream), Gangtouxi
Stream, Jiuzhengang, Zhangjiang River, Gangkou, and Dongxi Stream, etc. The rivers
going from northwest to southeast to empty themselves into the sea.There are three types of developmental sub ground water along the line:

(1) Bedrock joint water;
(2) Residual accumulation-sloping accumulation interstitial plerotic water;
(3) Alluvium-rdiluvium interstitial plerotic water.
3.1.4 Vegetation
The road section K8-K90 will go on mountain slopes of lightly rolling areas, while
other sections are located in plains or terraces.
Major kinds of vegetation in plains or terraces are agricultural vegetation, most of
them belong to broadleaf forests such as jequirity, while economic forests are mainly
composed of lichee and logan trees. There are four kinds of vegetation in the lightly
rolling areas: First, broadleaf trees such as jequirity, eucalyptus, and tung oil; Second,
coniferous trees like pine and fir; Third, bushes belonging to the spontaneous vegetation;
Fourth; at the foot of slopes in the rolling area are lichee and logan trees. The types of
vegetation in the heavily rolling area are similar to those in the lightly rolling area, The
only difference is that there are more bushes, and higher percentage of vegetation
coverage, and a better function of water and soil reservation. But the vegetation coverage
situation in the heavily rolling coastal areas is worse than that in the heavily rolling inner
land areas.
3.2 Present Assessment of Ecological Environment
3.2.1 Status Quo of Environment and Sampling Analysis Methods
1. Principles for choosing sampling sites:
The areas passed by the proposed highway are of varied topography with rolling
lands and plains. In the lightly rolling and plain area, lead content of the soil and the
crops is determined as an assessment factor. In order to acknowledge completely the
proper characteristics of the soil and the crops in the area along the alignment of the
proposed highway and its pollution degree, sampling sites were chosen considering the
following factors:
(DLand features, types of soil, kinds of plants (farm crops, economic crops and
vegetation);
OPollution caused by existing roads and industrial enterprises;
(©)Representative of irrigated land, dry land and orchards;
(4)Variation of traffic volume at different sections.
For sampling information, see Table 3-2-1.

Table 3-2-1 Soil Sampling Spots and Monitoring Results
Environmental PHPb OrganicOrder Village Location characteristics PH (mg/kg) _
I Xinzhong K22+100 Rolling area 7.95 26.8 3.9
2 Cili K59+500 Plain area 8.08 28.1 0.7
3 Guanyinting K84+100 Rolling area, 7.77 31.6 1.8nverside plain
4 Lintou K106+500 Light rolling plain 7.85 34.6 1.5
5 Changmaolin K131+200 Plain area passed 7.48 24.5 1.5__ _ _ I__ _ _ _ _ _ _ _ _ _ _ by 324 line
Note: Pb----Lead
2. Sampling methods and preparation
Sampling sites are arranged in the pattern of plum blossom at intervals of 50m. Soil
sampling depth is 0-20cm. At each sampling spot, 1 OOOg of soil sample is taken. After
mixing of the sanfples from 5 sampling spots, the mixed sample will be divided into 4
parts. Then 1 OOOg of sample is taken for monitoring and analysis.
The preparation of sampling, methods of analysis, and equipment used are
determined according to "Environmental Monitoring Analysis Methods", issued by SEPA
and published by China Environmental Science Publishing House.
3.2.2 Assessment of Status Quo of Soil Pollution
1. Analysis result of soil samples
For analysis result of soil samples see Table 3-2-1.
2. assessment of status quo of lead content in soil and crops
(1) For ecosystem
For lead content in the soil, Class 2 of " Standard for Soil Environment Quality"
GB15618-1995 is applied, in which the lead content in soil is limited as PbS300mgIkg.
The monitoring result shown in Table 3-2-1, indicates the lead content in 5 soil samples
is between 24.5-34.6 mg/kg, which is far below the assessment limitation (300mg/kg),
and near to the back ground level of Fujian Province (geometric average 36.4 mg/kg).
This reveals that soil along the proposed highway has not been deteriorated by lead yet,
and there is still a rather large capacity between current situation to the standard
limitation.
Analogous analysis has done for this project according to the monitoring information

of lead content of crops and fruits along Fuzhou-Quanzhou Expressway. The results are
listed in Table 3-2-2 with the assessment standard of this project. Table 3-2-2 shows that
the lead content in crops and fruits has not exceed the standard, so the crops and fruits
belong to unpolluted foods.
Table 3-2-2 Lead Content in Crops and Fruits unit: mg/kg
Crops andfruits Coarse rice Yam Taro Orange Tangerine
Lead 0.2 1 2 0.297 0.164 0.205 0.090content
Assessment 0.4 <,0.4 < 0.4 • 0.2 •0.2standard
3.2.3 Wild Plants and Animals
1. Wild Plants
The proposed highway passes through administrative areas of four counties, which
belong to subtropical rain forest field in coastal rolling area and plain in southeastern part
of Fujian Province, or Bopingling southeast wet tropical rain forest zone in southern
Fujian Province. Local vegetation belong to south Asia subtropical rain forest. According
to the investigation. the local vegetation can be divided into six type groups or 12 types.
The six type groups of vegetation are: coniferous forest vegetation type group, broad leaf
forest vegetation type group, coniferous and broad leaf mingled forest vegetation type
group, bamboo-forest vegetation type group, bush and grass vegetation type group,
economic fruit forest and farm crops vegetation type group.
2. Wild Animals
In the four counties areas along the proposed highway, there are 27 kinds of wild
animals, 98 kinds of birds, 22 kinds of aquatic animals and fishes. There are also some
kinds of shrimp, crabs, shellfishes, insects, etc.
Based on the investigation, no wild animals or plants on the list of protection by the
state are found within 500m to both sides of the proposed expressway.
3.3 Assessment of Status Quo of Soil Erosion
Fujian is one of the provinces suffering from severe soil erosion with a total eroded
area of 13,560 kim, accounting for 11.9% of the total land area of Fujian Province. It is
not only a disaster to local agriculture, forestry and animal husbandry, but also affects
navigation and power generation.
According to the information provided by the water and soil reservation committee

of Zhangzhou City, the average erosion module along the highway is 402.5-484.2 t /
km2 - y . See Table 3-3-1 for the present soil erosion status. From Table 3-3-1, we know
that the soil erosion in Zhaoan county is rather serious. Therefore, the major reservation
works to mitigate soil erosion are in Zhaoan County.
Table 3-3-1 Present Situation of Soil Erosion (Yr. 1996)
Extent of soilerosioLonghai Zhangpu Yunxiao ZhaoanExtent of soil erosion
City County County County
Area of erosion310532 125722 271115 747200
(mu)
Proportion of total land area 1672 31.3 17.58 40.5
(% ) _ _ _ _ _ _ _ _ _ _ _ _
Light erosion area 130372 112303 157453 283189(mu)
Proportion of total area(%) 41.9 89.33 58.08 37.9
Medium erosion area 59224 3026 5529 180075(mu) ___ ___
Proportion of total area(%) ~~~19.0 2.41 20.4 24.1
Heavy erosion area Heayro a93395 10393 51522 283936(mu)
Proportion of total area _ _ _°/ ~~~30.1 8.26 19.0 38.0
( __
Average erosion module402.5 402.5 402.5 484.2
(t/kn 2 * y)
3.4 Assessment of Status Quo of Social Environment
3.4.1 Present Situation of Social Environment
There are four counties along the whole line of the proposed expressway
(Longhai, Zhangpu, Yunxiao and Zhaoan), under the jurisdiction of Zhangzhou City,
which is at the southem tip of Fujian province, connecting with Xiamen City, facing
on the Taiwan Straits in the southeast.
The area of Zhanzhou City is 12607km2 . According to statistic information in
1996, the population is 436,2340; population density, 343/ kin2; birthrate, 16.81°/o,
and the average population density along the expressway is 34%oo higher than the
provincial average.
The climate is warm and humid, which is suitable for tropical and subtropical
plants. For farm crops there are three harvest seasons a year. Grain yield of Longhai

City is the highest in the province. Zhangzhou City is rich in agriculture products
such as sugar cane, mushroom, asparagus, peanut, tobacco leaf, jute, tea, tremella, etc.
More than 40 kinds of fruit such as: longan, orange, litchi, banana, and pomelo,
pineapple, and among these fruits, yield of banana, pineapple and lithi is 70% of the
provincial yield. Zhangzhou City is also famous for narcissas in the country and
overseas.
Thanks to the long coastline of Zhangzhou City, this region is rich in various
kinds of marine products, such as laver, kelp, shrimp, eel, scallop, clam, sturgeon, etc.
The primary industry of Zhangzhou City is light industry, various industries have
been developed, such as food processing, textile, building materials, chemical
industry, machinery, electronic industry, etc. A diversified industry system has been
formed already. For the major economical indexes in 1996, see Table 3-4-1.
Table 3-4-1 Economical Index of the Impacted Area
unit: 10000 yuan (Yr. 1996)
Production value of agr. & ind.Region GNP Domestic part of GNP
Total Agriculture Industry
Zhangzhou 5,774,256 1,489,187 4,285,069 3,010,881 2,995,873C ity _ _ _ _ _ _ __ _ _ _ _ _ _ _ _ _ _ _ _ _ _ _ _ _ _ _ _ _ _ _
Longhai 1,407,302 281,846 1,125,456 649,463 647,395C ity__ _ _ _ _ _ __ _ _ _ _ _ __ _ _ _ _ _
Yunxiao 442,253 99,523 342,712 237,998 237,898
Zhangpu 1,022,275 268,401 753,874 478,210 477;646C ounty __ _ _ _ _ _ _ _ _ _ __ _ _ _ _ _ _ _ _ _
- ~~ZhaoanCounty 495,943 196,120 299,823 287,791 275,679
3.4.2 Sensitive Spots along the Proposed Highway
The areas along the proposed highway are parts of the economically developed
regions in Fujian Province with active economy and dense population. The average
density of population is 34°oo higher than the level of whole province. Utilized rate of
land is rather high, having large amount of economic crops. According to the
investigation results, in the assessment scope of enviromnental impact, within 200m on
both sides of the road, there are 65 villages, 14 schools, and I hospital, and the water
sensitive spots such as Yangmei reservoir, etc. See Table 3-4-2 and 3-4-3 for the locations
of villages, schools and hospital.

Table 3-4-2 Village and Town along the Proposed Highway (Feb. 1998)
Distance Demolished ImpactedSerial . from House Family ImpactedNo. Name Location Roadside (house- (house- People
(im) hold) hold) (person)
1 Qiouzhong KO+500-700 0-60 18 22 100
2 Neixi KO+900-KI+150 6-80 15 35 200
3 Sucuo K1+460-550 Through 12 16 112
4 Jingxia K1+640-730 Througth 22 32 220
5 Chaxie K2+400-650 30-60 23 92
6 Shudou K3+900-K4+120 40-130 40 160
7 Dongyuan K4+000-250 50-140 15 55 240
8 Qiancuo, K4+850-K5+050 100-120 41 164Houcuo
9 Cuozai K5+200-320 80 19 76
10 Jiangcuo K5+600-700 Through 25 28 212
11 Cangli K5+800-K6+000 130-180 15 60
12 Xiayangpan K6+300-400 0-40 8 20 148
13 Xinyu K6+600 80 11 44
14 Xinhe K7+500-680 60-120 26 104
15 Yuanbi K7+820-960 110-140 12 48
16 Shanmei K7+800-060 60-130 10 40
17 Neijiafang K8+120-340 20 15 22 148
18 Hekeng K21+800-K22+250 60-150 45 180
19 Dashi K26+900-K27+200 70 40 160
20 Huxi K27+200-700 10-100 18 37 220
21 Jingweixin K30+440-550 30-160 18 76Village_
22 Xilin K38+430-700 140 25 100
23 Shiniuwei K40+100-300 40-60 21 40 244
24 Xiwei K41+760-K42+040 50-90 13 36 196
25 Qinshan K43+270-530 30-70 18 28 184
26 Haibianjiao K46+770-910 Through 21 28 196
27 Hougang K46+590-890 100-120 30 120
28 Houdai K47+790-K48+090 Through 54 316
29 Tulou K50+250-770 50 6 51 200
30 Guotian K50+420 33
31 Pudong K53+780-930 60-110 8 26 136
32 Ciii K58+640-850 60-130 7 20 108
33 Nanshan K60+690-940 80-160 4 25 116

Continuation of Table 3-4-2
Distance Demolished ImpactedSerial . from House Family mpacteNo. Name Location roadside (house- (house- (eople
(im) hold) hold) (person)34 Liugaowei K61+430-830 20-70 22 46 272
35 Xiagao K63+290-470 10-90 14 20 136
36 Houyin K63+500-660 47
37 Tianping K63+640-800 80-120 2 32 136
38 Yaoly K65+350-550 10-110 12 18 120
39 Gaoshan K65+690-950 Through 59 147 510
40 Shangabian K69+150-250 20-140 13 27 160
41 Fanglin K69+650-900 80-110 25 100
42 Xishan K70+700-K71+030 30-120 29 44 228
43 Shaxi Town K71+400-K72+000 120-200 61 244
44 Putou K72+500-K73+300 10-60 29 116 580
45 Fanliao K74+170-320 90-120 3 24 108
46 Luowanjing K77+900-K78+760 20-90 5 46 204
47 Wanxi K78+800-950 85 6 20 144
48 Zhizai K79+400-610 80-140 8 20 112
49 Wutian K80+450-650 200 20 80
50 Chuanchang K84+700-850 110 21 84
51 Xiagaoxi K85+000-150 200 4 20 96
52 Shudong K92+5004630 100 19 76
53 Jizai K96+200-400 60-120 10 24 136
54 Houcuoyuan K100+400-550 40-100 4 18 88
55 Yancang K106+000-200 40-130 6 127 524
56 Tianpuxu K114+900-KI15+050 40-60 12 14 104
57 Yuanqian K116+600-900 60-120 15 30 180
58 Wuxing Farn K119+650 50 83 332
59 Waifenlou K121+850-K122+100 40-110 41 164
60 Xinan Village K129+950-K130+300 200 27 108
61 Pushang Village K120+900-131+100 200 23 92
62 Changmaolin K133+320-490 160 9 24 132
63 Dianqian K135+750-850 60-80 20 13 172
64 Shangying Village K136+000-300 40 24 71 380
65 Houling Village K139+300-650 80-140 12 32 176

Table 3-4-3 School and Hospital along the Highway (Feb. 1998)
Distance fromSerialImatdpol
Name Location roadside Impacted peopleNo. (m) (person)
I Neixi Prim. Sch. K0+650 80 200
2 Houdai Prim. Sch. K47+940 40 210
3 Guotian Prim. Sch. K50+590 180 210
4 Zhuangqian Prim. Sch. K66+700 130 430
5 Gaolin mid. Sch. K67+200 100 1150
6 Fanglin Prim. Sch. K69+600 150 500
7 Shaxi mid. Sch. K71+090 70 1260
8 Shaxi Hospital K70+030 190 | 20 beds
9 Tulou Prim. Sch. K71+400 20 350
10 Beiqi Prim. Sch. K72+790 90 322
1 1 Xiqian Prim. Sch. K85+000 80 235
12 Shudong Prim. Sch. K91+400 25 100
13 Haifeng mid. Sch. K94+200 160 1200
14 Jizai Prim. Sch. K96+200 Through 155
15 Yuanqian Prim. Sch. K110+760 43 340
3.5 Assessment of Status Quo of Acoustic Environment
3.5.1 Investigation and Monitoring of Present Acoustic Environment
On-the-spot investigation and monitoring have been done according to the EIA
Outline. The current information and data of such regional and traffic noises has been
collected as Fujian Province, Zhangzhou City, Longhai City, Zhangpu County, Yunxiao
County and Zhaoan County, etc. The monitoring of the present acoustic environment has
been entrusted to Environmental Monitoring Station of Zhangzhou City. The monitoring
work was carried out during Jan. 14-16,1998 at both side of the road along the proposed
highway.

1. Sensitive Spots in Assessment Scope
According to the on-the -spot survey, acoustically sensitive spots are mainly villages,
schools and hospitals. There are altogether 80 sensitive spots, including 65 villages, 14
schools, and I hospital, see Tables 3-4-2 and 3-4-3 for reference.
2. Monitoring of Acoustic Environment in Assessment Scope
The sources of noise are life noise of villagers and traffic noise on the existinghighway. Based on the locations and characteristics of the environment, 13 monitoring
spots were set up, see Table 3-5-1. See Table 3-5-2 for monitoring results from
Environmental Monitoring Station of Zhangzhou City.
3. Method of Monitoring
The monitoring method of noise level and the equipment used were determined
according to the "Measuring Methods of Environmental Noise of Urban Area"
(GB/T14623-93), issued by the SEPA.
3.5.2 Statistic Data of Present Acoustic Environmental Noise at Sensitive Spots
According to the investigation and analysis of the characteristics, distribution,locations df the sensitive spots along the highway, also the monitoring results shown in
Table 3-5-2, the statistic data of acoustic environment are obtained, see Table 3-5-3 and3-5-4.
Table 3-5-1 Present Acoustic Environment Monitoring Spots
No. Name Location Environmental Characteristics
IT Beitou K0+200 Xiamen-Zhangzhou expressway starting point
2 Baishui Mid. Sch. K8+600 Pass on side slope beside school with Longan orchard in between
3 Huxi IC27+200 Pass through the village, 18 houses demolished
4 Haibianjiao K47+200 Port, town, mountain slope, 21 family houses demolished
5 Xiagao K63+900 Pass by the village
6 Gaoshan K66+300 26 houses demolished, building soundproof wall is possible
7 Gaolin Mid. Sch. K67+000 A mid school at mountain foot, three-story school building
8 Shaxi Mid. Sch. K71+700 70m from the road, three-story school building
9 Andou Prim. Sch. K76+300 Road is on the slope, school is down the slope
10 Guanyinting K84+100 Located between rolling hill and ZhangJiang River
11 Lintou K106+500 Light rolling plain, with interchange
12 Waifenglou K120+140 Road is in the south of mountain slope, with large bridge here
13 Changmaolin K131+200 In plain, with interchange

Table 3-5-2 Monitoring Result of Acoustic Environmentunit: dB (Jan. 14, 1998)
No. Monitoring spots Day Night
I Beitou 63.7 52.5
2 Baishui Mid. Sch. 50.2 40.0
3 Huxi 56.7 45.6
4 Haibianjiao 56.1 47.8
5 Xiagao 47.0 39.6
6 Gaoshan 41.3 41.1
7 Gaolin Mid. Sch. 53.4 37.4
8 Shaxi Mid. Sch. 46.1 39.3
9 Andou Prim. Sch. 42.2 40.0
1 0 Guanyinting 49.8 42.5
I I Lintou 47.5 38.5
12 Waifenglou 47.1 40.4
13 Changmaolin 58.0 52.5
3.5.3 Assessment of Present Environmental Noise along the Alignment
*According to the acoustic monitoring results in Table 3-5-2, and the assessment
standard in " Environmental Noise Standards in Urban Areas ", GB 3096-93, there are
only two spots (Beitou and Changmaolin) exceeding the Class 2 standard, which are the
most seriously impacted spots by the traffic noise on the existing highways. Beitou is at
the start point of Xiamen-Zhangzhou Expressway, with a large traffic volume due to
dense population and developed economy. Its noise level is 63.7dB in daytime, 52.5dB in
nighttime, both of which exceed the Class 2 standard. Changmaolin is near to the existing
national road No.324, its noise level is 58.0dB in daytime, which is below Class 2
standard, 52.5dB in nighttime exceeding the Class 2 standard..
From the present acoustic data of sensitive spots in Table 3-5-3 and 3-5-4 we can see
that none of the present noise Leq values of residential sensitive spots of villages and
towns exceed the adopted acoustic standards. Only the present noise Leq values of Neixi
Prim. Sch. and Houdai Prim. Sch. exceed Class 1 standard. Except for these two spots,
noise Leq value range of the other schools or hospital is Leq (A)=45.2-53.4dB in
daytime, Leq (A)=37.4-41.3dB in nighttime, which satisfied Class I standard of
GB3096-93. Therefore, we can draw the conclusion that the present acoustic
environment along the proposed highway is rather good.

Table 3-5-3 Noise Statistic Data of Village and Town along the Highway
unit:: dB (Jan. 16,1998)
Serial Name Location Present situation Standard Beyond valueo. Day Night Day Night Day Night
I Qiouzhong KO+500-700 54.8 46.5 70 55 0 0
2 Neixi K0+900-Kl+l50 54.5 46.4 60 50 0 0
3 Sucuo K1+460-550 53.5 45.5 70 55 0 0
4 Jingxia Kl+640-730 53.3 44.3 70 55 0 0
5 Chaxie K2+400-650 53.4 44.3 70 55 0 0
6 Shudou K3+900-K4+120 55.5 45.1 70 55 0 0
7 Dongyuan K4+000-250 56.3 45.2 70 55 0 0
8 Qiancuo, Houcuo K4+850-K5+050 56.5 45.4 60 50 0 0
9 Cuozai K5+200-320 53.0 42.5 60 50 0 0
_O liangcuo K5+600-700 52.3 42.1 70 55 0 0
II Cangli K5+800-K6+000 50.0 39.2 60 50 1 0 0
12 X;ayangfan K6+300-400 52.3 42.1 70 55 0 0
3 i Xinvu K6+600 50.2 40.2 60 50 0 0
14 Xinhe K7+500-680 50.3 40.2 70 55 0 0
15 I Yuanbi K7+820-960 49.2 39.0 60 50 0 0
16 Shanmei K7+800-060 52.0 41.5 70 55 0 0
17 j Neijiafang K8+120-340 52.2 42.0 70 55 0 0
18 Hekeng K21+800-K22+250 53.9 42.7 60 50 0 0
1 9 Dashi K26+900-K27+200 54.8 43.0 70 55 0 0
20 Huxi K27+200-700 56.7 45.6 70 55 0 0
21 Jingweixin Village K30+440-550 53.8 42.5 ] 70 55 0 0
22 XiIin K38+430-700 51.9 40.3 60 50 0 0
23 Shiniuwei K40+100-300 52.0 41.0 70 55 | 0 0
24 Xiwei K41+760-K42+040 51.8 40.1 70 55 0 0
25 Qinshan K43+270-530 54.0 42.8 | 70 55 0 0
26 Haibianjiao K46+770-910 54.8 43.0 70 55 0 0
27 Hougang K46+590-890 54.5 42.8 60 50 0 0
28 Houdai K47+790-K48+090 56.0 47.5 70 55 0 0
29 Tulou K50+250-770 53.5 42.3 70 55 0 0
30 Guotian K50+420 53.6 42.4 70 55 0 0
31 Pudong K53+780-930 53.6 42.5 70 55 0 0
32 Cili K58+640-850 55.1 45.8 70 55 0 0
| 33 | Nanshan K60+690-940 | 51.0 40.2 60 50 0 0
| 34 | Liugaowei K61+430-830 50.2 40.0 70 55 0 0

Continuation of Table 3-5-3Present situation Standard Beyond value
Serial Name LocationNo. Day Night Day Night Day Night
35 Xiagao K63+290-470 47.0 39.6 70 55 0 0
36 Huoyin K63+500-660 48.0 40.0 70 55 0 0
37 Tianping . K63+640-800 48.5 40.0 60 50 0 0
38 Yaoly K65+350-550 49.8 40.3 70 55 0 0
39 Gaoshan K65+690-950 43.3 41.1 70 55 0 0
40 Shangabian K69+150-250 48.6 40.2 70 55 0 0
41 Fanglin K69+650-900 49.2 40.5 70 55 0 0
42 Xishan K70+700-K71+030 49.4 40.9 70 55 0 0
43 Shaxi Town K71+400-K72+000 49.3 40.8 60 50 0 0
44 Putou K72+500-1K73+300 51.9 41.2 70 55 0 0
45 Fanliao K74+170-320 51.5 40.9 60 50 0 0
46 Luowanjing K77+900-K78+760 53.6 41.8 70 55 0 0
47 Wanxi K78+800-950 49.8 39.9 60 50 0 0
48 Zhizai K79+400-610 60.0 39.8 60 50 0 0
49 Wutian K80+450-650 53.0 41.5 60 50 0 0
50 Chuanchang K84+700-850 53.3 41.9 60 50 0 0
51 Xiagaoxi K85+000-150 52.8 41.2 70 55 0 0
52 Shudong K92+500-630 53.5 42.0 60 50 0 0
53 Jizai K96+200-400 52.4 41.0 70 55 0 0
54 Houcuoyuan K100+400-550 50.0 38.5 70 55 0 0
55 Yancang K106+000-200 49.0 39.0 70 55 0 0
56 Tianpuxu K114+900-KI15+050 49.8 39.2 70 55 0 0
57 Yuanqian K116+600-900 49.5 39.0 70 55 0 0
58 Wuxing Farm K119+650 48.0 39.5 70 55 0 0
59 Waifenlou K121+850-K122+100 47.1 40.0 70 55 0 0
60 Xinan Village K129+950-K130+300 50.2 41.0 60 50 0 0
61 Pushang Village K120+900-131+100 52.5 42.3 60 50 0 0
62 Changnaolin K133+320-490 58.0 52.3 60 50 0 0
63 Dianqian K135+750-850 53.4 41.8 70 55 0 0
64 Shangying Village K136+000-300 52.9 41.0 70 55 0 0
65 Houling Village K139+300-650 51.5 40.5 60 50 0 0

Table 3-5-4 Noise Statistic Data of Schools and Hospitals along the Highway unit:dB(Jan. 14 1998)
Serial Present situation Standard Beyond valueName Location
No. N Day Night Day Night Day Night
I Neixi Prim. Sch. KO+650 61.5 50.4 55 45 6.5 5.4
2 Houdai Prim. Sch. K47+940 56.0 47.5 55 45 1.0 2.5
3 Guotian Prim. Sch. K50+590 51.2 40.5 55 45 0 0
4 Zhuangqian Prim. Sch. K66+700 52.0 40.5 55 45 0 0
5 Gaolin mid. Sch. K67+200 53.4 37.4 55 45 0 0
6 Fanglin Prim. Sch. K69+600 49.2 40.5 55 45 0 0
7 Shaximid.Sch. K71+090 46.1 39.3 55 45 0 0
8 Shaxi Hospital K70+030 46.5 39.8 55 45 0 0
9 Tulou Prim. Sch. K71+400 46.3 39.5 55 45 0 0
10 Beiqi Prim. Sch. K72+790 45.2 41.0 55 45 0 0
11 Xiqian Prim. Sch. K85+000 51.8 40.2 55 45 0 0
12 Shudong Prim. Sch. K91+400 52.2 40.8 55 45 0 0
13 Haifeng mid. Sch. K94+200 53.0 41.3 55 45 0 0
14 Jizai Prim. Sch. K96+200 51.4 40.0 55 45 0 0
15 Yuanqian Prim. Sch. K110+760 49.6 38.9 55 45 0 0
3.6 Assessment of Present Atmospheric Quality
3.6.1 Present Air Environmental Quality and Assessment
3.6.1.1 Monitoring of Present Air Environmental Quality
1. Seting of monitoring points and measurement
Along the proposed Zhangzhou-Zhaoan Expressway, 4 environmental air quality
monitoring points will be set up, the locations and measurements are shown in Table 3-6-
1.
Table 3-6-1 Sampling Items and Monitoring SpotsNo.. Location Item Environmental characteristics
I-Huli NO CO TSP Road passes through village, there is house(K27+200) x, O removal
2 Cii0 NOx, CO, TSP Coastal village with clean air
Guanyinting NO CO TSP At road crossing in front of the mountain and(K84+1 00) x, O facing to water
4 Xishan NOx, CO, TSP Port
(K 1 20+200)~~~~~~~O

2. Monitoring Duration, Frequency and Analysis Methods
The monitoring of present air quality has been entrusted to the Environmental
Monitoring Station of Zhangzhou City. The monitoring began on Feb. 25 1998, 5continuous days of sampling and analysis were done. The daily sampling frequency andanalysis method are based on the regulation of GB3095-1996. See Table 3-6-2 formethods of monitoring and analysis.
Table 3-6-2 Sampling and Analysis MethodItem Sampling and Analysis MethodNOx Saltzman method in GB/T 15436-95CO Absorption Infared method in GB9801-88TSP Gravity method in GB/T 15432-95
3.6.1.2 Present Atmospheric Quality and Its Assessment
1. Monitoring result
Monitoring results of CO, NOx, and TSP from 4 monitoring spots along the
proposed highway are shown in Tables 3-6-3, 3-6-4, 3-6-5.
Table 3-6-3 Monitoring Results of CO Concentration unit:mg/Nm3
(Feb.25, 1998)Houdy awrged _ Daily average
No Sp1ng Sample Range of Beyond Range of Bod Averagespots No. cncenttionstndard 25th 26th 27th 281h lst cocet ai n dard
No. concaiiatinn /) conceno arion /)_ _ _ _ _ _ _ _ _ _ _ _ _ _ _ _ _ _ _ _ ( %/ ) _ _ _(0/c)
I Huli 20 0.75-1.88 0 1.22 1.22 1.03 1.03 1.22 1.03-1.22 0 1.222 Cili 20 0.75-1.12 0 1.03 1.03 1.22 1.22 0.94 0.84-1.03 0 0.823 Guanyinfing 20 0.75-1.12 0 0.84 1.03 1.03 1.03 0.84 0.84-1.03 0 0.954 Xishn 20 0.75-3.00 0 1.12 1 .03 1.59 0.84 1.03 0.84-1.59 0 1.22
Table 3-6-4 Monitoring Results of NOx Concentration unit:mg/Nm3
(Feb.25, 1998)Hourly average _ Daily average
No Sampling Sample Range of BeyOnd Avge of AverageTON No. cmm-4cm oAndd 25th 26th 27th 28th Is cmmb aonsndanI
.No. caicn (S/ coabCS W/§N%)I Huli 20 0.005-0.015 0 0.008 0.008 0.010 0.010 0.012 0.008-0.012 0 0.0102 Cili 20 0.005-0.020 0 0.005 0.005 0.010 0.010 0.012 0.005-0.012 0 0.0093 Guanyiing 20 0.005-0.015 0 0.005 0.008 0.010 0.012 0.012 0.005-0.012 0 0.0094 Xiian 20 0.005-0.020 0 1.12 0.005 0.010 0.010 0.016 0.005-0.016 0 0.010

Table 3-6-5 Monitoring Results of TSP Concentration unit:mg/Nm3
(Feb. 25, 1998)
Daily average
No. Sampling 25t 26th 276 28 li Range of Beyond Average
concentration (%)
I Huli 0.083 0.079 0.075 0.104 0.100 0.075-0.104 0 0.088
2 Ciii 0.164 0.051 0.076 0.113 0.058 0.051-0.164 0 0.092
3 Guanyinting 0.022 0.018 0.022 0.048 0.025 0.018-0.048 0 0.027
4 Xishan 0.036 0.024 0.028 0.076 0.056 0.024-0.075 0 0.044._ _ _ _ _ _ _ _ I _ _ _ _ _ _ _ _
2. Present Ambient Air Quality Assessment and Analysis
From Tables 3-6-3, 3-6-4, 3-6-5, the following assessment results can be gotten.
(1) One-hour average concentrations of CO in the ambient air of the 4 monitoring
spots range from 0.75 to 3.00 mg/Nm3 , and daily average values of CO range from 0.84
to 1.95 mg/Nm3 . Both of the one-hour average values and daily average values of CO
tested did not exceed the Class 2 standards in GB3095-1996, in which one-hour average
concentration of 10.00mg/Nm3 and daily average concentration of 4.00mg/Nm3 are
specified respectively
(2) One-hour average concentrations of NOx about the ambient air at the monitoring
spots range from 0.005 to 0.020 mg/Nm3 , and daily average concentration range from
0.005 to 0. 016 mg/Nm3. Both of the one-hour average concentrations and daily average
concentration of NOx tested did not exceed the class 2 standards in GB3095-1996, in
which one-hour average concentration of 0.1 5mg/Nm3 and daily average concentration of
0.1 Omg/Nm3 specified respectively.
(3) Table 3-6-5 indicates daily average concentrations of TSP in the ambient air at
the monitoring spots range from 0.018 to 0.164 mg/Nm3 , which is not higher than the
limitation of the Class2 standards in GB3095-1996 (0.30 mg/Nm3).
From the analysis above, it can be seen that the pollutants concentration of local air
is rather low, so the ambient air quality along the proposed highway is good.

3.6.2 Meteorological Features
The local climat belongs to subtropical monsoon marine climate, which is mild and
humid all year round with an average temperature of 21-C. In spring, it's chilly because
of lots of rainfalls, while in summer and autumn, the area is often attacked by typhoons
and rainstorms. It is cool in winter and hot in June-Sept, with a monthly average of 26C-
28 C. While it is colder in Jan.-Feb. with a monthly average of 11C-131C. The annual
rainfall is 1244-1742mm, concentrated in March-Sept, making up 85% of the total in the
whole year. Most of the rainfall in July-Sept. is brought by typhoon.
Figures 3-6-1, 3-6-2, 3-6-3, are wind rose diagrams drawn on the basis of the data of
1985-1996 from meteorological stations of Longhai, Yunxiao, and Zhaoan. It can be seen
that Longhai, and Zhaoan have east wind frequently, with south wind mostly in summer.
Yunxiao has a stable wind direction around the year, with northwest wind to be dominant.
From the wind rose we can see that the local area has a small frequency of static wind.
The yearly average wind velocity in Longhai, Yunxiao and Zhaoan are 1.5m/s, 2.3m/s,
and 2.1 m/s respectively.
Based on the collected data about surface wind and cloud obtained in 1994, 1995
and 1996 by meteorological stations in the said 3 counties, using Pascal Stability Method
(P. S), we calculate average annual stability frequency, see Table3-6-6. It is apparent from
the table that the neutral weather (D type stability) appears most frequently, followed by
the stable weather (E-F types).
Table 3-6-6 Seasonal & Yearly Occurrence Frequency of Atmospheric Stability
Area Unstable(A-B) Moderate unstable (C) Neutral(D) Stable(E-F)
Longhai 8.5 13.1 58.4 20.0
Yunxiao 7.0 8.5 65.0 19.5
Zhaoan 4.6 6.2 71.6 17.6

I ~N' ; N
- - 4 ..... . ...
W X E i E
July (summer) c=9% January (winter) c= 11%
N,, N
4W 7 E E iJ --.-.... E
October (autumn) c= 12% April (spring) c=14%
! I
.. .. . .. ...-. ,/-
ES U
Yearly average c=t1 3%
Figure 3-6-1 Four Season and YeakrlyAverage Wind Rose Diagram for Longbai

N N
/7z t EN -...... N NE
3I~~ W
Ski : y SE Ski .SE
S S
July (summer) c=14% January (winter) c=8%
N
............ - .. ....
i1
d ru n. EW * 'N. f
I.
October (autumnu) c=7% April (sprilla) c= 15%
Y l e-I .I
/ ;W o \
'~~~~, >...o *d1 E
3W~~ - ~ .7Z '/~
I .W . :..
Sl. \-.---
Yerl avraec-1
Fiue -- Fu eao ndYalyAerg in oe igamfrYusa

I N I N
14u I' I lIo
i-i Er |W _* /i)
5tW *** E W _ o'R
July (summer) c= 10% January (winter) c=1 8%
,-i' I ,."- '@\
1 I 'Wi
\ . ,, ;~ ~~~ . . -s,
N~~~~~~~October (autumn.) c=14% April (spring) c=13%
. ........
1I\
.. . . . . . . ...
Yearly average c=14%
Figure 3-6-3 Four Season and Yearly Average Wind Rose Diagram of Zhaoan

3.7 Present Water Environment and AssessmentRiver Regimes along the proposed expressway include Naxi Stream of Jiukongjiang,
Yangmei Reservoir, Luxi Stream, Jiuzhen Port, Zhangjiang River, and Zhaoanwan Port,
etc. See Figure 2-1 for the relationships between the river regimes and the proposed
expressway.
3.7.1 River Regimes & Hydrogeology
1. Naxi Stream of Jiukongjiang and its river mouth
Naxi Stream of Jiukongjiang is a tributary stream of Jiulongjiang River, which is the
largest river in Zhangzhou City. Nanxi Stream comes from Mt. Buopingling of Pinghe
County, with a total length of 65km, 666km2 of catchment area, and 452 million m3 of
annual flow. The max. width of the river at the down reaches is 470m, water depth is 6m,
and the max. section flow velocity is 1600 m3/s during rising tide; The min. width of the
river at the down reaches is 235m, water depth is 0.7m, min. section flow velocity is 60
m3 /s during ebbing tide. The Xixi Stream and Beixi Stream, the two trunk streams of
Jiulongjiang River and Nanxi Stream will gather into the sea. The Jinlongjiang River
mouth is a joint point for the main water systems to empty themselves into the sea. From
Beijian in Jiaomei Town, Longhai County at the boundary of Haican, XiamenCity in the
north to Gangwei Town of Longhai City, the coastline is 98km, facing Xiamen and
Gulangyu Islands across the sea, where yearly average flow volume is 13790million m3 .
2. Yangmei Reservoir in Zhangpu
Yangmei Reservoir is in Yanmen Village of Chiling Township, located at the upper
reaches of Fuotanxi Brook in Zhangpu County. The yearly average flow volume is 4326
mi3 ; normal water level is 65m, with 59.8km2 of catchment and 38 million m3 capacity of
the reservoir; the adjusted flood water level 68m, 55.3 million m3 of total relative
capacity of the reservoir. Total area is 5.1 km2; average water depth is 21m. Yanmei
reservoir is a construction project mainly for irragation.
3. Luxi Stream and Jiuzhen Port
Deriving from Houmen Village of Pinghe County, Luxi Stream has a total length of
57km, with 700 km2 of chatchment area, and 803million m3 of yearly average flow
volume. A sluice gate at the lower reaches of the river plays a important role in water
accumulation, to assure the water supply to residents and factories, and to prevent back
flow of sea water in tidal season. Jiuzhen Port is located at the top of Futouwan Port.
From the tip of the coastline of Liuao peninsula in the east, to Huli Village in Duxun
Town in the west, the total coastline is 43.5km with a water area of 1.5 million rn2 , theaverage tidal difference is 3.1 m.
4. Zhangjiang River and its river mouthDeriving from the foot of Dafeng Mountain in Pinghe County, Luxi Stream has a
total trunk length of 66.2km with 1038km2 of chatchment area and 950million m3 of
27

yearly average flow volume. Zhangjiang River runs into Dongshanwan Bay in the end.The total coastline is more than 150km with a water area of 266.8 million m2 and an
average tidal difference 2.3m.
5. Port of Zhaoanwan
The extra large bridge at Port of the proposed highway is located in an area whereseveral brooks join together in Sidu Town in Zhaoan County with small flow volume.
The river water runs into Zhaoanwan Bay in the end. The Zhaoanwan Bay is under the
jurisdiction of both Dongshan County and Zhanan County, where water quality is good,
maintaining the characteristics of outer sea water. Obvious pollution has not been found
by the present investigation.
Water environmental impact assessment of this project is determined as class 3
assessment. According to the hydrological information and the specific locations where
the highway strides over the river sections, based on the "EIA Technical Guide"
Hj/T2.1-2.3-93 and the water quality investigation, the Completely Mixed Model is
adopted to predict the effect of the rainwater runoff on the water quality, and the one
dimensional dynamic model of tides is used to prognosticate the pollution of water
quality at the river mouth.
3.7.2 Assessment On Present Surface Water Environment
3.7.2.1 Survey of Present Water Quality
1. Methods
(1) Sectional arrangement
The proposed highway will go through Nanxi Stream of Jiulongjiang in Longhai
City; Yarnmei Reservior and Jiuzhen Port in Zahngpu County, Zhangjiang River in
Yunxiao County, Port of Zhaoanwan in Zhaoan County etc. 10 river sections were set up
as sampling points, see Table 3-7-1 and the appendix map for sectional arrangement and
sampling information.
(2) Sampling time and frequency
On-the-spot sampling was carried out during January 14-21,1998. One sampling spot
was selected at every river section to carry out surface water sampling according to high
tide, low tide and normal tide situations. For the water source of the reservoirs, 2 samples
were prepared.
(3) Survey items
There are 6 survey items selected altogether, including PH, Oil, DO, CODW,, SS, and
temperature.
(4) Analysis methods
The whole procedures of sampling assemble, reservation, and transport were carried
out according to the regulations in "Environmental Monitoring Analysis Methods",

"Analysis Methods on Water Quality" GB7466-7494-87 and GB11889-11915-89.
Analysis methods and min. detection limits are shown in Table 3-7-2.
Table 3-7-1 Sectional Arrangement for Water Quality Survey
No. Place Specific location Characteristics
Il Nanxi Stream of Jiulongjiang, At upper reaches of Xinxu Tidal sectionat upper reaches,
2 Nanxi Stream of Jiulongiang, At lower reaches of Xinxu Tidal seaionAt lower reaches,
3 Yangmn( Reservoir In the east of Youkeng Freshwater(I)
Yangmei Reservoir4 In the west of Youkeng Freshwater
(2)Jiuzhen Port,
5 6 At upper reaches of Jiuzhen Port Sea water
At lower reaches,7 hAnJiauppe reaor, At upper reaches of Jiuzhen Port Tidal section
8 Zhangjiang River, At lower reaches of jiuzhen Port Tidal sectionAt lower reaches,
97Port of Zhaoanwan, At upper reaches of Port Sea serAt upper reaches,
80 PtoZhona, At lower reaches ofiuze Port Seda waertoAt lower reaches,
Pot of Zhaoanwan,10 Aloerecs, At lower reaches of Port Sea water
Table 3-7-2 Water Quality Monitoring Items and Analysis Method
Item Analysis method Equipment Min. detection limit
PH electrode PH meter 0.02
CODm. Alkaline KMnO4 0.1 5(mg/1)
COD, Acidic KMnOW_ 0.5(mg/1)
DO Iodine value method 0.2(mg/1)Ultraviolet Ultraviolet
Oil spectrophotometer method spectrophotometer 0.05(mg/)SS Gravity method
3.7.2.2 Survey Results of Present Conditions
Monitoring results are shown in Table 3-7-3. Due to the construction at the upperreaches, the average SS monitoring value of Nanxi Stream of Jiulongjian is so high as
841mg/1.

Table 3-7-3 Monitoring Result Statistic of Water Quality atVarious River Sections (Jan. 14, 1998)
River No. of No. of COD,, DO Oil SSsection Section Sample (mg/1) (mg/I) (mg/I) (mg,I)
I 6 Monitoring 7.58-7.68 2.9-3.1 6.0-6.6 0.05-0.07 736-920value range
of 2 6 Monitoring 7.60-7.69 3.0-3.2 5.8-6.4 0.04-0.05 730-900
Jiulongjiang value range
Average 7.63 3.0 6.2 0.05 841
_3 3 ve Monitoring 7.02-7.17 2.2-2.5 6.3-8.8 0.025 1-13
Yangmei oitrnReservoir 4 3 Monitoring 7.10-7.21 2.2-2.3 6.7-8.8 0.025 8-18
Average 7.13 2.3 7.6 0.025 10.1
5 6 Monitoring 7.70-7.78 2.4-2.5 7.5-7.9 0.025 20-73value range
Jiuzhen Port 6 6 Monitoring 7.74--7.80 2.4-2.7 7.6-9.6 0.025 26-87value range
Average 7.74 2.5 8.0 0.025 46
7 6 lvonitoring 7.66-7.68 1.5-1.8 7.0-7.8 0.025 72-88value range
Zhangjiang 7 6 Monitoring 7.67 2.8-3.0 6.3-7.2 0.025 244-289River value range
Average 7.69 2.3 7.2 0.025 167
9 6 value range 7.75-7.79 2.5-2.8 7.8-9.0 0.025 16-24
Port 10 6 Monitoring 7.65-7.76 2.9-3.1 9.3-9.6 0.025 25-158Value range i l l l
Average |7.73 2.8 8.7 0.025 43
3.7.3 Assessment of Present Surface Water Quality
Single index and standard exceeding methods were used for the assessment and
analysis of the present surface water quality.
3.7.3.1 Assessment methods
1. Selection of assessment factors
Assessment factors are PH, DO, CODmn, oil, SS.

2. Assessment standardsAccording to the environmental characteristics and functions of the surface water
bodies, assessment standard are determined as follows. For Yangmei Reservoir, class II
standard in " Surface Water Quality Standards " GB 3838-88 (see Table 3-7-4) was
applied. For Jiuzhen Port and Pot of Zhaoanwan, class 2 standard in "Water Quality
Standards for Sea Water" GB 3097-97 ( see Table 3-7-5) was adopted. For the tidal
sections in Nanxi Stream of Jiulongjiang and Zhangjiang River, class 2 standard in
"Water Quality Standards for Sea Water" GB 3097-97 or the class m standard in
Surface Water Quality Standards " GB 3838-88 was used. Because there is no SS
(Suspended Solid) standard for surface water, the SS of irrigation water is used. The
limitations are: 150mg/I for water farming irrigation water, 200 mg/I for dry farming
irrigation water, and 100 mg/l for vegetable irrigation water.
3. Division and naming of assessment type
Assessments were carried out section by section. If all factors did not exceed class
I standard, the water quality in the section was determined as class I standard. If one
factor or some factors for assessment surpassed class I Standard, but fell bellow class
II Standard, the water quality in the section were determined as class II standard. In
this way, class IJI and class IV water could be determined.
Table 3-7-4 Surface Water Quality Standards (GB3838-88) unit: mg/l
X-em I | II | III f IV VpH 6.5 8.5 6~-9
CODMfl< 2 4 6 8 10
DO ¢ Saturation rate 90% 6 5 3 2Oil 0.05 0.05 0.05 0.05 1.0
Table 3-7-5 Sea Water Quality Standards (GB3097-97) unit: mg/IThe Max. dissolved concentration (mg/I)
Item Class 1 Class 2 Class 3
pH 7.5-8.5 7.5-8.5 6.8-8.8
COD, <2 <3 <4DO >6 >5 >4Oil <0.05 <0.05 <0.30
SS 1I0 S50 < 100
41

3.7.3.2 Assessment results and analysis
See Table 3-7-6 for the results, which are analyzed as follows:1. Nanxi Stream of Jiulongiiang River System
The water quality of Nanxi Stream met the adopted Surface Water Quality
Standard (Class III), but exceed the adopted Seawater Quality Standards (Class 2).
2.Yiangmei Reservoir
The water quality of Yiangmei Reservoir satisfied the adopted Surface Water Quality
Standard (Class II).
3. Jiouzhen Port
The water quality of Jiouzhen Port satisfied the adopted Sea Water Quality
Standard (Class 2).
4. Zhangjiang River
The water quality of Zhangjiang River met the adopted Surface Water Quality
Standard (Class III), but exceed the adopted Seawater Quality Standards (Class 2).
5. Zhaoanwan Port
The water quality of Zhaoanwan Port met the adopted Seawater Quality Standards
(Class 2).
Table 3-7-6 Assessment Results of Water Quality
ItemResult pH COD, DO Oil SS Assessment standard
River section
At upper reaches of 1.1 2.11 l 1 3, 1 Class2ofIGB397-97Nanxi ~~XinxuICls2ofG3079Narixi At lower reaches of 3,11 I l 2,11 Classillof GB3838-88
Xinxu . 3 3Satisfied
In the east of Youkeng I 11 swatery
Yangmei _ standard Class 11 of GB 3838-88Reservoir Satisfied
.In the west of Youkeng I 11 I I Fwahery
____________ ___________________ ______ ~standardAt upper reaches of 1 2 1 1 2
Jiuzhen Jiuzhen Port - _Class 2 of GB 3097-97Port At lower reaches of 1 2 1 1 2
Jiuzhen PortAt upper reaches of 3I11 11 11Cls2fBO79
ZhangiiangGuanyintingCls2ofG3079Zhangjiang At lower reaches of I, 1 2,11 l I _ 3 ClasslIlof GB3838-88
Guaniyinting I,I ,1 1,1 ,1 3At upper reaches of 1 2 1 1 2
Zhaoan--. Zhaoanwan Bay - 2 - Class 2 of GB 3097-97Zhaoa At lower reaches of 1 2 I 1 2
Zhaoanwan Bay ________ ___
42

4 PREDICTED ENVIRONMENTAL IMPACTS & MITIGATION
MEASURES
4.1 Analysis of Impacts on the Ecosystem
4.1.1 Prediction and Assessment of Impacts of Lead Content in Soil
1. Calculation of annual emission source strength of lead from a single vehicle
The lead annual emission source strength from a single vehicle is calculated by using
the following formula:
F1= Jj pbi X .P -365/G
where:
Ji - average oil consumption of I type vehicle (Lfkm), calculated on the basis of
20 L per hundred kilometers of oil consumption for all kinds of vehicles;
pb;-amount of lead compound in petrol, taken as 0. I 4g/L;
J7 emission rate from the exhaust pipe, taken as 75% normally;
P- settlement of lead dust in the study area, taken as 60%;
G-soil quality of cultivated soil layer within the length of 100 km in the study
area, taken as 150 t/mu;
i stands for small, medium and large vehicles;
365 - days in one year
F, =0.2x0.14x0.75x0.6x 365150000x300
=0.0001 022mg/kg
2. Prediction model of lead contentsThe lead contents at different spots is predicted according to the following formula:
where:
n
W0 = Bo + KX Rik'-'1-1
W--accumulated amount of lead in the i year in Layer A (mg/kg);
K-residual rate of lead in the soil, taken as K=0.95;
B. ackground value of lead contents in Layer A (mg/kg);
R,-annual input of lead in n year in the soil (mg/kg).
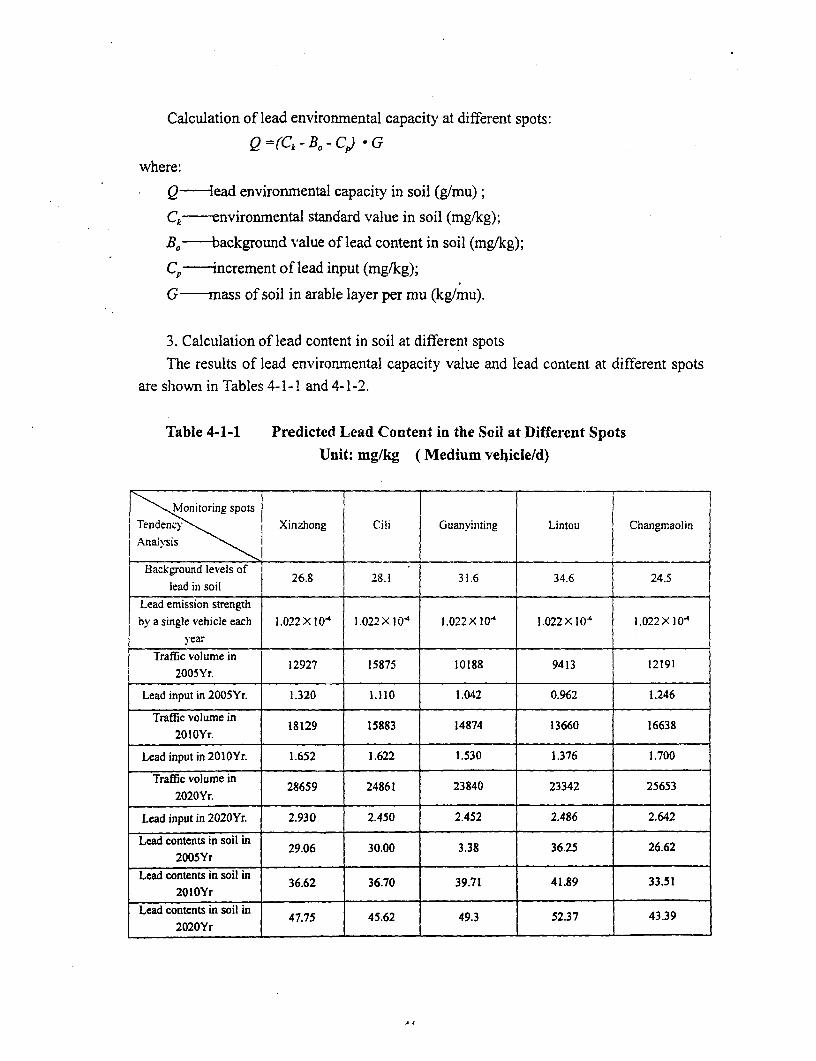
Calculation of lead environmental capacity at different spots:
Q =(Ck -Bo -Cd 'Gwhere:
Q-lead environmental capacity in soil (g/mu);
Ck-environmental standard value in soil (mg/kg);
Bol-background value of lead content in soil (mg/kg);
Cp- increment of lead input (mg/kg);
G---mass of soil in arable layer per mu (kg/mu).
3. Calculation of lead content in soil at different spots
The results of lead envirorinental capacity value and lead content at different spots
are shown in Tables 4-1-1 and 4-1-2.
Table 4-1-1 Predicted Lead Content in the Soil at Different SpotsUnit: mg/kg (Medium vehicle/d)
i ~ ~~~~~~~ ~~~ ~ ~~ ............\Monitoring spt
Tendency s s Xinzhong Ciii Guanviiting Lintou Changmaolin
Analysis
Background levels of 26.8 28.1 31.6 34.6 24.5
lead in soil
Lead emission strength
by a single vehicle cach 1.022 X I O' 1.022 X 10⁴ 1.022 X 10⁴ I .022 X 104 1.022 X 10 4
year
Traffic volume in 12927 15875 10188 9413 12191
2005Yr. I 1
Lead input in 2005Yr. 1.320 1.110 1.042 0.962 1.246
Traffic volume in 18129 15883 14874 13660 166382010Yr.
Lead input in 201OYr. 1.652 1.622 1.530 1.376 1.700
Traffic volume in 28659 24861 23840 23342 256532020Yr.
Lead input in 2020Yr. 2.930 2.450 2.452 2.486 2.642
Lead contents in soil in 29.06 30.00 3.38 36.25 26.62
2005Yr .
Lead contents in soil in 36.62 36.70 39.71 41.89 33.51
2010Yr
Lead contents in soil in 47.75 45.62 49.3 52.37 43.39
2020Yr

Table 4-1-2 Lead Capacity in Soil at Different Spots Unit: mg/kg
Monitoring spots
Lead Xinzhong Ciii Guanyinting Lintou Changmaolin
contents
Assessment standards 300 300 300 300 300of lead in soil
Background levels of.26.8 28.1 31.6 34.6 24.5
lead in soil
Lead input in 2005Yr. 1.320 1.110 1.042 0.962 1.246
Lead input in 201OYr. 1.852 1.662 1.530 1.376 1.700
Lead input in 2020Yr. 2.930 2.450 2.452 2.486 2.642
Lead capacity inLead capacit in 40782 40618 40103 39665 411382005Yr. (g/mu)
Lead capacity in lLead capacity in 40705 40541 40045 1 39603 41070201OYr. (g/mu)______ _ _ _ _ _ _I
Lead capacity in2020Yr. (g/mu) 40540 40471 39892 39437 40928
4. Prediction and assessment of lead content in soil
Tables 4-1-1 and 4-1-2 present the lead content and lead capacity at various sections
of the proposed alignment on the basis of different kinds of soil, terrain, traffic volumes
and environments. The assessment of lead environmental quality in the soil at different
monitoring spots represents the impact assessment of lead content in the soil along the
proposed project. The predicted values in Table 4-1-1 show that the lead content is
increased as the traffic volume increases after the highway is put into operation. The
background value of lead content at present at Xinzhong, for example, is 26.8 mg/kg. In
2010, the 7th year after operation, however, the lead content will come up to 36.62 mg/kg.
While in 2020, the amount will be as high as 47.75 mg/kg.
It is shown from Table 4-1-2 that after the highway is put into operation, the lead
dust will be accumulated continuously because of increased traffic volumes, thus leading
to increased lead content and decrease of lead capacity. The lead capacity in the soil at
Xinzhong is 40,782 g/mu in 2005. However, the number will be decreased to 40,705g/mu
in 2010, and in 2020 the number will be 40,540g/mu. The increase of lead content year
after year in soil, or the decrease of lead capacity in soil , is caused by the pollution of the
lead particulate from the vehicular exhaust pipes.

4.1.2 The Potential Impact of the Alignment on the Farming along the Project
The highway construction will have impacts on farming in many ways involving
social economy and ecological environment etc. Some impacts are positive, while others
are negative. With respect to positive impacts, the construction of the highway will
promote economic growth in both local areas concerned and Fujian Province as a whole
by bettering investment environment attracting foreign capitals, It can also improve
tourist industry and relieve the traffic congestion on the existing Highway No.324. On
the other hand , the proposed highway will have some adverse impacts on farming
production. The land use of right-of-way will be permanent, which will lead to decrease
of agricultural production causing some loss in agriculture along the proposed alignment.
Since the arable land per capita in the study area is only 0.54- 0.66 mu, the use of land
for right-of-way has made the problem more serious. On the basis of on-the-spot survey,
the land use for right-of-way is shown in Table 4-1-3. The temporary land use includes
earthworks and stone quarries, spoil sites, access roads for construction, prefabrication
sites and construction camps. The temporary land use will last for four years. The
contractor will be responsible to rehabilitate the temporarily used lands after
construction.
The total land area for permanent land use (including paddy and non-irrigated land)
will be 11,385 mu. Assuming that the average yield is 1,114 kg per mu, the reduction of
grains every year will be 12,682.89 t, meaning a loss of 20.2926 million RMB yuan (1.6
yuan per kilogram). The construction will use 2,608 mu of orchards, which means a loss
of 52.16 million yuan per year (20 thousand yuan per mu). The alignment will use 195
mu of aquatic ponds, which means a loss of 5.85 million yuan per year ( 30 thousand
yuan per mu).During the operation phase, there will be heavy traffic volumes, long-term operation
in particular, which will cause adverse impacts on the environment due to the particles
and NOx from exhaust pipes. It is seen from Table 4-1-1 that because of the increased
traffic volumes, the background value of lead content in the soil along the both sides of
the highway will be increased from present 24.5 -34.6 mg/kg to 43.39- 52.37 mg/kg (the
year of 2020). However, beginning from Jan. 2000, only lead free oil can be use in our
country, the exhausted gas from traffic vehicles will not cause lead pollution to the
environment.

Table 4-1-3 Land Acquired for the Expressway Construction unit: mu (Sep. 1998)
Land usage Permanent land acquired
Temporary land acquiredLad type Cultivated land Uncultivated land Total
area
\ Subtotal Rice Dry Pond Subtotal Orchards Hilly Waste Other Building Subtotal Cultivated Uncultivated\\Pfield land land land land land land land
Longhai City 1653 1061 561 31 389 120 154 11 104 348 200 148 2390
Zhangpu County 4843.5 2503 2311.1 29.4 2010.2 1090.3 659.9 127.2 86.8 46 633.9 385.5 248.4 7487.6
Yunxiao County 2334.26 2103.08 190 41.18 787.68 605.15 170 12.53 925.08 324.4 600.68 4047.02-
Zhaoan County 2749.30 973.36 1682.42 93.52 1415.37 792.33 145.65 399.91 48.33 29.15 1192.7 681.3 511.4 5357.37
Total of 11580.06 6640.44 4744.52 195.1 4602.25 2608 1130 527 146 191 3099.68 1591.2 1508.48 19282Zhangzhou City

Table 4-1-4 Temporarily Land Acquisition
Chainage Used for Length Width Area Locat Dry land & land Hilly land with Fishponds Orchards(tn) (m) (m2) ation for other use (mu) woods (mu) (mu) (mu)
K I 9+000 Spoil site Outside Baishui T. 69K14+200
K24+036 Spoil site Baizhuhu Farm 70
K324+030 Spoil site Outside Xihu T 50
K32+900- Spoil site Chitu Township 38K38+900 Solst
K46+740 Borrow site 200 80 16000 Outside Jiuzhen T 24
K46+540 Quarries 400 100 40000 Xicuo outside Jiuzhen T. 60
K46+590-740 Prefabricating site for bridge 150 100 15000 Outside Jiuzhen T 19 5c
K48+200-360 Prefabricating site for bridge 160 g0 12S00 Hioudai Village,liouzhen 19
K60+140 Borrow site 200 80 16000 Outside Xiamei T 24
K77+390 Quarries 400 t00 40000 Luowanjing Village.Shaxi T. 50
K60+260 Quarries 400 150 60000 Yuanbian Village,Xiamei T 90
K104+420- Spoil site 20 9 Tiandu T., Zhaoan County 2.7
K112+870- Spoil site 20 20 400 Jinxing Township,Zhaoan County 6KI 18+590
K142+390- Spoil site 15 30 450 Shenqiao T.,Zhaoan County 6.75K 140+442
Total 136.05 43 5 84

4.1.3 Protection of Wild Animals and Plants
Based on the result of investigation, no state protected wild animal and plant have
been found in the assessment scope along the proposed highway. However during the
process of construction, the workers should be informed of the relevant laws and
regulations of animals and plants protection. In construction activities, if these animals
and plants are encountered, the authorities should be informed of findings in order to take
proper measures to protect them. Clauses concerning protection of wild animals and
plants should be involved in the biding construction documents.
4.1.4 Protection Measures for Ecological Environment
(1) In the construction stage, the following measures will be taken to protect
ecosystems. The construction procedures and sequences will be well arranged. It will be
constructed section by section and the period of construction will be as short as possible.
In the early construction, the following works will be completed at the same time if
possible: subgrade, slope protection, drainage, retaining walls, plantation of trees and
grass. In this way, the vegetation will be restored very soon and soil erosion will be
reduced to a great extent. It is suggested that after the subgrade works and protection
works are completed, the earthworks of another section be started.
(2) Management of temporary land use will be enhanced. As soon as the
construction is finished, the land for temporary use will be restored and rehabilitated
without any unreasonable delay.
(3) To ensure flood discharge and irrigation, the construction of bridges and culverts
will be conducted prior to other works.
(4) No waste earth and stones will be allowed dumping freely. Spoil, slugs and
domestic garbage will not be pernitted to be dumped on the slopes of valleys to prevent
from silting rivers or irrigation canals.
(5) Borrow sites and spoil sites will be reconstructed or leveled on completion of the
works for rehabilitation and plantation.
(6) The top soil layer will be saved and returned to the land after the construction
work is completed to minimize impacts on ecosystem and agriculture.
See Table 4-1-4 for the specific locations of borrow sites and spoil sites.
4.1.5 Measures and Suggestions about Vegetation Restoration
1. Plantation of roadsides and medium dividers
The scope from the shoulders on both roadsides to the boundaries of right-of-way
and dividers will be treed or grassed; the total plantation area of both dividers and

roadsides is 515.27 mu and 8,412.6 mu respectively.
2. Plantation of Interchanges
Calculated according to the Drawings for Interchanges, the areas to be greened are
estimated to be 120 mu. There are 9 interchanges, covering 1,108 mu of plantation.
3. Plantation of service centers and toll stations
There are 11 toll stations and 2 service centers. If one toll station needs 3.6 mu and
one service center needs 6.6 mu for plantation, the total plantation area will be 46.2mu.
4. Plantation of tunnel portals and two ends of. extra large bridge approaches
There are two tunnels and 7 especially large bridges. If each portal needs 20 mu and
each bridge needs 25 mu for plantation, there will be 215 mu for plantation put together.
The above mentioned items all fall into plantation of right-of-way which covers
about 10,269.07 mu accounting for 53.25 % of the total land acquired for the proposed
highway. The plantation of the right-of-way will not only compensate for the loss of
green land, but also create a better landscape and ecosystem on both sides of the road.
The practice of all expressways proves that the green belts on roadsides can improve the
ecological environment in the belt-shaped regions.
Suggestions on plantation are as follows
1. Special designs will be needed for the plantation according to the types of
subgrade and certain sections, landscape of the road and sight attraction.
2. The plantation on both sides will be integrated into subgrade protection, control of
noise, air pollution and soil conservation. The width of plantation belts will be as wide as
possible.3. The slope of the embankment will be turfed. The plantation of high retaining walls
for high embankments will be integrated with plant protection. The area between the toe
and side ditches will be planted with evergreen bushes or bushes bearing colorful flowers,
The area from side ditches to the boundary of right-of-way will be planted with both
bush and arbor trees.
4. Special plantation design will be performed for plantation of the portals of tunnels
and interchanges. Every plantation area will have its own characteristics with various
kinds and patterns and/or architectural ornaments where necessary. Besides level
plantation, vertical plantation will also be done to form a scenic zone with all-sided
vertical plantation.
5. The plantation in the service areas will be in harmony with the local planning and
types of buildings, and lawns and plants bearing flowers and ornamental trees will be
planted mainly.

4.2 Prediction of Soil Erosion during Construction Phase
4.2.1 Prediction Model for Soil Erosion
In this EIA, an American common model issued by American Ministry of
Agriculture was adopted to predict soil erosion.
A=R * K * L S 5 - C - Pwhere:
A -erosion strength ( t / km 2 * y);
R erosion force factor;
K-soil factor;
L-slope length factor;
S-grade factor;
C-over and management factor;
P -water and soil conservation factor.
4.2.2 Value of Various Factors Adopted in EIA
RP-represents dynamics of water loss related to precipitation and rain force. It
may be thought of as unchangeable before and after the construction.
K-epresents the sensitivity of soil to erosion related to size of soil granules and
organic matter in the soil. In general, the top soil of farmland has round granular structure
wit medium seeping speed. When K is less than 0.4, the sub-top soil is characterized by
lamella and block structure with slow or medium seeping speed. When K is between
0.42-0.46, the value is taken as 0.45.
LS - epresents factors of slope length and grade called terrain factors. It is
calculated by using the following model:
LS = A )(65.4Isin 0 +4.56sinO + 0.065)22.13
where:
A - slope length (m) measured from the starting point of runoff to the point
where mud and sand begins to settle or the runoff goes into the river, A =50 m before
highway construction. When the height of the embankment is 3-4 m, A = 6 m from the
pavement to the side ditch.
0 -angle of slope. 0= 12° before highway construction, 0= 370 after highway
construction;

m-empirical index. When 9= =12, then m= 0.5, while 6=37', then m=0.8;on the basis of calculation, before the highway construction LSs 5.735, while
after the highway construction, LS= 9.327 at the embankment.
C-surface cover factor. According to Tables 4-2-1 and 4-2-2, when there is not
any cover or continuous fallow land, C is taken as 1.0. Before the construction, C=0.5,while after the construction C=1.0.
P-water and soil conservation factor. The P value at the construction site is taken
according to Table 4-2-3. P = 0.7 before the highway construction, P = 1.0 after the
highway construction.
4.2.3 Calculation of Soil Erosion
To calculate the soil erosion, the values of the above parameters will be substituted
to the prediction model. In order to simplify the calculation, the erosion strength before
the construction is assumed as A,, while that after the construction as A2. Therefore, the
prediction model can be reduced to
A2 R2K2LS2P2C, K2LS2P2C2
Al R,KJLSAIC1 KLSI1 P1C
A2 0.45x9.327x l Ox 1.0 = 5.211Al 0.4x5.753x0.5x0.7
The calculation of soil erosion during the construction phase is shown in Table 4-2-4,
which shows that the erosion strength during the construction phase is 5.211 times that
before the construction, indicating that the soil erosion is quite serious during the
construction. The soil erosion modules in Longhai City, Zhangpu Counrty and 'Yrunxiao
County will increase to a great extent as compared to that before the construction, that is,from 402.5 t / km / year to 2097.4 t / km / year. And it is from 484.2 t / km / year to
2523.2 t / km / year in Zhaoan County. This means that the original Class I slight erosion
will turn to Class III medium erosion. Therefore, we can conclude that the prevention
measures against the soil erosion during the construction are of great significance. It ispredicted that the soil erosion strength will be restored to the level before the
construction in 3-5 year's time after the highway is put into operation due to the more
complete drainage systems and the restoration of vegetation. Besides, thanks to theupgraded pavement and highway plantation, the situation of soil erosion in the futurealong the highway will be alleviated than the situation before construction. So, we cansay that the aggravated soil erosion during the construction will be short lasting. In the
long run, the construction of the highway will in effect mitigate the erosion of soil.

Table 4-2-1 C Value of Various Crops
Kinds of crops & management C level
Fallow or black fallow land 1.0
Herbage or bean cultures 0.01
Sown or shortly after harvest 0.3..0.8
Growing season: grains 0.1-0.3
Wheat . 0.05-0.15
Cotton 0.4
Grass land 0.01
Table 4-2-2 C Value of Various Vegetation
Ground cover (%)Vegetation
10 20 40 { 60 80 100
Grassland 0.45 0.24 0.15 0.09 0.043 0.011
Bushes 0.4 0.22 0.12 0.085 I 0.040 0.011
Mixtur aor3 bus 0.39 0.20 0.11 0.06 0.027 0.007& arbors
Dense forests 0.10 0.08 0.06 0.02 0.004 0.001
Table 4-2-3 P Value at the Construction Site
Types of construction sites P levels
Irregular ground for construction by bulldozers or loaders 1.0
Leveled loose ground 0.9Leveled and compacted ground 0.7
Subgrade compacted by layers 0.1
Drainage or interception ditches 0.6
Grit catchers 0.4
Retaining walls 0.5-0.8

Here we have only the soil erosion at the subgrade construction place. The erosion at
the borrow and spoil sites are not predicted, but it is estimated that the results will be the
same as that at the subgrade construction site or slightly less than that.
Table 4-2-4 Potential Soil Erosion Prediction during Construction Phaseunit: T/km2Y
Places Longhai Zhangpu Yunxiao Zhaoan.________________ City County County County
Prediction levels during 2097.4 2097.4 2097.4 2523.2
Background levels of soil 402.5 402.5 402.5 484.2erosion
4.2.4 Earthwork Balance of Subgrade Works
The total length of the proposed highway is 140.459 km with the subgrade being 26
m wide. The average subgrade fill elevation in the plain is 3.9 m. The terrain where
section(K8 - K23) is to be situated is of heavy rolling areas; K 74 - K 90 is on the slope
with other sections being on the plains or light rolling areas. Two tunnels will be built,
namely Kuzhishan Tunnel and Dabushan Tunnel. The plain areas are characterized by
filling, while mountains and tunnels by cutting.
Soil erosion occur mainly during subgrade construction. It is suggested that the
earthworks be balanced within the section itself and allocated longitudinally to minimize
soil erosion and the cost. The earthwork balance of various sections is shown in Table 4-
2-5. It shows that the cutting is 12,924,800 cubic meters, the filling is 12,529,900 cubic
meters. For one kilometer, the self-used earthwork, long haulage used earthwork, borrow
earthwork and spoil earthwork are 784,038 cubic meters, 9,090,765 cubic meters,
2,010,122 cubic meters and 2,783,353 cubic meters respectively. Where the alignment
goes along the mountain slope, mountain cutting will be done, especially at K 69 + 800.
K 87 +400, K128+630 and at Keling and Changshan which needs 20-30 m of cutting of
mountain body. This may lead to instability of the mountain body and more regional soil
erosion.
54

Table 4-2-5 Earth and Stone Works Balance unit: m3
Cuning Filling Used for local section Used for other places Borrow SpoilSection
Earth Stone Earth Stone Earth Stone Earnh Stone Earth Stone Earth Stone
KO+000- 59615 251678 616998 251678 10731 10067 4884 241611 2557373 13828K6-*000
K6+000- 734176 1329603 710930 209957 127138 5K0042 583792 143119 37339 1136442K 14+200
K34+500 2209076 588969 1773011 264131 125686 14957 1847867 228045 201705 270184 345967
K34tS00- 1 00571 692557 271471 588018 24676 1459I 346795 573427 12005 104539K45+052
K45+052- 341007 185039 564693 21735 11464 316918 175930K53+590
K53+590- 1189890 976816 2077868 109879 50701 982515 17320 114726K79+590
K87+350 15368 6574 727789 102064 989 127 284702 101937 442101
K87+350- 610829 137329 372329 264934 89429 9963 282900 254971 150000K92+990
K92+990 444477 533272 1025630 533276 21228 8238 423251 525038 581153
K1l21+590 687759 583060 1129543 33127 21689 576010 368605 78622 192766
K121+590- 732049 515097 945610 32727 5630 487575 279553 173064 211747 229914K142+210
SubtotalTotal 712815 5799994 1031586 214658 586614 197469 6181209 2909556 2070122 773775 2009628
Total ofearth& stone 12924809 12529920 784083 9090765 27833353

4.2.5 Impacts of Poor Geology on the Project
According to the prospecting, the major poor geological conditions of this project
are as follows.
a. soft soil subgrade;
b. 30 m depth of mountain body cutting at Keling and Changshan with potential of
slope sliding.
Sections of soft soil subgrade in the recomn)ended scheme are distributed as follows:
K1-K7, K62-K65, K81-K88, K123-127, with a total length of 27.57km.
Steep slopes may form at the large-scaled cutting parts, which can easily induce
collapse. Protection measure as rolling and digging steep slopes into step shape and
setting blind ditches should be adopted. Dangerous rock on slopes should be removed to
ensure the safety during construction.
The soft soil ground base have a wide distribution of muddy clay and mud which
form a deep layer of soft soil with a high void ratio and a high water content. Subgrade
sinking can be easily induced on the soft soil ground base. So, protection treatments,
such as using plastic drainage boards, soil replacement, geotextile and cement stirring
piles, should be adopted.
4.2.6 Plan to Prevent Soil Erosion
Based on " Management Regulations on Water and Soil Conservation in
Construction Projects" and relevant regulations in the Water and Soil Conservation Study
Report, the water and Soil Conservation Erosion Prevention Plan has been worked out.
The current situation and prediction of soil erosion along the alignment are given in
detail, so this section deals only with the control measures against soil loss.
4.2.6.1 Principles and Objectives of Soil Erosion Prevention Schemes
1. The policy
(1) Water and Soil Conservation Act of PRC;
(2) Execution Regulations on Water and Soil Conservation Act of PRC;
(3) Management Regulations on Water and Soil Conservation Schemes in
Construction Projects issued by Minister of Water Conservancy, State Planning
Committee and State Environmental Protection Agency;
(4) Management Regulations on Water and Soil Conservation in Construction
Projects issued as the 5th Circular by the Minister of Water Conservancy;
(5) Technical Specifications for Water and Soil Conservation issued by the
Ministries of Water Conservancy and Electric Power; (SD 238 -87);
(6) A Letter by Fujian Provincial Office of Water and Soil Conservancy on Execution
of the 5 Circular of the Ministry of Conservancy, No 155 { 1995];(7) A Reply Letter on Compensation Charge for Water and Soil Loss issued by Fujian

Price Committee and Financial Division, No 393 [1996];
2. Objectives(1) Damage to the facilities for water and soil conservancy will be minimized and
compensated for in case of loss;
(2) Waste earth and stone will be disposed of properly;
(3) Slide, collapse and subsidence will be prevented completely;
(4) The top soil and vegetation damaged by borrow sites and cutting will be restored;
(5) Basic farmland will be saved and protected;
(6) Damage resulting from the soil erosion to enterprises and individuals will be
avoided;
(7) Engineering measures to prevent the soil erosion will be taken.
4.2.6.2 Engineering Measures against Water and Soil Erosion
1. In order to minimize soil and water loss, culvert pipes will be embedded before
subgrade filling where necessary, and the subgrade construction works will be completed
in a possible short time.
2. Management of waste earth/stone works
Because of the undulate terrain of the project, there will be a great amount of cutting
and filling, which is good for earthwork balance in longitudinal allocation. The spoil is
estimated to be 2,783,353 cubic meters including 773,725 cubic meters of earth and
2,009,628 cubic meters of stone. Table 4-2-6 has presented the area for spoil sites and
kinds of land to be used. The principal requirements for selection and design of spoil
sites are as follows.
Table 4-2-6 Locations and Areas of Spoil Sites unit: muPlaces Position Length Width Dry land &
Plaesosiion(m) (nm) other land
Outside KO + 000- 69Baishui T. K14 +200
Baizhuhu farm K14+200- 70K24+036 7
Outside K24+036- so
Xihu T. K32+900 . The spoil sites will have piling
Chitu Township K32+900 38 capacity for disposition of the
K310+4200 spoil from Kuzhishan tunnelTiandu T. K 1 0+2+80 20 9 2.7
Jinxing Township K 112+870- 20 20 6KI 18+590
Shenqiao T K125+390- 15 30 6.75K 140+442
(1) Within the impact scope down the spoil sites, there should not be any village and
important public utilities. In addition, they will not be located in the areas apt to collapse

or slide.
(2) The height of dumping should not be higher than the surrounding ground level.
(3) Cut off ditches will be installed at the top slope of the tall stone dumps.(4) When the elevation of the dump is higher than 5 meters, level terraces of 1.5 -
2.0 will be built up every 5 additional meters. The fill height will not be more than 1:1.0.
(5) To discharge seepage, blind pipes of 250 - 300 mm will be provided with athickness of 300 -500 mm of pebbles bonded.
(6) The top surface will be treed or grassed.
3. Locations of borrow sites
The borrow amount for this highway is estimated to be 2,010,120 cubic meters. The
borrow sites selected include Bijia Mountains, Dongyuanhou Mountains, Jian Mountains,
Dakuo Mountains, Hou Mountains behind Dongsha Brick and Tile Factory,Nioushenkeng, Laohu Mountains, and South Mountains etc. The above mentioned siteswill be identified for certain in the initial and construction drawing designs withconsultation with departments of planning, environmental protection and waterconservancy to avoid further environmental issues.
4. Protection works
In the construction of the highway, cutting and borrow will be done on a large scalecausing exposure of slope, collapse and slides. The most serious situation, a mud-rock
flow would happen by accident. Therefore, the slopes resulting from mountain body
cutting needs protecting. The locations of bigger protection slopes and amount of work
are shown in Table 4-2-7. The requirements for the design of the slopes caused by cutting
and filling are as follows:
(1) The grade of slope will be determnined by the filling materials, filling elevation,
the original terrain and geology and climate etc. The slope subject to soakage will be 1:2
and will be strengthened according to the water level.
(2) The grade of the slopes in the cutting sections is based on the geological
structure, and the elevation of the cutting side slope.
(3) When the elevation is more than 10 meters, compound cross section will be used,
i.e. a terrace with drainage systems will be provided at a certain distance.(4) At sections in the rolling areas where there are both cutting and filling , the
filling will be done after the retaining walls are set up. If the cut slopes are not stableenough, they will be strengthened by grouted schist. The cut slopes close to the highway
will be provided with retaining walls.(5) The explosive quantity for each blasting operation will be strictly limited to less
than 1O kg for fear that it should cause loose slopes.

Table 4-2-7 Major Slopes Caused by Cutting
Slope protection Length of
Sections Length Width Area interception
(m) (m) (m2 ) ditches (m)
K1+860-K2+158 298 25 7450 348
K9+940-K10+50 110 6 660 122
KI+100-KI1+600 500 11 5500 522
K13+450-K13+620 170 8 1360 186
K13+830-K13+900 70 10 700 90
K14+100-K14+300 200 9 1800 220
K15+420-K15+610 190 15 2850 220
K15+740-K15+860 120 10 1200 140
K18+700-K18+900 200 17 3400 334
K22+670-K22+800 130 5 650 140
K23+080-K23+250 170 6 1020 182
K23+600-K23+720 120 5 6000 130
K22+770-K24+500 1730 8 13840 1746
K24+900-K25+100 200 8 1600 216
K30+130-K30+300 I 170 | 10 1700 190K31+470-K31+650 180 9 1620 200K34+560-K34+760 200 X 18 3600 236
K35+810-K35+950 140 5 700 150
K36+250-K36+550 300 11 3300 322
K37+150-K37+300 150 6 900 162
K39+250-K39+400 150 8 1200 166
K39+970-K40+170 100 6 600 112
K40+580-K40+670 90 7 720 110
K42+490-K42+690 200 14 3400 248
K48+430-K48+550 120 12 1400 144
K48+740-K48+900 160 11 1760 182
K49+840-K50+290 450 10 450 470
K54+840-K55+090 250 5 1250 260
K55+640-K55+890 250 4 1000 260
K57+600-K58+000 400 5 2000 410
K59+290-K59+790 500 8 4000 516
K60+340-K60+540 200 25 5000 250
K61+000-K61+250 250 8 2000 266

Continuation of Table 4-2-7
Slope protection Length of
Sections Length Width Area interception(in) (in) (in2) ditches (m)
K65+390-K65+810 420 10 4200 440
K66+500-K66+960 460 9 4140 478
K67+240-K67+540 300 12 3600 324
K68+120-K68+290 170 4 680 178
K69+460-K69+660 200 5 1000 210
K71+000-K71+220 220 17 3740 254
K72+010-K72+210 200 18 3600 236
K74+480-K74+690 210 14 2940 238
K77+740-K78+010 250 13 3250 276
K91+000-K91+150 150 14 2100 178
K92+120-K92+260 140 12 1680 162
K92+090-K92+190 100 I10 1000 120
K97+000-K97+450 450 32 14400 514
K99+000-K99+150 150 16 2400 182
K103+320-K103+730 410 4 1640 420
K105+340-K105+940 600 10 6000 620
K106+340-K106+540 200 6 | 1200 216
K109+640-K109+790 150 6 900 162
K111+440-KI1+860 420 8 3360 436
K112+620-K112+720 100 9 900 120
K112+940-K113+090 150 10 1500 170
K113+270-K113+390 120 7 840 134
K115+210-K115+310 100 7 700 114
K117+140-K117+240 100 6 600 112
K118+740-K119+340 600 21 12600 642
K119+690-K119+94 250 17 4250 284
K121+290-K121+450 160 7 1120 174
K127+410-K127+590 180 13 2340 206
K129+890-K130+130 240 10 2400 260
K132+290-K132+390 100 6 600 112
K133+090-K133+310 220 4 880 228
K138+450-K138+550 100 5 500 110
K139+640-K140+090 450 14 6300 474
Total 186080 40884

5. Drainage works
Collapse and slides are caused by rain seepage and inflow water. Therefore, the
slope protection works are very important, and in case of larger cut slopes, cut-off ditcheswill be installed 2 meters away from the top the slopes to prevent slides and mud currents
in case of heavy rains. The sections to be installed with cut-off ditches are shown in
Table 4-2-7. In engineering design, enough drainage facilities will be considered to
ensure smooth and clear drainage on both side* of the pavement. The design of the
drainage facilities must meet the requirements in "Specifications for Highway
Engineering Design"
6. Restoration of Vegetation
(1) The areas within the acquired land, near crossings and residential quarters will betreed with bushes and or arbors.
(2) Slopes of subgrade and slopes of cut areas will be treed or grassed. If the waste
spoil areas are permanent, earth and stone slugs will be compacted and covered with topsoil for rehabilitation or afforestation.
(3) The species of trees and plants suggested are: gulfweed, China fir, Criptomeriafortunei, tung tree. monthly rose, Malus spectabilis, saururus chinensis. greenbristle grass,
alfalfa and false indigo etc.
4.2.6.3 Management of Plan Execution
1. Institution
Fujian Provincial Expressway Construction Directorate Office and the branches in
various counties and cities are responsible for execution of water and soil conservation
protection measures. These measures include that designers carry out the conservation
plan and construction drawing design, that the design contents are specified in tending
documents as contracts, that the quality of the facilities are strictly controlled and
supervised and that the personnel from environmental protection departments and water
and soil conservancy departments take part in the acceptance of the protection works. In
the operation phase, full-time personnel from Fujian Expressway Company ltd. entrusted
by the province will be in charge of environmental protection including routine
maintenance of the facilities.
2. Technical measures
(1) Traits and awareness of the workers on environmental protection will be takeninto account in selecting contractors. The concerning requirements will be involved in
the clauses of contract.

(2) The supervisors with better knowledge in water and soil conservation will be
appointed to the job.
(3) Both the employer and contractor will spend the cost on technical training and
supervision or study in prevention of soil erosion.
(4) The locations of borrow and spoil areas and quarries will be selected with
consultant with local authorities for water and soil conservation.
(5) Rehabilitation of borrow sites and management of the site for the spoil of tunnels
will be implemented by the contractors, and supervised by the supervision engineers
local EPB.
(6) RMB1.5 million yuan will be spent on the 8 borrows sites, RMB 1.2 million
yuan on the 7 spoil plants, and RMB 0.3 million on the spoil treatment at the 2
prefabrication plants for the large bridges, with a total amount of RMB 3.9 million yuan.
4.3 Impact Analysis of Social Environment
4.3.1 Beneficial Analysis of Social Environment
1. The construction of the highway is the requirements for the formation of the
national artery highway network consisting of "two longitudinal and three transverse
roads". Zhangzhou-Zhaoan Expressway is one of the important sections of the National
Artery Highway from Neilongjiang to Sanya of Hainanin in Fujian Province. Its
construction will certainly speed up the development of highway construction in the
coastal areas. The Zhangzhou-Zhaoan Highway is connected with Xiamen-Zhangzhou
and Xiamen-Fuzhou Expressways in the north, and with Shantou-Chaoan-Fenshuiguan
and Shantao-Shenzhen Expressways in the south. That serves as a direct passage from
the capital of Fujian to Guangdong, Hong Kong and Macao and forms a fast and
complete highway network in the Southeast and Zhujiang Delta. Thus it will help to
bring the "special areas" into full play.
2. The construction of the highway will play an important role in the regional
economic growth by improving investment enviromnent. The City of Zhangzhou which
the proposed alignment passes by is one of the important parts in Southeast Fujian. It is
also one of the seven areas in the country which enjoy priority to develop. It has been
listed as an agriculture demonstration area and an experimental area for the cooperation
between Taiwan and the Mainland. Zhangzhou is also an intensive interest of investrnent
for businessmen from Taiwan, Hong Kong and Macao and foreign countries as well. So
far as many as 2000 or more enterprises of foreign capital have been approved with more
than 1000 of them put into business including some exceptionally large projects. Theactual investment has amounted to 2.3 billian US dollars. Therefore, it is critical to speed
up communication means in this area to better investment environment.

3. It will play an important role in unification of the nation and economic growth
both in the Mainland and Taiwan. Taiwan Province is very similar to Fujian Province in
population, culture, language , custom, and human geography. About 80% of the
population in Taiwan are originally from Fujian, 8 million of which from Zhanzhou.
Unification of the nation is the common concern of all the Chinese people. To summary,
the construction of the highway is of great significance in promoting the economy in both
Mainland and Tainwan,.and in achieving "three accessibility" (by post communication,
aviation and trade ) and academic communications.
4. The construction of the highway is the necessity of the increase of the traffic
volumes
The existing Zhangzhou-Zhaoan section of the National Road No.324 can not meet
the development of communications and transportation due to poor technical standards,
severe mixed traffic, poor driving conditions, low speed, frequent traffic accidents and
urbanization of some road sections. The 1996's average annual daily traffic (AADT) was
7,606 (medium-sized vehicles), even 8,429 in some sections, with crowdedness of 1.69%,close to saturation. To solve the problem, the construction of a new highway is the only
solution.
4.3.2 Analysis of Impact of Highway Construction on Life of Residents
4.3.2.1 Land Acquisition and Resettlement
The proposed alignment will permanently occupy 11,385 mu of farmland, which
means a loss 20.2926 million RMB yuan every year; occupy 2,608mu of orchards
meaning losing RMB 52.16 million yuan every year; occupy 195 mu of fishery ponds
meaning losing RMB 3.85 million yuan every year. It will temporarily occupy 1,591mu
of cultivated land and 1,509 mu of uncultivated land. Although the project will take some
cultivated land, the land taken is distributed patchily in various villages; so it will not
cause any changes in industrial structure and serious impact on the living standards of
local villager. On the other hand, the construction of the Highway will improve the
investment environment, and promote the regional economic growth, especially develop
the tertiary industry of local area. As a result, more employment opportunities will be
created for the local farmers. Therefore, the construction of this highway project will
increase the economic incomes of the local farmers living along the alignment.
The amount of house demolition is shown in Table 4-3-1. In the alignment design,
although efforts were made to avoid towns and villages, some demolition is unavoidable
because of dense population and developed economy. In the scope that within 200 m
from the road side along the proposed highway, there are: 65 villages, 14 schools, and 1

hospital. The houses demolished altogether are 70,097 m 2 , including 20,858m2 of brickand concrete buildings, 41,161m2 of brick and timber buildings, 2,126m2 of timber andearth buildings, and 5,952 m2 simple structure buildings.
Table 4-3-1 Amount of Housing Demolition (Sep. 1998)
Area and number of Buildings Fenced
Belonging Brick & Brick & limber & Simple gardensto concrete timber earth . structure Total (itt2 )
buildings buildings buildings buildings) No. o No. (m No. (o. . (ml) No.
Longhai 1540 5 26356 162 3126 31 31022 198 70.1City _ _ _ _ _ __ _ _
Zhangpu 14797 126 10604 82 737 6 1679 30 27817 244 43County____
Yunxiao 1390 6 2110 12 630 9 615 6 4745 33 10.68County ___
Zhaoan 3131 18 2091 18 759 9 532 9 6513 54 12.02
Total of TZhangzhou 20858 155 41161 274 2126 25 5952 76 7 0097 5255 136I C ity _ _ _ I _ _ _ _ _ _ I _ _ I _ _ _ _ I _ _ _ _ _ _ _
Note: Data in the table is provided by the resenlement office of this project.
The resettlement is planned as follows: the households to be removed will be givenhomestead for building new houses. The Project constructors also will compensate themfor the lost land with currency. It is suggested that the new houses be built nearby tominimize the social impacts. However, it will inevitably put some inconvenience to thelocal people.
In order to carry out the resettlement smoothly, special personnel and institutions areto be established in cooperation with the local govemments. The organizations will beresponsible for the overall resettlement planning, compensation and so on. In the longrun, the living conditions of the residents will be improved and renewed.
4.3.2.2 Impacts on Traffic Convenience of ResidenceThe average subgrade elevation in the light rolling areas is about 3 meters, and the
highway is grade-separated and access-controlled, so it will unavoidably bring someinconvenience to the local communities. To minimize the adverse impact, the followingfacilities are planned to be built: 9 interchanges, 79 grade separations, 292 underpasses atan average interval of 370m, which can meet the requirements of public communities onboth sides of the road. In the design of the underpasses, the following factors will betaken into account: distribution of villages, convenience of the local residents, divisions
of farmlands, and convenience for people's living and production. Emphasis has beenlaid on the quality of the underpasses to ensure that no water accumulation will occur inthe rainy seasons. In the design of the underpasses, consideration is given to the width
64

and clearance to allow for the further improvement. Meanwhile, efforts are made by the
employers and designers to accept the rational suggestions and opinions of the local
residents, which will be put into practice in the future construction according to the
characteristics of the Project.
The interchanges along the alignment serve as entrances and exits for vehicles
providing convenient access to the highway to the local people. Therefore, the proposedproject will be of great benefit to the public in traveling, transportation and trade.
4.3.2.3 Promotion of Tourism in Zhangzhou Prefecture
The Project will promote the tourism along the route. There are numerous cultural
relics and tourist resorts, such as Yundong Rocks, Baiyunyan Temple, Yeshan Lecture
Hall in Longhai City; Ziyun Peak of Tianzhu Mountains,Tianzhu Temple, Jianchun
Bridge and Baizhangping in Zhangpu County; Nine Monkeis Mount, Wanghai Building,
Fenshui Pass in Zhaoan County etc. Besides those, there are sea beaches and beautiful
scenery in southern China. The building of the highway will bring all these tourist
resources into full exploitation and utilization.
4.3.3 Risk Analysis of Accidents
4.3.3.1 Identification of Environmental Risk Factors
The potential risk may be of ecosystem and pollution of surface water. The
alignment will extend for more than one hundred kilometers passing through mountains,
rivers and hills. Since the project is a permanent one, its potential risk may be also
permanent. The potential risks may be:
1. Traffic accidents caused by storms, long-lasting rain, typhoon and thick fog that
occur very frequently in Zhangzhou Prefecture in southeast China where there is a lot of
rain and thunderstorms as well as typhoons to exert impact upon the operation of the
expressway, even enclosure of the expressway.
2. Risk of traffic accidents and hazardous materials spill. Based on the relevant data,
the rate of traffic accidents on the expressway can be reduced by 25% as compared with
that on the ordinary highway. However, the absolute number of the accidents on the
expressway is more because of higher speed and great traffic volumes. Furthermore, the
accidents are usually serious causing greater damages. The materials transported may betoxic materials, oil, liquefied petroleum gas (LPG), pesticide or fertilizer, which may
cause pollution to the environment.3. Since there are lots of rivers with more bridges, once accidents occur on the
bridge desks, they may interfere with traffic or even pollute the water in the river.
65

4. Enough culverts and bridges will be set up to connect the water systems on bothsides of the highway, considering the fact that the average elevation of the subgrade is 3.9m above the ground level in the plain areas, which may block the natural runoff and washaway the subgrades.
5. Because the height of the slopes may reach 20-30 m due to heavy cutting in therolling areas, there may be collapse if the quality of protection work is not ensured.
6. Underground hydrology may be interfered by excavation of tunnels so as toimpact the growth of plants above the tunnels. Accident in tunnels will seriously influentthe operation of the proposed expressway.
7. Engineering quality may be impacted by weak subsoil subgrade.8. According to the prediction of environmental impact, the project may cause
environmental noise, pollution of agricultural ecosystem and water due to increasedtraffic volumes.
The problems posed in 4, 5, 6, 7, 8, above can be solved by means of appropriatemanagement and design. For detail, see "Implementation of Environmental ManagementPlan". The emphasis of risk assessment is about traffic accidents and transport ofhazardous materials.
4.3.3.2 Impact Analysis of Accidental Rate on Existing Highway
Since the reform and opening-up in the country, Zhangzhou Prefecture has seen fastgrowth of both economy and transportation. However, the service of the existinghighway has been deteriorated due to too heavy traffic and other factors such as mixedtraffic, interference of tractor traffic and overload etc. leading to frequent traffic accidentsand traffic congestion. Table 4-3-2 shows indetail the tendency of increase of trafficaccidents year after year. The financial loss resulting from the traffic accidents in 1994amounts to RMB 7,435,900 yuan, 7.25 times more than that in 1990, which demonstratesthe necessity for the construction of the new expressway to mitigate the crowdedness andreduce traffic accidents. Besides, it can also enhance the living standards of the residentsalong the aligrunent, thus strengthening the stability of society. In addition, the gooddriving conditions and beautiful scenery will relieve the fatigue of the drivers andpassengers. Consequently, there will be much fewer traffic accidents.
66

Table 4-3-2 Traffic Accidents on Existing No. 324 National Highway
from 1982-1998
Times of accident Injury Mortality Economic lossYear
(time) (person) (person) (l OOOOyuan)
1982 512 457 55 30.31
1983 504 434 60 38.40
1984 521 463 57 41.54
1985 644 465 99 62.65
1986 861 552 100 104.01
1987 942 569 145 126.02
1988 873 571 182 185.23
1989 788 486 143 155.66
1990 653 446 120 102.54
1991 673 401 151 146.78
1992 j 690 407 165 206.68
1993 773 411 188 207.03
1994 886 199 484 449.25
1995 825 231 598 625.17
1996 837 239 727 748.13
1997 896 201 642 889.63
1998 1156 223 905 1020.36
4.3.3.3 Analysis of Risk of Hazardous Materials Spill
It is unavoidable to transport toxic chemicals on the proposed highway, the risk of
which is the sudden leakage and explosion resulting in serious pollution disasters in a
very short time and causing great property loss. The possibility of the accidents is
obtained through the following empirical formula:
P=Q 1 XQ 2 XQ 3 XQ 4 XQ 5 XQ 6XQ 7
67

where:
P-robability of risky accidents of hazardous materials.
Q, robability of the rate of traffic accidents at present(times/year), taken as
1156 times /year, according to Table4-3-2.
Q2 Ratio of vehicles carrying hazardous materials to total trucks (%), taken as
7.2%.
Q 3 -Ratio of trucks to traffic volumes (%), taken as 63.2%.
Q4 - Ratio of critical sections including bridges, tunnels, reservoirs or the section
passing through villages to the whole mileage (%), taken as 11%.
Q5 Ratio of predicted traffic volume to current traffic volume(%), taken as 279%,
383% and 594%.
Q6 Reduction rate of traffic accidents due to expressway (%), taken as 25%
(USA 1974's data).
Q T--Ratio of serious traffic accidents to minor traffic accidents(%), taklen as 15%.
The possibility of accidents because of the transportation of hazardous chemicals inthe critical sections is shown in Table 4-3-3.
Table 4-3-3 Analysis of Risk of Hazardous Materials
Spill on the Proposed Highway
Year Accident probability of the transportation of hazardous materials
1995 0.605/year
2010 0.83 1/year
2020 1.239/year
4.3.4 Cultural & Historical Relics Investigation
Names of the cultural and historical relics to be protected along the proposed
highway and protective measures for them are listed in Table 4-3-4. Their exploration
and investigation were completed by the Archaeological Investigation Team of Fujian
Provincial Cultural and Historical Relics Management Committee by March 15, 1999.
68

Table 4-3-4 Distribution of relics along Zhangzhao expressway & protective measures
Relics Road sections Site Age Interference Proposed protective measureswith the project
Fenglinwei A section (Dongyun) Fengming Building of 1 5m away from the I. A bridge for the section is to be built and rotary-drilling technique will be used for theHui temple link road (k2+ 100) village, Dongyun Qing embankment construction of the piers. Precautions against the vibration of construction equipment
town, Longhai dynasty should be taken properly.city (above 2. The protective measures should be taken in cooperation with the local cultural unit.
ground)Xidong ruin B section (k34+600- Xidong village, Ancient The proposed 1. Rescuing Excavation is to be carried out by the local cultural unit in the early stage of
k35+ 100) Chitu town, building Xidong large bridge construction so that the articles found will be measured the cleaned and the detailedZhangpu county (under will pass the hill at 2 information be gathered.
ground) places 2. Precious excavated articles will be sent to the cultural unit in the county for_____________ preservation.
Nanshan B section (k61+300- Zhennan village, Ancient The proposed Dittoruin K61+600) Duxun town, building expressway will pass
Zhangpu county (under through it.
Shangabian B section (k69+650- Shangabian Ancient The proposed 1. In site exploration and investigation will be carried so that the pictures, drawings canruin K69+700) village, Xizhen building expressway will pass be obtained and the detailed information be gathered.
town, Zhangpu (above through the north 2. Rescuing excavation is to be carried out at the northwestem comer of the ruin. Thecounty ground) corner of it. unearthed articlcs will be sent to the cultural unit in the county for preservation.
3. Precious articles above ground should also be protected appropriately.4. Environmental monitoring should be carried out during construction and operation
phases.
Luowanjing B section (k78+1 00- Luanwanjing Ancient kiln The proposed I. Rescuing excavation is to be carried out during the early stage of construction. Theancient kiln K79+200) village, Shaxi expressway will pass unearthed articles will be sent to the cultural unit in the county for preservation.
town, Zhangpu through it in the east- 2. Special exhibitions will be held for the excavated articles and informnation obtained bycounty west direction. the cultural unit.
3. Anything unpredictable should be considered properly by the contractor and thel___ __ __ __ _ _ __ __ __ __ _ __ __ __ _] __ _ __ __ __ __ _ __ __ __ __ __ _ __ _ __ __ __ _ __ __ __ _ _ cultural unit.
69

4.3.5 Mitigation Measures of Impacts on Social Environment
4.3.5.1 Mitigation Measures of Impacts of Land Acquisition and Resettlement
The total area of land acquired for the project is 19,282 mu including 11,580 mu of
cultivated land, 4,602 mu of uncultivated land. Temporary land taken is 3,100 mu. The
average farmland per farmer is only 0.54-o.66 mu along the alignment, so the farmland
acquisition will have adverse impact on the output of agriculture. The mitigation
measures to be taken are as follows.
1. Institutions responsible for the land acquisition and resettlement at different levels
will be established prior to the commencement of the construction.
2. The resettlement office of this project is responsible to make the statistics of the
amount of acquired land exactly for compensation on the basis of policy and regulations.
3. The compensation will be sent directly to the bottom organizations for
argritertiary or argribusiness to increase income of the farmers.
4. Part of the compensation will be sent to the farmers whose land are acquired to
compensate the economic loss.
5. For the households that will lose land, the cultivated land will be realloted to them
or they will be resettled by providing employment opportunities by the local government.
In China, land belongs to the state, reallotment of land to them is easy to come true.
6. The resettlement office of this project will directly send the compensation for
young crops to their owners to ensure that their life will not be impacted.
Mitigation measures for resettlement include
1. The households to be removed will be resettled prior to the beginning of the
project.
2. The resettlement office of this project is responsible to make the statistics for the
number of the householders to be removed exactly for compensation on the basis of the
policy.
3. Resettlement will be carried out with the help of the local government, and the
funds for compensation shall not be used for other purposes.
4. Resettlement places will be planned by the local government to save land
resources.
70

4.3.5.2 Mitigation Measures of Impact on Infrastructure
1. Irrigation protection works
(1) The construction of facilities related to irrigation or streams such as small bridges,
culverts, aqueducts or canals will be conducted before the rain season. And the
construction will be completed before the rainy seasons to ensure the farmland irrigation.
(2) 68 medium or small bridges and 585 culverts, with an average of one culvert at
an interval of 315.6m, have been designed to ensure smooth flow of water irrigation
canals or streams, and the acceptance of water in ponds will not be blocked.
2. Mitigation measures of impact on local roads
(1) The construction materials are hauled by using local roads. The pavement is easy
to be damaged because of heavy traffic and great tonnage. Therefore, after the project is
completed, the damaged road should be repaired by the construction unit.
(2) The alignment will not have any adverse impact on local roads during the
operation phase because there are 9 interchanges, 79 grade separations and 292
underpasses. It is required that the engineering design will ensure no water be
accumulated in the rainy seasons so as to ensure the smooth traffic flow.
4.3.5.3 Traffic Severance
The Project is a grade-separated and access-controlled expressway, so it may bring
about some inconvenience to the local residents, especially in the seven villages through
which the road passes in particular. To guarantee the contact and communication of the
residents, along the whole aligmnent, 292 underpasses, 79 grade separations will be set
up. On average, the arnount of underpasses per kilometer will satisfy the requirements.
4.3.5.4 Mitigation Measures of Impact on Safety
1. The highway executive agencies is responsible for the inspection of overloading
trucks, or trucks with any leakage or bulk goods. No such vehicle will be allowed to
drive on the expressway.
2. The relevant authorities will be informed of the transport of hazardous materials.
It will be strictly monitored to prevent accidents.
3. In case of accidental spill of hazardous materials, the patrolmen will use the
71

emergency telephone system to inform the concerning organizations such as public
security and environment protection agencies. Prompt actions will be taken immediately
based on the emergency plan to prevent from water body pollution.
4. Management of the expressway will be strengthened. In case of storms typhoons,
and fog weathers, the highway management stations will adopt the measures as speed
limit or enclosure will be taken.
5. The highway management stations will strengthen the management and
monitoring of tunnels. 50% ventilation machines should be kept on operating routinely
during the ventilation inspection period or in case of accidents.
6. According to the government order of Fujian Province in "Strengthen the Safety
Management of the Transportation of Dangerous Materials on Expressway." The vehicles
loading dangerous materials such as flammable. explosive and corrosive goods will not
be allowed entering the expressway.
4.3.6 Impact of Transportation of Construction Materials & Mitigation MeasuresTransportation of the large amount of construction materials for the project will
impact the environmental quality along the existing local roads as well as the trafficsafety on them.
1 . The Quantity of Major Construction MaterialsThe quantity of major construction material is tabulated in Table 4-3-5, which shows
that most of the materials to be used are those from local areas, such as earth, sand,gravel and stone, etc.
Table 4-3-5 Major Construction Materials for the Project
Materials Unit Quantity RemarksIron and steel t 82985.34 Bought in the counties or towns locally, transported along
Zhang-Yun Highway via G324 lineTimber m3 22210 DittoCement t 601276 DittoSand & gravel m3 2842889 Bought from the stores along the alignmentStones m3 6762574 DittoBitumen & oils t 193322.3 Bought in Zhang Zhou city, hauled along Zhang-Yun
Highway via G324 lineLime t 966 Bought in the counties or towns locally, transported along
Zhang-Yun Highway via G324 lineEarth m
3 540185 Bought from the stores along the alignment
72

2. Layout of the Piling Sites of the Construction Materials
The layout of the piling sites of the construction materials and the main existing
roads available are as shown in Fig. 4-3-1. It is evident that all the major construction
materials for each sections, such as earth, sand, gravel, stones and lime etc will be
obtained in the vicinity of the alignment, most of which will be hauled to the site via the
simple hauling road or existing roads.
3. Analysis of the Impact of Construction Material Transportation on the Existing
Roads
(1) Analysis of Transportation of Local Construction Materials
(a) Section in Zhangpu County (K41+800-K80+000)
Layout of the construction materials for this section is shown in 4-3-1(a). The
construction materials are to be bought from the corresponding stores and most of the
materials will be hauled to the construction site via the simple hauling roads directly,
with an average hawing distance in the range of 6.4-8.7 km. Therefore, there will be
little adverse impact on the existing local roads. Sand and gravel will be obtained from
the river beaches near the alignment, and the majority of such materials will be hauled
via the simple hauling roads, and then distributed longitudinally to the construction site.
Hence the hauling of such materials will do little harm to the local existing road. Sand
and gravel for sections such as Jiuzhen, Duxun, Shaxi and so on will be transported to the
construction site via Zhangzhou-Yunxiao section of the provincial highway, which will
be temporarily impacted.
(b) Section in Yunxiao County (K80+000-K104+780)
Most of the earth, sand and gravel for this section will be hauled from the stores to the
construction site via the simple hauling roads directly, with an average hauling distance
in the range of 3.5-11.5 kin, (see Fig 4-3-1(b)). They will be hauled to the construction
site along the simple road beside the alignment. Therefore, there will be little interference
with the existing local roads and the districts in the vicinity of the alignment.
(c) Section in Zhaoan County (klO4+780-140+851)
Earth and stone for this section will be bought from the stores near the alignment and
hauled to the construction site, with little distance required (see Fig. 4-3-1(c)). Sand and
gravel for the section are to be bought in Dongshen district and hauled to the construction
site via the existing road with a hauling distance of about 14.3 km. The section of the
existing road to be used will intersect G324 line at the suburb of Zhaoan County town.
(d) Tunnels etc.The spoil from the construction of tunnels and other structures is to be stacked near the
alignment (see Fig. 4-3-1), and will be transported via the simple hauling road, so this
work will have no impact on the existing roads.
(2) Analysis of the Impact of the Transportation of Steel, Cement, Lime, Timber and
so on
73

Generally speaking, steel, cement, lime, timber etc for the project will come from
local areas. The roads for such materials mainly includes G324 line and Zhang-Yunprovincial highway. Table 4-3-5 shows that the total weight of such materials will
amount to 762329.4t. As to the 4 years construction period, the first construction period
will be 3 years for the construction of embankment and bridges. During this period, about
7 or 8 vehicles per hour in daytime will be added to each section of the existing roads.This is predicted based on the assumption that there are 300 working days per year, 8
working hours per day, and the loading capacity of the vehicle is 5t (standard medium-
sized one). Therefore, though the hauling vehicles have no marked impact on the
acoustic environment, the dust resulting from such hauling vehicles will impact the
environmental condition to a certain extent.
(3) Analysis of the Impact of the Transportation of Bitumen and Oils
It can be seen from Table 4-3-5 that the amount of bitumen and oils will be
193322.3t. Usually such materials are used in the last year of construction. There will be
32 additional vehicles per hours on G324 line and Zhang-Yun highway in daytime if
there are 300 working days per year, 8 working hours per day, and the loading capacity of
the vehicle is St (standard medium-sized one). Therefore, though the noise from the
hauling vehicles has no obvious influence on the environment condition, their long-
distanced haulage will certainly adversely impact the traffic safety on the existing roads.
4. Mitigation Measures
(I) Though the hauling vehicles will have no marked impact on the existing roads,
generally they will not be allowed to run at night so as to minimize the acoustic impact.
(2)To relieve the traffic congestion, hence to reduce the traffic accidents, haulage in
busy hours on G324 line or Yun- Xiao highway will be prevented.
(3)To minimize the adverse influence of the hauling vehicles on the existing roads,
materials such as sand, gravel, earth and so on are to enter the existing road from the
nearest possible place, then be distributed longitudinally via the simple hauling road
along the alignment.
(4) Loose materials such as cement and lime etc should be sacked, or canned so that
the floating dust will not be form to harm the local people or the vegetation near the
alignment.
(5) The simple hauling road should be sprayed with water to prevent the impact of
floating dust on the local vegetation.
74

4.4 Prediction and Assessment of Traffic Noise Impact on Environment
4.4.1 Prediction and Calculation of Traffic Noise
4.4.1.1 Prediction Model
1. Prognosis model of equivalent sound level in daytime
Leqj = LAi + 1 Olg(Ni ) + lI 0g(- +' s-13TV,~ r
Where:
Leq, - equivalent noise level of i kind of vehicle at observing point, dB (A);
i = 1,2,3 representing large, medium or small vehicles
LA,-average A noise level of i kind of vehicle at the reference spot at a speed
of Vi, dB (A);
T - assessment time (T=- 1 hour);
N, -- flow volume of i type vehicles (v/h);
V, -speed of i kind of vehicles, (km /h);
r -distance of the assessment spot to the carriageway;
r; -distance of the reference point to the carriageway,;
a - attenuation factors related to absorption properties of ground cover;
As -attenuated value and correction of sound barriers in noise transmission,
dB(A).
2. Prognosis model of equivalent sound level in nighttime
Leq, = LAi +01 Olg TV+llg( ) + lOIg(-)g +As -13Leq,=~, +1 TV, r r
where the meanings of the symbols are same as in the daytime model.
3. Calculation formula for equivalent noise levels of volume composed of n kind
vehicle on thej driving line at the reservation spots;
75

Leq, =I0.lg l0L2qj
4.Culculation formula for equivalent noise levels of m driving lines at the observingspot;
m
Leq =10 * /gZlO'q
5. Prediction model for regional noise in the assessment scope:
Leqrcg,..aI = 10 Ig(l0 0° 7 + 1 0 0)lLeq)
Where:
LeqT traffic noise levels predicted, dB(A).
Leq, background noise levels monitored at present, dB(A).
4.4.1.2 Determination of parameters in the prediction model
1. Traffic volume, speed, radiation noise levels and its revised value
(1) Prediction of traffic volume
The predicted traffic volume of characteristic years is shown in Table 2-3. The ratio
of vehicular kinds is shown in Table 4-4-1 according to the pre-feasibility and
engineering feasibility study. The ratio of traffic flow in daytime and at night is 4/1. The
traffic flow of different vehicular size is shown in Table 4-4-2.
Table 4-4-1 Ratio of Vehicular Types
Pickup Medium Heavy truck Automobile Medium bus Trailertruck (small vehicle)
17.67% 32.87% 14.71% 22.25% 9.05% 3.42%
7A

Table 4-4-2 Predicted Traffic Volume of Deferent Vehicular Types unit: v/h
Section Year Light Medium HeavyDay Night Day Night Day Night
Dongyuan (Xiangwei) 2005 285 143 300 150 130 65Interchange- 2010 403 201 423 211 183 92
Zhaojiabao Interchange 2020 624 312 655 327 284 1422005 290 145 304 152 132 66
Zhaojiabao Interchange- 2010 410 205 430 215 186 93Zhangpu Interchange 2020 643 321 675 337 292 146
2005 244 122 256 128 111 55Zhangpu Interchange- 2010 356 178 374 187 162 81
Duxun Interchange 2020 560 280 588 294 255 127
2005 237 118 248 124 108 54Duxun Interchange- 2010 346 173 363 182 157 79Yunxiao Interchange 2020 540 270 567 284 246 123
Yunxiao Interchange _ 2005 229 114 240 120 104 52
Canghan Interchange- 2010 336 168 353 176 153 76
2020 538 269 565 282 245 122
2005 211 106 222 l1l 96 48
Lintou Interchange 2010 306 153 322 161 139 70
2020 524 262 550 275 238 120
Lintou lnterchange- 2005 237 119 249 125 108 54
Xishan Interchange 2010 341 170 358 179 156 782020 582 291 611 306 265 133
Xishan InterchangeZhaoa 2005 273 137 287 144 124 62i Interchangeh2010 373 187 392 196 170 85
2020 580 290 609 304 264 132
(2) Driving speed
The designed driving speed is 100 km /h for proposed highway. According to
"Specifications for EIA of Highway Construction Projects", the actual driving speed is
determined by factors as traffic volume, road conditions, etc. So, the actual driving speed
in the model is obtained by the following correcting formula.
Light: Vs 23 7 Ns °'602
Medium: Vm= 212 Nm--°"4 '
Large: Vh - 0.8 Vm
where:Ns represents hourly traffic volume of auto, v/h;
Nm represents hourly traffic volume of medium vehicles, v/h;
For driving speed, refer to Table 4-4-3.
According to the actual driving speed and the pavement structure recommended in
T7

the feasibility study report (bituminous concrete pavement), and "Specifications for EIA
of Highway Construction Projects" (trial), the radiation noise level of different kinds of
vehicles on the bituminous concrete pavement is calculated by using the following
formula.
Heavy vehicles: LA = 77.2 + 0.18 Vh7
Mediumn vehicles: LA= 62.6 + 0.32 Vm
Light vehicles: LA = 59.3 + 0.23 Vs
(3) Corrected value
The correction of longitudinal slope is conducted according to actual slope of the
sensitive spot to the relevant road section. The correction value is determined on the
basis of "Specifications for EIA of Highway Construction Projects" with the maximum
value of + 2dB(A). Pavement correction is conducted according to Table 4-4-3.
Table 44-3 Pavement Corrected Value
Pavement AL pavement dB(A)
Bituminous concrete 0
Cement concrete 1-2 (Note)
Note: When the ratio of auto is more than 60%, upper limit is taken, otherwise lower limit.
2. Ground attenuation factor
Considering the fact that the land taken is mainly farmland, the attenuation factor of
the ground cover to noise transmission is taken as a = 0.5.
3. Additional attenuation of barriers in noise transmission
The noise attenuation of high embankment, cutting, viaduct or interchange (AS) is
obtained by using the following model:
N= 2 6 /A = (f/170)X S
where:
6 -n oise travel difference, (m);
f-noise frequency, for traffic noise taken asf= 500 Hz;
N- resnel number.
The value of AS is obtained from the Fresnel Curve by referring to the Fresnel
number calculated.
4. Prediction result of traffic noise of various sections is obtained on the basis of thetraffic volume in different periods of times and average embankment elevation. See Table
4-4-4 for detail.
78

Table 44-4 Calculated Prediction Value of Traffic Noise Unit: Leq: dB (A)
Distance from the road side (m)Section Year Time
10 20 40 60 80 100 120 160 200
2005 Day 77.4 74.4 70.9 68.6 66.9 65.5 64.4 62.7 61. 3Qiuzhong- a Night 71.6 67. 7 62. 9 59. 9 57. 6 55. 8 54.3 52.0 50.1Neijiafang 2010 Day 78.0 75.1 71. 5 69.2 67. 5 66.2 65.1 63.3 61. 9(KOfK8) Night 72.3 68.4 63. 7 60.6 58.4 56. 6 55.1 52.7 50. 9
2020 Day 79.0 76.0 72.4 70. 2 68.5 67.1 66.0 64.2 62.8Night 73.4 69.5 64.7 61.7 59.4 57.6 56.2 53.8 51.9
2005 Day 75. 0 72. 1 68. 5 66. 3 64. 6 63. 2 62. 1 60. 3 58. 9Neijiafang- _ Night 69.6 65.6 60.9 57.8 55.6 53.8 52.3 49.9 48.1
Hekeng 2010 Day 75. 9 73.0 69.4 67.2 65.5 64.1 63.0 61.2 59.8(HK8eK23 ) Night 70.6 66.6 61.9 58.8 56.6 54.8 53.3 50.9 49.1
2020 Day 77.2 74.3 70.7 68.4 66.7 65.4 64.3 62.5 61.1Night 71.9 68.0 63.2 60.2 57.9 55.1 54.6 52.3 50.4
2005 Day 77.1 74.2 70.6 68.3 66.6 65.3 64.2 62.4 61.0Hekeng- Night 71.2 67.3 62.6 59.5 57.3 55.5 54.0 51.6 49.8Panliao 2010 Day 77.8 74.8 71.3 69.0 67.3 65.9 64.8 63.0 61.7
(K23-K74) Night 72.1 68.1 63.4 60.3 58.1 56.3 54.8 52.4 50.62020 Day 78.7 75.8 72.2 69.9 68.2 66.9 65.8 64.0 62.6
Night 73.1 6.2 64.5 61.4 59.1 57.4 55.9 53.5 51.6
2005 Day 74.5 71.6 68.0 65.7 64.0 62.7 61.6 59.8 58.4Panliao- Night 69.0 65.0. 60.3 57.2 55.0 53.2 51.7 49.3 47.5
Shudong 2010 Day 75.5 72.5 69.0 66.7 65.0 63.6 62.5 60.8 59.4(K74-K90) Night 70.0 66.1 61.3 58.3 56.0 54.2 52.7 50.4 48.5
2020 Day 76.8 73.8 70.3 68.0 66.3 64.9 63.8 62.1 60.7Night 71.4 67.5 62.7 59.7 57.4 55.6 54.2 51.8 49.9
2005 Day 76.9 73.9 70.4 68.1 66.4 65.1 64.0 62.2 60.8Shudong- Night 71.0 67.1 62.3 59.3 57.0 55.2 53.7 51.4 49.5Yancang 2010 Day 77.5 74.5 71.0 68.7 67.0 65.7 64.5 62.8 61.4
(YK90aK106) Night 71.7 67.8 63.1 60.0 57.8 56.0 54.5 52.1 50.32020 Day 78.6 75.6 72.0 69.8 68.1 66.7 65.6 63.8 62.4
Night 73.0 69.1 64.3 61.3 59.0 57.2 55.7 53.4 51.5
2005 Day 77.2 74.2 70.7 68.4 66.7 65.4 64.2 62.5 61.1Yancang- Night 71.4 67.4 62.7 59.6 57.4 55.6 54.1 51.7 49.9
Houling Village 2010 Day 77.8 74.8 71.3 69.0 67.3 65.9 64.8 63.1 61.7(K106- Night 72.1 68.2 63.4 60.4 58.1 56.3 54.8 52.5 50.6
Ending point) 2020 Day 78.8 75.8 72.3 70.0 68.3 67.0 65.9 64.1 62.7Night 73.2 69.3 64.6 61.5 59.3 57.5 56.0 53.6 51.8
4.4.2 EIA of Traffic Noise
4.4.2.1 Red Line of Traffic Noise
According to the prediction results of traffic noise for different road sections, we can
figure out the distance from the road side to the point where the traffic noise level equals
to the limiting value of the Class 4 standard in GB3096 (70 dB at daytime, 55dB at night).
The distance is shown in Table 4-4-5.
79

Table 44-5 The Predicted Distance from the Road to the Point Where theTraffic Noise Level Equals to the Standard
Distance from the road side (m)
Section .2005Yr. 2010Yr. 2020Yr.
Day Night Day Night Day NightfQiouzhon- 47 110 52 121 62 139
Neijiafang_
NeiJiafang- 30 86 36 98 45 115
Hekeng _ _ _ _ _ _ _ _ _ _ _ _ _ _ _ _ _ _
Hekeng - 45 106 50 117 59 134
Fanliao
Fanliao-
Shudong 28 80 33 91 42 115
Shudong- 43 103 48 113 57 131Yancang__ _ _ ___ _ _ _
Yancang- 45 108 50 117 I 60 136
Houling Village IlI_I
Tables 4-4-4 and 4-4-5 show that in 2005Yr. noise levels 110 m beyond the road will
meet class 4 standards of GB3096-93; while in 201OYr. noise levels 121 m beyond the
road will meet class 4 of GB 3096-93; and in 2020Yr. noise levels 139 m beyond the
road side will meet class 4 standards of GB3096-93.
4.4.2.2 Noise Impact Assessment at Environmental Sensitive Spots
Based on the monitored results, the environmental noise is 40.3 -56.7 dB (A) at
daytime and 37.4 - 47.8 dB (A) at night except for a few monitoring spots close to the
existing highways. Superposed with traffic noise, it produces little contribution.
Therefore, the excess of noise is mainly caused by traffic noise.
Table 4-4-5 shows that in the long-term 20 years operation phase, the noise levels at
the area 139 m beyond the roadside can meet the Class 4 of the assessment standards.
According to the requirements of land acquisition, the residential buildings within 20m
away from the roadside will be removed and resettled. Therefore, resident sites in the
area from 20m to 139m away from the roadside are the objects that will suffer from the
traffic noise pollution. The residents living in the front line of the residence quarter near
the roadside will suffer the most.
The ambient noise levels of the resident sites in the impacted area and schools or
hospitals within 200m from the roadside are obtained by adding the traffic noise to the
background noise of the area. In the calculating, the noise attenuation caused by road
structure as excavations, embankments, etc. are considered. The levels of the
environmental noise of the sensitive spots in the scope of assessment and the related
orn

standards are shown in Tables 4-4-6 and 4-4-7.
Table 4-4-6 Predicted Noise Levels of the Sensitive Spots unit: dB (A)
Distance 2005 2010 2020
No. Name Chainage from road Situation Durati Stanside on dard Noise Exceed Noise Exceed Noise Exceed
(im) Leq value Leq value Leq value
I Qiouzhong K0+500 30 6 m lower Day 70 68.2 68.8 69.7. I Qiouzhong -700 30 6 m lower Night 55 60.8 5.8 61.5 6.5 42.6 7.6
2 Neixi KO+900 37 4 m lower Day 60 69.9 9.9 70.5 10.5 71.4 11.42 Neixi *-Kl+150 Night 50 61.9 11.9 62.7 12.7 63.7 13.7
KI+460 10 Day 70 70.6 0.6 71.1 1.1 73.6 3.63 Sucuo -550 (Through) 4m lower Night 55 59.5 4.5 61.4 6.4 62.7 7.7
Kl1+640 Dy 7 6.668.2 69.34 Jingxia -30 60 4 m lower Day 70 67.6
-730 Night 55 58.3 3.3 59.0 4.0 60.2 5.2
5 Chaxic K2+400 45 4 m lower Day 70 67.9 692 71 60.1 S-650 Night 55 57.1 2.1 58.7 3.7 60.1 5.1
6 Shudou K3+900 85 3m lower Day 70 66.7 67.4 68.46 Shudou -K4+120 85 3 m lower Night 55 55.4 0.4 56.2 1.2 57.1 2.1
K4+000 Day 70 65.5 66.2 67.1Donguan -250 Night 55 54.8 55.6 0.6 56.6 16
8 Qiancuo, K4+850 110 4 m lower Day 60 64.9 4.9 .65.7 5.7 66.6 6.6Houcuo -K5+050 Night 50 55.1 5.1 55.9 5.9 56.9 6.9
9_ Cuozai K5+200 Day 60 64.9 4.9 65.5 5.5 67.5 7.59 Cuozai -320 80 4 m lower Night 50 54.6 4.6 55.4 54 56.9 6.9
K5+600 10 Day 70 71.4 1.4 73.0 3.0 74.2 4.210O J iangcuo -700 (Through) 3.5 m lower Night 55 59.3 4.3 60.8 5.8 62.9 7.9
1 1 Cangli -K6+000 155 3 m lower Day 60 62.7 2.7 63.3 3.3 64.2 4.2-K6+000 ~~~~~Night 50 52.0 2.0 52.7 2.7 53.8 3.8
12 Xiayangfan K6+300 20 loer Day 70 65.4 66.1 67.0-400 Night 55 58.7 3.7 59.4 4.4 60.5 5.5
1 3 Xinxu K6+600 80 10 m lower Day 60 61.9 1.9 62.5 2.5 63.5 3.513 Xinxu K6+600 80 10 rn lower Night 50 52.6 2.6 534 3.4 54.4 4.4
14 Xinhe K7+500 90 7 m lower Day 70 66.2 66.8 64.7-680 Night 55 56.7 1.7 57.5 2.5 58.5 3.5
K7+820 Day 60 64.2 4.2 64.9 4.9 65.9 5.915 Yuanbi -960 125 6 m lower Night 50 54.2 4.2 55.0 5.0 56.1 6.1
K7+800 6 m lower Day 70 60.5 61.1 62.11 6 Shanmci --060 95 with banana field Night 55 50.8 51.6 52.6
K8+120 Day 70 67.5 68.3 69.517 Neijiafang -340 Sm lower Night 55 52.9 54.1 56.5 1.5
_ 8 Hek-en 1 K21+800 2 in lower Day 60 58.2 59.1 60.4 0.418 Hekeng -(K22+250 1O5 with longan forest Night 50 48.8 49.8 51.1 1.1
K26+900 Day 70 58.4 70.2 0.2 71.1 1.119 Dashi -K27+200 S0 4 m lower Night 55 57.1 2.1 58.4 3.4 59.7 4.7
20 Huxi K27+200 55 5 m lower Day 70 69.2 70.0 70.9 0.9-700 Night 55 56.8 1.8 58.0 3.0 60.1 5.1
2 Jingweixin K30+440 95 6 m lower Day 70 60.5 61.1 62.2- Village -550 with longan forest Night 55 50.7 51.5 52.7

Continuation of Table 4-4-6Distance 2005 2010 2020from road Durati Stan
No. Name Chainage side Situation on dard Noise Exceed Noise Exceed Noise Exceed
(mn) Leq value Leq value value
22 .i.in K38+430 140 4 m lower Day 60 59.8 60.2 0.2 61.4 I.422 Xilin -700 with fruit forest Night 50 49.8 50.5 0.5 51.7 1.7
23 Shiniuwei K40+100 2 m lower Day 70 64.5 65.1 66.1-300 with lichy forest Night 55 56.1 I 56.9 1.9 58.0 3.0
.24 Xiwei K41+760 70 3 m lower Day 70 62.5 63.1 64.124 Xiwei -K42+040 with lichy forest Night 55 53.4 54.3 55.3 0.3
25 Qnshan K43+270 54 m lower Day 70 . 64.4 65.0 65.925 Qinshan -530 with fruit forest Night 55 56.0 10 56.7 1.7 57.9 2.9
K46+770 10 7 6. 63.8 64.7_26 Haibianjiao K4+70Oin1 lower Day 70 63.13386.-910 (Through) Night 55 57.2 2.2 58.1 3.1 59.2 4.2
27 Hougang K46+590 Dao yO m lower Day 60 61.8 3 .8 62.4 2.4 64.4 4.427 Hougang ~~-890 11 Olwr Night 50 51.8 3.8 53.6 3.6 54.7 4.7
K47+790 30 Day 70 65.1 65.8 66.728 Houdai -~~K47+790 (TruhI0nloe a 0 6.28 Houdai -K48+090 (Through) 8 m lower Night 55 59.2 4.2 60.1 5.1 61.2 6.2
_ I _~~SO2529 Tulou K50+250 30 5 m lower Day 70 70.6 0.6 71.3 1.3 72.2 2.2
-770 Night 55 62.6 7.6 63.4 8.4 64.5 9.5
30 Guotian K50+420 33 6 mn lower Day 70 70,0 71.2 1.2 72.8 2.8_ _________ __________ __________ _______________ Night 55 62.1 7.1 63.3 8.3 64.1 9.1
3 i 0 Pudong K53+780 85 5 m lowaer Dy 70 64.6 65.2 66.233 Pudong ~~~-930 85Slwr JNight 55 55.3 0.3 56.0 1.0 57.2 2.2
;2 Cili K58+640 5 m lower Day 70 60.4 61.0 61.9-850 with fruit forest Night 55 50.6 51.3 52.5
33 Nanshan 2K60+690 lower Day 60 64.2 4.2 64.8 4.8 65.8 5.833 _Nanshan_ -940 120 6_m_lower_ Night 50 54.0 4.0 54.9 4.9 55.9 5.9
34 Liugaowei K61+430 4 lower Day 70 69.0 70.1 71.0 1.034 Liugaowei_-830 5_m_lover_ Night 55 61.0 6.0 61.8 6.8 62.7 7.7
K63+290 5 m lower Day 70 64.5 65.1 6S.135 Xiagao 70 with fruit forest Night 55 56.i i.i 56.9 1.9 58.0 3.0
36 Houvin K 60 3 |n 47 5 m lower Day 70 70.0 | 1 63 2| 560 ~~~~~~~Night 55 62.1 7.1 62.9 7.9 63.8 8.8
37 Tianping K63+640 1 2 m lower Day 60 60.3 0.3 61.0 1.0 61.9 1.937 } Tsn | -800 1 100 |with fruit forest Night 50 50.5 0.5 51.2 1.2 52.4 2.4
K65+350 10 m higher Day 70 68.0 69.0 69.938 | Yaoly | -550 60 with hill protected Night 55 58.5 3.5 59.3 4.3 60.7 5.7
39 Gaoshin K65+690 10 Day 70 70.1 0.1 71.8 1.8 73.0 3.039 | Gaoshan | _-950 (Through) Night 55 58.3 3.3 | 59.8 4.8 61.5 6.5
K69+150 0 1 m Day 70 53.6 54.1 55.140 Sagabian | 20 1 80 lOin highr | |45.0 |46.2|-250 Night 55 44.3450624 K69+650 95 10 m higher Day 70 60.3 60.9 61.8
41 | Fanglin | _-900 9 with longan forest Night 55 50.5 51.2 | 52.4 |K70+700 7 6 l Day 70 66.4 67.1 67.9-K71+030 | 75 4 48.2 52.4
Shaxi K1(7+400 160 0i highwer or Day 60 49.6 50.8 51.64xTown -K72+4000 160 4 20 higher Night 50 240 .6
1 ~~~~~~~~~with lichy forest Nit 50 4.44 Putou -(K72+500 | mlower Day 70 70.6 0.3 71.3 1.3 72.2 2.2
357330 0 10mlower Night 55 62.6 7.6 63.4 .4 64.5 9.5
82

Continuation of Table 4-4-6Distance 2005 2010 2020
No. Name Chainage from road Situation Durati Stan - - ExceeNo. Name ~~~~~~~side on dard Noise Exceed Noise Exceed Noise d
(m) Leq value Leq value Lcq vaiue
45 Fanliao K74+170 105 5 m higher Day 60 572 58.0 59.3__nhlao -320 with lichy forest Night 50 47.7 48.7 50.0
K77+900 10 m higher Day 70 54.3 53.0 53.9Luwanjing 41942.3 4.46 Luowanjing -K78+760 with hill protected Night ' 55 41.9 435
K78+800 Day 60 63.1 3.1 64.1 4.1 65.3 5.347 Wanxi -950 110 3 m lower Night 50 49.0 52.5 2.5 54.4 4.4
48 Zhizai K79+400 Day 4 m lower Day 60 53.7 54.9 55.648 Zhi~~~~ai -610 10 4mlwr Night 50 143.4 44.5 45.3
K80+450 0 Day 60 57.6 58.6 59.849 Wutian °6 '00 3 m lower Night 50 47.7 48.7 49.7
50 Chuanchang K84+70 110 4 m lower Day 60 63.8 3.8 64.5 4.5 65.5 5.550 Chuanchang -850 110 4 m lower Night 50 54.1 4.1 54.8 4.8 56.0 6.0
51 Xiagaoxi K85+000 200 5m lower Day 70 62.1 62.9 63.8-150 with longan forest Night 55 51.9 53.6 54.8
52 Shudong K92+500 100 3 m lower Day 60 63.0 3.0 63.8 3.8 65.2 5.21 -630 Night 50 53.5 3.5 54.3 4.3 55.7 5.7
53 Jizai K96+200 90 2 m lower Da5 70 60.4 61.0 62.1-400 with lichy forest Night 55 51.1 51.7 53.0
54 Houcuoyuan K100+400 70 5 m lower Day 70 67.1 67.7 68.8-550 Night 55 58.3 3.3 59.0 4.0 60.2 5.2
55 | Yancang K 106+000 60 5 rm lower Day 70 68 1 68.7 69.8-200 witL longan forest Night 55 59.3 4.3 60.0 5.0 61.3 6.3
K1 14+900 Day 70 69.2 69.8 70.4 0.456 Tianpu -KI15+050 50 3m lower Night 55 60.3 5.3 61.5 6.5 62.8 7.8
57 Yuanqian K )116+600 o 2 m lower Day 70 66.7 67.3 68.4-900 with lichy forest Night 55 57.4 2.4 58.1 3.1 59.3 4.3
58 Wuxing Farm K119+650 SO Same high ~~Day 70 69.7 70.3 0.3 71.3 1.358 Wuxing Farm K119+650 so Same high Night 55 61.7 6.7 62.4 7.4 63.5 8.5
59 Waifenou K121+850 m lower Day 70 69.5 70.3 71.5-K122+100 Night 55 61.5 6.5 62.4 7.4 63.3 8.3
60 Nanxi K129+950 150 10 m high Day 60 50D7 51_4 52.2Village -K130+300 Night 50 41.4 42.4 63.9
61 Pushang K120+900 170 10 m high Day 60 52.6 53.8 54.6Village -131+100 with lichy forest Night 50 42.7 43.7 44.9
K133+320 . Day 60 62.7 2.7 63.3 3.3 64.3 4.362 Changtnaolin -490 160 10Om4high Night 50 53.4 3.4 54.1 4.1 55.2 5.2
K135+750 3 m lower Day 70 62.4 63.0 64.063 Dianqian -850 70 with lichy forest Night 55 53.7 54.3 55.5 0.5
64 Shangy:ing K 136+000 25 3iloDay 70 73.8 3.8 74.3 4.3 75.3 5.3Village -300 Night 55 64.0 9.0 6S.2 102 66.2 11.2
65 Houling K139+300 110 3 m lower Day 60 59.4 60.0 61.0 1.0Village -650 with lichy forest Night 50 49.6 50.3 0.3 51.4 1.4
83

Table 4-4-7 Schools and Hospitals along the Alignment unit: dB(A)
Distance 2005 2010 2020
from road . Durati Stan _
No. Nwme Chainage side on dard Noise Exceed Noise Exceed Noise Exceed
(m) Leq value Leq value Leq value
Neixi Prim. KO+650 so Residential house Day 55 60.6 5.6 61.6 6.6 62.7 7.7Sch. In front Night 45 49.4 4.4 51.2 6.2 53.7 8.7
2 Houdai K47+940 40 Sm lower Day 55 61.6 6.6 63.7 8.7 65.3 10.3Prim. Sch. Night 45 49.4 4.4 51.4 6.4 54.1 9.1
3 K 0Guotin Sm lower Day 55 59.2 4.2 59.9 4.9 60.8 5.83 Prim. Sch. K(50+590 130 5mlwr Night 45 49.0 4.0 49.8 4.8 50.9 5. 9
4 Zhuangqian K66+700 180 Sm lower Day 55 614 6.4 62.0 7.0 63.0 8.0Prim. Sch. _ _ _ Night 45 50.6 5.6 51.5 6.5 52.5 7.5
5 Gaolin mid. !Om higher Day 55 60.3 5.3 60.9 5.9 63.9 8.9Sch. K67+200 with lichy forest Night 45 50.5 5.5 51.3 6.3 52.4 7.4
6 Fanglin K69+600 I So 8 m lower Day 55 47.4 48.0 49.0Prim. Sch. with longan forest Night 45 40.4 41.6 42.5
7 Shaxi mid. IC71+090 70 10 m lower Day 55 50.3 50.8 51.2Sch. with fruit forest Night 45 42.3 42.8 43.5
8 Shaxi K(70+030 19( 10 MlIIC Day 55 48.1 49.3 50.5Hospital Night 45 40.3 42.1 44.2
* 9 Tulou K71+400 10 20 m higher Day 55 71.0 Th0 72.3 17.3 64.7 19.7Prim. Sch. (Throughi) Night 45 60.4 15.4 61.9 16.9 63.1 18.1
Beiqi Prim. 3 m lower Day 55 51.7 52.2 53.5I Sch. with hill Night 45 44.1 45.2 0.2 46.3 1.3
1l | Xiqian KS5+000 80 3mlovwe Day 55 64.1 9.1 65.1 10.1 66.3 11.3Prim. Sch. Night 45 53.0 8.0 55.0 10.0 57.4 12.4
12 | Shudong K91+400 25 6m lower Dy 55 68.9 13.9 69.5 14.5 70.6 15.612 rim.00 256mloer Night 45 62.1 7.1 62.8 7.8 63.1 8 1A
1 Haifeng K9200 160 2 i lower Day 55 57.2 |22 57.8 2.8 58.9 3.91 mid. Sch. K 1 with fruit forest Night 45 46.4 1.4 47.1 2.1 48.3 3.3
| JizaiPnm' K96+200Pm 10 2 mlower Day 55 71.0 16.0 72.4 17.4 74.6 19.6Sch. 96 (Th20ugh) o Night 45 60.3 15.3 61.4 16.4 63.9 18.9
I5 t Yuanqian K +76 43 2 m lower Day 55 65.7 10.7 66.3 11.3 67.3 12.3Prim. Sch. 1(116+760 with lichy forest Night 45 57.7 12.7 58.4 13.4 59.5 14.5
Note: The Tulou Prim. School has already moved away from the road side of the proposed highway.
It can be seen from Tables 4-4-6 and 4-4-7 that, compared to the standards in
GB3095-93, the noise at some sensitive spots will exceed the standards after highway
construction causing remarkable adverse impact on acoustic environment along the
alignment. The excess ratio in the short tern, medium term and long term of operation
are 68.8 %, 72.5 % and 77.5 % respectively.
84

By 2020, the noise levels at some sensitive spots will exceed the standards to a great
extent, so appropriate noise reduction measures will be taken to protect the acoustic
environment. See the content of 4.4.5.2 for the details of noise proof measures.
4.4.3 Analysis of Envir.onmental Impact during Construction Phase
1. Analysis of Impact of Transport Road on Acoustic Enviromnent
It is evident from the analysis in 4.3.6 that earth, sand and stone etc all can beobtained locally and will be hauled to the construction sites form the corresponding
stores directly, hence their haulage will have little adverse impact on the local acousticenvironment along hauling roads. All steel, cement and timber will be purchased in thelocal counties or cities. Calculation shows that there will be 32 additional vehicles perhours on G324 line and Zhang-Yun highway in daytime. Therefore, noise from thehauling vehicles has no obvious influence on the environment conditions along thealignment.
2. Analysis of Impact of Construction Sites on Acoustic Environment
The noise of construction sites comes mainly from road building machinery and transport
vehicles. The noise levels and attenuation are shown in Table 4-4-8.
Table 4-4-8 Noise Levels of Construction Machines unit: dB(A)Nise Level Distance from the equipment (m)
Machine\ 5 10 20 40 60 80 100 150
Loader 90 84 78 72 68.5 66 64 61.6
Road Grader 90 84 78 72 68.5 66 64 61.6
Roller 86 80 74 68 64.5 62 60 56.5
Scraper 84 78 72 66 62.5 60 58 54.5
Paver 85 79 73 67 63.6 61 59 55.6
Mixer 87 81 75 69 65.5 63 61 57.5
Bulldozer 86 80 76 68 64.5 62 60 56.5

The construction site boundary noise limit in GB 12523-90 is 75dB(A) at daytime
and 55dB(A) at night. The noise levels in Table 4-4-8 show that the distance in
accordance with the standards is within 40 m at daytime, 150 m at night. It is obvious
that the construction activities at daytime will not make great impact on acoustic
environment. However, they will do at night, so the construction will not be permitted at
night (22:00 - 6:00). In addition, for schools 100 m within the site, the construction time
will be arranged to fit the timetable of teaching with consultant with schools to prevent
teaching activities from being interfered. Temporary soundproof screen will be set up for
Houdai Prim. Sch. which is within 50m from the roadside.
It is seen from Table 4-4-8 that the noise levels resulting from the machinery are
usually above 8OdB(A) or even 9OdB(A) which does great harm to the machine operators.
To respond to "Noise Hygiene Standards of Industrious Enterprises" issued by the State
Sanitation Ministry (Table 4-4-9), it is suggested that the work hours of the workers
subjected to loud and harmful noise should be reduced as appropriate. Besides, the
machinery will be maintained in good condition, and the workers exposed to the noise
will be protected by wearing helmets or earphones.
Table 4-4-9 Noise Hygiene Standards for Industry Enterprises
Hours per workday exposed to noise (h) Allowable noise level dB(A)
8 85
I4 88
2 91
1 94
4.4.4 Assessment and Conclusion of Acoustic Environment
1. According to investigation and monitoring, the acoustic environment along the
alignment is quite good except for Beitou and Changmnaolin where the noise at night
exceeds class 2 standards.
2. The prediction tell us that the acoustic environment will be impacted significantly
in the operation period of the expressway. The excess ratio in short term, midium term
and long term operation is 68.8 %, 72.5 % and 77.5 % individually.
86

3. The red line of traffic noise in 2020 Yr. (long- term operation) is 139 m at night,
which means that without any sound barrier objects at both sides of the expressway, the
farthest distance impacted by traffic noise in 2020 Yr. will be 139m from the road side.
Therefore, it is suggested that new houses should be built 150 m beyond the road side.
4. The noise levels of the machinery 40m beyond may reach 4 class standards in GB3096-93. The majority of the villages along the alignment are 50 m beyond , so the
construction activities at daytime will not have significant impact on residents in their
life.
4.4.5 Mitigation Measures of Acoustic Environment Impact4.4.5.1 Environmental Protection Measures against Construction Noise
1. Compared to the operation phase, the noise during the construction is short-lasting,
but it will interfere with the people's life especially at night. Therefore, withinl50 m
from the residential areas, no construction work with the machines such as bulldozes,
vibration rollers, excavators, pile drivers, loaders, levelers or mixers will be permitted to
be done between 22:00 - 6:00.
2. The county environmental protection bureaus will inspect noise of construction
machines. To the machines whose noise exceed the standards, contractors will be
required to change the machines in a limited period of time
4. Because loud-noise-producing machinery does harm to the operators, their
working hours will be arranged reasonably or they will be replaced by other workers
regularly according to "Industry Enterprises Noise Sanitation Standards".
4.4.5.2 Mitigation Measures against Noise during Operation Phase
Due to the great traffic volume, the noise will be significant excess of the standards.
So, the following measures will be taken at the sensitive locations of excess.
1. Due to the impact of noise, 2 schools and part of the buildings of the 27 villages
will be removed. See Table 4-4-10.
2. There will be all together 20 places of soundproof screens with a total area of
1 0450m2. See Table 4-4-11 for their specific locations.
3. There will be 18 places of heightening surrounding walls with total area of
7780m2 ., see Table 4-4-12 for locations and amounts. As to the afforestation for noise
mitigation, the forest area planted should be wider than 1 Om. The noise level reduced is
about 2 dB. See Table 4-4-10 for the locations.

Table 4-4-10 Environmental Protection Measures for Sound Proof
Exceed value Number of protected household I(dB) (Household) - Number of
Order Site Location Sound Heightening Trce PeopleTime 2005Yr. 201 oYr. 2020Yr Removal proof Surrounding planttion (People)
screen wall plnain (el)
I Qiouzhong KO+500 Day 18 22 100-700 Night 5.8 6.5 7.6 1
KO+900 Day 9.9 10.5 11.4-KI+150 Night 11.9 11.5 13.7 .
K I+460 Day 0.6 1.1 3.63 Sucuo -550 Night 3.2 4.1 49 12 16 16 112
4 Jingxia K 1+640 Day 1.4 3.6 21204 Jingxia K 1-730 Night 3.3 4.0 5.2 12 12 220
K2+400 Day 1.5 23 92a-650 Night 2.1 3.7 5.1 (175xl0m2 )
K3+900 Day 6.6 7.4 8.4 25 15 1606 Shudou 70-K4+120 Night 5 4 6.2 7.1 (22510m2)
7 Dongyuan K4+000 Day 5.5 6.2 7.1 t 5 12 43 240_ Dongy n *-250 Night 4.8 5.6 6.6 (645x12m2 )
8 Qiancuo, K4+850 Day 4.9 5.7 6 6 36 164Houcuo -K5+050 Night 5.1 5.9 6.9 (540x14ml)
9 Cuozai K(5+200 Day 4.9 5.5 7.5 916 79 Cuozai | -320 Night 4.6 5.4 6.9 (140Xn0m2 ) 76
K(5+600 Day 1.4 3.0 4.210 Jiangcuo -700 Night 4.3 5.8 7.9 25 28 212
II Cagl 5+800 Day 2.7 3.3 4.2 15 6Cangl | -K6+000 Night 2.0 2.7 3.8 (230xl0m2) 60
12 Xiayangfan K6+300 Day 8 13 7 148-400 Night 3.7 4.4 5.5 (110xifn9)
13 Xinxu K6+600 Day 1.9 2.5 3.5 1II4| 13 | Xinxu | K6+600 | Night 2.6 3.4 4.4 (165xl3m')
14 Xinhe K7+500 Day 6.2 6.8 7.7 16| 14 | Xinhe | -680 Night 6.7 7.5 8.5
15 Yuanbi 1K7+820 Day 4.2 4.9 5.9 | | 7 0 5m) 48-90 Night 4.2 5.0 6.1 (0x5I
a K7+400 Day 0.5 1.1 2.1 7 2516 ^ Shanmei } -660 Night 0.8 1.6 2.6 |(20x20m 2 ) 25
17 Dashi K(26+900 Day 0.2 1.1 21 ( 0 19) 2 160-K27+200 Night 2.1 3,4 4.7 (300xl0m2)
Is 1(0o K27 200 Day 0.9 1 i 27 22018 Huxi ~~~~700 Night 1.8. 3.0 5.1 8 18(450x10m 2l)

Continuation of Table 44-10
Exceed value Number of protected household(d8) (Household) Number of
Order Site Location Sound Heightening ProtectedTime 2005Yr. 2010Yr. 2020Yr. Removal proof Surrounding plantation (People)
screen wall plnaon (el)
19 Shiniuwei K40+100 Day 21 74-300 Night 1.1 1.9 3.0
20 Qinshan K43+270 Day 1 8 6220 Qinshan K43-530 Night 1.0 1.7 2.9
21 Haibianjiao K46+770 Day 21 (420x7 8in) 196-910 Night 2.2 3.1 4.2
K46+590 Day 1.8 2.4 4.4 3022 Hougang -890 Night 1.8 3.6 4.7 (450x12m') 120
23 Houdai K47+790 Day 25 04x14m 3123 Houdai K48+790 Night 4.2 5 1 6.2 (800X13m')
24 Tulou K50+250 Day 0.6 1.3 2.2 6 8512024 Tulou K5-770 Night 7.6 8 8.4 6 18 (750x20m') 200
25 Guotian K50+420 N Day 7 1.2 2.8 23 79Night 7.1 8.3 9.1
26 Pudong K53+780 Day 8261326 Pudong K3-930 Night 0.3 1.0 2.2 (400 ) 136
27 Nanshan K60+690 Day 4.2 4.8 5.8 471 81627 Nanshan K60-940 Night 4.0 4.9 5.9 (375x15m2 ) |16
28 Liugaowei K61+430 Day12 51828 Liugaowei K61-830 Night 1.5 2.1 3.3 12 25 180
29 Houyin K63+500 Day 1.1 2.5 31 110-660 Night 7.1 7.9 8.8
30 Xiagao K63+290 Day 2 30 Xiagao K63-470 Night 1.1 1.9 3.0 22 81
3 1 Tianping K63+640 Day 0.3 1.0 1.9 2 8-800 Night 0.5 1.2 2.4
32 yaoli K65+350 Day 2 232 Yaoli -550 Night 3.5 4.3 5.7 27 120
33 Gaoshan K65+690-840 Day 0 i 3.0 34 61 432Night 3.3 4.8 6.5
34 Ptu K72+500 Day 0.3 1.3 2.2 29 48034 Putou -K73+300 Night 0.2 1.2 2.1
K78+800 Day 3.1 4.1 5.3 2335 Wanxi -950 Night 2.5 4.4 6 (4oxiom) 144
36 Chuanchang K84+700 Day 3.8 4.5 105 11-850 Night 4.1 4.8 6.0 (165xI7m2)
K92+500- Day 3.0 3.8 5.2 1 137 Shudong 630 Night 35 43 57 8 (180xl2m2 ) 76

Continuation of Table 4-4-10
Exceed value (dB) Number of protected household Number of(Household)
ProtectedOrder Site Location Sound Heightening Tree PeopleTime 2005Yr. 201 OYr. 2020Yr. Removal proof Surrounding plantation (People)
screen wall plnain (el)
38 Houcuoyuan K 1O0+400 Day 4 9 988-550 Night 3.3 4.0 5.2 (I 50x1 5m2)
'39 Tinpuxu K I1 4+900 Day 0.3 0.4 2 1 5 039 Tianpuxu KI 15+9050 Night 5.3 6.5 78 12 14 (00x3m) 104
40 Yuanqian K 116+600 Day 1 II11 S40 Yuanqian Kl16-900 Night 2.4 3.1 4.3 15 5 (I180
4 1 Wuxing KlI19-.-650 Day 0.3 1.3 57 3Farm Night 6.7 7.4 8.5 (1000x15m2) 332
42 Waifenlou K121+850 Day 16 164-KI22+100 Night 6.5 7.4 8+3
43 Cangmolin K133+320 Day 2.7 3.3 4.3 91 91343 Changmaolin K;_-490 Night 324 4+1 5.2 (300x14m2) 132 _.
44 Shangying K136+000 Day 3.8 4.3 5 24 23 172Village -300 Night 9.0 10.2 11.2
45 Neixi Prim. KO6O Day 5.6 6.6 7.7 200 045 N cPi K0+650 Night 4.4 6.2 8.7 (people) 200
46 _Hioudai K47+940 Day 6.6 8.7 10.7 210 210Prim. Sch. Night 4.4 6.4 9.1 (people)21
Guotian K50+59 Day 4.2 4.9 5.8 430 430Prim. Sch. ~ '"' Night 4.0 5.8 5.9 (people)
48 Zhuangqian K66+700 Day 6.4 7.0 8.0 210 210Prim. Sch. K670 Night 5.6 6.5 7.5 (people)21
49 Gaolin mid. K67+200 Day 5.3 5.9 8.9 1150 ! Sch. K720 Night 5.5 6.3 7A (people) 15
50 Tulou K+40 Day 16.0 17.3 19.7 3503550 Prim. Sch. K7I1+400 Night 15.4 16.9 18.1 (people) 350
322
51 Beiqi Prim. K72+790 Day (people) 322Sch. Night 0.2 1.3 (150X10M2 )
52 Xiqian Prim. K85+000 Day 9.1 10.1 11.3 235 235Sch. Night 8.0 10.0 12.4 (peoplt)
53 Shudong K91+400 Day 13.9 14.5 15.6 100 100Prim. Sch. N ight 7.1 7.8 8.1 (people)
54 Haifeng K94+200 Day 2.2 2.8 3.9 1200 1200mid. Sch. Night 1.4 2.1 3.3 (people)
Jiiai Prim. K96+200 Day 16.0 17.4 19.6 155 5Sch. Night 15.3 16.4 18.9 (people)
56 Yuanqian |aK116760 Da 5N7 11.3 12.3 340-~ Prim. Sch. K1670 Night 12.7 13.4 14.5 (people)34

Table 4-4-11 Locations and Number of Noise Proof Screen
Noise NumberOrder Site Location Max. excess length X height Area level ofPpl(dB) (__) (rn2 ) Reduced of People
I Qiouzhong K7+500- 5.8-7.6 200X3 600 1400_________________ 700 20__ __ _ _ ___3_
Neixi KO+900- 11.9-13.7 Right 60 1 02 (including KI+150 (7.9-8.7) 20Rgh 600 14 200
Prim. Sch.) Bt
K5+570-- Both3 Jiangcuo 700 4.3-7.9 right & left 780 16 212Jiangcuo 700 ~~~~130X3 _________
4 Dashi K26+980- 2.1-6.5 _ f200 X2.5 S00 160K27-i180 2-X.
5 Huxi Town K27+550- 1.8-6.1 Right 500 11 210
6 Houdai K48+000- 4.4-9.1 Right6 (including 300 4491 300X2.5 750 16 316
Prim. Sch. I____
7 Tulou K5480 7.6-9.5 Left 690 12 130480+2 0 230X3__ _ _ _ _ _ _ _ _
8 Guotian K50+400- 7.1-9.1 Right 660 12 100______________ ~620 n220X 3
9 Liugaowei K62+010 6.0-7.7 Right 650 11.5 180K62+70- 6I07. 260 X 2.5__________
K(63+500- .1.8Right10 Houyin 660 7.1_-5.8 160x3 480 11.5 110
_- Yaoli K62+600- 3.5-5.7 80x3 240 10.5 120
K66+050- 3.3-6.5 Left 480 16 230
12 Gaoshan 210 _____ 160X3 40 1 3oK66+080- 3.3-6.5 Right 420 16 202
220 14X3 4
13 Gaolin 467+360- 5.5-8.9 Left 540 12 1150Mid. Sch. 540 _ _ _ _ _ 180X3_ _ _ _ _ _ _ _ _ _
14 Tulou K71+580- 16-19 Already moved 300 19 350Prim. Sch. 680
15 Xiqian hK85+200- 9.1-12.4 Left 300 12.5 235Prim. Sch. 300 100X3_________
16 lianpuxu 115+150- 5.3-7.8 Left 200 it 164300 IO0X2__ _ _ _ _ _ _ _
Yuanqian K(116+980- Left17 (including K117+100 10.7-14.5 120X3 360 15 340
Prim. Sch.)
18 Waifenglou 31(22+100- 6.5-8.3 Right 500 11 164______________ ~300 __ _ _ _ _ 200X 2 .5 _ _ _
19 Shangyingcun K136+260- 9.0-11.2 Left 450 12 380410 150X3
Dongyuan Mid. KI+950- Left20 Sch. K2+110 3.5-9.7 LeR 450 11 120020 (Link Road)
Total 20 places 10450 6253

Table 4-4-12 Locations of Heightening Walls and Work Amount
Per household Exceed Number of AOrder Places Stations (length X height) value protected (e 2)a Sound proof effects
(in) (dB) households _ _ _Sucuo S50 15X2 4.5-7.7 16 480
550__ _ _ _
2 Jingxia IKS+60- 15X2 3.3-5.2 22 660730
3 Shudou K34+000 15X2 5.4-8.7 25 750 r
K4+10004 Dongyuan 250 15X2 5.5-7.1 12 360
Qiancuo. K4+850- 15 HuuK50015X2 5.1-6.9 1 0 300Houcuo K5+0S0 I6 Cuozai K5+200 15X2 4.9-7.5 9 270
= _ 320 _ _ The noise level
7 Xiayangfan 00Ix2 T 3.7-5.5 13 390 decreased by
K7I500- = _ _ I_heightening wall is
| 8 Xinhe K7+500- 15X2 6.7-8.5 16 480 6-10 dB. Forthe68 __ _ _ _ __ _ _ _ __ _ __ _ _ v__ _ _ _ _ __ _ _ _ _ illages anld schools
9 Yuanbi K7+820-960 15X2 T 4.2-6.1 7 210 with high exceeding
K60+690-wihhgexednto Nanshan 90 15X2 4.0-5.9 7 210 value, more than
.940 ________________ 10________ lOm wide of forest
I I iwan K78t80u(i 15 X 2.5-4.4 7 210 plantation should be950 X2 210 adopted for further
K84±700- 12 Chuanchang 15 X 2 4.1-6.0 10 300 reducing of noise
850 _ level. See Table 4-4-
K92+500 TOfrteseii13 Shudong 630 15X2 3.5-5.7 8 240 p0forthespecifio
63.0~~ ~ ~~ |_____ ._____ _____ position of
14 Houcuoyuan KI0+4O- I5X2 | 3.3-532 9 270 plantation.
15 Yuanqian 9ii6+o00 15X2 2.4-4.3 5 150
K133+320-16 Changmaolin 490 15X2 3.4-5.2 5 150
17 Guotian K 50+590 150X3.0 4.0-5.9 43(pol)| 450
s18 ighfng K94+200 300 X 3.0 1.4-3.9 1200 900|High Sch. __________ (people)
Total 7780
L

4.4.5.3 Feasibility Analysis of Heightening the Surrounding Walls
The following measures will be taken to mitigate the traffic noise on
Zhangzhou-Zhaoan Expressway.
1. People who live within 30m from the alignment and in whose residences the
noise level exceeds 13 dB will be removed.
2. People who live so near to the alignment that the noise level in their residences
exceeds 9 dB will be removed.
3. Those whose courtyards are sparsely scattered at places where the noise level is
within the range of 8-4 dB will be removed.
4. Afforestation will be undertaken for the residences more than 1 OOm away from
the alignment, where the noise level slightly exceed the standards
The feasibility analysis of heightening the surrounding walls to reduce the noise
level can be seen in Table 4-4-13.
Table 4-4-13 Feasibility analysis of heightening the surrounding walls
Measures Analysis
1. Good soundproof effect
Soundproof %valls 2. High cost (700 yuan/m2)
3. Adverse influence of too much wall on the surrounding landscape
I. It is of good soundproof effect (noise level is reduced by more than 10 dB)
2. The additional layer of a window costs RMBl.000 yuan. and RMB3.000 yuan will
be spent for one household.Double-layered 3. It would be impossible for the southem farmers to close their windows all the year
round unless all their houses were to be equipped with air conditioners. The
electricity bill would become unbearable for the farmers because the owner could
pay for neither electricity nor the maintenance of the air conditioners.
1. 4-8 dB decrease can be obtained.
2. It is suitable for the sparsely populated areas along the alignment.
Wall heightening 3. It is of low cost. (100 yuan/mn or RMB 1,500 yuan/household)
4. The heightened walls will not block much' of the sunlight since a household
usually has a large courtyard.
I. It is the most economical measure.
Soundproof 2. It is also beneficial to the improvement of the landscape.
afforestation 3. Its noise reduction effect is limited, for example, a lOm wide tree belt can only
decrease the noise level by only 2-4 dB.
From the above analysis, wall heightening is recommended for the 18 villageswith a noise lCvel of 4-8 dB above the standards, since the double layered windows are
unacceptable to the southern farmers while the belt of soundproof forest is not effective
enough to reduce the noise to the specified level. The owner can use other mitigation
measures where appropriate.

4.5 Prediction and Assessment of Impact on Ambient Air
4.5.1 Prediction Model
Gauss Line Source Diffiusion Equation for diffusion concentration of fumes has beentaken as the prediction model of impact on ambient air quality.
C-= tQ , fdl
where:
C -concentration of the pollutant (mg/m3 );
QL -emission strength from line source (mg/m * s);
L-iength of line source (m);
Uh -wind speed at emission location (m/s);
dl-increment of the length of line source (m);
f -atmospheric diffusion function.
In an orthogonal coordination, f is determined as follows:
1 ___ (Z-h) _Z___h
f2,ra (exp(- 2 )exp[ 2 exp[- -
Where:
Oc, :, - diffusion parameters in the horizontal and vertical directions
respectively(m);
h efficient height of vehicle exhaust gas(m);
In the integral experimentation of model (1), limited by the included angle betweenwind speed and highway direction, the effect between wind speed and included angle
will be taken into account.
4.5.2 Identification of Various Parameters in Prediction Model
1. Source strength of Vehicular Exhaust Gases
(I) Source strength model
nQj = A,K,K,.K;
where:
Q,-total amount of pollutants of j kind of vehicle in an unit period of time and in
an unit length of road, i.e. source strength ( mg / s. m. );
A, -designed traffic volume of i kind of vehicles on the road ( v / s);
K, -emission coefficient of single vehicle representing i kind of pollutants per

kilometer (mg / m .v.;
K' - renew coefficient of vehicles of i kinds, 0.95 is adopted; r
Ki - depreciation coefficient of i kind of vehicles, 1.10 is adopted; - -
n - kinds of vehicles on road.
(2) Emission strength of vehicular exhaust gases
Based on the predicted traffic volune in the project feasibility study report of
Zhangzhou - Zhaoan Expressway of the years 2010 and 2020, and the traffic volume of
peak hours, the emission strength of pollutants is obtained, see Table 4-5-1 .
2. Diffusion parameters
The diffiusion parameters of exhaust gases are:
Cr = (a2 + 02 )0.5
where:
o ya -diffusion parameters of lateral eddy wind;
o -diffusion parameters of vertical eddy wind;
, --- initial lateral diffusion coefficient;
, --- initial vertical diffusion coefficient.
Table 4-5-1 Emission Strength of Vehicular Exhaust Gases unit: mg/r .s
Traffic CO NOX lSections condition 2005Yr. 201 OYr. 2020Yr. 2005Yr. 201 OYr. 2020Yr.
Daily 5.47 7.44 11.54 0,69 0.94 1.46Xiangcheng- average
Zhangpu Peakhours 9.86 13.39 20.77 1.25 1.70 2.64
Daily 4.78 6.59 10.18 0.61 0.83 1.29Zhangpu- averageYunxiao Peak 8.61 11.86 18.35 1.09 1.51 2.33
hours_ Daily 4.48 6.24 9.66 0.57 0.79 1.23 [
Yunxiao- averageZhaoan Peak 8.06 11.24 17.39 1.03 1.43 2.21
hours
3. Wind speed in model of line sources

The wind speed Uh in line source model is:
Uh -max(U,U }
uc= 1.85Uo' 4cos2 0
where:
Uhis the speed ( m /s)
Uc is the wind speed caused by the running vehicle;
9 is the angle between wind and road (°).
4.5.3 Prediction of Concentration of CO and NOx
1. Concentration calculation of pollutants along the alignment.
The average daily and hourly concentrations of CO and NOx on both roadsides in
the years 2005, 2010 and 2020 after construction were predicted based on the traffic
volume of each section, terrain and meteorological conditions. For prediction calculation
conditions, see Table 4-5-2.
Table 4-5-2 Calculation Conditions for Prediction of Air Pollutants
Concentration of an hour Daily average concentration
Background concentration Max. concentration Max. daily
of an hour average concentration
Traffic volume Traffic volume of peak hour Daily traffic volume
Atmosphere stability E-F All kinds of stability
Wind directions Leading wind directions All wind directions
2. Calculation Results
Based on traffic volume, terrain and meteorological conditions, four cross sections of
Huxi, Cili, Guanyinting and Xishan were chosen for prediction of the concentrations of
CO and NOx. For the results, see Table 4-5-3. Based on the results, the average daily
concentrations of pollutants at various sections were made. See Figure 4-5-1 and 4-5-4
for detail.
It can be seen from Table 4-5-3 that:
(1) By 2020Yr. in operation, the maximum daily and hourly concentrations of CO at
four sections are 2.01 mg /m3 and 4.44 mg/m3 at Xishan, both under class 2 standards
(4.00 and 10.00) in GB3095 - 1996.
(2) By 2020, the maximum daily and hourly concentrations of NOx at four sections
are 0.084 mg/m3 and 0.149 mg/ m3 respectively, both under class 2 standards (0.10 and0.15) in Gb3095 - 1996, but the hourly concentrations will increase significantly

compared with the background levels.
Therefore, we can conclude that the construction of the expressway will not have
significant impact on the quality of the ambient air, but the concentrations of NOx will go
up as compared to the background levels.
Table 4-5-3 Predicted Concentration of Air Pollutant Unit: mg/m3
Distance from roadsideBack (in)
Site Pollu Value ground Yeartant type value
0 25 50 75 100 125 150 200
Daily 2005 1.52 1.44 1.38 1.36 1.33 1.32 1.31 1.28DiY 1.22 2010 1.63 1.52 1.45 1.40 1.37 1.35 1.34 1.31
average 1020 1.85 1.68 1.59 1.51 1.46 1.42 1.40 1.37
Co
2005 2.89 2.71 2.55 2.43 2.35 2.29 2.24 2.18Hourly 1.88 2010 3.25 3.01 2.79 2.64 2.53 2.44 2.38 2.29
Huxi. Average 1020 4.01 3.63 3.29 3.06 2.88 2.76 2.65 2.51
(K 17+200)
2005 0.050 0.039 0.033 0.029 0.026 0.024 0.023 0.021. Daily 0.012 2010 0.058 0.045 0.038 0.033 0.029 0.027 0.025 0.023
average 1020 0.084 0.064 0.052 0.045 0.039 0.036 0.033 0.029
NOx ILI_
2005 0.083 0.070 0.063 0.054 0.049 0.044 0.041 0.036Hourly 0.015 2010 0.102 0.090 0.080 0.069 0.061 0.055 0.050 0.044Average 1020 0.149 0.131 0.117 0.099 0.086 0.077 0.070 0.060
Daily 2005 1.26 1.19 1.15 1.13 1.11 1.10 1.09 1.081.03 2010 1.34 1.25 1.20 1.17 1.14 1.13 1.12 1.10
average 1020 1.51 1.37 1.29 1.24 1.21 1.18 1.16 1.14
Co2005 1.88 1.76 1.63 1.54 1.48 1.44 1.39 1.35
Hourly 1.12 2010 2.16 1.98 1.81 1.69 1.61 1.55 1.50 1.43Average 1020 2.73 2.45 2.19 2.01 1.88 1.78 1.71 1.60
ciii(K59+100) . 2005 0.040 0.032 0.028 0.025 0.023 0.021 0.020 0.018
Daily 0.012 2010 0.051 0.040 0.034 0.029 0.027 0.025 0.023 0.021
averaitmge 1020 0.072 0.055 0.045 0.039 0.035 0.031 0.029 0.026
NOx - - -
2005 0.075 0.066 0.056 0.050 0.045 0.042 0.040 0.036Hourly 0.020 2010 0.095 0.083 0.070 0.061 0.055 0.050 0.047 0.042avemgre 1020 0.139 0.115 0.097 0.084 0.074 0.067 0.062 0.054
47

Continuation of Table 4-5-3
Distance from roadsidePolu Vaue Back (in)
Site Pollu Value ground Year ___n)
tant type value 0 25 50 75 100 125 150 200 ,
Daily 2005 1.23 1.17 1.14 1.12 1.10 1.09 1.09 1.07Daily 1.03 2010 1.30 1.23 1.18 1.15 1.13 1.12 1.11 1.09average 1020 1.45 1.33 1.26 1.22 1.19 1.17 1.15 1.13
Co I I.
2005 1.78 1.67 1.56 1.49 1.44 1.39 1.36 1.32Hourly 1.12 2010 2.04 1.88 1.73 1.62 1.56 1.50 1.45 1.39average 1020 2.55 2.29 2.07 1.91 1.79 1.71 1.64 1.54
Guanyinting(K84 I 100)
Daily 2005 0.037 0.030 0.026 0.023 0.022 0.020 0.019 0.018aveie 0.012 2010 0.046 0.037 0.031 0.027 0.025 0.023 0.022 0.020average 1020 0.065 0.050 0.041 0.036 0.032 0.029 0.027 0.024
NOx._
Hourl 2005 0.067 0.055 0.047 0.041 0.037 0.034 0.032 0.029aourly 0.015 2010 0.087 0.070 0.059 0.051 0.046 0.042 0.039 0.034_ average 1020 0.120 0.101 0.083 0.071 0.063 0.056 0.052 0.045
I Daily 2005 1.78 1.73 1.70 1.68 1.66 1.65 1.65 1.64DailY 1.59 2010 1.86 1.79 1.74 1.71 1.69 1.68 1.67 1.65average 1020 2.01 1.89 1.83 1.78 1.75 1.73 1.71 1.68
co - - I
2005 3.67 3.55 3.44 3.37 3.31 3.27 3.24 3.20Hourly 3.00 o I2010 3.90 3.77 3.62 3.51 3.44 3.38 3.34 3.28average 1020 4.44 4.18 3.96 3.79 3.68 3.59 3.52 3.43
Xishan |
(K120+200) 2005 0.041 0.034 0.030 0.027 0.025 0.024 0.023 0.022Daily 0.016 2010 0.050 0.041 0.035 0.031 0.029 0.027 0.026 0.023
average 1020 0.070 0.055 0.046 0.040 0.036 0.034 0.031 0.027
NOx I
2005 0.072 0.060 0.052 0.046 0.042 0.039 0.037 0.034Hourly 1 0.020 2010 0.093 0.076 0.064 0054 0.051 0.047 0.044 0.040average 1020 0.130 0.107 0.089 0.077 0.068 0.062 0.057 0.054
98

3
-o-- 20025C
- . | = ~~~~~~2 00 -"7 2
........... . .... ,,, , , , .. ... ,,,,., .. .. ,,,,,.,.. ...... .. .. . ..... . .... .... ... . .. ...... .. -....... ,.,
. .,: '
75 rW .a . !>> !i ZS175 2
uistar.ces trom the side of hichway im)
r tl. -,n-Cr ,t fiU,!di -+. gn ; X ?
-t a--
It-
rs e.eE,- ..
a.e s E>- -. ~-- .- *--.
0.02~~~~~~~~~~~~~~~~~
e~~~~~~~~~~~ -;. ... ..
Si t r E- f0 t ron tre 5 ie 0; r.1 iF y 'nNa: . !4
tN,-_,! 8n_t!3. n _i Pto Ib i -(! .
Figure 4-5-1 Distribution of Daily Average Concentration of CO and NOx
at Huxi Section

. ~-C- -- 200 1Z220 I'C,,,~ ~ ~ ~ ~ ~ ~ ~ ~~~~~~; ') 2 2G
E r
Distances from the side os hiQhway (im)
Cr Conc.ntSrtinf C dlEtribhijtion (CiLi'
d- K - - - --
-*s7 * . .
e. ,ne _
ae!4
F.h - - ---
a w - -~ -.-------- 9
uta:br.CeS trom t;-e Sine e_ n1rn in,
.~~~~ 1_< n___ira ,n,_ ¢ ir it l) n - L
Figure 4-5-2 Distribution of Daily Average Concentration of CO and NOxat Cili Section

3~~~~~ ~~~~ a . .
201I
e t- .n - -
C .-CEt at -i Y n
!~~ri ~r.r,-_n~~~rn.ii rn 5'_! ,sn(f_U ,n.-. r i-:
Fi 4-5-3 D2ri o wi A wt o
,, a . Ix * -- ~~~~-
5: 7-''._:________ !q
Distances from tnesie of his,it ay (m):
!!NOx C-ncentF.3tjonn di st!ribUtio'n (3unYi rTi ng;
Figure 4-5-3 Disitribution of Daily Average Concentration of CO and NOY
at Guanyinting Section
1 Al

7
---- ,!1 C7
at Xisa S* .cio
.1i I~~~~~~~~~~~~~~~_I.
' -- ,- - - _.…
,.;. , I ----- 2-- - ;'
e I7
,~ ~ ~ ~ '~tne fro the a_eo FOl*:/'
Fiur 4-5- Ditibto of Dal!vrg ocnrto fC n
-~~~~~~~~a -iha Sect e*io

4.5.4 Assessment of Impact on Ambient Air Quality in the Study Areas
After consideration of present environment, traffic volume and local meteorological
conditions, as well as the CO and NOx data shown in Table 4-5-3, the statistic data of CO
and NOx concentration at sensitive spots have been gotten, see Table 4-5-4. It can be
seen that by the year of 2020 in operation of the expressway, the average daily and hourly
concentrations of both CO and NOx meet the standards of class 2 in Gb3095 - 1996.
However, as the traffic volume will increase gradually during the operation period, there
will be certain impact on the ambient air.
Table 4-5-4 Concentration Distribution of Air Pollutantsat Sensitive Locations unit: mg/Nm3
Distance Concentration of pollutants (daily average)
Ordcr Stations Places from Pollu 2005Yr. 201OYr. 2020Yr.Order Stations Placesroadside tants Concen Excess Concen Excess Concen Excess
(in) tration times tration times tration times
CO 1.50 0 1.60 0 1.80 0l K0+700 Qiuzhong .10
_ KO+700 Qiuzhong 10 NOx 0.048 0 0.056 0 0.080 0
Neixi Prim. CO 1.36 0 1.40 0 1.51 02 K0+650 80Sch. NOx 0.029 0 0.033 0 0.045 0
CO 1.50 0 1.60 0 1.80 03 K1I+100 Neixi 10 _ . 08
_ _ NOx 0.048 0 0.056 0 0.080 0
CO 1.52 0 1.63 0 1.85 04 Kl+50(1 Sucuo Through0 008 0
NOx 0.050 0 0.058 0 0.084 0
CO 1.44 0 1.52 0 1.68 05 K 1+700 Jingxia Through NOx 0.039 0 0.045 0 0.064 0
CO 1.44 0 1.52 0 1.68 06 K(2+500 Chaxie 30
NOx 0.039 0 0.045 0 0.064 0
CO 1.40 0 1.48 0 1.62 07 K4+000 Shudou 40.
NOx 0.035 0 0.040 0 0.055 0
CO 1.38 0 1.45 0 1.59 08 K(4+100 Dongyuan 50
NOx 0.033 0 0.038 0 0.052 0
9 K5+000 Qiancuo, 100 CO 1.33 0 1.37 0 1.46 0Houcuo NOx 0.026 0 0.029 0 0.039 0
CO 1.36 0 1.40 0 1.51 010 K5+300 Cuozai 80 NOx 0.029 0 0.033 0 0.045 0
CO 1.52 0 1.63 0 1.85 011 K5+650 Jiangcuo Through NOx 0.050 0 0.058 0 0.084 0
CO 1.32 0 1.35 0 1.42 012 K5+900 Cangli 130 NOx 0.024 0 0.027 0 0.036 0
CO 1.50 0 1.60 0 1.80 013 K6+300 Xiayangfan 10 NOx 0.048 0 0.056 0 0.080 0

Continuation of Table 4-5-4
Distance Concentration of pollutants (daily average)
Order Stations Places from Pollu 2005Yr. 201 OYr. 2020Yr.roadside tants Concen Excess Concen Excess Concen Excess
(in) tration times tration times tration times
CO 1.36 0 1.40 0 1.51 014 K6+600 Xinxu Through
NOx 0.029 0 0.033 0 0.045 0
CO 1.37 0 1.43 0 1.55 015 K7+600 Xinhe 130
NOx 0.031 0 0.035 0 0.049 0
CO 1.33 0 1.36 0 1.44 016 K7+900 Yuanbi 10 _
NOx 0.025 0 0.028 0 0.038 0
CO 1.37 0 I1.43 0 1.55 017 K7+800 Shanmei 80
NOx 0.031 0 0.035 0 0.048 0
CO 1.45 0 1.55 0 1.71 018 K8+200 Neijiatang 60 __ ____
NOx 0.041 0 0.047 0 0.069 0
CO 1.37 0 1.43 0 1.55 019 K21 +900 Hekeng 60
NOx 0.031 0 0.035 0 0.048 0
CO 1.44 0 1.52 0 1.68 020 K27+000 Dashi 70 I
NOx 0.039 0 0.045 0 0.064 0
CO 1.50 0 1.60 0 1.80 021 K27+200 Huxi 60
NOx 0.048 0 0.056 0 0.080 0
22 K30+500 Jingweixin 30 CO 1.44 0 1.52 0 1.68 0Village NOx 0.039 0 0.045 0 0.064 0
CO 1.31 0 1.34 0 1.41 023 K38+500 Xilinqian 140 -
NOx 0.023 0 0.026 0 0.034 0
CO 1.17 0 1.22 0 1.33 024 K40+200 Shiniuwei 40
NOx 0.030 0 0.038 0 0.050 0
CO 1.15 0 1.20 0 1.29 025 K42+000 Xiwei 50 NOx 0.028 0 0.034 0 0.045 0
CO 1.19 0 1.25 0 1.37 026 K43+300 Qinshan 30 I
NOx 0.032 0 0.040 0 0.055 0
CO 1.26 0 1.34 0 1.51 027 K46+800 Haibianjiao Through NOx 0.040 0 0.051 0 0.072 0
CO 1.11 0 1.14 0 1.21 028 K46+800 Hougang 100
NOx 0.023 0 0.027 0 0.035 0
Houdai CO 1.16 0 1.22 0 1.33 029 K47+940 40 -
Prim. Sch. NOx 0.030 0 0.036 0 0.049 0

Continuation of Table 4-5-4
Distance Concentration of pollutants (daily average)
from Pollu 2005Yr. 201OYr. 202OYr.Order Statio Plaees .roadi_e_tantProadsde tants Concen Excess Coneen Excess Concen Excess
(in) tration times tration times tration times
_ _ ~~~~~~~CO 1.26 0 1.34 0 1.51 0 /30 K48+000 Houdai Through co 0.04 0 0.04 0 0.07 0
NOx _0.04 0 0.051 0 0.072 0
CO 1.26 0 1.34 0 1.51 031 K50+500 Tulou 50
NOx 0.04 0 0.051 0 0.072 0
32 K50+90 Guotian 10 CO 1.10 0 1.13 0 1.18 0
Prim. Sch. NOx 0.021 0 0.025 0 0.031 0
CO 1.15 0 1.18 0 1.27 033 K53+800 Pudong 60
NOx 0.027 0 0.31 0 0.042 0
CO 1.15 0 1.18 0 1.27 034 K58+800 Ciii 60
NOx 0.027 0 0.031 0 0.042 0
CO 1.13 0 1.17 0 1.24 035 K60+800 Nanshan 80
NOx 0.025 0 0.029 0 0.039 0
CO 1.20 0 1.27 0 1.40 036 K61 +500 Liugaowei 20
NOx 0.034 0 0.043 0 0.060 0
CO 1.24 0 1.30 0 1.46 037 K63+300 Xiagao 10 ,
37 K63 __00 Xiagao _ _ NOx 0.038 0 0.048 0 0.066 0
CO 1.13 0 1.17 0 1.24 038 K63+700 Tianping 80
NOx 0.023 0 0.027 0 0.035 0
co 1.24 0 1.30 0 1.46 039 K65+400 Yaoli 10 I___ ___ ___
NOx 0.038 0 0.048 0 0.066 0
co 1.26 0 1.34 0 1.51 040 K65+800 Gaoshan Through NOx 0.040 0 0.051 0 0.072 0
Zhuangqian 18 CO 1.08 0 1.10 0 1.14 041 K66+700 Prim.Sch. 0 NOx 0.018 0 0.021 0 0.025 0
42 K67+200 Gaolin Mid. 10 co 1.10 0 1.13 0 1.19 0+42 K67+200 GaolicnhMi.S 100 NOx 0.022 0 0.025 0 0.032 0
CO 1.18 0 1.25 0 1.27 043 K69+200 Shanabian 20 I
NOx 0.031 0 0.040 0 0.054 0
44 K6460 Fanglin 10 co 1.09 0 1.11 0 1.15 19044 K69+600 Prim. Sch. NOx 0.019 0 0.022 0 0.027 0
CO 1.12 0 1.15 0 1.22 0
NOx 0.023 0 0.027 0 0.036 0

Continuation of Table 4-5-4
Distance Concentration of pollutants (daily average)
from Pollu 2005Yr. 2010Yr. 2020Yr.
Ords roadside tants Concen Excess Concen Excess Concen Excess
(m) tration times tration times tration times
CO 1.17 0 1.23 0 1.33 046 K70+800 Xishan 30
NOx 0.030 0 0.037 0 0.050 0
CO 1.07 0 1.09 0 1.13 047 K70+030 Shaxi clinic 70
NOx 0.018 0 0.020 0 0.024 0
Shaxi Mid CO 1.12 0 1.16 0 1.23 0
School NOx 0.023 0 0.028 0 0.037 0
Tulou CO 1.19 0 1.25 0 1.35 0
49 K71 +400 Primary 20School00 Pria 2 NOx 0.032 0 0.039 0 0.054 0School I
_ ~~~~CO 1.10 0 1.12 0 1.18 050 K71+500 Shaxi Town 120
NOx 0.020 0 0.023 0 0.030 0
5 ___ K72_800 Putou 1 CO 1.21 0 1.28 0 1.43 051 K72+800 Putou 10
NOx 0.035 0 0.044 0 0.062 0
CO 1.11 0 1.14 0 r1.20 052 K74+200 Panliao 90
NOx 0.022 0 0.026 0 0.033 0
Beiqi CO 1.11 0 1.14 0 1.20 0
53 K77+790 Primary 90
School NOx 0.022 0 0.026 0 0.034 0
CO 1.18 0 1.25 0 1.35 054 K78+000 Luowanjing 20 NOx 0.032 0 0.039 0 0.053 0
CO 1.11 0 1.14 0 1.20 055 K78+800 Haiwan 85
NOx 0.023 0 0.026 0 0.034 0
CO 1.11 0 1.13 0 1.19 056 K79+500 Shizi 100 I
NOx 0.022 0 0.025 0 0.032 0
CO 1.09 0 1.11 0 1.15 057 K80+500 Wutian 200
NOx 0.019 0 0.022 0 0.027 0
I 8 K84I 80 IChuan- i CO 1.10 0 1.13 0 1.19 0158 IK84+800 11110
chang NOx 0.022 0 0.025 0 0.032 0
Xiqian CO 1.12 0 1.15 0 1.22 0
59 K85+000 Primary 80School NOx 0.023 0 0.027 0 0.036 0
CO 1.14 0 1.17 0 1.25 0160 |K85+1 00 |Xiagaoxi 200I
60 K85+1 00 Xiagaoxi 200 NOx 0.025 0 0.030 0 0.039 0
CO 1.10 0 1.13 0 1.19 061 K92+600 Shudong 100 III I
NOx 0.022 0 0.025 0 0.032 0
, ~ ~ ~ ~~~ ~~~~~~~~~~~~~~ , .,

Continuation of Table 4-5-4
Distance Concentration of pollutants (daily average)
from Pollu 2005Yr. 201 OYr. 2020Yr.
roadside tants Concen Excess Concen Excess Concen Excess
(m) tration times tration times tration times
Haifeng Mid. CO 1.09 0 1.11 0 1.15 062 K96+000 160 -I
Sch. NOx 0.019 0 0.022 0 0.027 0
CO 1.14 0 1.17 0 1.25 063 K96+200 Jizai 60
NOx 0.025 0 0.030 0 0.039 0
64 K96+200 Jizai Prim. Through CO 1.23 0 1.30 0 1.45 0Sch. T NOx 0.037 0 0.046 0 0.065 0
CO 1.15 0 1.20 0 1.30 065 K 100+500 Houcuoyuan 40
NOx 0.027 0 0.033 0 0.045 0
CO 1.15 0 1.20 0 1.30 066 K 106+100 Yancang 40 0.027 _03_045__ L __ ~~~~~NOx 0.027 0 0.033 0 0.045 0
CO 1.71 0 1.76 0 1.86 0167 K114+900 ITianpuxu 40
67LK I 4+900 Tianpuxu 40 'NOx 0.032 0 0.037 0 0.050 0
| 68 K116+700 | Yuanquan CO 1.71 0 1.76 0 1.85 068 K116+7 rim.Sch. 40 3Prim. Sch. NOx 0.031 0 0.037 0 0.050 0
CO 1.69 0 1.73 0 1.81 0I69 K116+800 IYuanqian 60I I. I I
NOx 0.029 0 0.034 0 0.045 0
CO 1.70 0 1.74 0 1.83 070 K1 19+650 Wuxing Farm 50
NOx 0.030 0 0.035 0 0.046 0
71 K122+000 Wanfeniou 40 CO 1.71 0 1.76 0 1.86 0171 K 122+000 IWanfenlou 40 I___ I I I_
NOx 0.032 0 0.037 0 0.050 0
72 _130+90 | Xinan CO 1.66 0 1.69 0 1.75 0Village NOx 0.025 0 O 0.029 0 0.036 0
73 K130+900 Pushang 200 CO 1.65 0 1.67 0 1.71 0Village NOx 0.023 0 0.026 0 0.031 0
CO 1.68 0 1.71 0 1.78 0174 K133+400 Changmaolin 160 __I I I
74 K133+400 Changmaolin 160 NOx 0.027 0 0.031 0 0.040 0
CO 1.69 0 1.73 0 1.82 075 K135+800 Dianqian 60 ___
NOx 0.029 0 0.034 0 0.044 0
Shangying co 1.77 0 1.84 0 1.98 076 K136+100 Village 40 NOx 0.040 0 0.048 0 0.066 0
77 K1I39+600 Houling 80 co 1.68 0 1.71 0 1.78 0Village NOx 0.027 0 0.031 0 0.040 0
107

4.5.5 Prediction Analysis of CO Concentrations in TunnelThere are two tunnels to be built, the locations and their length are shown in Table 4-5-5.
4.5.5.1 Prediction Model for CO Concentrations in TunnelsThe concentrations of CO in tunnels C(X) can be calculated by using the following
model.
C(X) = q +aCb + (Coq aCb)( 1 + aX)(I+kK+a K+a u
Where q is the source strength of CO from vehicles, C. is the concentrations of CO inventilation coming into the tunnel, k is the settlement coefficient on the surface of tunnels,u(x) =u, + ax is the speed of ventilation in tunnels, u0 is the speed of the coming air at theentrance of tunnels, a is the coefficient of mechanical ventilation, C0 is the concentrationat the place where X = 0 at the entrance of the current.
4.5.5.2 Concentrations of CO in TunnelsTwo tunnels are proposed to be built, namely Kuzhishan Tunnel and Dabushan Tunnel,
the cross sections and length of them are shown in Figure 4-5-5 and Table 4-5-5respectively. The CO distribution in tunnel under peak traffic volume in the year of 2020has been forecast, and the ventilation strength for the concentrations has not exceed thedesigned standards (185 mg / m3 = 150 ppm).
Table 4-5-5 Tunnels to Be Built for Zhangzhou-Zhaoan Expressway
Tunnels Stations Length (m) Note
Kuzhishan Left K31+505-K34+040 2535 A long tunnel._______________ IRight K31+470-K34+050 2580
Dabushan Left K88+973-K90+990 2017Dabushan_________ Right K88+985-K90+970 1985 A long tunnel
Figure 4-5-6 shows the distribution of CO in tunnel under peak traffic hour in 2020.Figure 4-5-6(a) is the distribution of CO when the speed of natural wind U0 = 0.5 mwithout forced ventilation, while Figure 4-5-6 (b) shows the distribution of CO when thespeed of natural wind U0 = 1.0 m/s without mechanical ventilation.
Based on calculation, when the speed of natural wind is less than 1.0 m/s,mechanical ventilation will be adopted to reduce concentrations of CO. When the speedof natural wind U0 = 0.5 m/s, then the coefficient of mechanical ventilation a = 0.00018.The effective ventilation per hour will exceed 2,325 m 3/min, with natural wind added up,the total effective wind will be 4,245 m3 / min. Figure 4-5-6 (c) shows the distribution ofCO and NOx at the exit of Kuzhishan Tunnel. It can be seen that 30 - 40 m beyond theexit, the concentrations of CO and NOx do not exceed the standards. The amount ofmechanical ventilation at Dabushan Tunnel is slightly more than the above levels.
We know from Figure 4-5-6 (a) that, no mechanical ventilation is needed when thelength of tunnel is less than 900 m, since the natural wind can suit the designed standards( < 15Oppm).

. 300/2 30/
iS~~ine surface\OCD construction limited bou:ndary\
ol C~ ~ omid dle line of the lane
R1l439. 16.53
J , 125.0, 900.0 I15 PI 1215.4
I ~~~~~~~~~~~~~~~
600 -;. ,ii _
400~~~'1
u- - '''''DC"'' ' ''
Figur 4-5- (a) Ditiuino7OCnetatosi uhsa une
C(
200
E
400
distace frm th entrnce o thetunnesta0dakmd
Figure 4-5-6 (a) Distribution of COConcentrations in Kuzhishan TunneI(Uo= 0.5mIs, a =0)

250 t I
.9 100C(
I-~~~~-
2504 i $ f } !, } i j !, ! ! i i | !i stand!ard
> 50 ': :::.: ... :.-..::..:..x..
0.0 0.2 0.4 0.6 0.8 1.0 1.2 1.4 1.6 1.8 2.0 2.2 2.4 2.6
distance from the entrance of the tunnel X=0 ( km
Figure 4-56 6(b) Distribution of CO Concentrations in Kuzh-ishan Tunnel
(LTO=1.0 m Is, a=0)
a -:_ -...... -: neutral
distance from the nrne eison h sourcel X=((m m
F=igure 4-5-6 (b) Distributions of CO Concentrationsitno Kuzhishan Tunnel
LI~~~~~~~~~~~~~~~
2~~~~~~~~UolOm/,aO
. 4E..l,I-
-= LLu t r
H
=Y' MSm
| ~~~~distance from the emission source (in)
Figure 4-5-6 (c) Distributions of CO and NOs at Exit of Kuzhishan Tunnel
11(n

4.5.6 Analysis of Impact of Flying Dust on Environment during Construction
The major impact on environment during construction is flying dust coming from
mixing sites, hauling vehicles and machinery activities.
The TSP monitored 50 m away from the mixing sites downwind direction were 8.90
mg / m3; 100 m away were 1.65 mg/r 3; 150 m away were 1.00 mg /m3 .
TSP along the route is mainly resulted from the flying dust caused by the hauling
vehicles. Since there is abundant water along the whole line of the proposed highway,
spraying water on the surface of the road can be an effective measure to minimize the
flying dust in construction sites.
4.5.7 Assessment and Conclusion and Environmental Protection Measures
4.5.7.1 Conclusion of Assessment
1. Concentrations of CO, NOx and TSP in the Study Areas meet class 2 standards in
GB3095 - 1996, so the air environment is quite good.
2. Concentrations of CO and NOx by 2020 in operation will not exceed assessment
standards of ambient air, so the construction of the highway will not have significant
impact on environment.
3. The levels of pollutants predicted all meet class 2 standards in GB3096 - 1996 at
sensitive locations, so the air quality will not be affected significantly.
4. During the construction phase, fi_itive dust from hauling trucks will pollute the
air, so mitigation measures will be taken.
5. Mechanical ventilation will be adopted at Kuzhisnan and Dabushan Tunnel to
meet design standards of CO.
4.5.7.2 Environmental Measures and Suggestions
1. Measures against Construction Dust
Quarries, material borrow sites and transportation routes to construction sites were
identified as the major places that create dust and other air pollution. Road surfaces,
excavation areas and construction sites will be sprayed with water and kept moist
particularly near town and villages. By doing so the dust can be reduced by 70%. The
trucks transporting earth and stones will be covered to prevent air pollution.

2. Measures against Asphalt Smoke
The proposed highway will be paved with asphalt, so a great amount of asphalt will
be used. The asphalt for pavement will come from mixing stations. The Asphalt mixing
equipment will be equipped with dust collectors and will be located at least 300m away
from the residential areas on the down wind directions. The locations of asphalt mixers
will be determined in construction draNving design stage because they are related to the
locations of construction sites. Open or half-open mixing of asphalt will be absolutely
forbidden. The asphalt and concrete mixers must have dust removing installations.
3. The design mechanical ventilation for Kuzhishan Tunnel is 2,352 m3 / min, 12
axial fans needed. While the design mechanical ventilation for Dabushan Tunnel is 1,825
m3 / m, 8 axial fans needed.
4. Mitigation measures for the accidents in the tunnels:
a. More than 50% of the ventilation fans should operating routinely in the accident
inspection period.
b. Multi-source electricity supply systems should be arranged for tunnels.
Electricity supply should be resumed in a short period of time by adjusting switch
operation in case of electricity cut off.
5. The safety protection measures considered in tunnel designing are as follows.
a. Fire hydrants will be built.
b. Expressway emergency telephone system will be built.
c. 1.5cm thick fireproof materials will be paved on the inner surface of the tunnels
d. Crossing passageways will be built in the long tunnels.
6. Training plan for members of tunnel management groups will be been made. Fire
fighting equipment and vehicles will be provided.
7. The waterproof measures in the tunnels should be adopted. Although the
exploration revealed the Dabushan Tunnel locates in an area with low water content, the
waterproof layer for the tunnel still should be planed in the design.

4.6 Prediction and Assessment of Impact on Water
4.6.1 Analysis of Pollution Source Strength
The major pollution sources of the expressway mainly come from pavement runoffand facilities of the service centers.
4.6.1.1 Analysis of RunoffPollution Source StrengthPavement runoff pollution mainly comes from running rain on the pavement with the
major pollutants including
a. Suspended particulate;
b. Pavement area (width and length);c. Pavement materials;
d. Pollution extent above the pavement or other factors.The pavement runoff of expressway has less effect factors compared to ordinary
highway. So far there has been no model available due to accidentals of various factors.Based on "Specifications for EIA" HJ/T 2.1 - 23 - 93 and other scientific data, theprediction of pollution source strength was conducted. In predictioni, the maximumprecipitation and average precipitation of characteristic years was taken into account.
1. Pavement runoff calculationZhan - Zhao Expressway passes over some sections of rivers in Longhai City,
Zhangpu County, Yunxiao County and Zhaoan County. The runoff flowing into theserivers was obtained based on the data of precipitation provided by the meteorologicalstations concerned.
Table 4-6-1 Pollutant Concentration Range in Pavement Runoff unit: mg/I
Jioulong R. Yangmei Jiouzhen Port Zhang R. Port(Nanxi) reservoir (Luxi)
Width of catchment pavement 26 26 26 26 26(m) -
Length of catchment 1282 724 1436 1269 1017pavement (m)
Area of catchment pavement 33332 18824 37336 32994 26442(m) L
Precipitation Max. 121 118 109 117 110(mm/d) Average 10.6 11.0 13.2 10.9 10.9Runoff Max. 168 92.5 170 161 121(mn3/h) Average 14.7 8.6 20.5 15.0 12.0

2. Concentration Range of Pollutants in Pavement Runoff
Because there are different factors affecting pollutant concentrations and variouselements in pollutants, no ready model for determination of concentrations is available.
So analogue methods were used. See Table 4-6-2.
Table 4-6-2 Pavement Runoff of River Sections ConcernedTime duration after runoff begins (m) .-
0-15 15-30 30-60 60-120 > 120
CODcr 170 130 110 97 72 170 120BOD5 28 26 23 20 12 28 20Oils 23 17.5 6 I.5 5 23 12SS 390 280 190 200 160 370 280
3. Prediction of Pollution Source Strength
Pollutant emission model of pavement runoff is
WIj= Q C,
where
W, emission of i kinds of pollutants;
Q - avement runoff
C, - oncentrations of i kinds of pollutants.
Based on the above model, we can get emission of pavement runoff. See Table 4-6-3
Table 4-6-3 Emission of Pollutants of Pavement Runoff unit: g/s
Pollutant CODc,ICODM | BOD5 l l SSindex
Section Max. Average Max. Average Max. Average Max. AverageDischarge _
JioulngRivr 7.9/4.7 0.49/0.29 1.31 0.08 1.07 0.05 17.3 1.2(Nanxi)_____
Yangmei 4.4/2.6 0.29/0.17 0.72 0.05 0.59 0.03 9.5 0.7Reservoir
Jiouzhengang 8.0/4.8 0.68/0.41 1.32 0.11 1.09 0.07 17.5 1.6(L u x i) _ _ _ _ _ _ _ _ _ _ _ _ _ _ _ _ _ _ _ _ _ _ _ _ _ _ _ _ _ _ _ _ _ _ _ _
Zhang River 7.6/4.6 0.50/0.30 1.25 0.08 1.03 0.05 16.5 1.2
Port 5.7/3.4 0.40/0.24 0.94 0.07 0.77 0.04 12.4 0.9
I 1 1

4.6.1.2 Analysis of Pollution Source Strength from the Service Areas
1. Facilities in the Service Areas
(1) Service AreasThere are 2 service areas to be built along the proposed alignment, namnely Jiuzhen
and Changshan.
(2) Toll stations
There are 9 toll stations to be built. The locations of toll stations are at the following
interchanges Dongyuan, Zhaojiabao, Zhangpu,.Duxun, Yunxiao, Changshan, Lintou,
Xishan, Zhaoan.
(3) Administrative agencies and maintenance groups
There are three of them, and all of them will be incorporated with toll stations.
(4) Tunnel administration teams
There are two of them at the entrance of Kuzhishan Tunnel and at the exit of
Dabushan Tunnel respectively.
The facilities mentioned above will discharge some wastewater polluting the
environment.
2. Analysis of pollution strength
(1) Service centers
() Domestic sewageCalculation is based on analogue information. The number of staffs of department
stores, restaurants, hotels, filling stations, repair shops and toll stations will be 270; and
2000 peoples of passengers equal to 200 peoples of routine workers. Assuming the daily
assumption of water per person is 2001, then for one service center, 54 t of water will be
used a day (270 X 200=54), and if we have the same amount as allowance, considering
double volume for a spare part. Then 108 t of water will be used and discharged.
According to "Sewage Discharge Standards" GB8978 - 1996, the domestic sewage
will be disposed of properly before discharged. Supposing the concentrations of the
discharged waste water are
COD4 , < 150 mg/I;
BOD5 < 60 mg/ Il
Oil <15 mg/ I
The pollutant source strength of the domestic sewage is not greater than
COD0 . :16.2 kg/ d;
BODs :10.8 kg! d;
Oil 1.62 kg/ d.
(©) Scouring waste water comes from filling stations, repair shops and parking plots.
The total amount of sewage discharged each day will be:
COD", :7 kg / d;

BOD5 :5kg /d;
Oil :4kg/d,under conditions that 5 vehicles can be washed at the same time, and it takes 15
minutes to wash a car, and the working hours a day is ten, then 200 vehicles will bescoured a day, and supposing that each vehicle discharges 35 g of CODCr, 25 g of BO
D5 and 20 g of oil.
Besides, the filling stations and repair shops will be washed once a day, emitting:
CODcr :4 kg / d;
BOD5 :3kg/d;
Oil :6kg/d.
Put together, we have
CODcT : 27.2 kg / d;
BOD5 :18.8kg / d;
Oil :11.62 kg/ d.
(2) Pollutants from other service facilities
The amount of the sewage from ten toll stations, three management sections and
maintenance areas is very minor, causing no considerable impact on the surrounding
environment.
4.6.2 Prediction and Assessment of Impact on Water Environment
4.6.2.1 Prediction Method of Pavement Run-off Impact
1. Prediction method for tidal reaches
The extra large bridge of Nanxi is located at Nanxi where the Nanxi stream and the
Jioulong River joint and then flow into the sea. Affected by tides, the river water regime
changes periodically with time. The pavement runoff of the bridge will flow into the river
course through roadside drainage systems. To meet the requirements in " EIA
Technology Guidelines" HJ/ T 2.1 2.3 - 93, average water quality of high tide, medium
tide and low tide will be adopted for 3 Class assessment. For this prediction, we use two-
dimensional stable water quality model and its solution.
Assuming that the pollutants are mixed very soon after discharged at the current (Z),
ac 0,ac-C =0,- 0OAT aZ
so, the basic equation of the two-dimensional stable water quality model will be
ac a2c a2cU-=M -+M -ax aXb2 Yu iY 2
The first item- on the right side of the above formula is so minor compared with

the second item that it can be ignored. So the above formula can be reduced to
ac a2cu-=M -
ax y cl2
As to discharge at stable sources, the discharge source is at the longitudinal
coordinate X = 0, and the width of the river is B. Considering the one-time reflection
of the bank, and under the initial cross sections, the solution of the two-dimensional
stable water quality model can be obtained:
2 u~~2B-y) 2
C(x, Y)= ( ;Q; exp(- )+ exp[- u (2B -_HV7zuXM~ 4MYX 4Y
where
Cp ollutant emission concentrations, mg /1;
Qp-sewage discharge, m Is;
H- nean water depth, m;
M, longitudinal mixed coefficient, m /s.
AM, is deternined by using Taylor's method
My = (0. 058H + 0. 0065B) +gHI
B-river width, m;
g-gravitational acceleration, m Is';
I -hydraulic slope fall, m /m;
u nmean cross section speed, m / s.
2. Prediction of water quality at Jiouzhen Port, Zhang River (dockyard) and the
PortJiouzhen extra large bridge, Dockyard extra bridge and Port extra large bridge
being located in close range to Zhaoan Bay, Dongshan Bay and Jiouzhen Port, the
polluted runoff is mixed with the water in the bays in no time. Based on Class 3
assessment of " Environmental Technology.Guidelines", the average water quality of
high and low tide can be calculated by using complete mixture model.
C = CPQP+ ChAQhQp +Qh
3. Prediction of water quality in Yangmei Reservoir
11'7

Being an extra large viaduct crossing the valley, Jiaoling Bridge flies over Yangmei
Reservoir, the area of which is 5.1 square kilometers, with 12.6 km of river course. Based
on "Environmental Technology Guidelines", it is of Class 3 assessment of medium-sized
lake. Calawshov model is used
C = Cp- (Cp - C", )( r )QOM
where
Cr --- ean concentrations of pollutants in segmental area, nig / 1,
C,-discharge concentrations of pollutants, mg / 1;
C,O given concentrations of pollutants at r point, mg /1;
5 -discharge at the bank is taken as ;
H average water depth, m,
jXl -radial mixed coefficient, m2 / s;
Q,-waste water discharge amount, m2 / s.
4.6.2.2 Prediction at the Service Areas
One-dimensional mixed model is adopted for prediction at Jiuzhen and Changshan
Service Areas due to the fact that small amount of discharged sewage is easily mixed
with river water.
4.6.2.3 Prediction of River Water Quality along the Proposed Highway
1. Prediction of Water Quality in Jioulongjiang River and Nanxi Stream
According to the hydraulic parameters, discharge of runoff pollutants and discharge
concentrations, two-dimensional stable model prediction of water quality in Nanxi
stream was conducted. The prediction involves
(1) Mean CODMn during low and high tides and tidal periodicity under maximum
discharge.
(2) Mean COD. of tide periods under average discharge.
(3) Mean oil concentrations of tidal periodicity under maximum discharge.
According to the field survey in January, 1998, the mean levels of CODM, at lower
reaches of Nanxi stream during low tide, high tide and average of tidal periodicity are
3.10 mg/l, 2.95 mg/l and 3.05 mg/l; those of oil are 0.06 mg/I, 0.05 mg/l and 0.05 mg/l
respectively. Under maximum discharge of pavement runoff, the increment of maximum
concentrations of CODw, during low tide is 0.325 mg/ I which can meet Class 2standards of sea water when'superposed with current background levels. Due to the fact
that the current background levels of oil higher with an average of 0.05 mg /1, the

maximum concentration increment is only 0.006 mg/l under normal discharge. However,
under maximum discharge, the maximum concentration increment is 0.070 mg /1, which
results in exceeding the Class 2 Standard of Seawater and the Class II Standard of
Surface Water.2. Prediction of Water Quality in Zhangjiang River Mouth
One-dimensional mixed model is used for concentration increment on account of the
fact that the run-off from the extraordinarily large bridge at the dockyard and the sewage
from Changshan Service Center flow into the river mouth. See Table 4-6-6 for detail.
Table 4-6-6 Prediction Results of Pollution Concentration Increment
at Zhang River Mouth unit: mg/l
Tide levelsIemleves Low High Average
CODm,, Max. 0.062 0.04 0.08Aver. 0.070 0.004 0.008
Oils Max. 0.0163 0.001 0.002 /I Aver. 0.0034 0.0002 0.0004
According to the field survey, the average of COD., at the mouth is 2.30 mg/l, and
the oils detected are 0. 025 mg/i, so the Class 2 of seawater standards and the Class II of
surface-water standards can be met when superposed with the increment.
3. Prediction of water quality at Jiouzhen Port
Discharge of the runoff from pavement of Jiouzhen extra large bridge will flow into
Jiouzhen Port, leading to pollution increment. See Table 4-6-7 for detail.
The average of CODmMn monitored is 2.5 mg/I, and the oils detected are 0.025 mg/I,
so the water quality can meet the Class 2 of seawater standards.
4. Prediction of water quality at the Port
The pavement runoff of the large bridge flows into the port causing concentration
increment of pollutants as shown in Table 4-6-8.
Table 4-6-7 Prediction of Concentration Increment of Pollutantsat Jiouzhen Port unit: mg/_
de levels Low High Average
Max. 0.0038 0.0021 0.0027CODMf Aver. 0.0005 0.0002 0.0003
Max. 0.0 10 0.0006 0.0007Oils Aver. 0.0002 0.0001 0.0002

Table 4-6-8 Prediction of Concentration Increment of Pollutants
at the Port unit: mg/l
1edsv Low High Average
Max. 0.004 0.002 0.003CODM,} Aver. 0.0003 0.0001 0.0002
Max. 0.0008 0.0005. 0.0006Aver. 0.00004 0.00003 0.00003
The data monitored show that the concentration of COD. is 2.825 mg /1, and no oil
has been detected. So the water quality can meet Class I standards after superposed with
the maximum increment.
5. Prediction of water quality in Yangmei Reservoir
Pavement runoff of the Yangmei Reservoir Bridge flows into the reservoir, causingpollution increment in the reservoir as shown in Table 4-6-9.
The average of CODMD monitored is 2.25 mg/I, and the oils detected are 0.025 mg/l.
The predictive results after adding concentration increment shows COD., satisfied the
Class II standard of surface water quality, while the oil detected surpass the Class II of
the surface water quality.Table 4-6-9 Prediction of Pollution Increment in Yangmei Reservoir unit: mg/l
Pollution Distancesollurcen 0.1 0.2 0.3 0.4 0.5 0.6 0.7 0.8 0.9
Max. 27.27 19.96 15.34 11.90 9.14 6.82 4.82 3.04 1.44Pavement mn Aver. 2.05 1.44 1.08 0.82 0.62 0.46 0.32 0.20 0.10
runoff Oils Max. 5.66 4.14 4.18 2.47 1.90 1.42 1.00 0.63 0.30Aver. 0.28 0.20 0.15 0.11 ] 0.09 |_0.06 0.05 0.03 0.01
4.6.2.4 Prediction Analysis of Impact during Construction Phase
1 .In the construction of bridge piers, the water will become turbid by digging mud or
washing sand, impacting the water quality near the inlet.
2. The waste oil from construction ships or other building machines will go into the
waters causing oil concentration to exceed the standards.3. The domestic sewage, garbage and feces from construction workers will be
discharged into the waters, directly polluting river sections.4. Oil leakage from construction ships or other kinds of waste oil will pollute the
waters, which must be prevented.5. Construction materials such as asphalt, oils or chemicals may be washed away to
enter the water bodies.6. Earth of cutting and filling may be washed away to flow into the water bodies

together with runoff to cause the suspended substances in the water to go up. Because thefactors effecting the water quality are hard to be determined, management will bestrengthened to reduce pollution of the waters.4.6.3 Conclusion of Water Quality Analysis4.6.3.1 Assessment Summary of Current Situation of Survey of Water Quality
The following conclusions can be made based on assessments and surveys ofdifferent sections
(1) The water at lower reaches Nanxi Stream satisfies the Class 2 of seawaterstandards and the Class II of surface-water standards;
(2) The water in Yangmei Reservoir is fairly good that it meets the Class IIstandards of surface water;
(3) The water in Jiouzhen Port downstream Luxi Stream is of the quality meetingClass 2 seawater standards;
(4) The water lower reaches of Zhang River and the mouth is of the quality meetingthe Class 2 of seawater standards and the Class II of surface-water standards;
(5) The water at Zhaoanwan Port belongs to seawater quality meeting Class 2standards.4.6.3.2 Summary of Water Quality Impact Prediction
Based on the prediction and superposition of increment with background levels, wesee that
1. The water quality of lower reaches of Jioulong River and Nanxi stream and themouth meets the Class 2 of seawater standards and the Class II of surface-waterstandards.
2. The water quality of lower reaches of Zhang River and the mouth meets the Class2 of seawater standards and the Class II of surface-water standards;
3. The water quality at Jiouzhen Port meets the Class 2 of seawater standards;4. The water quality at Zhaoanwan Port meets the Class 2 of seawater standards;5. The water bodies in the assessment area may be impacted by oil pollution during
the operation phase. The original set service area near Yangmei Reservoir is canceled toprevent from water pollution.
6. Earthworks during construction phase extra bridge construction will haveremarkable impact on the water quality of all rivers and other waters.4.6.4 Environmental Protection Measures and Suggestions
1. Suggestions against pavement runoff pollution(1) Roadside drainage will not be discharged directly into rivers or fishponds. Runoff
from pavement of Xinxu Bridge will not be discharged into Yangmei Reservoir. Thedrainage and runoff water should be drawn into irrigation channels by roadside ditches.
(2) The drainage system will be provided with gates and/or other settling facilitiesbefore the wastewater discharged into the river.
(3) In case of emergency such as spills of oil, chemicals or toxic substances, thewater gates will be closed to prevent pollution of the water bodies.
(4) Aquatic fanning should not be located in the vicinity of bridges.

2. Environmental Protection Measures in Service Centers
(1) Filling stations and car-washing shops will be installed with oil separating tanks,
and the water will be recycled;
(2) The service centers will be provided with class 2 sewage disposal device. After
treatment, the wastewater must satisfy the standard requirement before discharging. The
domestic sewage from restaurants and toll stations will be treated in septic tanks. The
treated water will be used for irrigation and fertilization.
(3) Based on the suggestions from environmental assessment unit, the designing has
already changed the position of the service area originally designed at the vicinity of
Yangmei Reservoir to Hekeng. The impact on the water quality of Yangmei Reservoir
has been avoided.
3. Measures against water pollution during the construction phase
(1) Advanced techniques such as steel case coffering or drop shaft sinking method
will be adopted in bridge construction to reduce mud loss.
(2) Oil leakage from bridge construction machinery will be avoided strictly. Waste
oil and garbage will not be allowed to be discharged or dumped into water bodies. Oilcollecting tanks should be set under machines. Ships should be installed with oil-water
separators.
(3) Fixed garbage collecting stations should be set on ships or in construction sites,
to insure periodical cleaning and assemble treatment of garbage.
(4) Construction materials such as asphalt, oil or chemicals will not be allowed to be
stocked near the rivers.
(5) One garbage heaping plant and one septic tank will be set up for everyconstruction camp.
(6) Muddy water from material washing should be settled before discharged.
(7) Wastewater from washing vehicles, ships or other machines, or other kinds of oil-
contained wastewater should be treated before discharging.
4. Management during operation phase
(1) The management stations of expressway will inspect the load of vehicles, and to
prohibiting over loaded vehicles at the toll stations. Leakage or spilling of oil, earth or
sand will be avoided;(2) Administration Station will be informed of the haulage of hazardous materials,
which should be strictly monitored and supervised.
(3) Garbage will be collected regularly and disposed of at fixed places in the nearby
counties instead of dumping into rivers directly.
(4) In case of emergency such as car crash near water bodies or leakage of toxic
materials, Public Security Department and environmental protection agencies will be
informed of immediately by the management stations or patrolling men to take
appropriate measures to minimize pollution.
122

4.7 Environmental Protection of Interchanges and Link Roads
4.7.1 Interchanges
Nine interchanges are planned to be built and they will be connected with the
existing highways for the sake of the local economic growth. See Table 4-7-1 for detail.
Table 4-7-1 Link Roads of the Highway
Order Name of Class Length Connecting lines & their uses.______ interchange (km)
Class 1, plain
I Dongyuan light undulate 5.0 Connecting Zhang-Yun Highway; leading to Gangwei Development Area.
area
Class 2, plain2 Zhaojiabao light undulate 8.0 Connecting Fuotan-Huxi Highway, and Provincial Highway 210.
area
_ Class 2, level .. Connecting Zhangpu-Jiouzhen Highway, leading to Zhangpu County Town.
3 Zhangpu undlatea 0.53 Connecting Provincial Highway 210, and Niujiu Highway.area
Class 2, level i Connecting Zhang-Yun Highwvay, leading to Gulei Development Area.
4 Duxun unduarea 0.48 Connecting Provincial Highway 210.area
Class 2, level Connecting Zhang-Yun Highwvay, serving as an exit of the county town &
5 Yunxiao undulate 0.50 Dongxia Towni.
area Connecting Provincial Highway 210.
Class 2, level Connecting Highway 324, serving as an exit of the southern part of Yunxia
6 Changshan undulatea 0.85 county & Dongshan Countyarea
Class 2, level
7 Lintou undulate 0.90 Connecting Dongshan County Town
area
Class 2, level8 Xishan undulate 0.95 Connecting Highway 324, serving as an exit of Zhaoan County
area
Class 2, level9 Zhaoan undulate 0.66 Connecting Highway 324, serving as an exit of Zhaoan County
area
1. The interchanges will impacts on the environment in the following aspects:
(1) Vehicles enter and exit the expressway from interchanges, and stop to hand in
fees here. Due to the large numbers of vehicles with rather low speed, the exhaust gas
will cause rather serious impact on the air environment.
(2) The interchanges will constructed with toll stations and parking lots. In the
surrounding area of interchanges, repairing and commercial businesses will developed.
Although it will be beneficial to the local economy, environment issue as pollution may
123

be induced.
(3) 100mu for one interchange, the interchanges will occupy a rather large amount of
land, which cause economic impact on farmers. Calculated result shows that for one
interchange, I1 t of grains will be lost.
(4) Rainwater accumulation is a general existing problem of interchange. Attention
should be paid to it in the designing.
(5) The interchanges will bring convenience to the local traffic, which will promote
the development of local economy. Interchange areas are the main part of plantation
areas along the expressway. The beautify designing for plantation will develop the
natural scenery.
(6) Either side of the Xialoucun village near Duxun Interchange will be impacted by
the ring road of the interchange. The noise level will exceed the standard 4.3 dB(A).
Afforestation will be adopted out side of the village to eliminate the noise and exhaust
gas pollution, and the first line building facing the proposed highway will reconstructed
to stocking house or shops.
(7) Guanyinting village and Xiagaoxi village near Yunxiao Interchange will be
impacted by the ring road of the interchange and the existing 324 National Highway.
Afforestation out side of the village will be adopted to eliminate the noise and exhaust
gas pollution.
(8) Zhangpu Interchange locates between two hills with no villages nearby. However,
the route line and several ring road of the expressway will pass through the existing
irrigation ditch for 6 times. To avoid the impact on the farmland irrigation system, fly-
over or channel altemation works for the irrigation system should be finished before the
construction of interchanges.(9) No residents site or any other sensitive spot near the Changshan, Lintou, Xishan,
Zhaoan Interchanges. So, there is no unfavorable impact on local residents. The
environmental impact of Dongyuan and Zhaojiabao Interchanges is specified in the
following.
4.7.2 Dongyuan-Fugong Link Roads
1. Engineering Introduction
Dongyuan (Gangwei) Interchange is the start point of the Dongyuan-Fugong Link
Roads, where vehicles get up and down the expressway. The link road will promote the
development of the largest development area of Zhangzhou City-Gangwei development
area. The link road is 4 lane Class I highway with a total length of 5km. Total investment
is 105.6397 million yuan RMB.
The start point of the link road is located near Dongyuan Village, namely the exist of
124

Dongyuan (Gangwei) Interchange toll station. The route extends eastward along the
hillside, via mountain slop behind Huangkeng village, passes Linghou village, goes
through a large tract of paddy field, flies over the Fugong extra-large bridge, then
connectes Shugang Port highwvay at north of hantouwang village. See Figure 4-7-1 for
the route trend. See Table 4-7-2 for the traffic volume prediction.Table 4-7-2 Traffic Volume Prediction of Link Road Unit: small v./d
(Sep. 1998)
Year 2003 2005 2010 2015 2020 2023
Traffic 3267 4321 7614 11716 15679 18674volume
2. Environmental Impact
(1) Impact on Ecological Environment
The link road will cause environmental impact such as the influence to agriculture
by land acquisition; deterioration of plantation; soil erosion induced by large volume of
earth and stone works; and the impact to construction safety by the unfavorable geology.
Land acquisition area of this link road is 31 Smu, including 1 88mu of wet field, 95mu
dry field, 32mu other kinds of land. Grain product loss due to the construction will be
315.262 t, which values to 504,400yuan RMB. The link road locates in Longhai City
where soil erosion is not serious with a erosion module of 402.5t/km2 * y. The start road
section KO-K2 will be on the low mountain slopes, where the volume of cutting is larger
than filling. At other following road sections, the major work will be filling. Total
volume of earth and stone work is 475,280 m2. The cuttings and fillings of the road
construction should be balanced. It is calculated that the erosion module will be
402.5t/km2 - y during the construction period, which is 5.211 times the value before
construction.
The mitigation measures during construction period include
a. Balance the cuttings and fillings of the road construction as less spoil as possible.
b. In the early construction, the following works will be completed at the same time
if possible: subgrade, slope protection, drainage, retaining walls, plantation of trees and
grass.
c. The earth and stone work for subgradge will be obtained from the borrow sites and
quarries authorized by local government and enviromnental protection bureau.
d. The soft soil ground is distributed at the section of KO+OO0-KO+500 and
K2+300-K5+000. Protection treatments by using plastic drainage boards, soil
replacement, geotextile and cement stirring piles should be adopted.
125

(2) Impact on Social Environment
Total length of the link road is 5km. See Table 4-7-3 for the villages within 200m on
both sides of the highway in the assessment scope. Number of removing households will
be 75. Number of impacted households will be 476. Number of impacted people will be
1653. The link road is closed Class 1 highway, which will separate the people at the two
side of the road. The designing institute did not specify the number of the passageways.
The EIA shows that more than 11 passageways should be built for the convenience of the
local residents, which has already been adopted in. the designing.
Table 4-7-3 Village and Town along the Proposed Highway (Sep. 1998)
Distance from Number of Number ofOrder Name of the village Position the road side impacted the Impacted
(m) households People
IDongyuan KO+500-K+ 50-100 I 130 468
Kl+OCO-Kl+2 Huangkeng 400 0-50 240 816
K2+50-K2+33 Linghou 00 30 3 115
4 Fegig K2+350-K2+ 100 62 2104 Fengming 600
5 Shantouwang K4450 J 150 12 44
Total 476 1653
(3) Impact on Water Environment
The greatest river along the link road is Nanxi. There will be an extra-large bridge
built on Nanxi with a length of 545.5m. The construction of this bridge will be difficult
due to the tidal influence. To eliminate the impact of the construction of bridge piers on
the river water, reasonable procedures will be taken such as cofferdam method or drop
shaft sinking in construction. Oil-water separator will be installed on the construction
ships. Septic tanks will be set at construction camps and toll station for the treatment of
domestic sewage. Garbage collecting station will be set at the construction camps for
regularly assemble. Washing water used for construction materials will be settled before
discharging.
(4) Impact on Acoustic Environmnent
There are 6 sensitive spots impacted by the traffic noise. The number of impacted
people is 1758. See Table 4-7-4 for the prediction result of the acoustic environment at
126

sensitive spots. Dongyuan Mid. Sch. is the most seriously standard exceeded spot.
Soundproof Screen (High 2m, Length ISOm) will be built for mitigation of the noise
impact. Traffic noise will slightly impact Dongyuan village in 2010. Afforrestation will
be adopted around the village. Other villages will not surpass the standard, where the
acoustic environment is rather good.
Table 4-74 Acoustic Environment Prediction forDongyuan-Fugong Link Road Unit: dB
Distance 2005Yr. 1 201OYr. 2020Yr.
Order Spots from the Tie SadrOrder Spots road sirde Time Standard Noise Exceed Noise Exceed Noise Exceed
(m) Level value Level value Level value
Dav 60 58.3 60.6 0.6 64.1 4.1l Dongyuan 50-100
Night 50 50.3 0.3 53.6 3.6 55.7 5.7
2 Dongyuan 80 Day 55 58.5 | 3.5 61.3 6.3 63.1 8.12 Do g u n80 __ _ _ _ _ _ _ _ _
Mid. Sch. Night 45 49.4 5.4 52.8 7.8 54.7 9.7
Day 70 1 60.6 1 64.2 66.73 Huangkeng 50 _
Night 55 53.4 56.7 1.7 58.5 3.5
Day 70 59.3 62.4 65.14 Linghou 30 _ I
Night 55 51.2 54.3 56.7 1.7
Day 70 62.0 62.4 63.45 Fengming 100
Night 55 51.7 52.3 53.7
6 Shantouwang 150 Day 60 59.1 5 59.5 60.5 0.56 Shantouwang 150 ___
Night 50 47.8 48.5 49.8
(5) Impact on Environmental Air
Based on the prediction results, the daily average concentrations of CO will be less
than 1.28-1.38 mg/Nm3 , hourly average concentrations of CO will be less than 2.55-2.18
mg/Nm3; the daily average concentrations of NOx will be less than 0.021-0.33 mg/Nm3 ,
hourly average concentrations of NOx will be less than 0.036-0.063 mg/Nm3 . Which
shows the air environment is quite good.
(6) EP Investtnent Estimation
See Table 4-7-5.
127

Table 4-7-5 Investment Estimate of Dongyuan-Fugong Link Road
Order Measures Calculation method Cost(1 0,000yuan)Domestic sewage treatment of toll 50,000 uan/tank, I tank 5
_station by septic tanks,. ' _2 Domestic sewage treatment of 50,000yuan/tank 3 tank
______ construction camps by septic tanks y 3 t3 Domestic garbage disposal of toll 3,000yuan/place, 4 places 1.2
station & construction camp
4 Passageways 150.000yuan/place, 1lplaces 165
5 Sound proof plantation I 0,O00yuan/place, 6 places 6
6 Oil-water separators installed for every 20000yuan/ separator, 9 separator 18construction ships
7 Settlement ponds at construction sites 15.000yuan/pond, 3 ponds 4.5
8 Dust prevention by wxater spraying at I 0.OOOyuanI/ sprayer, 3 simple 3
construction sites wvater sprayer vehicles
Drainage system for interchange int,ercyuan/interchange, 2 20
10 Sound proof screen at Dongyuan Mid. 700yuan.m2 , 150 X 2 m2 2110 Sound ~~Sch. I _ _ _ _ _ _ _ _ _ _ _ __ _ _ _ _ _ _ _ _ _ _
II Environmental monitoring and training Environmental monitoring 10Environmental_monitoring_and_trammg 60,O00yuan, training 40,000yuan
Total 26870
4.7.3 Huxi(Zhaojiabao)-Fuotan Link Roads
1. Engineering Introduction
Huxi (Zhaojiabao) Interchange is the start point of the Huxi(Zhaojiabao)-Fuotan
Link Road, where vehicles get up and down the expressway. The link road will
promote the development of the south eastern coastal area of Zhangpu County. The
link road is Class 2 highway alternated on the base of existing road. Total length of the
link road is 8km. Total investment is 35.0578 million yuan RMB. Land acquisition
area of this link road is 300mu, including 179mu of wet field, 90mu dry field, 31mu
other kinds of land. Number of the household to be removed will be 213, people to be
removed will be 826. Total earth and stone work of the link road will be 270,800m3 .
Trend of the route: The start point of the link road is the exist of Huxi(Zhaojiabao)
Interchange toll station. The route passes Xiaoshi, Guotian, Shanrennei, Xinan, Shigu,
then connects the Provincial Road 210 at Renjiacun. See Figure 4-7-2 for the route
trend. See Table 4-7-6 for the traffic volume prediction.
Table 4-7-6 Traffic Volume Prediction of Link Road Unit: small v./d(Sep. 1998
Year 2003 2005 2010 2015 2020 2023
Traffic 1892 2289 3522 4740 6456 7146
volume
128

2. Environmental Impact Analysis
Land acquisition area of this link road is 269mu. Grain product loss due to the
construction will be 299.67 t, which amounts to 479,500yuan RMB. The link road is
located in the south eastern light rolling coastal area. There will be cuttings and fillings
during construction. Soil erosion will be worse during the construction period.
Therefore, in the early construction, the following works must be completed at the
samne time if possible, subgrade, slope protection, drainage, retaining walls, plantation
of trees and grass.
There are 6 sensitive spots impacted by the traffic noise. Number of impacted
people is 1060 or 280 households.. See Table 4-7-7 for the prediction result of the
acoustic environment of sensitive spots. This link road will be built according to class
2 standard, which will be plane intercross structure. Warning signs should be set for the
safety and convenience of local residents.
Septic tanks will be set at construction camps and toll station for the treatment of
domestic sewage. Garbage collecting station will be set at the construction camps for
regularly assemble. Washing water used for construction materials will be settled
before discharging and irrigation.
The traffic volume of this link road is rather small (6456 small vehicles / d in
2020Yr.). According to the prediction results in Table 4-7-8, no serious acoustic and air
pollution will be caused by the traffic on this link road before 2020.
According to the analogue analysis result with Dongyuan-Fugong Link Road, the
air quality will not be impacted by the construction of this link road.
According to the analogue calculation with Dongyuan-Fugong Link Road, The
EP investment of this link road will be 1.3085 million yuan RMB.
3. EP cost estimation for Huxi-Fugong Link RoadWith a rather low traffic volume, the operation of.the road will have little impact
on the environment. The EP measures taken will be mainly in the construction period.See Table 4-7-9 for the EP investment.
Table 4-7-7 Village a d Town alon the Proposed Highway ep. 1998)Distance from Number of Number of the
Order Name of the village Position the road side impacted Impacted______________________ ______________ (m) households People
1 Xiaoshi K0+000 80 43 1632 Guotian K1+050 110 35 953 Shanmennei _K2+450 50 16 604 Xinshe K3+750 100 13 50
5 Xinan K5+120- 60 132 500K5+400 .
6 Renjiacun K7+450- 200 51 200K7T850 2801060
Total 280 1060

Table 4-7-8 Acoustic Environment Prediction forHuxi(Zhaojiabao)-Fuotan Link Road Unit: dB
Distance 2005Yr. 201OYr. 2020Yr.
Order Spots from the Tie SadrOrder Spots roa°dsihde Time Standard Noise Exceed Noise Exceed Noise Exceed
(m) Level alue Level value Level value
Xiaoshi 80 Day 70 53.6 0 54.3 0 57.9 0
Night 55 43.2 0 44.1 0 50.3 0
2 Guotian 110 Day 60 51.6 | 0 52.4 0 56.0 0Night 50 41.1 0 41.5 0 47.7 0
3 Shanmennei 50 Day 70 56.6 0 57.3 0 60.9 03_ _ Shanmennei 50 Night 55 47.1 0 48.0 0 54.2 0
Day 60 52.2 0 52.9 0 56.6 ONight 50 41.3 0 42.2 48.6 O
Day 70 55.3 0 56.1 O 59.6 0S Xinan 60 Night 55 45.5 0 46.4 0 52.6 j 0
Day 60 47.8 0 48.6 0 52.2 0
nc2ight 50 378.57 0 39.8 0 42.6 0
Table 4-7-9 EP cost estimation for Huxi-Fugong Link Road
CostNo. EP Measures Amount & method of calculation
11 _______________ ______ I ( o )
Septic tanks at construction camps 50.000yuan each, 2 sets 10
2 Garbage treatment at construction camps 3,000yuan each, 3 camps I
3 Warning sign for passage way 5.000yuan each, 16 spots 40
4 Afforestation for EP 1 0,O00vuan each, 6 places 6
5 Settlement ponds at construction sites 15,000yuan each, 15 places 4.5
6 Water spraying for dust prevention I 0,00yuan each, 3 simple sprayer 3
60,000yuan for monitoring, 17 Monitoring & training 40,0yuan for training 0
| Total 74
¶ rA

Domtgyunin ) / jwi 3itecl;1g'42~~~~~~~~~~~~~~~~~~~~~~~~~~~~~~~~'~~~~~~42. * -, . I~~~~~~~~~~~~~~~~~~~~~~~~~~~~~~~~~~~~~~~~~~~~~~~~~~~~~~a
\X 0 " .~~~~~~~0,
-I~ ~ ~~~-.
II-
"I P.'- /~~I000
Figuirc 4-7-1 Skecdi MVap of D)ongyunin - Fugong Link Road (1:0000)

N- ' '1 ' >K~2.,/ *'~Y;/(
.. ,.~ ~ ~~~~uF / -1--~VK . *. 2~ :9' V
(KY -N
Al el~~~~~~~~~~~-~'
A~~~~~~~~~~~~~~,\
'~~ I / ... ' 44. NY a ~ ~~ ~- 'N
"K~~~~~~~~~~~~ A>7 .-
61
it~~~~~~~~~~~j"N
IN ~ ~~~~~~~~~~~~~'
O . --' -"0 \ -I "
~~~~~ / / ,~~~~~~~~~~~~~~~~~~~,niIu
*;.\-~ 4 -'-~ -~./ '~A.---
Figure 4-7-2 Sketch Map of Hui- tnLn od (:00

5 ALTERNATIVE SCHEMES
5.1 Introduction of Engineering Schemes
Two major two alternative alignment schemes (West Line Scheme and East LineScheme) have been put forward by Fujian Communications Planning and DesignInstitute in the Project Pre-feasibility Study Report. The East Scheme was determined asthe recommended scheme after pre-feasibility study. In the East Scheme there are severalpartial alternative schemes specified as follows. See Figure 2-1.
Introduction of the two alignment scheme of the whole line (West Line Scheme andEast Line Scheme)
West Line Scheme:The starting point is Beitou of Longhai City, then the line extends to southwest
passes Dongsi, Guanxun, Caopuqian. From there on, the line is along the side of NationalHighway No.324. It passes Chaiqiao, Shuimuoling, Yuanmen, Longfu, Pantuoling,Shuanggongmiao, Huotian, Caipu, Yanwuting, combine with the recommended schemeat Shenlong.
East Line Scheme:The middle line from Longhai to Zhangpu is adopted. Begin from Beitou which is
the starting point of Xiamen-Zhangzhou Highway, extending southwestward, it passesBaishui, Neijiayang, Xifengling, Youkeng, Huxi, Kuzhishan, Jiouzhen, Cili,Guangyinting, Dabushan, to Shenlong. From thereafter, the alignment is the same withWest-Line Scheme.
The East Line Scheme is the recommended scheme, while the West Line Schemewas abandoned in the pre-feasibility study period. There are three sections of alternativeschemes in the recommnended East Line Scheme, which is introduced as follows:
1. Three alternative schemes of the section from Beitou to Jiuzhen
(1) Outer line scheme:The starting point is Beitou Village, which belongs to Haicheng Town of Longhai
City. From there on, the line passes Dongyuan, Jiangcuo, Xifengmiao, extendingsoutheastwards it passes Guoxi, Ciyao, then turn to south it passes Yuanzhongyang,Hujiao, turn to west at Biantang, it combines with Middle Line Scheme near Jiuzhen.
(2) Middle line scheme:The starting section from Beitou to Xifengmiao is the same as the Outer Line
Scheme. Extending southward from Xifengmiao it passes Youkeng, Hekeng, Zhaojiabao
131

Interchange, Kuzhishan Tunnel, Xidong, then connects with Outer Line Scheme at
Jiuzhen.
(3) Inner line scheme:
The starting point is Beitou of Longhai City. The route extending westwards, passes
Jianshan, Guanxun, Wuping, Daqian, Keling Tunnel, then it combines with Middle line
scheme at Xidong.
The Middle Line Scheme is the recommended scheme of engineering.
2. Two alternate schemes for the section from Andou to Xizhang
(1) Yunxiao Inner Line Scheme:
The starting point is at north of Andou Village of Shaxi Town Shaxi in Zhangpu
County. After passing Luowanjing, Saizai, Wutian, Guanyinting, fly over Zhangjiang to
Haotan, through Dabushan Tunnel, to Shudong, getting to Shenlong, then Houcuoyuan,
passes north of Zhugang, north of Lincun, combines with outer line at north of Xizhang.
This Inner Line Scheme is the recommended scheme.
(2)Yunxiao Outer Line Scheme:
The starting point is the same with the inner line scheme, at north of Andou Village.
The line passes Huqiou, through Mulinshan, and Jintouing tunnels, through Linkenling
and Shuangling tunnel, then passes the north of Shuangling. Then, After passing Chendai,
Zhugang, Yancang, combines with inner line at north of Xizhang.
The recommended Yunxiao Inner Line Scheme have two road sections
(Wutian-Dapu Section & Shudong-Guanlin Section) of alternative schemes:
A. Two Alternative Schemes for Wutian-Dapu Section
a. Baita Tunnel Scheme:
Starting from the east of Wutian Village and passing Hebu, Houdun, the line comes
to the Baita Tunnel (860m length) through Shanmei Mountain by the tunnel, then turns to
the south to Shenlong Interchange, then combine with the Dabushan Tunnel Scheme.
b. Dabushan Tunnel Scheme:Starting from the east of Wutian Village, passing Guanyinting and Dabushan Tunnel
(2000m), the line turns to south to Shenlong Interchange, combine with Baita Tunnel
Scheme.
B. Two Alternative Schemes for Shudong-Lintou Section
a. Inner Line Scheme:
Starting from the northwest of Shudong Village, which locates at the exist of
Dabushan Tunnel (K91+000), the line passes Shudong, Dapu Interchange, then passes
south of Gaotangzhai, via Lintou Interchange. It combines with the Outer Line Scheme at
the north of Houdu Port in Zhaoan County.
132

b. Outer Line Scheme:
Start point is the same with the Inner Line Scheme. The line passes Shudong Village,
Shenlong, Houcuoyuan, north of Zhugang Village, north of Yancang, north of Lintou
Village, end at the east of Houdu Port in Zhaoan County.
3. Two Alternative Schemes for Zhongzai-Houling Section(1) Inner Line Scheme:
Start point is located on the mountain slope of south of Zhongzai Village
(K144+000), passes north of Tianpuxu Village, north of Yuanqian Village, flies over
National Highway 324 between Dapu and Caiyuanpu, through Jixinling Tunnel, comes
out of the tunnel, the line passes Shanbian Mountain (30m depth of digging) the
distributes along the north of Dongshen Village, then passes north of Shangmei Village,
south of Weizai Village, south of Xinshanlong Village, north of Shangyuan Village, south
of Shuyamei Village, getting to the Rendishan Mountain, where the line combine with
the Outer Line Scheme.
(2) Outer Line Scheme:
Start point is the sarne as the Inner Line Scheme, the line passes south of Tianpu,
Village, Yuanqian, south of Waifenglou Village, south of Shijiang,osuth of Xinan Village,
Changmaolin, flies over National Highway 324, ending at the foot of Rendishan
Mountain where it combines with the Inner Line Scheme.
5.2 Environmental Comparison of Schemes
From the point view of environmental protection, the advantage and disadvantagesof the alternative schemes are compared specifically in follows.
1. Environmental Comparison of the three schemes on Beitou-Jiuzhen section
See Figure 2-1 for the three schemes of Beitou-Jiuzhen section. Environmental
factor comparisons are shown in Table 5-2-1.
(1) Middle Line scheme has the least amount of villages along the highway, with less
land acquisition and house removal. The disturbance to the social environment and life ofresidents is the lightest.
(2) The rout line of the Middle Line Scheme will distribute in mountain area, whichwill bring benefit to the economic development of mountain area. It will greatly satisfythe social and economic demand of Zhangzhou area.
(3) With less residential areas along the highway, Middle Line Scheme will have thelighter impact on the life of local residents during construction and operation period. Thecost of environmental protection will be less than the other two schemes.
From the environment point of view, the Middle Line Scheme is superior to the InnerLine Scheme and. Outer Line Scheme. However the following environmental issues

should still be paid attention to.a. Spoils from the Kuzhishan Tunnel should be properly arranged to prevent from
soil erosion.
b. Safety management in tunnels should be strengthened.c. Life environment of the local residents should be protected properly.
Table 5-2-1 Environmental Comparison of the Three Schemes
on Beitou-Jiuzhen SectionItem Unit Outer Line Scheme Inner Line Scheme Middle Line Scheme
Route length km 54.461 45.402 45.052
Volume of stoneC & I000nVolumeofstoc 10000m3 684.30 671.92 661.77
earth work
Subgrade drainage 10000m3 44.673 40.236 40.020and protection
Soft ground 6.44basement enforce 7
Tunnel m/tunnel 3170/1 2580/1
Land taken mu 6590 5780 5735House removed m2 21110 10250 8734
Link road km 5.0 ( class I) 16.5 ( class 2) 5.0+8.0
Large bridge m/ bridge 2520/9 . 1200/6 1129/7
Extra-large bridge m/ bridge 1609/2 1212/2 1606/2
EP investment 10000yuan 480.18 294.11 292.14
The route line is near to the sea Less impact of Less impact ofSafety shore, which may be impacted typhoon and fog typhoon and fog
I by typhoon and fog weather weather weather
Near to the National Locating between theNear o th Natonal outer line and inner
Planning of The route line is near to the sea Highway 324, the line Mid ineshore, service area will be less operation of
Zhangzhou area .rScheme is conformthan the Inner Line Scheme expressway will beI I disturbed ~~~~~~~~~~~~~~to the planningnof
disturbed Zhangzhou area
Total cost j 10000yuan 167645.4 163881.3 161582
2. Environmental Comparison of the Altemative Schemes for Andou-Xizhang
SectionSee Figure 2-1 for the alignments of alternative schemes for Andou-Xizhang
Section. The comparison of the Inner Line Scheme and the Outer Line Scheme are,
shown in Table 5-2-2.(1) The route line of Outer Line Scheme is near to the seashore, the safety of the
vehicles on the highway which will be impacted by typhoon and fog weather. The route
line of Outer Line Scheme is distributed in the rolling and mountain area along theseashore with more tunnels and spoils, and the subgrade of the highway will be scoured
by tides, which will impact the safety of the proposed highway. But with less land taken
I 'Y

and removal, this scheme will have lighter impact on the environment during operation
period.(2) The Inner Line Scheme will cause 7134m2 more houses demolished, and 541mu
more land acquisition. The impact on the life environment (acoustic) of the residents by
this scheme will be heavier than the Outer Line Scheme, but the impact on the ecological
environment and soil erosion will be much lighter, and the social and economic benefits
of this scheme is superior to the Outer Line Scheme.
Based on the comparison, we agree with the Inner Line Scheme. However, the
following environmental measures should be adopted.
a. Jizai Prim. School will be removed.
b. Soundproof screen will be built for Xiqian Prim. School.
c. Proper mitigation measures will be adopted for other impacted sensitive spots.
d. Locations of tunnel spoil plants should be appointed.
Table 5-2-2 Environmental Comparison of the Alternative Schemes
on Andou-Xizhang SectionItem Unit Inner Line Scheme Outer Line Scheme
Route length km 33.00 29.95
Volume of stone & earth work I 0000m3 262.25 389.65Subgrade drainage and I 0000m3 19.53 20.76
protection I
Soft ground basement enforce km 8.46 3.7Tunnel m/tunnel 2000/1 3440/4
Land taken mu 3961 3420House removed m2 19610 12476
EP investment 10000vuan 280.2 174.6The route line is near to the sea
Safety weather shore, which may be impacted bytyphoon and fog weather
More impacted by the tiding of theImpacted by the tiding Less impacted by the tiding river mouth of Zhangjiang River
The complicated geology nearConstruction Difficulty seashore will bring about
difficulties in construction.
3. Environmental comparison of alternative schemes for Wutian-Dapu Section
This road section is a part road section involved in Andou-Xizhang section. See
Table 5-2-3 for environmental factor comparison.
(1) Dabushan Tunnel Scheme will have less residential sites along the highway,
which will have lighter impact on the environment during operation period. Although the
mileage of the tunnel is rather long, the construction work is not difficult. The benefits of
Dabushan Tunnel Scheme are the same as that of the Baita Tunnel Scheme.
(2) Baita Tunnel Scheme will have more residential sites along the highway, which

Inner Line Scheme. We recommended the Outer Line Scheme. However the following
EP measures should be adopted.
a. Jizai Prim. School will be removed.
b. Surrounding wall will be heightened for Haifeng High School.
c. Soil erosion mitigation measures should be adopted.
Table 5-2-4 Environmental comparison of alternative schemesfor Shudong-Lintou section
Item Unit Inner Line Scheme Outer Line Scheme
Route length km 17.625 19X
Volume of stone & earth work I 0000m3 232.71 202.33
Subgrade drainage and lOOOOm3 9.429 6.668protection
Large bridge m/ bridge 690/3
Land taken mu 2797 2373
House removed m2 3575 3658
EP investment lOOOOyuan 108 133
Total cost 10000yuan 43326.50 37606.94
5. Environmental comparison of alternative schemes for Zhongzai-Houling Section
See Figure 2-1 for the alignments of alternative schemes of Zhongzai-Houling
Section. The comparison of the Inner Line Scheme and the Outer Line Scheme are
shown in Table 5-2-5.
(1 ) The number of the impacted people of the Inner Line Scheme is about one times
more than that of the Outer Line Scheme. The cost of EP measure will be much lass.
(2) The Outer Line passed area has a smooth land feature, no tunnel, with much less
earth and stone work than the Inner Line Scheme, which will have less impact on the
ecological environment. But the amount of construction land taken and the removal is
more than the Inner Line Scheme.
(3) Outer Line Scheme conforms to the traffic planning of Zhaoan County. It is
favorable to the development of local areas.
The comparison shows that both schemes have advantages and disadvantages. The
Outer Line Scheme will have less impact on the life environment of the local residents
and ecological environment than the Inner Line Scheme. And the social economic
benefits of the Outer Line Scheme will be better than the Inner Line Scheme. Therefore,
we recommend the Outer Line Scheme. But proper EP measures should be adopted for
the recommended scheme.

Table 5-2-5 Environmental comparison of alternative schemesfor Zhongzai-Houling Section
Item Unit Inner Line Scheme Outer Line Scheme
Route length km 23.32 25.2
Volume of stone & earth work 1 OOOOm3 250.43 245.48
Subgrade drainage and protection 1000Om3 14.66 16.30
Soft ground basemcnt enforce km 8.0
Tunnel m/tunnel 1815/1
Land taken mu 2638 2800
House removed M2 5688 8830
Number of Impacted People person/household 614/86 321/46
EP investment I OOOyuan 664 114
Total cost lOOOOyuan 71030.95 72484.48
5.3 Comparison Analysis on Alternate Schemes of Sensitive spotsBased on the suggestions from WB expert, EIA working team, designing institute
and resettlement office studied environment of the major sensitive spots. Alternativeschemes are put forward and comparisons have been done.
1. Changed scheme of Jiangcuo-Neijiafang Section
The sensitive spots impacted by the Original Scheme are Cuozai, Jiangcuo, Xinxu,Xinhe, Neijiafanig and Baishui Mid. Sch. The Changed Scheme goes around the villages
with less land acquisition, less impact on the residents while satisfied the engineering
indices. The Changed Scheme will not pass through Xinhe and Neijiafang, which greatly
mitigated the removal and number of impacted people. See Table 5-3-1 for the
comparison of between two schemes.
Table 5-3-1 Environmental Indices Comparison betweenthe Original Scheme and the Changed Scheme of Jiangeuo-Neijiafang
Changed scheme compared with theItem Unit Changed Scheme Original scheme original scheme
Add lessenLength of the highway km 9.1 9.0 0.1
Earth & stone work 10,000m3 107.73 104.51 3.22Drainage and protection of _ 68850 64800 4050
subgrade 6Soft ground enforcement km 4.6 4.55 0.05
Culverts pass 26 25 lMedium and small bridges rn/No. 176/4 388/8 212/4
Land acquisition mu 815.8 806.7 9.1Building removed m 2 2617 7948 5321
No. of resettlement impacted person/househo 180/25 409/56 229/31household Id
No. of environmental person/househo 204/28 581/77 378/49impacted household Id _
EP investment 10,OOOyuan 23.2 108.4 _ 85.2Total investment 0,OOOyuan 37983.2 37894 89.2
The changed scheme has already been adopted by engineering design
1.,o

2. Huxi sensitive spotThe Original Scheme will pass through Huxi Village with a large volume of
resettlement and serious impact on the villagers. Although the Changed Scheme need
more engineering works and investment, it goes around the Huxi Village, avoided the
impact on the residents. See Figure 5-2 for the route trend. See Table 5-3-2 for the
environmental factor comparison.
Table 5-3-2 Environmental Indices Comparison betweenthe Original Scheme and the Changed Scheme of Huxi Village
Chaniged Changed scheme compared with theItem Unit Changed Original scheme original scheme
Add lessen
Length of the km 3.7 3.63 0.07highway
Earth & stone work 10.000m3 48,1 47.2 0.9
Drainage and 25900 26499 599protection of subgrade
Land acquisition mu 339 332 7
Building removed m2 1530 5948 4418
No. of impacted person/household 128/18 533/74 406/56people of resettlement
No. of environmentalimpacted people person/household 396/55 1495/205 1099/150
EP investment I0,0o0yuan 3.2 36.4 33.2
Total investment 10,000yuan 18043.2 17985.62 57.58
The changed scheme has already been adopted by engineering design
3. Liuban, Zhulin sensitive spots
The Original Scheme will pass through Liuban Village and Zhulin Village with a
large volume of resettlement and serious impact on the villagers. Changed Scheme goes
around the Liuban and Zhulin, avoided the impact on the residents. See Figure 5-3 for the
route trend. See Table 5-3-3 for the environmental factor comparison.
139

Table 5-3-3 Environmental Indices Comparison between the OriginalScheme and the Changed Scheme of Liuban Village and Zhulin Village
Changed scheme compared with the
.tem Unit Changed original schemeItem Unit Scheme Onginal scheme
Add lessen
Length of the km 3.1 3.0 0.1
highway
Earth & stone work 10,000m3 66.4 71.5 5.1
Drainage and m3 21210 21920 710
protection of subgrade
Land acquisition mu 273 275 2
Building removed m2 1828 6347 4519
No. of impacted 404/67_ eope of rttleme person/household 43/6 447/73 404/67
people of resettlement
No. of environmental 8person/household 320/45 958/135 638/90
impacted people
EP investment I 0,000yuan 9796.44 9801 J 456
Total investment I 0,000yuan 9822.84 9851.4 | 28.56
The changed scheme has already been adopted by engineering design
4. Gaoshan Village Sensitive SpotThe Original Scheme passes through the middle of the Gaoshan Village. 84
household will have to be removed. If the route line move to the north of the GaoshanVillage (the Alternative Scheme in Figure 5-4), there will be no removal. However thealignment can not satisfied the engmneering standard. Study result shows that theAlternative Scheme is infeasible due to the low standard line shape, which will impactthe safety of running vehicles. So, the designing institute insisted that the original schemebe adopted. The EIA unit suggested that the opinions and requirements from villagersshould be paid attention to, and Original Scheme should be moved considering theunfavorable impact on the village. After discussion among EIA unit, villagers anddesigning unit, agreement is attained that the route of the Original Scheme will be moved50m northwards (the Changed Scheme in Figure 5-4). Then, 25 household will notremove. However, the environmental impact still exists. To mitigate the unfavorable
impact of traffic noise, 160m X 3m and 120m X 3m soundproof screen will be built here.

34 household will be removed, and a crossing passageway will be built under theexpressway for the convenience of the villagers. The changed scheme and EP measuresare all informed to the villagers, who accepted the solving methods. See Figure 5-4 forthe route trend. The comparison of the schemes is shown in Table 5-3-4.
Table 5-34 Environmental Indices Comparison betweenthe Original Scheme and the Alternative Scheme of Gaoshan Village
Altemative scheme compared with
Item Unit Original scheme Alternative the original schemeScheme
Add Lessen
Length of the km 5.0 5.26 0.26highway km_____5 26_0_26
Earth & stone work 10,000m. 116.3 157.8 41.5
Extra-large and large 106/1 106/1
bridges rn/No 1610/
Medium and small Ibriumandgesml m/No. 216.5/4 134/3 82.5/1bridges __________________ __________________
Land acquisition mu 445.8 470 24.2
Building removed m2 4922 4922
No. of resettlement . 4/5impacted people person/household 1 424/59 _ l 424/56
No. of environmentalimpacted people person/household 985/147 985/147
EP investment I 0,000yuan 73.5 73.5
Total investment 10,000yuan 16347.4 17884 1536.6
The Alternative Scheme is infeasible due to the low standard line shape, which will impact the safety of running vehicles.
Based on the discussions among EIA unit, villagers and designing unit, agreement is attained that the route of the Original
Scheme will be moved 50m northwards as the Changed Scheme in Figure 5-4.
The changed scheme has already been adopted by engineering design

- ~~~Changed Scllelc 3
'~~~~~~~~~~~~~~~~~~~~~~~~~~~~~~~~~~~~~~~~~~~~~~~~~~~~~~~~~~~~~~~~J
Origint c5- Jiancuo- .cjafn .lcn;v ...es(:100
I

S ~~Dashi /
/ r<Ž-., Changed Scheme
X~~~~
/ - I-/
.. . c A-
"""IV* ;_ N .... W \ , - ., \ Orig inal Scheme
< Huxi -,-- / '.. 7
Figure5-2 Huxi Alternative Sclhemes (1:10000)
N.; .-~~-- - = A>_z_' ,oS ,
s - -&X r- ' ~ ° ! A
Ch / ~dl,.- I ~~ .Z11
ng O Seme a |m .2 /
Figure 5- 3 Liuban, Zhulin Alternative Schemes (1:10000)

'f)Wo~~~~~~~~~~~~~~~~~~~~~~~, o.q I,9 i
hanged Scerme 4 nnaSic: /_5 F_- 2 j O>
Fi,- 1 ; v (1 0'-0,
Figure 5-4 Gaoshan Alternative Schemes (1:10000)

6 ANALYSIS ON LOSS AND BENEFIT OF ENVIRONMENT
6.1 Economic Benefit Analysis of the Project
Zhangzhou - Zhaoan Expressway is one of the important sections of the national
trunk line (Tongjiang in Heilongjiang Province - Sanya in Hainan Province) located in
Fujian Province with a total length of 140.459 km. Investment of the project is 5054.22
million RMB yuan. Construction period will be 4 years; it will be put into operation in
August 2003.
When the proposed highway is used, the transportation condition will be improved
greatly, traffic volume 'will be increased, the stopping time of vehicles in the way and
transportation mileage will be shortened, Economic benefits is obvious. The benefits to
the whole society can be summarized as follows.
1. The upgrade of the highway will reduce the transportation cost and improve
transport condition.
2. The shortening of the mileage will reduce the cost: transportation cost will be
saved.
3. A large amount of traffic volume will be attracted by the good condition of new
built expressway.
4. The high-grade road will provide a good transport condition, perfect service,
faster speed, which will produce economic benefit from time saving of transportation
vehicles.
5. The cost saved by less accident: the improvement of highway grade will reduce
the chances of accidents, which will reduce economic loss.
6. The mixed traffic on existing highway induces low running speed and extra
transportation cost. The proposed expressway will attract part of the traffic volume, then
the crowding situation will be alleviated on the existing highway. Transportation cost will
be saved by less crowding.
See Table 6-1-1 for the economic benefits.

Table 6-1-1 Statistic of Economic Benefit unit: 10000yuan
Benefit from Saved cost by Benefit from Time saving Benefit from Benefit fromYear upgrading of mileage attraction of for passenger less traffic crowding
highway shortened traffic volume and cargo accidents alleviate
2005 21634.11 4014.71 2913.63 20088.55 579.68 5511.02
2010 32447.45 5981.49 4198.65 43855.17 828.88 7620.46
2020 88194.00 11995.18 11765.21 270111.08 1318.49 32845.08
6.2 Analysis of Economic Sensibility
If the unfavorable situation where the cost rises more than 20%, while the benefit
goes down more than 20% occurs, the gross national economic assessment will be as
follows.
1. Direct Economic Effects
(1) Economic Benefit-cost Ratio (EBCR): 1.16
(2) Economic Net Present Value (ENPV): 578million yuan
(3) Economic Inner Rate of Return (EIRR): 13.31%
(4) Economic repay period (EN): 22.42 years
From the gross national economic assessment, this project is feasible, and it has a
rather strong capability against risks.
2. Indirect Economic Effects
(1) Industrial exploration effects
To promote corporation, improve technical level, and international commerce.
(2) Agricultural exploration effects:
To raise the exportation of high value commodities, expand the market, and form
production base area.
(3) Aquatic production exploration effects
To raise the exportation of high value commodities, expand the market.
(4) Scenery sites exploration effects
To improve the continuation and communication of traveling.
(5) Commercial exploration effects

To promote the commercial economic development and scope, to activate the
national communication, and expand the international commercialism
(6) Market exploration effects
To expand the market scope, to expand the exportation and to promote foreign
exchange transaction
(7) For rationalization and effectiveness of transportation production
(8) For rationalization, effectiveness and . modernization of communication
procession
(9) To alleviate the crowding situation of existing highway, railway and waterway;
For rationalization and effectiveness of traffic system.
(10) To promote the communication between urban and rural areas, which will bring
benefits to the poor remote countryside.
3. Unfavorable results
(1) Communication of residents will be separated by the heightened embankment,
which will induce a lot of inconveniences.
(2) Reduce of farmland and farm crop output.
(3) The environmental problems caused by highway construction, such as the soil
erosion aggravated during construction period; traffic noise during operation period, the
environment pollution by tail gas; environment pollution by wastewater from toll station
and service center, etc.
6.3 Estimation of EP Investment
According to environmental protection measures put forward by this EIA report, the
cost in EP works has been estimated. For the EP measures will be adopted in this project.
See Table 6-3-1. The cost has involved the cost for EP engineering works, staff training,
environmental monitoring during construction period, and link road EP investment, while
it does not include the engineering cost of plantation, sides lope protection, and water
drainage, which has already been listed in the cost of engineering.

Table 6-3-1 Estimated Cost in EP Works
Order EP Measures Calculation method Cost(10O,000yuan)
I Assessment of Envirownental Impact Calculated according to the assessment of Fujian Provincial 37standard
2 Designing of EP engineering Calculated as 2% of engineering investment 90
3 Water spraying vehicles 4 X 150,O00yuan 60
4 Removal of schools 2 X 3,000,000yuan 600
5 Temporary sound proof screen in construction 300yuanim' X 200mat Houdai Prim. Sch, 6
6 Oil-water separator installed on ships 20,000vuan/ship X I Oship 20
7 Septic tanks in construction camps 40 X 50.000yuan 200
8 Garbage disposal in construction camps 40X3,000yuan 12
9 Ventilation fans in tunnels for EP 6X500,000yuan 300
I 0 Sewage disposal for service centers 2 X 900.O0)yuan 180
l Septic tanks at toll station, highway management station 5 x 50,00Oyuan 65and tunnel management station _ _
12 Sound proof screen 700 yuan/nt', 10450m2 371.5
1 3 Heightening of surrounding waall 100yuan/m2 , total 7780m' 77.8
14 Noise proof afforestanon 150,000yuan /site x 29site 145
15 EP staff training 8times, 197 peoples 240 45
16 Environmental monitoring in construction 160,000yuan/year X 3year 48
17 Afforestation near the interchanges 9 places 435
18 Cistems at interchanges I 0,OOOyuan/each X 9
1 9 Borrow sites & rehabilitation 8 places 150of tempomrily used
20 Spoil plants 7 plants 240
21 Rehabilitation of the existing roads after completion of the 100project _ _ _ _ _ _ _ _ _ _ _ _ _ _ _ _ _ _ _ _ _ _ _ _ _ _ _ _ _ _ _
22 Environmental supervision during construction EP, soil erosion, EP constnrction acceptance and accident 60treatment
23 Maintenance of EP facilities 200,000yuan in 10 years 200
24 Road afforestation. side slope protection Has been accounted in the construction costand drainage works
25 Dongyuan link road EP cost See Table 4-7-5 of the EIA for the method of calculation 268.7
26 Huxi link road EP cost See Table 4-7-9 of the EIA for the method of calculation 74
27 Archeological survey and excavation of cultural and 44historical relics________
28 Preservation of cultural and historical relies Construction of bridge, reduction of vibration, excavation I5028 Presetvation of culumal and historical relics and preservation cost
I AC

The total investmnent of the project is 5.054 billion yuan RMB, including 42.6445
million yuan EP investment, which is 1.05% of the total investmnent. The cost of
plantation, resettlement and side slope protection has not been involved. Compare to the
total amount of project investment, the cost of EP works is rather a small part of the
investment. However, when this part of EP investment surely be used for the EP facilities,
the environment problems will be settled once and for all.
6.4 Cost-Benefit Analysis of Environmental Protection InvestmentThe planned highway will have severe adverse effect on the environment in many
ways. During operation of the highway, vehicle exhausts will pollute the atmospheric and
water environment; dust and noise will impact on the environmental quality in residential
areas. The health of people living on both sides of the highway will be affected to some
extent and the normal life and work of these people will be affected as well. Therefore,
practical enviromnental protection measures must be taken, such as sound proof
measures and plantation along the road sections near sensitive spots to reduce the
negative effects caused by traffic on the environment. After taking environmental
protection measures, the economic loss will be retrieved each year (equal to the direct
economic benefit of environmental protection), See Table 6-4-1 for the economic loss
retrieved each year.
The retrieved economic loss is calculated according to the analogical EIA data for
Sanyuan-Tongchuan class 1 highway in Shaanxi Province. The data were provided by
the High Grade Road Management Agency of Shaanxi Province.
Table 6-4-1 Yearly Retrieved Economic loss
EP measures (Yr0000 yuan) Effects of the measures
Water sprinkle during 30 Less compensation for dustconstruction pollution and health care
Wastewater treatment 50 Less water pollution
Less soil erosion, farmlandSpoil sites 40 poetoprotection
Weak geology 150 Less slides, safety protection
Impact on residents and schoolsNoise control 15 is mitigated
Reduction of accidents 36.2 Safety assurance
Maintenance of soil . . . .conservation facilities
Total 341.20

The following formula is used to analyze the economic benefit ratio of
environmental protection measures:
Ei Si'H
Where
E,- economic benefit ratio of environmental protection expenditure
Si -- economic loss that can be retrieved each year after environmental
protection measures are taken
H - expenditure of environmental protection investment per year
The total EP investment of this project is 42.6445 million yuan, during 20 years ofoperation, 2.1322 million yuan annual investment, then the economic benefit forenvironment protection each year is calculated out based the formula above: EL =2.31,
which illustrates that the investment of environment protection is reasonable. Thus, it is
of great importance to execute the environmental protection measures suggested in the
EIA when building the highway. The construction unit should take environmental
protection measures step by step as suggested in the assessment to ensure the coordinate
and sustainable development of construction and environmental protection.

7 ENVIRONMENTAL MANAGEMENT AND MONITORINGPLAN
7.1 Environmental Management Agencies and Their Responsibilities
Diagram of various EP agencies during the construction phase is as shown in Fig.7-1.The functions of the personnel and agencies at different levels during the constructionphase are explained bellow.
1. Fujian Provincial Expressway Construction Directory Office (FPECDO)There will be one deputy commander responsible for the drafting of EP management
plan, its implementation, management and monitoring. His leadership will ensure thefulfillment of all work relevant to EP.
2. ECDO (Expressway Construction Directory Office) of Zhangzhou CityOne deputy commander will direct the EP work, and one environmental engineer
will be in charge of EP management, data monitoring and collection, etc.3. Zhanzhou ECDO and other CDO (Construction Directory Office)In each CDO there will be one deputy commander directing the EP work, and one
environmental engineer guiding environmental supervising and monitoring work at eachsection of the project and directly dealing with the routine work.
4. Each SectionIn each section, one environmental engineer will oversee the EP supervision work,
construction noise and dust reduction monitoring work. Hie is to ensure theimplementation of the construction bidding documentation and EP measure in the EPaction plan.
7.2 EP Agencies and Their Functions During Operation PhaseDiagram of various EP agencies during the operation phase is as shown in Fig. 7-2.
The functions of the personnel and agencies at different levels during the operation phaseare summarized bellows.
1. EP Office of FPECDOIt is to guide the EP management and to draft monitoring plan, regulations and rules
for highway EP, etc, its implementation, management and monitoring. His leadership willensure the fulfillment of all such work.
2. Zhangzhou Expressway Corporation Ltd.One deputy general manager and one environmental engineer will be responsible for
EP work in Zhangzhou Expressway Corporation Ltd., under which will be two offices. Ineach office, one environmental engineer will be in charge of EP work.

Fujian Provincial Expressway Construction
Directory Office (FPECDO)
Environmental Protection Office (3 persons)
(I direcor and 2 clerks)
Environmental Monitoring Zhangzliou-Zhaoan Expressway CDO Environmental Monitoring
Station of Fujian Province, and One deputy commander will direct EP work, and one Station of Fujian Province, and
Environmental Monitoring environmental engincer will be in charge of the concrete EP work Environmental Monitoring
Station of ZhangZhou City Station of ZhangZhou City
Baishui Large Bridge CDO CDO of Huxi-Chiling CDO of ZhangZhou--l-luaan
One cnvironmcntal engineer Section in Zhangpu County Section
will be in charge of EP work. One environmental enginecr One environmental engiicer
will be in charge of EP work. will be in chatge of EP work.
* There will are 9 sections for the main expressway
F_ , § 1and 2 sections for the link roads.Baishui Large Bridge | Huxi-Chiling Highway No.l No. * CDO stands for Construction Directory Office.
Note: For each section along the Zhangzhou-Zhaoan Expressway and sub-project
there will be one engineer in charge of EP and supervision work.
Figure 7-1 Diagram of EP and Management Agencies during Construction Period

Fujan Provincial Expressway CDOEP Office (3 persons)
(I director, 2 clerks)
.~~. ................................... .......................... ................................................. .....Fujian Provincial Existing Expressway CDO
Zhangzhao-Zhaoan Expressway Corporation Ltd. Expressway Corporation Ltd. ofOne deputy general manager will direct the EP work. and 1 uzhoii-Qtuanihou, Quanzhou-Xiamen or Xiamen-Zhangzhouone environmental engineer bc in charge of concrete EP work One deputy general manager will direct the EP work. and
one environmental engineer be in charge of concrete EP work
Zhanzhao Office Yuxiao OfficeEach office of the above Corporations Ltd.
one environmental engineer one envircinmental engineerl . ~~~~~~~~~~~~~~~~~~~~~~~~onc environinictital engiincer be in cliarge of EP workwill be in charge of EP work will be in charge of EP work c e
Longhai-Zhangpu section Yunxiao--Zhaoan section Road sections under each office
for the proposed project * CDO stands for Construction Directory Office.................... . ........... g........... e..............o............ ......................
Fig. 7-2 Diagram of EP and Maiiagement Agencies during Operational Period

7.3 Major Issues in Environmental Protection Management PlanSee Table 7-1 for the major issues considered in management plan of EP.
Table 7-1 Environmental Protection Management Plan
Environment . Cost Implementation Responsible Clause No.Issue Measures (Locations & Amounts) (10,000 yuan) time entity in Contract
A.Designingperiod
I.Comparison I.The designing unit has put forward Has been Engineering Designingof alignment two major alignment schemes for listed in the feasibility unitschemes comparison cost of study period
2.Alternaiive schemes for three parts of engineeringroad sections has been put forward forthe recommended scheme.3.Based on the major issue putforwarded by EIA, scheme comparisonshave been done for 38 sznsitive spots.4. At the start point, the first 4-km of thehigh embankment has been changed toviaduct. 144mu cultivated land has beenreserved.
2.1mpact on I.Altogether 292 passages have been Has been Engineering Designingpublic mass designed for convenience of people, listed in the feasibility unit
animals and tractors. cost of study periodengineering
3.Soil erosion l.ln designing, fully utilizing the Has been Engineering Designingsituations of the land feature to balance listed in the feasibility unitthe cuttings and fillings. cost of study period2.Protection, drainage and sides lope engineeringplantation works should be carefullydesigned.3. The 7 Spoil sites and 8 borrow siteswill be carefully chosen in designing.
4.Flood I.Fully considered the drainage of food Has been Engineering Designingprevention water in designing of bridges and listed in the feasibility unit
culverts. cost of study periodengineering

Continuation of Table 7-1
Environment . Cost Implementation Responsible Clause No.
Issue (10,000 yuan) time entity in Contract
B.Constructionperiod
I.Land I1580mu cultivated land, Has been Before Expressway
acquisition 4602mu uncultivated land, listed in the construction CDO
31 00mu temporary land taken cost of & local
I.At the start point, changing from high Resettlement governments
embankment to viaduct reserved 144mu
cultivated land.
2.Organizations for land acquisition and
resettlement will be strengthened
3.Surplus labor will be arranged during
construction phase;
4.Compensation will be made accordingto regulations. _ _ l
2.Soil erosion I.Pipe culverts will be built before | 70+ 30 During construction
(During subgrade construction; Has been construction of unit
construction 2. 7 spoil sites and 8 borrow sites will be listed in the embankment
period the soil chosen, which will be designed according cost of
erosion situation to the regulation. engineering
is 5.211 times 3.There are 66 places of mortar bound
of that before the protection of slopes, altogether 186080
construction) m2
4. Interception ditches built for slope
protection will be 40884m
5.Reducing earth borrow and spoil by the
adjust of earth and stone works for the
nearby road sections in the construction
6. In time recovery of afforestation
3.Embankment Altogether 445 culverts and 71 middle or Has been Pipe culverts construction
biocked natural small bridges on the whoie line iisted in the wiii be built unit
runoff cost of prior to the
engineering subgrade
construction
4.Construction 1. Four sprayer vehicles purchased, each 60 Construction ECDO of 201.04.
dust construction site provided with a portable phase Zhangzhao 201.05sprayer, times of water sprinkling Expressway,
everyday will be decided by the construction
supervisor; units
2. Material transport vehicles will be
covered by mufflers;
5. Asphalt fumes 1. Integral asphalt concrete mixers Arranging by During construction 307.05purchased; the construction of unit
2.Mixers shall be located 300m construction pavement
downwind of residential areas. unit
152 -

Continuation of Table 7-1Environment [ Cost Implementation Responsible Clause No.
Issue (10,000 yuan) time entity in contract6.Construction 1. No construction work will be allowed Construction Construction 102.13noise between 22:00-6:00 for residential sites phase unit
within 150m.
2. The workers will be take in turn whenwork in a high noise condition
3. Temporary soundproof screen 100 X 6
2m will be set at Houdai Prim. Sch.
4. Jizai Prim. Sch, Shudong Prim. Sch, 600
will be removed.
7.Sewage and 1. 40 septic tanks will be built at 200 Construction construction 103.01wastes disposal construction camps, phase unit 205.10of construction 2. 40 garbage collecting station will be 12camp set for domestic garbage;
3. Sewage will be discharge of aftertreatment
8.River 1. Cofferdams and drop shaft sinking 20 construction construction 102.13pollution by methods should be used during pier phase unitbridge construction;
construction 2. Oil-water separators to be installed on
construction ships;
3. No asphalt, fuel and chemicals wvill be. allowed to be piled near rivers
9. Removal Altogether 70097m2 house wvill be Has been Before ECDO ofdemolished, including 2 primary school listed in the construction Zhangzhao
1. Compensation will be given to the cost of Expressway,removal family according to the policy; engineering Local2. Land owning to build new house will government
be authorized by the local government
1 0.Recovery of I. Altogether 515 .27mu plantation area in Has been After pavement Constructionvegetation the middle separation belt of the listed in the construction unit
expressway: cost of
2. Plantation of 8412.6mu along both engineering
sides of the expressway
3. 1 080mu plantation at interchanges;4. 46.2mu plantation at toll stations and
service centers;
5. 215mu plantation at the entrance and
exit of tunnels.
11 .Cultural and 1. A bridge is to be built, and measures to 150 Construction Subgrade Construction
historical relics reduce vibration be taken to preserve period construction unit
the Fenglingwei Hui Temple.2. Rescuine archeological excavation will
be carried.3. Cultural and historical relics will be
preserved propery.
153

Continuation of Table 7-1Environment | Cost Implementation Responsible Clause No.
Issue Measures (Locations & Acounts) (10,000 yuan) time entity in contract
C.Operationperiod
I.Air pollution I.Lead free oil shall be used at extend 300 Operation Zhangzhao 201.05exceeding possibility phase Expressway 502.03standard during 2.Trees shall be planted by nearby enterprises: Corporationoperation 3.Automobiles will be modernized and Ltd. &
inspected for the waste gas discharged; Construction4. There are 20 ventilators will be installed in unitproper locations in tunnels.5. 50% of the ventilation fans should be keptoperating routinely during machineinspection.
2.Traffic noise 1. 27 villages and 2 schools will be removed; During Zhangzhaoduring 2. Altogether 22 places of soundproof screens 371.5 construction Expresswayoperation phase with total area of 10450 m2 will be built; phase Corporation
3. 7780 m2 surrounding walls of 18 villages 77.8 Ltd. &and schools will be heightened; Construction4. 27 places of soundproof afforestation will 145 j unitbe adopted.5. New houses along the proposed highwayshould be built 150m beyond;
3.Domestic 1. The 2 service centers including Jiuzhen and IS0 trial operation construction 1103.01sewage and Changshan will each set up a Class2 waste phase unitproduction water disposal station. 65waste water of 2.Toll stations anid tunnel managementservice zone stations will set up septic tanks.
3. Oil separation pond will be set at gasstations and vehicle washing plants. Vehiclewashing water will be recycled. _
4.Pavement 1. Pavement runoff should not be discharged construction Eachrainfall runoff directly into rivers or fish ponds but should be phase management
led to other places along the side ditches. office2. Careful attention will be paid to theprotection of water quality in 'Y'angmeiReservoir.
5.Wild animal L.Poaching is prohibited around the construction constructionprotection construction camp; phase unit
2.Whenever found protective animals andplants, safety removal measures will beadopted.
6.Traffic I.ln poor visibility weathers, driving speed operation phase Eachaccidents shall be limited or temporarily close the road; management
2. To Strengthen the management of tunnels officeto prevent fire and traffic accidents;3. Two power supply sources will be providedin tunnels. 50% of the ventilation fans shouldbe kept operating routinely during machineinspection.
154

Continuation of Table 7-1
Cost Implementation Responsible Clause No.Environment Issue Measures (Locations & Amounts) (1,0 yun) eme entity i Contract(I l ,000 yuan) time entity in Contract
D. Link Roads
Dongyuan-
Fugong
Link RoadI .Domestic One septic tank at toll station, 3 septic 30 Construction Constructionsewage treatment tank for the construction camps phase unit2.Domestic One toll station, 3 construction camps 2.2 Construction Constructiongarbage disposal each with a garbage collecting spot. phase unit3.Passages 11 passages 165 Construction Construction
phase unit4.Oil-water 9 separators will be installed for 16 Construction Constructionseparator construction ships phase unit5.Settlement 3 ponds 4.5 Construction Constructionponds at phase unitconstruction sites6.'Aaming signs 16 places 1.0 Construction Dittoof passageway phase7.Dust prevention 3 simple Xwater sprayer vehicles 6 Construction Dittoby water spraying phaseat construction
sites8.Drainage system 4 set of drainage systems 20 Construction Dittoat interchanges phase9.Sound proof Sound proof screen at Dongyuan Mid. 24 Construction Dittoscreen Sch. phase1 0.Sound proof 6 places 6 Construction Dittoplantation phase
Subtotal 261.70Huxi(Zhaojiabao) Analogously calculated as 1/2 of the cost 130.85 Construction Headquarter
for Dongyuan-Fugong Link Road phase at Longhai,Fuotan Link Road Construction
unit
Total 3449.95

7.4 Environmental Protection Supervision Plan
To insure the quality of EP works, EP supervision plan is made for this project, see
Table 7-2.
Table 7-2 Environmental Protection Supervision Plan
Stage Agency Work content Purpose
EA -1 NEPB LExamine the EIA outline. I.To ensure the EIA content has a fullyFPEPB 2.Examine the EIA report. covered topic arrangement, with key points
< WB 3.Examine the EP action plan. highlighted.2.To ensure the possible serious problems of
co the project to be addressed properly.3.To ensure the feasibility of action plan.
t NEPB I.Examine preliminary design for I.To carry out the " ThreeFPEPB environment protection & EAP. Simultaneousness" policy and EAP.
cEPB of city or county'S EPB t3 or ty 2.To examine the realization of cost for 2.To ensure investment for environmental
environmental protection protection.=
3.To check material handling, asphalt and 3.To make sure the work site meet theconcrete mixing plant arrangement. requirements of environmental protection.
4.To check dust & noise control measures 4.To reduce the impact. To ensure the& work time schedule. implementation of regulations
5.To check the storage & emission of l 5.To reduce the impact on the surrounding &poisonous or harmful material. to implement the regulations
6.To check discharge & disposal of 6.To make sure surface water not to bewastewater or waste oil. polluted.
7.Cutting & borrowing site. spoils 7.To make sure the landscape & the landdisposal, soil erosion, blocking of resources being preserved & resumed.drainage system & rivers.
8.To check the implementation of "Three 8.To make sure the implementation of EPsimultaneous" policy & EPA , to perfect policies.the implementation work.
9.To examine the environmental 9.To make sure the environmental protectionprotection facilities. facilities meet the acceptance level.
Provincial Historical lO.To check if there are any historical IO.To protect historical relics.Relics Bureau relics.
FPEPB I.Check the implementation of EPA. I.To ensure realization of EPA.n EPB of city or county 2.Check the implementation of 2.To ensure realization of monitoring plan.
monitoring plan. 3.To - ensure consideration of various3.Inspect the sensitive spots to find environmental problems.environmental problems. 4.Strengthen environmental management, to4.1nspect the environment of sensitive protect health of people.regions based on the standard. 5.To ensure wastewater discharged meet the5.Check waste water and garbage discharge standard.disposal in toll station, service centers, 6.To eliminate the causes of accident inand management zones. traffic to avoid pollution accident6.Strengthen accident management andmonitoring system, set up emergencyaction plan for emergencies and toprevent pollution from spreading onceaccident happens.
1<K

7.5 Environmental Protection Staff Training
Plan of EP staff training for Zhangzhou-Zhaoan Expressway, and the other road
projects including the two link roads (Dongyun-Fugong and Huxi-Fuotan) and
LonghaiBaishui Bridge, is drawn up (in Table 7-3).
Table 7-3 EP Staff Training Plan
Training Number of Duration Cost
style Stage & place Personnel Attended People (days) I 0000yuan / S
Year 2000 FPCD, FPECDO, FPCPDI. 8 21 39.61 / 47600
Abroad Expressway Directory Office of
Year 2003 Zhangzhou City 6 26 29.64 /35700
Year 1999 FPCD, FPECDO, CDO of city orConstruction county. CDO of every road section, b 60 5 90
(Zhangzhou City) supervision engineers
Year 2000FPCD, every, level of CDO, leaders 2022
Construction from EP Bureau of city or county | l(Zhangzhou City)
In the Year 2001 Supervision engineers of every road 30 3 27country Construction section 3
(Zhangzhou City) _ _
FPCD, FPECDO, CDO of city orYearu2to2 county, CDO of every road section, 20 3 18
CZhagzhonrucitin supervision engineers, EP Bureau of(Zhangzhou City) city or county
Year 2003 Whole staff of the environmental 12 7 25.2
Operation monitoring station of FPCD
Total 240.45
Note: I. Training content of abroad will include EP & EIA for Highway construction, environmental management during
construction and operation phases.2. The training fee in the year 2000 will come from Fujian Highway Project I and the trainees will mainly consist of
those from Zhanzhao-Zhaoan Expressway Project.
Note: FPCD------ Fujian Provincial Communication DepartmentFPCPDI---- Fujian Provincial Communication Planning & Designing Institute
FPECDO- Fujian Provincial Expressway Construction Directory Office

7.6 Environmental Monitoring Plan
7.6.1 Environmental Monitoring Plan in Construction Phase
Environmental monitoring plan in construction phase for Zhangzhou-Zhaoan
Expressway, and the two link roads (Dongyun-Fugong and Huxi-Fuotan) is drawn up
(see Table 7-4).
Table 7-4 Environmental Monitoring Plan during Construction
Items Monitoring Spots Frequency Monitoring entity Supervisor
Spots will be set
based on the reality,
i.g asphalt plants,
unpaved roadonce every month, I
1. Air environment sections, lime mixing days every time.. Ad Entrusted monitoring Zhangzhao ECDO
quality. TSP, asphalt plants, and simple hoc will also be stationsfumes hauling roads. a& local EP bureau
2 spots in Longhai;
4 spots in Zhangpu;3 spots in Yunxiao;
3 spots in Zhaoan
Spots will be located
at villages & schools
within I 50m from
the road, and at monthly, nighttime Entrusted monitoring Zhangzhao ECDO2. Noise quarry, or in the & daytlime stations & local EP bureau
residential areas near
the hauling roads,
as required.
Monitoring and
sampling spots will
be located at the
down stream side of
the bridges, such as
(1)CODea Xinyu river section once every 3 months, Entrusted monitoring(2)COil,, of Nanxi 2 days every time, Ditto
Yangmei Reservoir am. & p.m. a day(3)SS Jiuzhen Port
Chuanchang river
section of
Zhangjiang River
Zhaoanwan Port
4.Others construction sites, Owner(I )domestic garbage spoil plants, borrow CDO of Expressway supervision
(2)spoil sites and Once every 15 days road sections engineer and local
(3)soil erosion prefabrication plant EP bureau
(4)plantation for the bridges
158

7.6.2 Environmental Monitoring Plan in Operation Phase
Environmental monitoring plan in operation phase for Zhangzhou-Zhaoan
Expressway, and the two link roads (Dongyun-Fugong and Huxi-Fuotan) is made (see
Table 7-5).
Table 7-5 Environmental Monitoring Plan during Operation
Items Spots Frequency Monitoring entity Supervisor
I.Atmosphere twice one vear in(I)CO Xinzhong, Cili, lan. & July, Environmental Expressway Co. Ltd.,(2)NOx Guanyinting, Xishan monitoring 3 days monitoring stations local EP bureau
(3)TSP one time of expressway
Baishui Mid. Sch., Huxi. 4 times in one year,
Jiuzhen Port, Gaoshan, Idays each time with Environmental2. Traffic noise Andou Prim, Sch., double monitoring in monitoring stations ExpresswayCo. Ltd.,
Guanyinting, Lintou, davtime and of expressway
Waifenglou nighttime ___ _
3.Surface water Xinyu river section of | twice one year in3.Surface )pH er Nanxi Jan. & July, single(])pHDM Yangmei Reservoir monitoring in Environmental(2)CODf Jiuzhen Port continuous 3 days as monitoring stations Expressway Co. Ltd.,
(4) Oil Chuanchang river section one time, double of expressway(4) Oil of Zhangiiang River monitoring in each
Zhaoanwan Port day
7.6.3 Equipment, Expenditure, and Reporting of Monitoring
The owner has entrusted the environmental monitoring work in construction period
of this project to the local environmental monitoring stations. The environmental
monitoring station of expressway will carry on the monitoring work in operation period.
The monitoring equipment can be share with Fuzhou-Xiamen Expressway. The cost for
monitoring in construction period will be 160,000 yuan/yearX 3 year =480,000 yuan.
The cost for monitoring in operation period will be 100,000 yuan/year. See Figure 7-2 for
the reporting regulation of monitoring

NEPB EP office of MOC WB
FPEPB EP Office of FPCD
FPECDO
(Construction period)Fujian Provincial Expressway Co. Ltd
(Operatiorn period)
| EPB of M Nanagem.ent station of Toad sectionscounty or city Management parties of tunnels
Figure 7-3 Monitoring Reporting Procedure

8 PUBLIC PARTICIPATION
8.1 Early Stage of the Project
The proposed expressway has a total length of 140.459 km, total investment4952million yuan, 4 years of construction period (June 1999-May 2003). The populationaffected within 200m on both sides will be 0.0472 million.
The proposed highway will pass through the whole administrative area ofZhangzhou City, including Longhai City, Zhangpu County, Yunxiao County, and ZhaoanCounty. The effected areas have covered the 4 cities and counties above. Economicdevelopment of these areas will be greatly promoted by the construction of this project.
In order to protect the interest of local people and residential environment, differentkinds of opinions were solicited among public masses and officers. Investigation andsuggestion acquisition has been done by construction unit and EIA unit.
1. "Inspection Meeting for Planning Scheme of Zhangzhou-Zhaoan Expressway"organized by Fujian Provincial Planning Committee in 1993.
2."Pre-feasibility Study Report of Zhangzhou-Zhaoan Expressway " was putforward by Fujiang Communications Planning and Design Institute in 1993.
3."Prefeasibility Study Report of Zhangzhou-Zhaoan Expressway " was inspectedby Fujiang Provincial Planning Committee in 19934.
4. In December 1996 and October 1997, Pre-feasibility Study Report has beenrevised and amended respectively.
5. In September 1997, the pre authorization of this highway project was made.In the procession of the early stage work of this project, the FPECDO, Fujiang
Communications Planning and Design Institute carried out on-the-spot survey andstudies for the route alignment, positions of interchanges. Innovation was made severaltimes according to the suggestions from public masses and local govermnent agencies.
6. In October 1997, assisted by the Fujiang Communications Planning and DesignInstitute, the EIA working team from Xian Transportation University did On-the-spotinvestigation along the whole line of the proposed highway. The EIA Outline wascompiled then, and the authorization of NEPB (see appendix II for the reply from
NEPB) was obtained.7. In March 1998, the Environmental Monitoring Station of Zhangzhou City carried
out the present environmental quality monitoring for air, soil, noise, surface water.
8.2 Investigation Subjects and Way of ParticipationPublic participation is one of the most important parts in determination of the proper

alignment scheme. Opinions from affected masses and enterprises should be paid fullattention to, and the benefits of them should be considered substantially. Theinvestigation and consultation work such as visiting, discussion, meetings, mailcontacting, especially the random collection of questionnaires along the proposedhighway. There are 441 forms of questionnaires spread to private persons, units andgovernment agencies with 388 forms returned.
The investigation subjects are:
(DDivisions of EP, Agriculture, Water conservancy, soil conservation and planning, and governments of different levels were consulted;
(9)Opinions from ordinary masses were collected;
(U)Opinions from experts and enterprises were solicited;
QOpinions from households to be removed were sought in particular.
8.3 Examples of Typical Consultations and Hearings1. Consult Meeting at Zhangpu County
On October 28, 1997, vice-magistrate of Zhangpu County (Mr. Chen Liming )presided over the consult meeting in the meeting room in Zhangpu Hotel. Theparticipants are listed in Table 8-3-1. There were aliogether 17 persons, belonging to 11different units.
First, vice-magistrate of Zhangpu County (Mr. Chen Liming) explained andspecified the purpose of the meeting, the importance of the project, the arrangement ofthe meeting as expression of suggestions to the alignment, the promotion to economy,and unfavorable impact on the lives of local residents, etc.
Mr. Qiu Qiumu: 68km of this expressway, almost half of its total length, is in ourZhangpu County. We hope that it should not only passed through and closed. Ainterchange should be add between Longhai and Jiuzhen, because there are two minoritytownships in this section, which locate in mountain areas, convenience should be provided for their communication, then the expressway may bring many favorable economicdeveloping chances for the minority villages.
Mr. Cai Heping: The decision that construction of Chiling Interchange will beconsidered later is not rational. The Gulei Port is developing fast recent year, which is thelargest glass sand producing base in China, the traffic volume will be increased in a highspeed, so we should prepare and wait, but should be considered immediately. XiaZhaiPort is also important, with 7000mu developing zone, and the planning of industrial zoneall need the operation of the proposed expressway.
Mr. Gup Kezai; The alignment of the proposed highway is rather clear now, but thepublic concemed still do not know in detail of the specific alignment, land taken,resettlement, etc. Propaganda and publicity should be done more actively to own the
162

assistant and understand of ordinary people.Mr. Zengrongbin: To the land acquired and house removed residents, economic
compensations should be given according to the local policy and the quality of
demolished house. Resettlement should be done in time, and extra economic difficulties
brought to the residents by this project should be considered.
Record and video of the meeting was made by the EIA unit, summary was written.
The collected suggestion and opinions have been informed to construction unit.
Table 8-1 Participants in the Consult Meeting of Zhangpu County
Name Unit belong to Position Contact phone code
Chen Liming Govemment of Zhangpu County Vice- magistrate 3221837
Guo Kezai National People's Congress office of Director 3221037Zhangpu County __ ________ ___
Lin Wanfu Government office of Zhangpu Vice-director 3221032County
Qiu Qiumu Communiaction Bureau of Zhangpu Head of Bureau 3221172Countv
Hong Qiushan Land Planning Bureau of Zhangpu Head of Dept. 3221552County Dept. 3221552
Chen Songhua Land Planning Bureau of Zhargpu Head of Bureau 3222273County
Cai Heping Planning Bureau of Zhangpu County Head of Bureau 3221035
Zeng Rongbin Consultative Conference of Head of Bureau 3221082Zhangpu County H
Zhuang Yashan Planning office of Zhangpu County Director 3221253
Zhen Xiaolu Expressway Office of Zhangzhou DirectorC ity _ _ _ _ _ _ _ _ _ _ _ _ _ _
Fujian Communication Plan andSu Ruitong Deig Inttt EngineerDesign Institute
Xie Weidong EP Institute of Zhangzhou City Engineer
Cao Shencun Xian Highway Transportation Univ. EIA team member
Zhao Aiqi Xian Highway Transportation Univ. EIA team member
Liu Yingling Xian Highway Transportation Univ. EIA team member
Shang Lian Xian Highway Transportation Univ. EIA team member
Zhao Meixin Xian Highway Transportation Univ. EIA team member

2. Public consultation and hearings at sensitive spots
For the purpose of hearing and collecting public opinions from the impacted areas
along the proposed highway, especially from the removing households, EIA working
team and Expressway Headquarter of Zhangzhou City had held consultation meeting and
hearings with villagers, students and teachers at Qiuzhong, Neixi, Jiangcuo, Hekeng,
Houdai, Liugaowei, Xiagao, Gaoshan, Putou, Chuanchang, Tianpuyu, Changmaolin,
Shangyingcun, Zhangqian Prim. Sch., Gaolin Mid. Sch., Shaxi Mid. Sch., Tulou Prim.
Sch., Jizai Prim. Sch., Shudong Prim. Sch.. etc. , altogether 19 sensitive spots from Dec.
16 to Dec. 22, 1998. There were 195 participants with different sex, age and education
level. For examples, see Table 8-2 and 8-3 for the registration list at the meetings.
Table 8-2 Hearing Participants at Neixi VillageName Sex |Age Education Signature
Qiu Ximing Male 38 | Primary schoolSu Jin Female 44 Junior middle school Refer to the
Zeng Wanzhu Male 44 Junior middle school original record
Huang Qinghe Male 37 j High school
Table 8-3 Hearing Participants at Gaoshan Villae e
Name Sex Age Education SigDature
Huang Sanjiang Male 55 Primary school
Huang Tianmao Male 60 Primary school 1Huang Laoxi Male 37 High school
Li Sancai Male 61 Primary school original record
Li Zaorui Female 33 Primary school
8.4 Statistic Results of Public Participation and Opinion Treatment1. The statistical results of public participation
See Table 8-4 for the results, which shows that
Among the investigated people, 94% of the public had understood the highway
project to some extent, others understood the route alignment and the project through our
investigation and introduction;
51% of the public believe the current transport condition is not satisfactory;
60% of the public believe the construction and operation of this project will bring
unfavorable impacts to the life of residents;
100% of the people hoped to be resettled in their original villages;
45% of the people believe the expressway will bring about favorable conditions to

the economic development of local areas.
61% of the public agree to the alignment of the Recommended Scheme;
86% of the public hope that the expressway be constructed as soon as possible.
Table 8-4-3 Statistics of Public Suggestions about the Proposed Project
Content of Investigation Choice Number of People
Much 2 1Understanding extent of the A little 73
highway No 6
Satisfaction degree of the present Quite satisfied 9traffic situation Basically satisfied 40
Not satisfied 551
Unfavorable impact on residential & Great 60living environment No idea 7
Expect to be resettled 100in their own vi'ilagc
Attitude to removal & resettlement Ee toeir esettledagExpect to be resettled
in the other village
Relation between the highway Favorable 45construction and local economic Unfavorable 35
development No idea 20
Yes 61Whether agree to the route No 17
alignment No idea 22
Start as soon as possible 86Attitude to this project Postpone the work 14
Cancel
Date of investigation October 1997
Site location of investigation Zhangzhou City, Longhai City, Zhangpu County,Yunxiao County, Zhaoan County
441 forms of questionnaire spread 388 were collected. Consultations andhearings held a t sensitive spots. The investigated persons are local residentsincluding workers, teachers. cadres, and farmers, also representatives of people
Situations and conditions of the and government agencies. Education levels among them include universityinvestigated objects graduated level, university under graduated or high school graduated level,
middle school level, and primary school. Most part of the people are localfarmers, especially the removing houscholds, students and teachers ofremoving schools along the proposed highway.

2. Public Opinion
Public opinions are collected and organized as follows:
(1) Local farmers generally demanded that land acquirement should be as less as
possible. For example, at Dongyuan and Neixi, the farmers agree that the highway
project will be beneficial to the local economy, but feel regret to the land occupied intheir village, which all belongs to the Class I protected farm land.
(2) The leaders of Zhangpu County demanded that a interchange be set up between
Longhai and Jiuzhen. It will bring benefits to, the communication and economic
development of the two towns at Chiling and Huxi.
(3) The public strongly demand that economic compensation for land acquisition &
removal should be strictly based on the regulations of polices, the compensation be paid
practically, no other usage or interception of it is permitted. Works of this part for public
or individuals should be done carefully and considerately, for it is critical for highway
construction.
(4) Villagers in Gaoshan Village and several other villages demanded passageways
should be built near the village for their convenience.
(5) EIA working team had explained the to the villagers of the sensitive spots such
as Qiuzhong, Neixi, Jiamgcuo, Putoi, etc. that sound proof wall will have to be built at
their villages. The mass shown an attitude of understanding, while they strongly
demanded that the sound proof wall be built simultaneously with the expressway.
(6) During authorization of EIA report, environmental experts suggested that the
service center set near Yangmei Reservoir would induce water pollution.
(7) The removing households hold diverse opinions. People with new house worry
about the compensation may not be enough. However people living in old houses hope to
remove as soon as possible, then they can build new houses with the compensation.
(8) The mass along the proposed highway had known the information of this project
three years ago. They hope the construction of this project start as soon as possible. Then
the local farmers can arrange the positions of their new house and business.
3. Treatments of Public Opinion
Through the consultations and hearings, the EIA working team had explained and
shown the mass the information of this project, instructed the alignments of the highway,
the possible impacts on their environment and solving methods. We collected and
organized the public opinions, then informed FPECDO and FPCPDI. Most of the
problems have been solved as follows.(1) The service center originally set near Yangmei Reservoir has been moved to
Heken, which is 5km away to the reservoir. The impact on the water quality has been
avoided.(2) There are altogether 3 interchanges on the road section between Longhai and
Jiuzhen (44km). No more interchanges can be add on this road section based on the

requirement of engineering designing. Local people have accepted the explanation, andshown an attitude of understanding.
(3) After discussion and consultation, the designing institute has changed thealignmnents at following sensitive spots: Cuozai, Jiangcuo, Xinyu, Xinhe, Neijiafang,Baishui Mid. Sch., Huxi, Liuban, Zhulin, Tulou. (See Chapter I for the alternativeschemes).
(4) Considereing the suggestions from farmers of Neixi and Dongyuan, thedesigning institute have changed the 4km of high etnbankment road section to viaduct sothat 144 mu cultivated land can be preserved.
(5) EIA working team had explained the to the villagers of Gaoshan that the routecannot make a detour at their village, but a 3m high, 1 50m long sound proof wall will bebuilt at both sides of the expressway, and passageways will be built for the convenienceof the local people. The villagers shown an attitude of understanding, while theydemanded the passageways and sound proof wall be built.
(6) The farmers at sensitive spots as Hekeng, Houdai, Xiagao, and Chuanchang hadshown a warm and welcome attitude to the expressway. They believe it will be beneficialand convenient for them to transport their vegetables, flowers, and fruits to otherprovinces or abroad. They are now unsatisfied to the low prices selling at local areas.
(7) EIA working team has informed the owner of the public opinions demandingmore interchanges and passageways and their specific position. It also informed theresettlement office of the public opinion that the economic compensation for landacquisition & removal should be strictly based on the regulations of polices, to ensure thecompensation be paid practically, no other usage or interception is permitted.

9 CONCLUSIONS
9.1 Alignment Scheme SelectionIn the pre-feasibility study report of engineering, there are two alignment schemes,
i.e., west-line scheme and east-line scheme. The west-line scheme is abandoned during
the pre-feasibility study period. In the east-line scheme, there are still two sections of
comparative schemes, one is the three kinds of alignment schemes for Longhai-Zhangpu
section ( outer line, inner line, and middle line); another is the two schemes of the section
in Yunxiao County (outer line, inner line).
Considering the synthetic demands of environmental impact element, technical
specifications, and economic indices, the assessment results show that the engineering
recommended scheme is the most reasonable one. However, to meet the demanding of
public opinions, the alignment of some road sections has been changed after consultationand discussion among the EIA working team, owner, and the designing unit. For
example:
(1) Considered the suggestions from farmers of Neixi and Dongyuan asking for less
land acquirement, the designing institute has changed the 4km long of high embankment
road section at the start point to viaduct, 144 mu cultivated land is preserved.
(2) The service center originally set near Yangmei Reservoir has been moved far
away. The impact on the water quality has been avoided.
9.2 EIA on Ecological Environment1. Five monitoring spots have been set for the assessment of lead content in soil
along the proposed highway. As the monitoring result shown, the lead content in 5 soil
samples is between 24.5-34.6 mg/kg, which is far more less than the assessment
limitation (300mg/kg), and near to the back ground level of Fujian Province (geometric
average 36.4 mg/kg ). Therefore, soil along the proposed highway has not been seriously
polluted by lead dust yet.Analogous analysis has been done for lead content in crops and fruits. It can be seen
that for coarse rice, yam, taro, orange and tangerine, all of their lead content has not
exceed the standard.2. Based on the prediction, after the highway is put into operation, the lead dust will
be accumulated continuously because of the increased traffic volumes, thus leading to
increased lead content and decreased of lead capacity. The background value of lead
content at present at Xinzhong, for example, is 26.8 mg/kg. In 2010, the 7th year of
operation, however, the lead content will come up to 36.62 mg/kg. While in 2020, theamount will be as high as 47.75 mg/kg, which is far less than the assessment standard
300mg/kg. The increase of lead content year after year in soil, or the decrease of lead

capacity in soil, is caused by the pollution of the lead particulate from the vehicular
exhaust pipes. However, beginning from Jan. 2000, only lead free oil can be use in our
country, the exhausted gas from traffic vehicles will not cause lead pollution to the
environment.
3. The permanent acquired land by construction of this project is 11385 mu, which
will induce 20.2926 million yuan worth of annual loss on grain production, 2608mu
orchard acquired will induce 52.16 million yuan annual loss; 195 mu fishpond acquired
induce 5.85 million yuan annual loss.
4. In this EIA assessment, the total area of plantation for road side, separation,
service center, interchange, and both sides of the road is 10269.07 mu, which is 53.25%
of the engineering land occupation.
5. In the rather long period of construction. a large amount of earth and stone works
may cause the deterioration of vegetation, and make worse the situation of soil erosion.
It is predicted that the soil erosion volume will be 5.211 times of that before the
construction of this project. To mitigate the situation of soil erosion, this EIA statement
put forward the measures as 66 places of large area slope protection, 7 chosen spots of
spoil plants, 10269.07 mu total area of plantation along the road, which is 53.25% of the
engineering land occupation.
9.3 EIA on Social Environment
1. Construction of this project will improve the investment environment of local
areas, it will surely promote the regional economic development.
2. In the assessment scope within 200 m along the proposed highway, there are 65
villages, 14 schools, and 1 hospital. Altogether 20858 m2 of concrete brick mixed house;
41161 m2 of brick, wood and stone house; 2126 m2 of simple constructed house will be
demolished. Although economic compensation will be given to the resettled families,
there is still a lot of inconvenience brought to the residents.
3. To minimize the adverse impact on residents by the separation of highway,
altogether 9 interchanges, 79 grade separations and 292 underpasses will be built to
satisfy the necessary of local residents.
4. During construction of the expressway, the construction vehicles may damaged the
local roads to some extent, repairing work should be done by the construction unite after
construction.
5. Measures should be strengthened for the management of the expressway to
eliminate traffic accidents.
9.4 EIA on Acoustic Environment1. According to investigation and monitoring, the acoustic environment along the
alignment is quite good except for Beitou and Changmaolin where the noise at night

exceeds class 2 standards.
2. The prediction tells us that the acoustic environment will be impacted significantly
in operation. The excess ratio in short term, mid term and long term operation is 68.8%,
72.5% and 77.5% individually.
3. Traffic noise mitigation measures are as follows
(1) Temporary sound proof screen 100 X 2m will be built at Houdai Prim. Sch.
(2) 27 villages and 2 schools will be removed.
(3) Altogether 10450 m2 of soundproof screens will be built at 20 places.
(4) Altogether 7780 m2 of surrounding walls for villages and schools will be
heightened atl 8 places; 27 places of soundproof afforestation will be adopted.
(5) The red line of traffic noise in 2020 (long- term operation) is 139 m at night, so it
is suggested that the new houses be built 150 m beyond.
9.5 EIA on Environmental Air Quality1. Concentrations of CO, NOx and TSP in the Study Areas meet class 2 standards in
GB3095 - 1996, so the air is quite good.
2. Predicted concentrations of CO and NOx by 2020 in operation will not exceed
assessment standards of ambient air, so the operation of the highway will not have
significant impact on environment.
3. During the construction phase, fugitive dust from hauling trucks will pollute the
air, so mitigation measures will be taken. Water spraying will be done regularly at
construction sites and roads. 4 new spraying vehicles have been prepared, each
construction site will provided with a simple spraying vehicle.4. The asphalt for pavement will come from mixing stations. The Asphalt mixing
equipment will be equipped with dust collectors and will be located at least 300 m from
residential areas on the down wind directions. The locations of asphalt mixers will be
determined in construction drawing design stage because they are related to the locations
of construction sites. Open or half-open operation will not be allowed. The asphalt and
concrete mixers must have dust removing installations.
5. The design mechanical ventilation for Kuzhishan Tunnel is 2,352 m3 / min, 12
axial fans needed. While the design mechanical ventilation for Dabushan Tunnel is 1,825
m3 / m of ventilation, 8 axial fans needed.
6. Beginning from Jan. 2000, only lead-free petrol can be used all over the country.
Therefore the exhausting gas from traffic vehicles will not result in lead pollution to air
and soil.
9.6 EIA on Surface Water Environment1. Assessment results and analysis of present water quality
(1) Nanxi Stream of Jiulongjiang River System
I7n

The water quality of Nanxi Stream met the adopted Surface Water Quality
Standard (Class III), but exceed the adopted Seawater Quality Standards (Class 2).
(2)Yiangmei Reservoir
The water quality of Yiangmei Reservoir satisfied the adopted Surface Water Quality
Standard (Class II).
(3) Jiouzhen Port
The water quality of Jiouzhen Port satisfied the adopted Sea Water Quality Standard
(Class 2).
(4) Zhangjiang River
The water quality of Zhangjiang River met the adopted Surface Water Quality
Standard (Class HI), but exceed the adopted Seawater Quality Standards (Class 2).
(5) Zhaoanwan Port
The water quality of Zhaoanwan Port met the adopted Seawater Quality Standards
(Class 2).
2. According to the prediction calculation, except for the oil index of the water
quality of Yangmei reservoir and Naxi Stream, the water quality of the other surface
waters along the alignment will meet their assessment standards when the proposed
highway being put into operation.
3. The construction of extraordinary large bridges will induce unfavorable impact on
water bodies.
4. The following measures will be adopted
(1) The service area originally set at the vicinity of Yangmei Reservoir is changed to
Heken, which is 5km away from the reservoir.
(2) The service centers will each set up Class2 waste water disposal stations.
(3) Toll stations and tunnel management stations will set up waste water facilities.
(4) Cofferdams should be used during pier construction;
(5) Oil-water separators will be installed on construction ships;
(6) Domestic garbage will be collected and assembled, then transport to nearby cities
or counties for central treatment.
9.7 Environmental Impact of Interchanges and Link Roads
1. Either side of the Xialoucun village near Duxun Interchange will be impacted by
the ring road of the interchange. Guanyinting village and Xiagaoxi village near Yunxiao
Interchange will be impacted by the ring road of the interchange and the existing 324
National Highway. Afforestation will be adopted out side the village to aleviate the noise
and exhaust gas pollution.
2. Zhangpu Interchange locates between two hills with no villages nearby. However,
the route line and several ring road of the expressway will pass through the existing

irrigation ditch for 6 times. To avoid the impact on the farmland irrigation system, fly-
over or channel alternation works for the irrigation system should be finished before the
construction of interchanges.
3. The construction of the extra-large bridge on Nanxi will impact the water quality.To eliminate the impact by the construction of bridge piers on the river water, reasonable
procedures such as cofferdam method or drop shaft sinking will be taken in construction.
Oil-water separator will be installed on the construction ships.
4. Dongyuan Mid. Sch. is the most seriously standard exceeded spot. Heightening
surrounding wall (High 3m, Length 140m) and afforrestation in the school will be
adopted for mitigation of the noise impact.
5. 11 passageways will be built for the convenience and safety of the residents
separated by the expressway.
6 The domestic sewage of construction camps and toll station will be treated by the
septic tanks. Garbage collection stations will be built for regular assemble and disposal.
7. Rain water accumulation under the interchange is a general existing problem ofinterchange. It should be paid attention to in the designing. Drainage facilities such as
pumps should be provided in case the pavement under the interchange is not high enough
for drainage.
In sum, the construction and operation of Zhang-Zhao Expressway will be beneficial
to the traffic, economic development and investment circumstances. The environmental
issues impacted by this project are as follows.
In construction period: loss of land resources, plantation deterioration, soil erosion
increased during construction, construction noise and dust, asphalt fume pollution.
In operation period: traffic noise impact, the impact on water quality and other
aspects of environment by domestic sewage and garbage from service centers and on
other assistant facilities.
Environmental protection measures with 4264.45 million yuan RMB investment
have been put forward in this EIA. According to the assessment, if all the measures of
environment protection are implemented, the environmental impact problems caused by
the project can be effectively controlled and mitigated. So we can draw the conclusionthat the construction of this project is feasible based on the results of environmental
impact assessment.

REFERENCES
1. "Project Pre-feasibility Study Report of Zhangzhou-Zhaoan Expressway"2. "Report Document for Primary Inspection of Zhangzhou-Zhaoan Expressway"3. Zhongliangshan Tunnel Design Papers4. "Environmental Science", 17 vol. 1996 ( EIA Special Edition)5.'Soil Erosion & Control" by Lu Chenglong and Huang Yang, March, 19916. "Soil Erosion Equation in EIA" by Fang Yongshan, Oct.19917. "Techniques & Methods of EIA for Highway Construction Projects" Translated byZhang Wangyu & Cao Shencun, Oct. 19948. "Research Report for the Emission Factor of Highway Vehicles" by Deng Shunxi, CaoShencun, etc. Dec. 19969. " EIA Specifications for Highway Construction Projects (trial)", JTJ 005-96: MOC of P.R.C.July 1996, Beijing.10 Jing Qiting. Zhang Qinling, etc. " A practical Handbook of Environmental ImpactAssessment ", Shaanxi Science and Technology Publishing House, 1989. Xian.11. " Background Value of Soil Elements in China ", China Environmental SciencePublishing House, 1990, Beijing.12. Xian Highway Transportation University, " Research on EIA Specifications for HighwayConstruction Projects", Nov. 1993, Xian.
13. Xian Highway Transportation University, " A Study Report on Pollution by Road SurfaceRunoff and It's Prediction Model ", Feb.1995, Xian.14. NEPB and Enviromnental Monitoring Station of PRC, "EIA Technology Guide on None PollutionEcological Impact", June 1, 1998.15. "Annals of the History of Longhai City", 1997
16. "Almanac Statistical Data of Longhai City", 199617. "Almanac Statistical Data of Zhangzhou City", 199618. "Almanac Statistical Data of Zhangpu County", 199619. "Almanac Statistical Data of Yunxiao County", 199620. "Almanac Statistical Data of Zhaoan County", 199621. "Popular Investigation for Soil Erosion in Fujian Province", 1986

|~~~~~~~~~~~~~~~~~~~~~~~~~~~~~~o I ;FTm D-
ll<- WA4>S X :~~~~~~~~~~~~~~~~~~~~~~~~~~~~~~~~~~~~~~~~~~~~~~~~~~~~~~~~~~~~~~~~K5~5.16-
~~~~~~~~~~~~~~~~~~~~~~~~~~~~~~~~~~~~~~~~~~~Pooe a ~ 0tliOgnmen Sand
zSZ t *5hfiff i ~~~~~~~~~~~~~~~~~~~~~~~~~~~~~~~~~~Interchtinge m
6 tt Existing road Stone
4 meRB!; * i 3 3 ~~~~~~~~~~~~~ ~ ~ ~~~~~~~~~~~~~~~~~village/Town Spelil of subgrnde
uJ>f ie - \ ~~~~~~~~~~~~~~~~~~~~~~~~~~~~~~~~~Inter-countylelty bounidary ,
> { 3#> <Wii}XP4a%.Sil:41saoo1 i ~~~~~~ ~~~~~~~~~~~~~~~~~~~~~~Bridge Clay
Qgl 1 ) @ e f l f$~~~~~~~~~~~~~~~~~~~~~~~~~43-1(ji) t:8*
gBeitou <f Fig. 43-1(s) Layout of the PilingSites ofConstruction Materblis|{ __ m .. _ Z~~~~~~~~~~~~~~~~~~~~~~~~~~~~--------------

A4
-~ ~ ~~' '
N3~~~~~~~~~~~~~~~~~~~~~~~
C1 / 11~~ecommende Sche N
.. _ ^#AK\Xy " % t X X~~~~~~~~~~~~~4A8000
% . t X S~~(KM)_it' 41I~L~ E _______ _ . __ _ M3 I ___________ h N INAW K44+320 0.4 *1 I __ #
__________ W N2 I*Wl1N ii K46+950 1.4 *k I
_________ "4 N3 AO M1 K60+670 1.5 A I A
-CI C NAIMAl MW K48+450 8.4A* * Ji
Di J)j MAfiPAM K47+150 0.2 *1 I ai D2 "AAM 44I1h K61+500 0.2 *A I ffi± D3 $4M40"YA K77+800 0.2 *A 4
t*: tWi: 1 00000.M 4-3-1(a) It#4*M
Fig. 4-3-1(a) Layout of the Piling Sites of Construction Materis|
L w4gE fiSt6g1 jC13
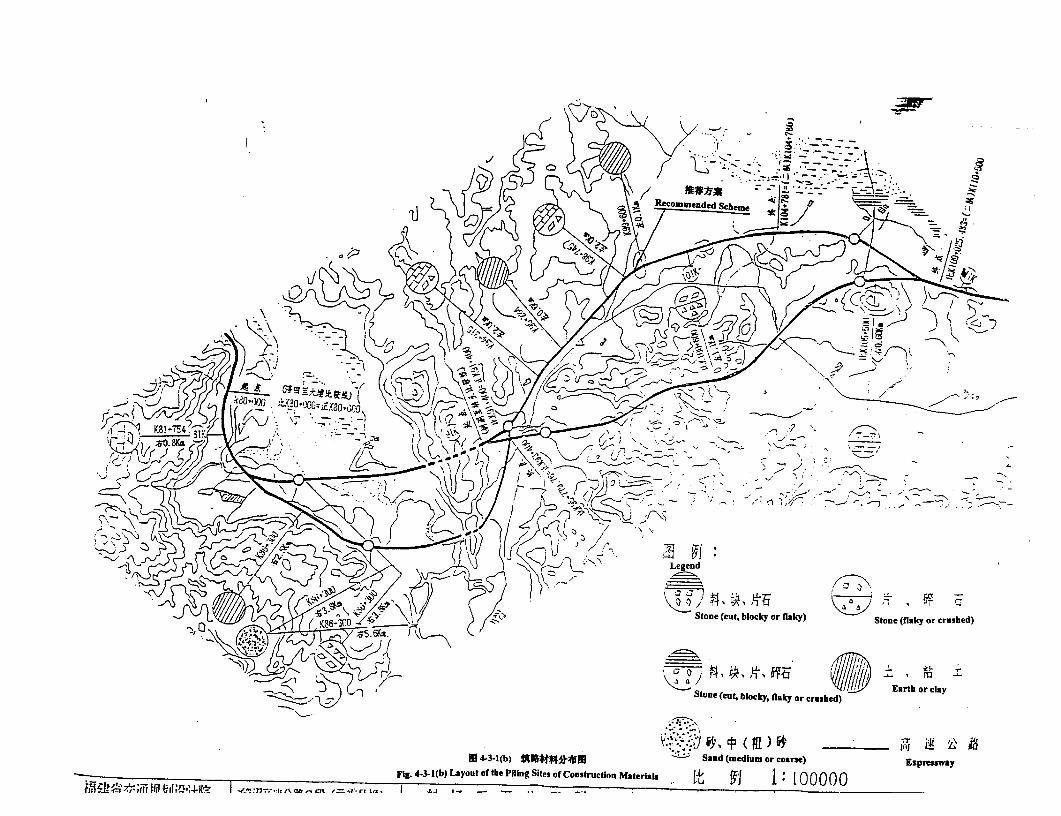
7--~~~~~~~~~~~~~~~~~I
'LI~~~~~~~~~~~~~~~~~~~~
~~~~~~$7<( ) -~~~~~~~~~~~~~~~ r {N~~~~~~~~~~-~~~~- ~~~~~EathoNca
-/^ 8Znel, ,'S e bl/k, fa or crshed)
Q94,u~~~~~~~~~~~~~~~~~~~~~~~~~~~~~KtEK ** -,-,' i_ -
( 4*3-1(b) " 4e og Sand (medium or coare) Elpressw hyFi. 4-3-1(b) Layout of tile Piling Siti-s of Construction Maiteriaih - L 1 §1 00
{ZM4L>Siz>;l 0lf , ln$ | ZFn. lt Or ~.8r ........... LIl:~-,;-r

M~~~~~~~~~~~~~~~~~~~~~~~~~~~~
1,~~~~~~~~~~~~~~J .. .f" .
(A&
Recommended Scheme
st~~~~~~~~~~~~~~~ vs
',\_~~~~~~~~~~~~~~~~~~~~~~~~~~~~~~~~~~I t0t>~ IlulngK
'-SUg / §;E W /l-S
- K140-SSI.S79
H 4-3-1(c) #4*0i U.,. -
t. Fig. 4-3-1(c) Layout of the Piling Sites of Construction Materials