wow workforce development open house oct 21 st and 22nd labor market review betsy falk southeastern...
TRANSCRIPT

WOW WOW Workforce Workforce
Development Development Open HouseOpen House
Oct 21st and 22nd
Labor Market Review
Betsy FalkSoutheastern Wisconsin Labor [email protected]

WOW WOW Workforce Workforce
Development Development Open HouseOpen House
Oct 21st and 22nd
Open House employment review with an overview of new employment studies
• Past and current unemployment data• Review of changes to employment• Demographic changes• Current and future employment needs• WIRED funded studies
– Job Openings (UWM)– Knowledge, Skills and Abilities (EMSI)
• Useful websites

WOW WOW Workforce Workforce
Development Development Open HouseOpen House
Oct 21st and 22nd
Unemployment Rates Explained*
Change in Labor Force Labor Force Employed Unemployed RateOriginal 100,000 95,000 5,000 5.0%New 110,000 95,000 15,000 13.6%
Change in number employedLabor force stays the same Labor Force Employed Unemployed RateOriginal 100,000 95,000 5,000 5.0%New 100,000 92,000 8,000 8.0%
Change in labor force and number employed, unemployed stays the same Labor Force Employed Unemployed RateOriginal 100,000 95,000 5,000 5.0%New 95,000 90,000 5,000 5.3%
* Numbers displayed do not represent any actual employment data. They are used for only as an example.

WOW WOW Workforce Workforce
Development Development Open HouseOpen House
Oct 21st and 22nd
Jan. Feb. Mar. Apr. May June July Aug. Sept.
Civilian Work Force (1) 153,445.0 153,804.0 153,728.0 153,271.0 154,336.0 155,921.0 156,255.0 154,897.0 153,617.0
Unemployment 13,009.0 13,699.0 13,895.0 13,248.0 13,973.0 15,095.0 15,201.0 14,823.0 14,538.0
Percent of Work Force 8.5 8.9 9 8.6 9.1 9.7 9.7 9.6 9.5
Employment 140,436.0 140,105.0 139,833.0 140,586.0 140,363.0 140,826.0 141,055.0 140,074.0 139,079.0
Civilian Population 234,739.0 234,913.0 235,086.0 235,271.0 235,452.0 235,655.0 235,870.0 236,087.0 236,322.0
ITEM Jan. Feb. Mar. Apr. May June July Aug. Sept.
Civilian Labor Force 3,065.5 3,134.6 3,075.3 3,093.6 3,092.9 3,134.6 3,154.3 3,162.4 3,127.2
Unemployment 230.0 277.3 284.9 262.6 252.8 279.8 252.8 272.8 236.8
Percent of Work Force 7.5 8.8 9.3 8.5 8.2 8.9 8 8.6 7.6
Employment 2,835.4 2,857.3 2,790.4 2,830.9 2,840.0 2,854.8 2,901.5 2,889.6 2,890.4
Civilian Population 4,407.1 4,409.4 4,411.6 4,414.0 4,416.5 4,419.3 4,422.5 4,425.2 4,428.4
(In Thousands)
NOT SEASONALLY ADJUSTED SERIES
DEPARTMENT OF WORKFORCE DEVELOPMENT
BUREAU OF WORKFORCE TRAINING
LABOR FORCE WISCONSIN-CPS 2009
DEPARTMENT OF WORKFORCE DEVELOPMENT
BUREAU OF WORKFORCE TRAINING
LABOR FORCE UNITED STATES 2009
(In Thousands)

WOW WOW Workforce Workforce
Development Development Open HouseOpen House
Oct 21st and 22nd
August County Unemployment Rank72 counties ranked highest to lowest unemployment rate
RANK COUNTY 09-Aug 09-Jul 08-Aug23 WASHINGTON 9.1% 9.4% 4.1%42 WAUKESHA 8.0% 8.0% 3.9%43 OZAUKEE 7.9% 8.0% 3.6%
RANK COUNTY 09-Aug 09-Jul 08-Aug1 MENOMINEE 17.8% 18.1% 14.0%2 ROCK 12.0% 12.8% 6.5%3 MARINETTE 11.4% 12.5% 5.6%4 LINCOLN 11.2% 11.5% 4.9%5 RUSK 11.1% 11.8% 5.6%6 IRON 10.5% 11.4% 6.2%7 OCONTO 10.5% 11.3% 5.8%8 KENOSHA 10.5% 10.6% 5.6%9 PRICE 10.3% 11.6% 4.5%
10 RACINE 10.2% 10.8% 5.5%

WOW WOW Workforce Workforce
Development Development Open HouseOpen House
Oct 21st and 22nd
August Cities Unemployment Rank31 cities ranked highest to lowest unemployment rate
RANK CITYAugust
2009 July 2009August
20083 WEST BEND CITY 13.4% 14.0% 5.9%
29 WAUWATOSA CITY 6.9% 6.9% 3.7%
RANK CITYAugust
2009 July 2009August
20081 BELOIT CITY 17.4% 17.7% 8.4%2 RACINE CITY 16.2% 17.1% 8.9%3 WEST BEND CITY 13.4% 14.0% 5.9%4 JANESVILLE CITY 13.0% 14.1% 7.5%5 MILWAUKEE CITY 11.9% 12.2% 7.2%6 GREEN BAY CITY 11.8% 12.4% 6.6%7 WAUSAU CITY 11.8% 12.0% 5.5%8 MANITOWOC CITY 11.7% 12.3% 5.1%9 SHEBOYGAN CITY 11.5% 12.1% 5.3%
10 KENOSHA CITY 11.4% 11.5% 6.1%

WOW WOW Workforce Workforce
Development Development Open HouseOpen House
Oct 21st and 22nd
WOW August Unemployment Rates
2.0%
4.0%
6.0%
8.0%
10.0%
12.0%
14.0%
Ozaukee West Bend City of Waukesha Waukesha w /o City Washington w /o City
Ozaukee 2.6% 3.5% 4.4% 5.1% 3.5% 3.7% 3.6% 3.7% 3.6% 7.9%
West Bend 4.0% 4.8% 6.2% 7.4% 5.6% 5.3% 6.0% 5.4% 5.9% 13.4%
City of Waukesha 3.8% 5.1% 5.9% 6.3% 5.5% 4.8% 5.0% 5.1% 5.1% 11.0%
Waukesha w /o City 2.6% 3.5% 4.1% 4.5% 3.7% 3.5% 3.5% 3.5% 3.6% 7.3%
Washington w /o City 2.5% 3.3% 3.9% 4.4% 3.7% 3.4% 3.6% 3.6% 3.5% 7.8%
2000 2001 2002 2003 2004 2005 2006 2007 2008 2009

WOW WOW Workforce Workforce
Development Development Open HouseOpen House
Oct 21st and 22nd
Milwaukee7 Fourth Quarter Employment and Wage ChangesRegional comparison of changes in the fourth quarter 2007 to 2008Quarterly Census of Employment and Wages
County 2007 2008 ChangeKenosha 55,440 55,300 (140) Milwaukee 502,029 496,573 (5,456) Ozaukee 39,271 38,343 (928) Racine 76,400 75,284 (1,116) Walworth 40,324 39,348 (976) Washington 52,853 52,113 (740) Waukesha 238,720 232,967 (5,753)
County 2007 2008 ChangeKenosha 518,649,449 530,198,415 11,548,966 Milwaukee 5,873,245,353 5,961,342,670 88,097,317 Ozaukee 413,632,876 408,269,582 (5,363,294) Racine 877,499,580 860,572,530 (16,927,050) Walworth 333,071,032 337,330,168 4,259,136 Washington 499,808,924 519,379,043 19,570,119 Waukesha 2,769,215,124 2,784,843,555 15,628,431
Data taken from:Wisconsin Department of Workforce DevelopmentBureau of Workforce Training - Labor Market Informationhttp://WORKnet.Wisconsin.gov
Fourth Quarter Average Employees
Fourth Quarter Total Wages

WOW WOW Workforce Workforce
Development Development Open HouseOpen House
Oct 21st and 22nd
Job Center of Wisconsin
WOW CountiesNumber of Jobs by occupations from Job CenterJanuary - September
2008 2009 Grand TotalProduction 6,318 1,507 7,825 Office and Administrative Support 2,577 970 3,547 Transportation and Material Moving 1,711 895 2,606 Architecture and Engineering 1,217 333 1,550 Sales and Related 886 655 1,541 Installation, Maintenance, and Repair 1,112 380 1,492 Building and Grounds Cleaning and Maintenance 910 340 1,250 Management 859 251 1,110 Healthcare Support 635 356 991 Construction and Extraction 753 137 890 Business and Financial Operations 614 239 853 Computer and Mathematical 602 209 811 Personal Care and Service 428 347 775 Healthcare Practitioners and Technical 326 428 754 Food Preparation and Serving Related 442 119 561 Community and Social Services 195 194 389 Arts, Design, Entertainment, Sports, and Media 214 155 369 Education, Training, and Library 163 83 246 Life, Physical, and Social Science 116 53 169 Farming, Fishing, and Forestry 31 23 54 Protective Service 43 4 47 Legal 11 6 17
Grand Total 20,163 7,684 27,847

WOW WOW Workforce Workforce
Development Development Open HouseOpen House
Oct 21st and 22nd
Occupation by Age 2006 American Community SurveyWOW Counties
Broad Occ 16-34 35-54 55+ TotalOffice & admin. support 14,230 22,080 12,798 49,108 Sales & related 15,486 19,212 9,909 44,607 Management 6,678 21,062 7,124 34,864 Production 10,354 16,485 4,550 31,389 Healthcare practitioner & tech. 4,463 10,135 4,380 18,978 Food preparation & serving 11,064 5,544 2,113 18,721 Business & financial operations 3,452 9,574 5,050 18,076 Transp. & material moving 6,761 8,233 2,937 17,931 Education, training & library 3,759 8,395 3,676 15,830 Construction & extraction 5,414 7,268 3,032 15,714 Architecture & engineering 2,710 6,448 1,747 10,905 Personal care & service 4,928 4,948 930 10,806 Building/grounds & maintenance 3,332 6,052 1,375 10,759 Computer & mathematical 3,890 5,253 449 9,592 Healthcare support 2,527 2,271 331 5,129 Install, maintenance & repair 1,289 487 1,324 3,100
Total: 100,337 153,447 61,725 315,509
Note: Occupation groups are in descending order based on the number of workers in each group.Source: 2006 U.S. Census, ACS PUMS & WI DWD, OEA

WOW WOW Workforce Workforce
Development Development Open HouseOpen House
Oct 21st and 22nd
WOW Counties LFPRLabor Force Participation by Age
0.0%
10.0%
20.0%
30.0%
40.0%
50.0%
60.0%
70.0%
80.0%
90.0%
100.0%
16-19LFPR
20-24LFPR
25-29LFPR
35-44LFPR
45-54LFPR
55-59LFPR
60-64LFPR
65-69LFPR
70-74LFPR
75+ LFPR
Ozaukee Washington Waukesha WOW
WOW WOW Workforce Workforce
Development Development Open HouseOpen House
Oct 21st and 22nd
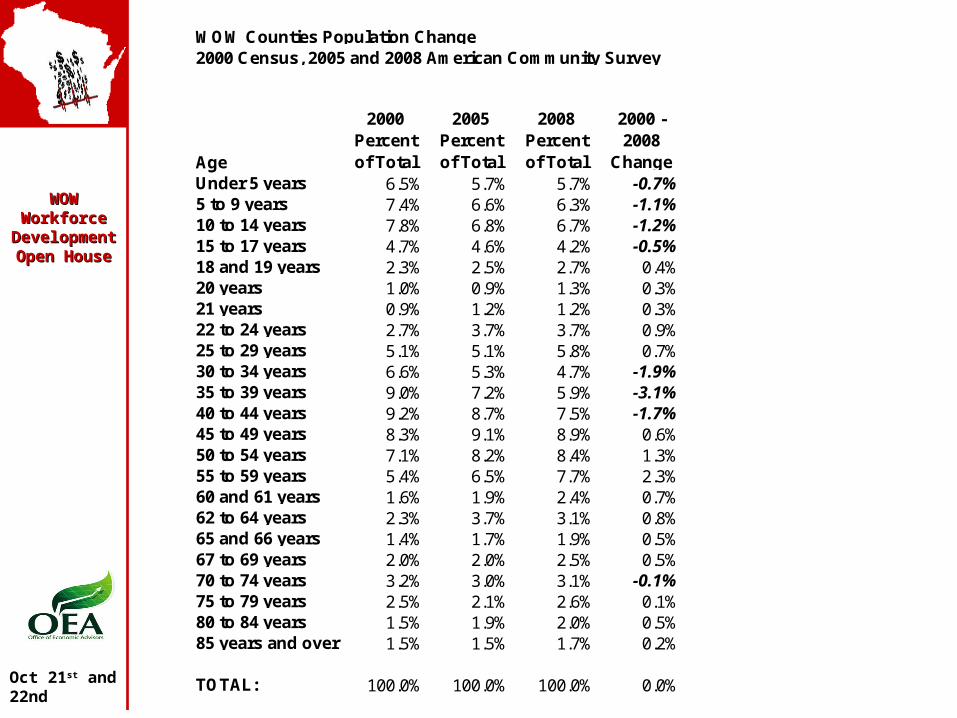
WOW Counties Population Change2000 Census, 2005 and 2008 American Community Survey
Age
2000 Percent of Total
2005 Percent of Total
2008 Percent of Total
2000 - 2008
ChangeUnder 5 years 6.5% 5.7% 5.7% -0.7%5 to 9 years 7.4% 6.6% 6.3% -1.1%10 to 14 years 7.8% 6.8% 6.7% -1.2%15 to 17 years 4.7% 4.6% 4.2% -0.5%18 and 19 years 2.3% 2.5% 2.7% 0.4%20 years 1.0% 0.9% 1.3% 0.3%21 years 0.9% 1.2% 1.2% 0.3%22 to 24 years 2.7% 3.7% 3.7% 0.9%25 to 29 years 5.1% 5.1% 5.8% 0.7%30 to 34 years 6.6% 5.3% 4.7% -1.9%35 to 39 years 9.0% 7.2% 5.9% -3.1%40 to 44 years 9.2% 8.7% 7.5% -1.7%45 to 49 years 8.3% 9.1% 8.9% 0.6%50 to 54 years 7.1% 8.2% 8.4% 1.3%55 to 59 years 5.4% 6.5% 7.7% 2.3%60 and 61 years 1.6% 1.9% 2.4% 0.7%62 to 64 years 2.3% 3.7% 3.1% 0.8%65 and 66 years 1.4% 1.7% 1.9% 0.5%67 to 69 years 2.0% 2.0% 2.5% 0.5%70 to 74 years 3.2% 3.0% 3.1% -0.1%75 to 79 years 2.5% 2.1% 2.6% 0.1%80 to 84 years 1.5% 1.9% 2.0% 0.5%85 years and over 1.5% 1.5% 1.7% 0.2%
TOTAL: 100.0% 100.0% 100.0% 0.0%

WOW WOW Workforce Workforce
Development Development Open HouseOpen House
Oct 21st and 22nd
Region InfoRegion: WaukeshaOzaukeeWashington
Description 2006 Jobs 2016 Jobs Change % Change 2009 EPWAgriculture, forestry, fishing and hunting 3,237 3,451 214 6.6% $23,738.46Mining 504 277 (227) (45.0%) $96,635.38Utilities 1,043 1,197 154 14.8% $129,702.82Construction 27,231 22,241 (4,990) (18.3%) $58,456.32Manufacturing 73,760 65,159 (8,601) (11.7%) $67,325.53Wholesale trade 25,543 25,393 (150) (0.6%) $71,868.91Retail trade 45,202 46,111 909 2.0% $26,170.25Transportation and warehousing 11,498 12,018 520 4.5% $48,135.18Information 6,587 7,392 805 12.2% $65,879.28Finance and insurance 22,047 24,765 2,718 12.3% $74,833.70Real estate and rental and leasing 14,364 17,270 2,906 20.2% $24,713.01Professional and technical services 24,762 25,846 1,084 4.4% $56,269.37Management of companies and enterprises 5,981 8,088 2,107 35.2% $82,054.40Administrative and waste services 20,133 18,757 (1,376) (6.8%) $34,533.02Educational services 6,498 7,396 898 13.8% $23,448.35Health care and social assistance 35,441 44,884 9,443 26.6% $46,147.68Arts, entertainment, and recreation 7,570 8,611 1,041 13.8% $14,465.95Accommodation and food services 25,970 27,700 1,730 6.7% $14,152.59Other services, except public administration 20,028 21,778 1,750 8.7% $23,960.28Government 27,494 28,912 1,418 5.2% $53,161.10
404,892 417,246 12,354 3.0% $48,408
WOW Counties Jobs by Industry
WOW WOW Workforce Workforce
Development Development Open HouseOpen House
Oct 21st and 22nd
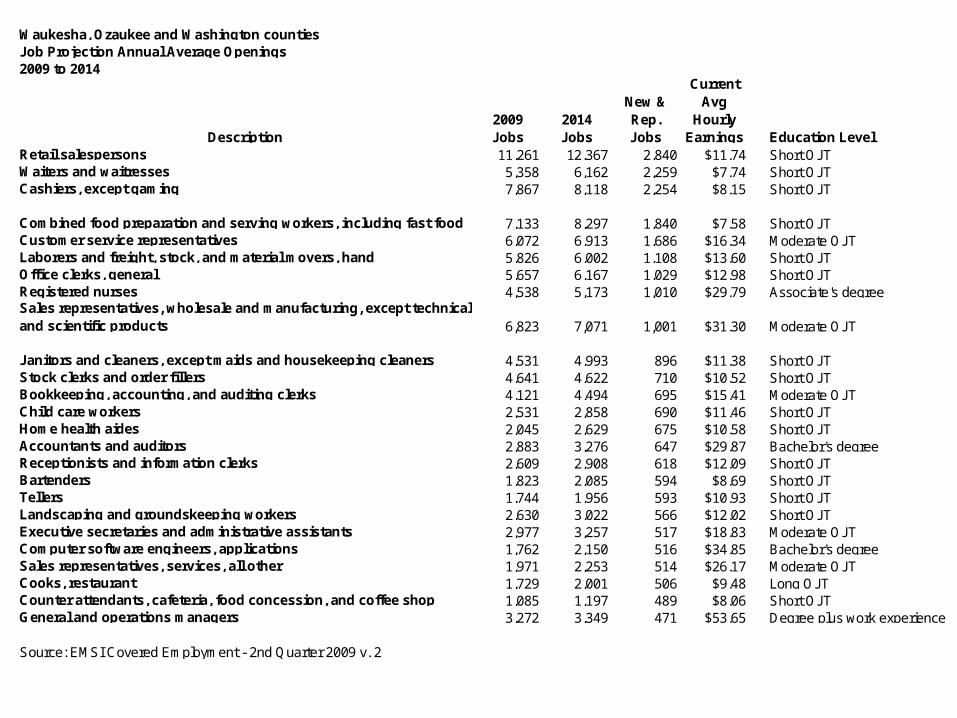
Waukesha, Ozaukee and Washington countiesJob Projection Annual Average Openings2009 to 2014
Description2009 Jobs
2014 Jobs
New & Rep. Jobs
Current Avg
Hourly Earnings Education Level
Retail salespersons 11,261 12,367 2,840 $11.74 Short OJTWaiters and waitresses 5,358 6,162 2,259 $7.74 Short OJTCashiers, except gaming 7,867 8,118 2,254 $8.15 Short OJT
Combined food preparation and serving workers, including fast food 7,133 8,297 1,840 $7.58 Short OJTCustomer service representatives 6,072 6,913 1,686 $16.34 Moderate OJTLaborers and freight, stock, and material movers, hand 5,826 6,002 1,108 $13.60 Short OJTOffice clerks, general 5,657 6,167 1,029 $12.98 Short OJTRegistered nurses 4,538 5,173 1,010 $29.79 Associate's degreeSales representatives, wholesale and manufacturing, except technical and scientific products 6,823 7,071 1,001 $31.30 Moderate OJT
Janitors and cleaners, except maids and housekeeping cleaners 4,531 4,993 896 $11.38 Short OJTStock clerks and order fillers 4,641 4,622 710 $10.52 Short OJTBookkeeping, accounting, and auditing clerks 4,121 4,494 695 $15.41 Moderate OJTChild care workers 2,531 2,858 690 $11.46 Short OJTHome health aides 2,045 2,629 675 $10.58 Short OJTAccountants and auditors 2,883 3,276 647 $29.87 Bachelor's degreeReceptionists and information clerks 2,609 2,908 618 $12.09 Short OJTBartenders 1,823 2,085 594 $8.69 Short OJTTellers 1,744 1,956 593 $10.93 Short OJTLandscaping and groundskeeping workers 2,630 3,022 566 $12.02 Short OJTExecutive secretaries and administrative assistants 2,977 3,257 517 $18.83 Moderate OJTComputer software engineers, applications 1,762 2,150 516 $34.85 Bachelor's degreeSales representatives, services, all other 1,971 2,253 514 $26.17 Moderate OJTCooks, restaurant 1,729 2,001 506 $9.48 Long OJTCounter attendants, cafeteria, food concession, and coffee shop 1,085 1,197 489 $8.06 Short OJTGeneral and operations managers 3,272 3,349 471 $53.65 Degree plus work experience
Source: EMSI Covered Employment - 2nd Quarter 2009 v. 2

WOW WOW Workforce Workforce
Development Development Open HouseOpen House
Oct 21st and 22nd
Waukesha, Ozaukee and Washington countiesJob Projection Annual Average Openings2014 Average Annual Openings
Education Level
New & Rep. Jobs
Short-term on-the-job training Total 25,462Moderate-term on-the-job training Total 12,369Bachelor's degree Total 6,858Long-term on-the-job training Total 4,486Work experience in a related field Total 3,210Postsecondary vocational award Total 2,912Associate's degree Total 2,283Degree plus work experience Total 1,902First professional degree Total 812Master's degree Total 607Doctoral degree Total 410N/A Total 166

WOW WOW Workforce Workforce
Development Development Open HouseOpen House
Oct 21st and 22nd
Regional Workforce Alliance

WOW WOW Workforce Workforce
Development Development Open HouseOpen House
Oct 21st and 22nd
Regional Workforce Alliance
• 7 Counties• 2007 WIRED Grant $5.1 million• $2.5 million Workforce Innovation Fund• Proof of Concept – Quick Hit
– Deloitte Study– 2 Industries– 5 Occupations
• EMSI Study– Ability, Skill, Knowledge
• UW Milwaukee Study– Job Openings
WOW WOW Workforce Workforce
Development Development Open HouseOpen House
Oct 21st and 22nd
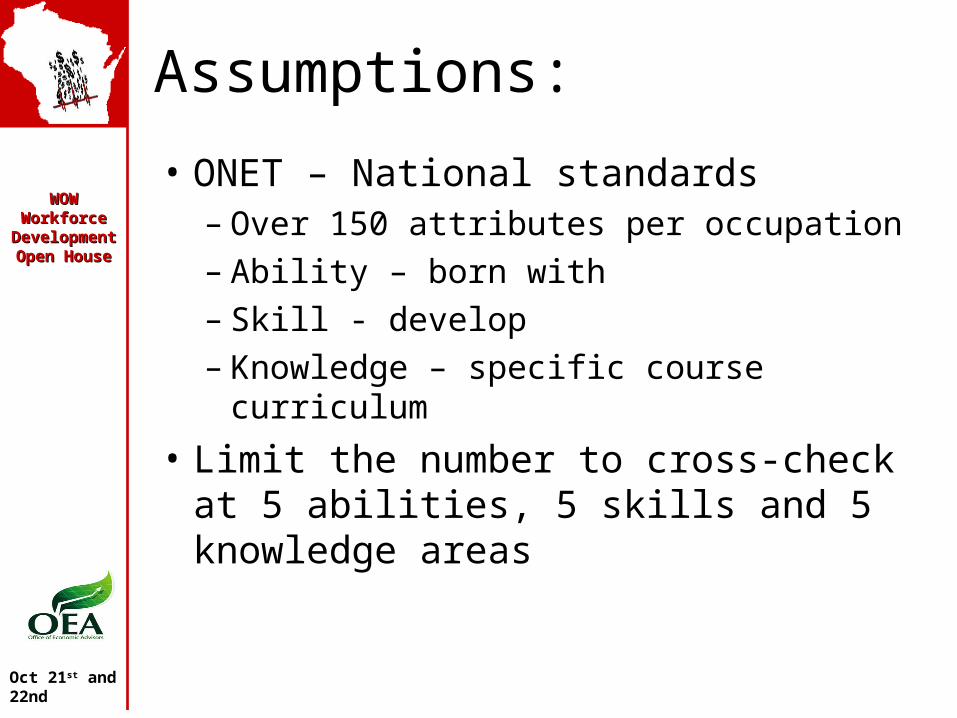
Assumptions:
• ONET – National standards– Over 150 attributes per occupation– Ability – born with– Skill - develop– Knowledge – specific course curriculum
• Limit the number to cross-check at 5 abilities, 5 skills and 5 knowledge areas

WOW WOW Workforce Workforce
Development Development Open HouseOpen House
Oct 21st and 22nd
•Pharmaceutical
•Plastics
•Industrial Machinery
•Electronic Systems
•Finance
•Business Services
•Consumer Services (Building and Landscape)
•Consumer Services (Social and Health Care)
STUDY RESULTS FOR INDUSTRIES

WOW WOW Workforce Workforce
Development Development Open HouseOpen House
Oct 21st and 22nd
Service Occupations
21
3634
3941
3331
47
31
47
213
23
6
34
616159
6464
78
70
76
83
78
62
7071
8582
58
4750 45
39
6560 63 55
5856 56
50 4846
0
10
20
30
40
50
60
70
80
90 C
usto
mer
and
Per
sona
l Ser
vice
Cle
rical
Eng
lish
Lang
uage
Mat
hem
atic
s
Com
pute
rs a
ndE
lect
roni
cs
Act
ive
List
enin
g
Mon
itorin
g
Rea
ding
Com
preh
ensi
on
Ser
vice
Orie
ntat
ion
Act
ive
Lear
ning
Ora
lC
ompr
ehen
sion
Ora
l Exp
ress
ion
Writ
ten
Com
preh
ensi
on
Ded
uctiv
eR
easo
ning
Writ
ten
Exp
ress
ion
Level Knowledge Skills Abilities

WOW WOW Workforce Workforce
Development Development Open HouseOpen House
Oct 21st and 22nd
Service Occupation – Group 1

WOW WOW Workforce Workforce
Development Development Open HouseOpen House
Oct 21st and 22nd
Service Occupation – Group 2
WOW WOW Workforce Workforce
Development Development Open HouseOpen House
Oct 21st and 22nd
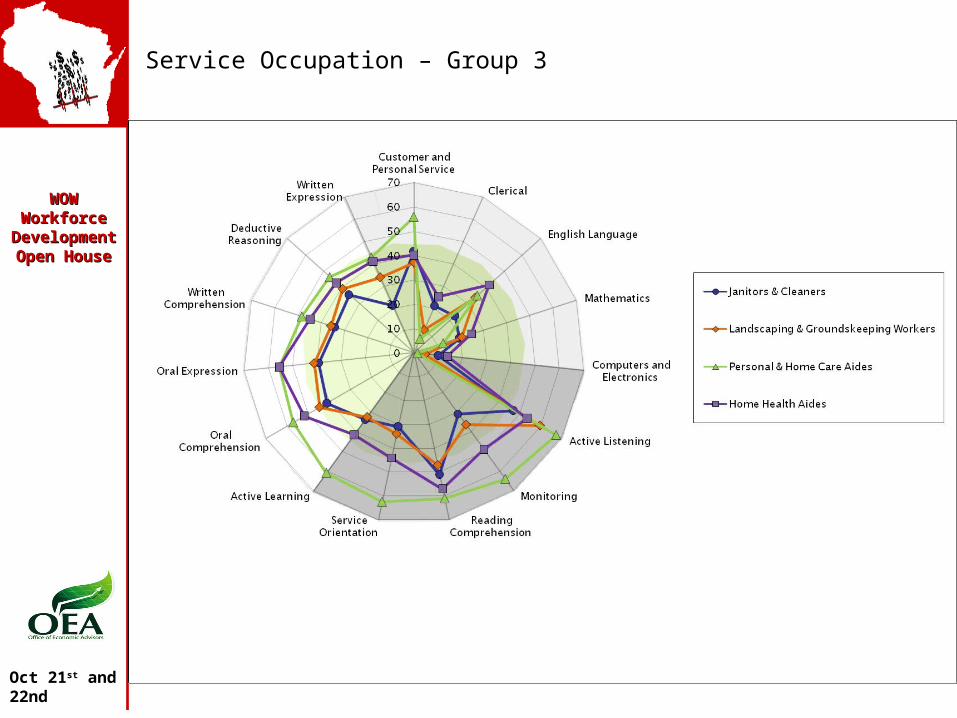
Service Occupation – Group 3

WOW WOW Workforce Workforce
Development Development Open HouseOpen House
Oct 21st and 22nd
Code Title Total abilities skills knowledge
11- 3011.00 Administrative Services Managers 15 5 5 5
43- 6013.00 Medical Secretaries 15 5 5 5
43- 4041.01 Credit Authorizers 15 5 5 5
43- 3071.00 Tellers 15 5 5 5
43- 3041.00 Gaming Cage Workers 15 5 5 5
29- 1121.00 Audiologists 15 5 5 5
13- 1072.00Compensation, Benefits, and Job Analysis Specialists 15 5 5 5
43- 4031.03 License Clerks 15 5 5 5
29- 1124.00 Radiation Therapists 15 5 5 5
13- 2061.00 Financial Examiners 14 5 4 5
STUDY RESULTS (Other Compatible Occupations)

WOW WOW Workforce Workforce
Development Development Open HouseOpen House
Oct 21st and 22nd
Handy Websites• Check on job titles, skills and related
occupations: Onet– http://online.onetcenter.org/
• Definition of “green” jobs and industry: EMSI– http://www.economicmodeling.com/
• Wage comparison for counties and length of service: Wisconsin WorkNET– http://worknet.wisconsin.gov/worknet/wageco
mparison.aspx?menuselection=ce• Wisconsin Department of Workforce
Development Office of Economic Advisors– http://www.dwd.state.wi.us/oea/
• Regional Workforce Alliance– http://www.milwaukee7-rwa.org/wiki

WOW WOW Workforce Workforce
Development Development Open HouseOpen House
Oct 21st and 22nd
Questions????