# mcgraw-hill/irwin copyright © 2013 by the mcgraw-hill companies, inc. all rights reserved. fiscal...
TRANSCRIPT

#
McGraw-Hill/Irwin Copyright © 2013 by The McGraw-Hill Companies, Inc. All rights reserved.
Fiscal Policy, Deficits, and Debt
8

8-2
Fiscal Policy
• Deliberate changes in
• Government spending
• Taxes
• Designed to
• Achieve full employment
• Control inflation
• Encourage economic growth
LO1

8-3
Expansionary Fiscal Policy
• Use during a recession
• Increase government spending
• Decrease taxes
• Combination of both
• Create a deficit
LO1

8-4
Expansionary Fiscal Policy
Real GDP (billions)
Pri
ce l
evel
AD2
AD1
$5 billion increase inspending
Full $20 billion increase inaggregate demand
AS
$490 $510
P1
LO1
Recessionsdecrease AD

8-5
Contractionary Fiscal Policy
• Use during demand-pull inflation
• Decrease government spending
• Increase taxes
• Combination of both
• Create a surplus
LO1

8-6
Contractionary Fiscal Policy
Real GDP (billions)
Pri
ce l
evel
AD3
AD4
$3 billion initialdecrease inspending
Full $12 billion decrease inaggregate demand
AS
$502 $522
P2
AD5
$510
d b
aP1
c
LO1

8-7
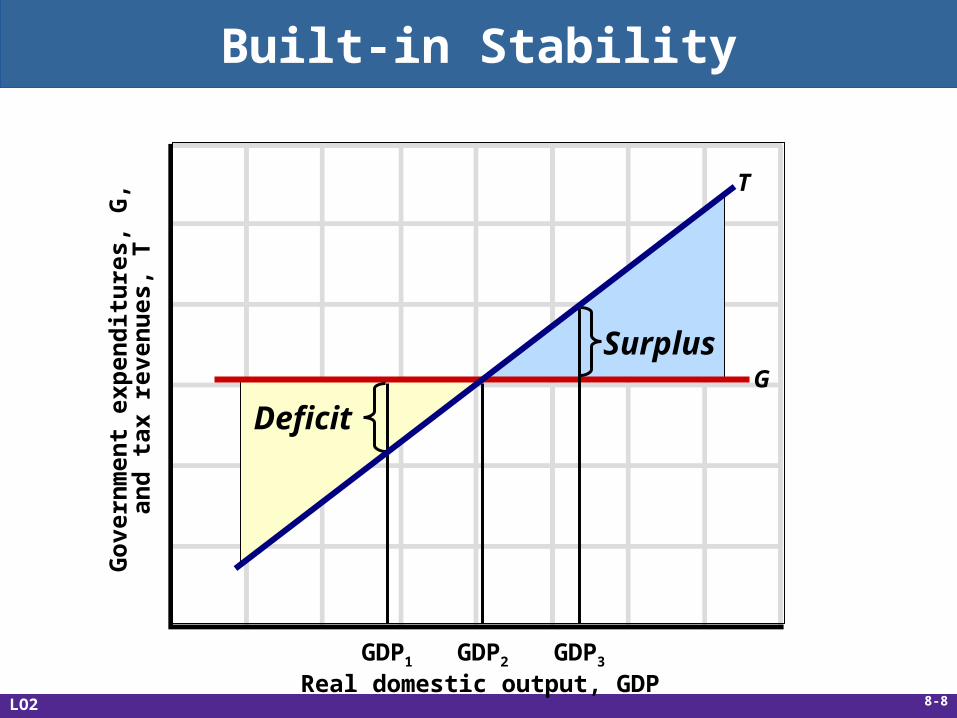
Built-in Stability
• Automatic stabilizers
• Taxes vary directly with GDP
• Transfers vary inversely with GDP
• Reduces severity of business fluctuations
• Tax progressivity
• Progressive tax system
• Proportional tax system
• Regressive tax systemLO2
8-8
Built-in Stability
G
T
Deficit
Surplus
GDP1 GDP2 GDP3
Real domestic output, GDP
Go
vern
men
t ex
pen
dit
ure
s, G
,an
d t
ax r
even
ues
, T
LO2

8-9
Evaluating Fiscal Policy
• Is the fiscal policy. . .
• Expansionary?
• Neutral?
• Contractionary?
• Use the cyclically adjusted budget to evaluate
LO3
8-10
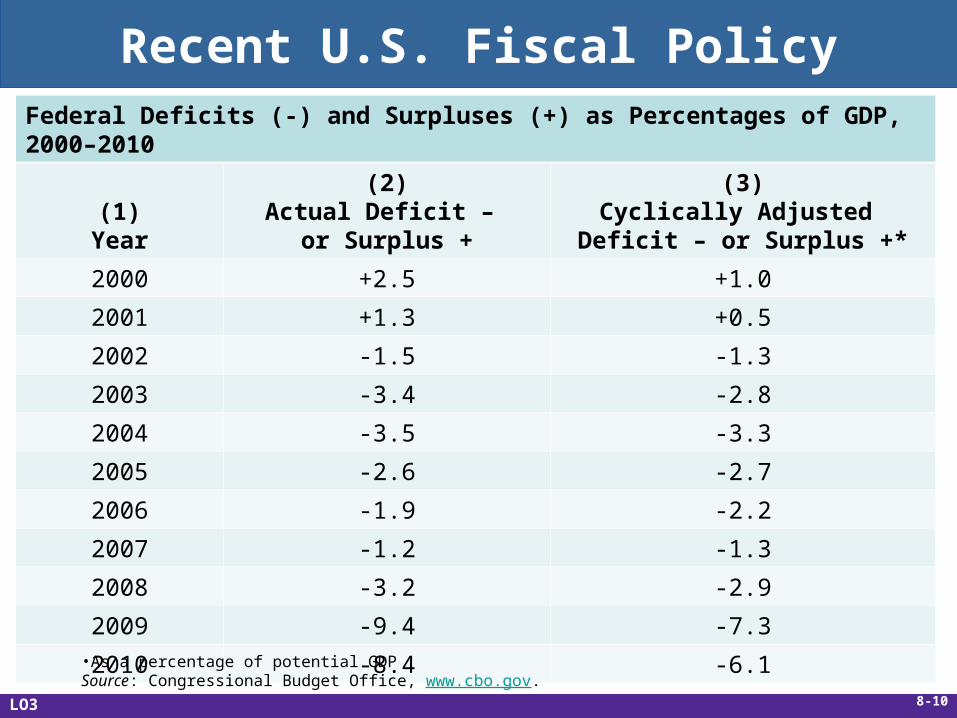
Recent U.S. Fiscal PolicyFederal Deficits (-) and Surpluses (+) as Percentages of GDP, 2000–2010
(1)Year
(2)Actual Deficit –
or Surplus +
(3)Cyclically Adjusted
Deficit – or Surplus +*
2000 +2.5 +1.0
2001 +1.3 +0.5
2002 -1.5 -1.3
2003 -3.4 -2.8
2004 -3.5 -3.3
2005 -2.6 -2.7
2006 -1.9 -2.2
2007 -1.2 -1.3
2008 -3.2 -2.9
2009 -9.4 -7.3
2010 -8.4 -6.1•As a percentage of potential GDPSource: Congressional Budget Office, www.cbo.gov.
LO3

8-11
Fiscal Policy: The Great Recession
• Financial market problems began in 2007
• Credit market freeze
• Pessimism spreads to the overall economy
• Recession officially began December 2007 and lasted 18 months
LO4

8-12
Budget Deficits and Projections
Source: Congressional Budget Office, www.cbo.gov.
LO4
$400
0
-400
-800
-1200
-1600
2014
2012
2010
2008
2006
2004
2002
2000
1998
1996
1994
Bu
dg
et d
efic
it (
-) o
r su
rplu
s, b
illi
on
s

8-13
Problems, Criticisms, & Complications
• Problems of timing
• Recognition lag
• Administrative lag
• Operational lag
• Political considerations
• Future policy reversals
• Offsetting state and local finance
• Crowding-out effect
LO4

8-14
Current Thinking on Fiscal Policy
• Let the Federal Reserve handle short-term fluctuations
• Fiscal policy should be evaluated in terms of long-term effects
• Use tax cuts to enhance work effort, investment, and innovation
• Use government spending on public capital projects
LO4

8-15
The U.S. Public Debt
• $13.6 trillion in 2010
• The accumulation of years of federal deficits and surpluses
• Owed to the holders of U.S. securities
• Treasury bills
• Treasury notes
• Treasury bonds
• U.S. savings bonds
LO4

8-16
The U.S. Public Debt
LO4
Debt held outside
the federal government
and theFederal
Reserve:61%
Debt held bythe federal government
and the Federal
Reserve:39%
Foreign Ownership
32%
11%
13%
5%
6%
U.S. Government
Agencies33%
U.S. Banks and Other Financial Institutions
Other, including State and Local Gov’ts
Federal Reserve
U.S. Individuals

8-17
The U.S. Public Debt
LO4

8-18
Global Snapshot
Public Sector Debt as Percentage of GDP, 2010
JapanGreece
ItalyBelgium
United StatesHungary
FranceUnited Kingdom
GermanySpain
NetherlandsCanada
0 20 40 60 80 100 120
Source: Organization for Economic Cooperation and Development, OECD
LO4
8-19
The U.S. Public Debt
• Interest charges on debt
• Largest burden of the debt
• 1.4 percent of GDP in 2010
• False Concerns
• Bankruptcy
•Refinancing
•Taxation
• Burdening future generationsLO4

8-20
Substantive Issues
• Income distribution
• Incentives
• Foreign-owned public debt
• Crowding-out effect revisited
• Future generations
• Public investment
LO4

8-21
Crowding-Out Effect
5 10 15 20 25 30 35 400
2
4
6
8
10
12
14
16R
eal
inte
rest
rat
e (p
erce
nt)
Investment (billions of dollars)
ID1
ID2
a
b c
Increase ininvestmentdemand
Crowding-out effect
LO4

8-22
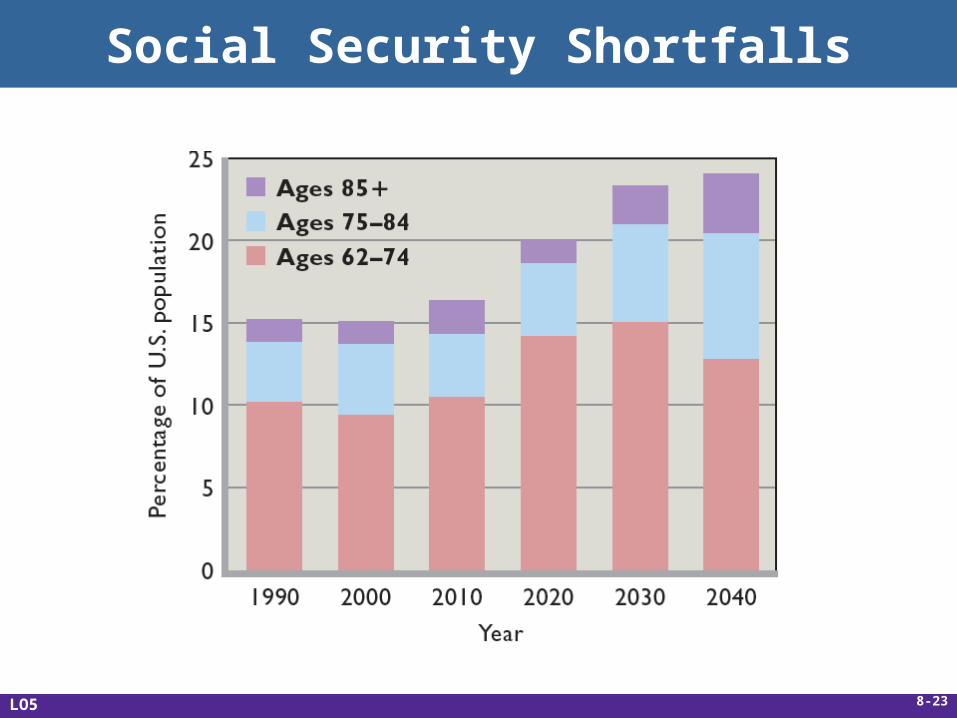
Social Security Shortfalls
• More Americans will be receiving benefits as they age
• Social Security shortfalls
• Income during retirement
• Funds will be depleted by 2036
LO5
8-23
Social Security Shortfalls
LO5

8-24
Social Security Shortfalls
• Possible options “to fix” include
• Increasing the retirement age
• Increasing the portion of earnings subject to the Social Security tax
• Disqualifying wealthy individuals
• Redirecting low-skilled immigrants to higher-skilled, higher-paying work
• Defined contribution plans owned by individuals
LO5