the 2002 healthcare conference 29 september-1 october 2002 scarman house, the university of warwick,...
TRANSCRIPT

The 2002 Healthcare Conference
29 September-1 October 2002
Scarman House, The University of Warwick, Coventry

Session B1 : Critical Illness
Trends in Critical Illness
Heart Attack & Stroke
Working Party / Research Sub-group Report
Scott Reid & Joanne Wells

Critical Illness Trends Working Party
Our Aims : To examine underlying trends in the factors influencing UK
Insured Critical Illness claim rates, and from these, to assess : The historic trend in incidence and death rates for the major CI’s Any pointers for future trends in Standalone CI, Mortality and hence
Accelerated CI.
Formed in March 2001

Sub-Group Members
Actuaries
Scott Reid
Joanne Wells
Medical Expert
Dr Richard Croxson - Consultant Cardiologist

Contents Slide
Background and set the scene Variations by deprivation category Variations by ICD code Impact of smoking Future influences on rates Project population incidence rates

Contents Slide
Background and set the scene Variations by deprivation category Variations by ICD code Impact of smoking Future influences on rates Project population incidence rates

Background and set the scene
Re-cap of previous work Data sources used
Scottish English
Next step forward
Background and set the scene
Re-cap of previous work Data sources used
Scottish English
Next step forward

Re-cap of previous work
Population trends – Scotland and England Heart attack Stroke CABG Angioplasty
Broad brush analysis of smoker prevalence
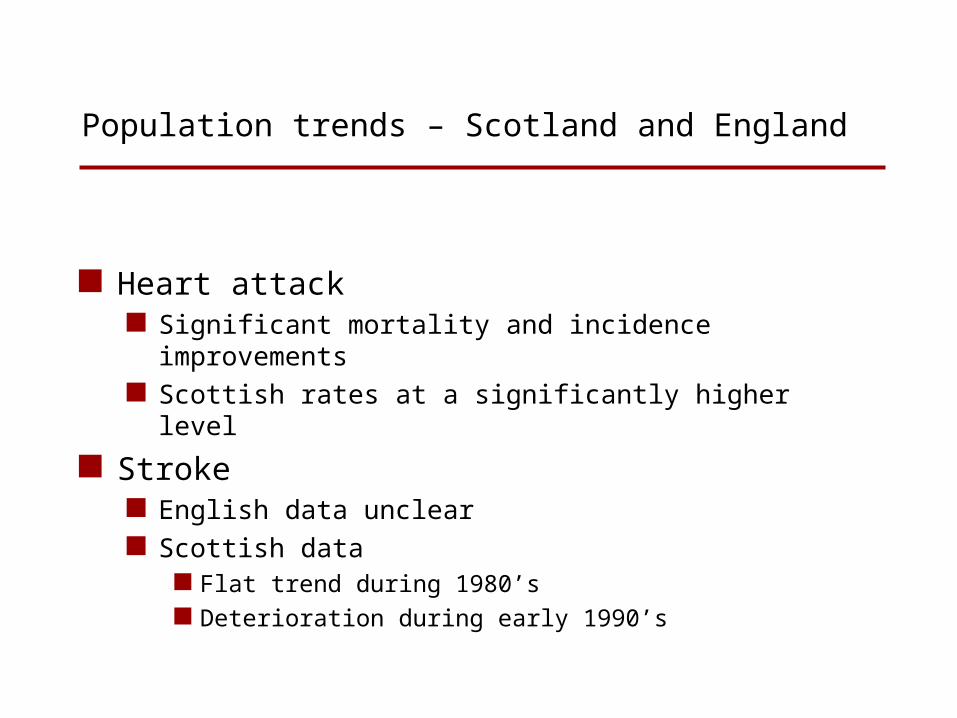
Population trends – Scotland and England
Heart attack Significant mortality and incidence improvements Scottish rates at a significantly higher level
Stroke English data unclear Scottish data
Flat trend during 1980’s Deterioration during early 1990’s
Broad brush analysis of smoker prevalence
Smoking is a key risk factor Reduction in smoking prevalence Scottish and English smoker prevalence patterns
Scottish trends

Background and set the scene
Re-cap of previous work Data sources used
Scottish English
Next step forward

Data sources used
Scottish population – ISD data Good quality Patient based
English population - HES data Data quality is questionable Episode based

Background and set the scene
Next step Insured trends Understanding the main drivers to cause trends Smoker differentiated rates Future influences Overall trend pattern

Contents Slide
Background and set the scene Variations by deprivation category Variations by ICD code Impact of smoking Future influences on rates Project population incidence rates

Variations by deprivation class
Why split by deprivation class? Data sources used Explanation of deprivation scores and categories Overall trends by gender
Heart attack Stroke
Conclusion

Variations by deprivation class
Why split by deprivation class? Data sources used Explanation of deprivation scores and categories Overall trends by gender
Heart attack Stroke
Conclusion
Why split by deprivation class?
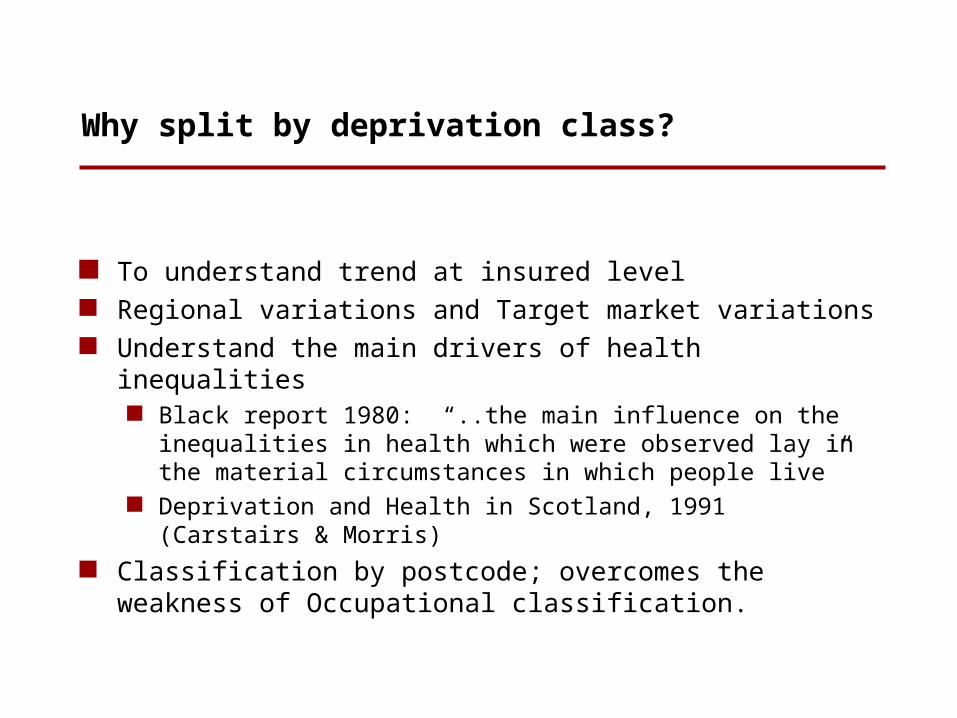
To understand trend at insured level Regional variations and Target market variations Understand the main drivers of health inequalities
Black report 1980: “..the main influence on the inequalities in health which were observed lay in the material circumstances in which people live”
Deprivation and Health in Scotland, 1991 (Carstairs & Morris) Classification by postcode; overcomes the weakness of
Occupational classification.

Variations by deprivation class
Why split by deprivation class? Data sources used Explanation of deprivation scores and categories Overall trends by gender
Heart attack Stroke
Conclusion

Data sources used
Incidence data SMR1/01, Information Statistics Division NHS Scotland General Registers Office for Scotland
Mortality data General Registers Office for Scotland
Population data 1981 Population Census 1991 Population Census
Split by CI condition ICD code Gender 5 year age bands deprivation category
Variations by deprivation class
Why split by deprivation class? Data sources used Explanation of deprivation scores and categories Overall trends by gender
Heart attack Stroke
Conclusion

Explanation of deprivation scores and categories
Carstairs & Morris 1991 deprivation categories Four indicators – to derive a composite score
Overcrowding Male unemployment Low social class No car
Deprivation score divided into 7 separate categories 1 – the most affluent group …… 7 – the most deprived group

Explanation of deprivation scores and categories
Population living at different levels of depreviation: England, Wales and Scotland
Scotland England and Wales% Population % Population
Deprivation 1991 census 1991 censusCategory
1 6% 21%2 14% 30%3 22% 22%4 25% 15%5 15% 7%6 11% 4%7 7% 1%
100% 100%

Explanation of deprivation scores and categories
Population living at different levels of depreviation: England, Wales and Scotland
Scotland England and Wales% Population % Population
Deprivation 1991 census 1991 censusCategory
1 6% 21%2 14% 30%3 22% 22%4 25% 15%5 15% 7%6 11% 4%7 7% 1%
100% 100%

Variations by deprivation class
Why split by deprivation class? Data sources used Explanation of deprivation scores and categories Overall trends by gender
Heart attack Stroke
Conclusion

Trends in incidence of first heart attack for males in Scotland, as a % of 1981 Value, 1981 to 2000
40%
50%
60%
70%
80%
90%
100%
110%
120%
1981 1983 1985 1987 1989 1991 1993 1995 1997 1999
0-39 40-64 65+

Trends in incidence of first heart attack for males in Scotland, as a % of 1981 Value, 1981 to 2000
40%
50%
60%
70%
80%
90%
100%
110%
120%
1981 1983 1985 1987 1989 1991 1993 1995 1997 1999
40-64

Trends in incidence of first heart attack for males in Scotland, as a % of 1981 Value, 1981 to 2000
40%
50%
60%
70%
80%
90%
100%
110%
120%
1981 1983 1985 1987 1989 1991 1993 1995 1997 1999
1 2 3 4 5 6 7 overall

Trends in incidence of first heart attack for males in Scotland, per 100000 of population, 1981 to 2000
0
200
400
600
800
1000
1200
1981 1982 1983 1984 1985 1986 1987 1988 1989 1990 1991 1992 1993 1994 1995 1996 1997 1998 1999 2000
1 2 3 4 5 6 7 9

Trends in incidence rate of first heart attack for males aged 40 to 64 in Scotland, per 100000 of Population, 1981 to 2000
0
200
400
600
800
1000
1200
1986 1987 1988 1989 1990 1991 1992 1993 1994 1995 1996 1997 1998 1999 2000
Insured Population best worst

Trends in incidence rate of first heart attack for males aged 40 to 64 in Scotland, as a % of 1986 Value, 1981 to 2000
0%
20%
40%
60%
80%
100%
120%
1986 1987 1988 1989 1990 1991 1992 1993 1994 1995 1996 1997 1998 1999 2000
insured category population best rate worst rate

Trends in incidence rate of first heart attack for females aged 40 to 64 in Scotland, per 100000 of Population, 1981 to 2000
0
200
400
600
800
1000
1200
1986 1987 1988 1989 1990 1991 1992 1993 1994 1995 1996 1997 1998 1999 2000
Insured Population best worst

Trends in incidence rate of first heart attack for females aged 40 to 64 in Scotland, as a % of 1986 Value, 1981 to 2000
0%
20%
40%
60%
80%
100%
120%
1986 1987 1988 1989 1990 1991 1992 1993 1994 1995 1996 1997 1998 1999 2000
insured category population best rate worst rate

Summary of heart attack trends by deprivation class
Log-linear improvements (% per annum) in mortality and incidence,for males and females aged 40-64, of acute myocardial infarction in Scotland, 1986 to 2000*
Deprivation category Mortality Incidence Mortality Incidence
1 7.4% 4.8% 7.1% 6.8%2 9.1% 4.2% 9.4% 5.5%3 7.6% 3.2% 8.2% 4.4%4 7.4% 3.4% 7.7% 4.0%5 7.4% 4.2% 7.8% 3.6%6 6.6% 3.7% 7.3% 3.8%7 6.8% 5.8% 5.8% 5.9%
all categories 7.5% 4.5% 7.5% 4.8%insured (categories 1 to 3) 8.0% 3.7% 8.4% 5.0%
*Source: Scottish Health and Registrar General Scotland
Males Females

Summary of heart attack trends by deprivation class, Males aged 40 to 64, 1986 to 2000
0.0%
1.0%
2.0%
3.0%
4.0%
5.0%
6.0%
7.0%
8.0%
9.0%
10.0%
1 2 3 4 5 6 7
Deprivation Category
Lo
g-l
inear
imp
rovem
en
t %
per
an
nu
m
Mortality Incidence

Summary of heart attack trends by deprivation class, Males aged 40 to 64, 1986 to 2000
0.0%
1.0%
2.0%
3.0%
4.0%
5.0%
6.0%
7.0%
8.0%
9.0%
10.0%
1 2 3 4 5 6 7
Deprivation Category
Lo
g-l
inea
r im
pro
vem
ent
% p
er a
nn
um
Mortality Incidence

Brief interpretation of heart attack trends
Male Female
Mortality Positive correlation between affluent and deprived groups
Positive correlation between affluent and deprived groups
Incidence Less clear. Weak negative correlation where deprived group has higher improvement
Postive correlation between affluent and deprived groups except for categories 6 and 7

Variations by deprivation class
Why split by deprivation class? Data sources used Explanation of deprivation scores and categories Overall trends by gender
Heart attack Stroke
Conclusion

Trends in incidence rate of first stroke for males aged 40 to 64 in Scotland, as a % of 1981 value, 1981 to 2000
60%
70%
80%
90%
100%
110%
120%
130%
140%
150%
160%
170%
180%
190%
1981 1982 1983 1984 1985 1986 1987 1988 1989 1990 1991 1992 1993 1994 1995 1996 1997 1998 1999 2000
0-39 40-64 65+

Trends in incidence rate of first stroke for males aged 40 to 64 in Scotland, as a % of 1981 value, 1981 to 2000
60%
70%
80%
90%
100%
110%
120%
130%
140%
150%
160%
170%
180%
190%
200%
1981 1982 1983 1984 1985 1986 1987 1988 1989 1990 1991 1992 1993 1994 1995 1996 1997 1998 1999 2000
40-64

Trends in incidence rate of first stroke for males aged 40 to 64 in Scotland, as a % of 1981 value, 1981 to 2000
60%
80%
100%
120%
140%
160%
180%
200%
1981 1983 1985 1987 1989 1991 1993 1995 1997 1999
1 2 3 4 5 6 7 overall

Trends in incidence rate of first stroke for males aged 40 to 64 in Scotland, per 100000 of Population, 1981 to 2000
0
100
200
300
400
500
600
700
1981 1982 1983 1984 1985 1986 1987 1988 1989 1990 1991 1992 1993 1994 1995 1996 1997 1998 1999 2000
1 2 3 4 5 6 7 9

Trends in incidence rate of first stroke for males aged 40 to 64 in Scotland, per 100000 of Population, 1986 to 2000
0
100
200
300
400
500
600
700
1986 1987 1988 1989 1990 1991 1992 1993 1994 1995 1996 1997 1998 1999 2000
Insured Population best worst

Trends in incidence rate of first stroke for females aged 40 to 64 in Scotland, per 100000 of Population, 1986 to 2000
0
100
200
300
400
500
600
700
1986 1987 1988 1989 1990 1991 1992 1993 1994 1995 1996 1997 1998 1999 2000
Insured Population best worst

Trends in mortality rate by stroke for males aged 40 to 64 in Scotland, per 100000 of Population, 1986 to 2000
0
20
40
60
80
100
120
140
1986 1987 1988 1989 1990 1991 1992 1993 1994 1995 1996 1997 1998 1999 2000
Insured Population best worst

Trends in mortality rate by stroke for females aged 40 to 64 in Scotland, per 100000 of Population, 1986 to 2000
0
20
40
60
80
100
120
140
1986 1987 1988 1989 1990 1991 1992 1993 1994 1995 1996 1997 1998 1999 2000
Insured Population best worst
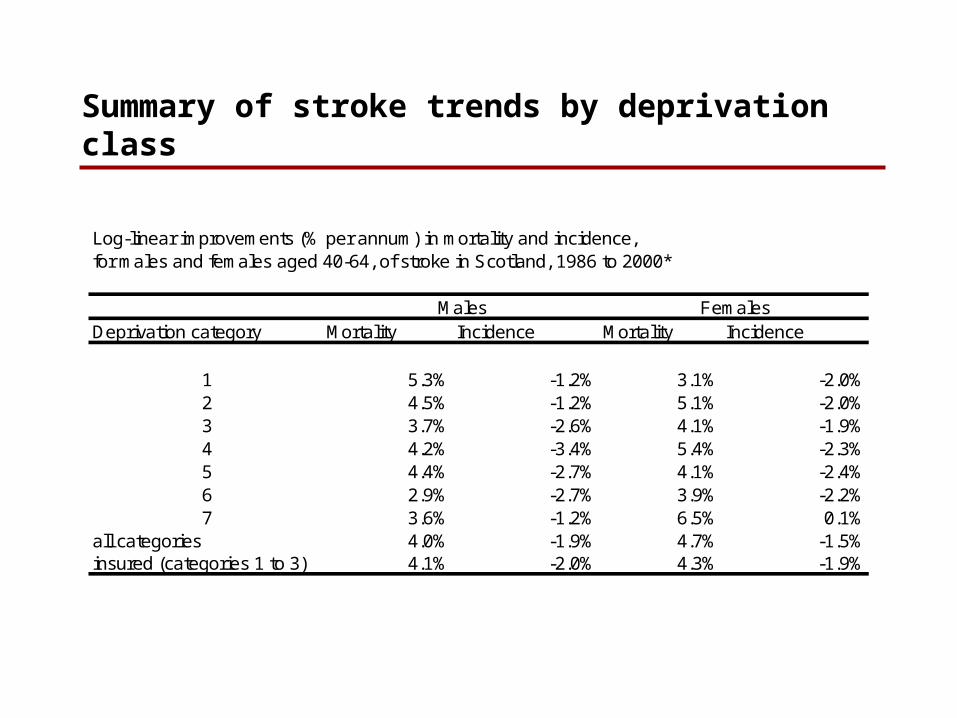
Summary of stroke trends by deprivation class
Log-linear improvements (% per annum) in mortality and incidence,for males and females aged 40-64, of stroke in Scotland, 1986 to 2000*
Deprivation category Mortality Incidence Mortality Incidence
1 5.3% -1.2% 3.1% -2.0%2 4.5% -1.2% 5.1% -2.0%3 3.7% -2.6% 4.1% -1.9%4 4.2% -3.4% 5.4% -2.3%5 4.4% -2.7% 4.1% -2.4%6 2.9% -2.7% 3.9% -2.2%7 3.6% -1.2% 6.5% 0.1%
all categories 4.0% -1.9% 4.7% -1.5%insured (categories 1 to 3) 4.1% -2.0% 4.3% -1.9%
Males Females

Summary of stroke trends by deprivation class, Males aged 40 to 64, 1986 to 2000
-4.0%
-3.0%
-2.0%
-1.0%
0.0%
1.0%
2.0%
3.0%
4.0%
5.0%
6.0%
1 2 3 4 5 6 7
Deprivation Category
Lo
g-l
inear
imp
rovem
en
t %
per
an
nu
m
Mortality Incidence

Summary of stroke trends by deprivation class, Females aged 40 to 64, 1986 to 2000
-3.0%
-2.0%
-1.0%
0.0%
1.0%
2.0%
3.0%
4.0%
5.0%
6.0%
7.0%
1 2 3 4 5 6 7
Deprivation Category
Lo
g-l
inear
imp
rovem
en
t %
per
an
nu
m
Mortality Incidence

Brief interpretation of stroke trends
Male Female
Mortality Positive correlation between affluent and
deprived groups
Weak negative correlation between
affluent and deprived groups
Incidence Weak positive correlation between
affluent and deprived groups
Weak postive correlation between
affluent and deprived groups

Contents Slide
Background and set the scene Variations by deprivation category Variations by ICD code Impact of smoking Future influences on rates Project population incidence rates
Variation by ICD code
Why? Understanding of overall rate Explain which components have influenced overall trend
Heart attack ICD9 code 410 Unstable angina ICD9 code 413
Stroke ICD9 codes 430 to 437 excluding 435

Variation by ICD code
Why? Understanding of overall rate Explain which components have influenced overall trend
Heart attack ICD9 code 410 Unstable angina ICD9 code 413
Stroke ICD9 codes 430 to 437 excluding 435

Trend in first incidence rate for males aged 40 to 64 by ICD code 410 and 413, per 100000 of Population, 1981 to 2000
0
100
200
300
400
500
600
700
800
900
410 (Heart attack) 413 (Unstable Angina)

Trend in first incidence rate for females aged 40 to 64 by ICD code 410 and 413, per 100000 of Population, 1981 to 2000
0
100
200
300
400
500
600
700
800
900
410 (Heart attack) 413 (Unstable Angina)

Variation by ICD code
Why? Understanding of overall rate Explain which components have influenced overall trend
Heart attack ICD9 code 410 Unstable angina ICD9 code 413
Stroke ICD9 codes 430 to 437 excluding 435

Trend in first incidence rate for males aged 40 to 64 by ICD codes 430 to 437 excluding 435, per 100000 of Population,
1981 to 2000
0
50
100
150
200
250
300
350
1981 1982 1983 1984 1985 1986 1987 1988 1989 1990 1991 1992 1993 1994 1995 1996 1997 1998 1999 2000
year
Rate
of
Incid
en
ce p
er
100,0
00 o
f p
op
ula
tio
n
430-437 excluding 435

Trend in first incidence rate for males aged 40 to 64 by ICD codes 430 to 437 excluding 435, 1981 to 2000
0
50
100
150
200
250
300
350
1981 1982 1983 1984 1985 1986 1987 1988 1989 1990 1991 1992 1993 1994 1995 1996 1997 1998 1999 2000
year
Inci
den
ce r
ate
per
100
,000
of
po
pu
lati
on
430 431 432 433 434 436 (Acute stroke) 437

Trend in first incidence rate for females aged 40 to 64 by ICD code 430 to 437 excluding 435, per 100000 of Population,
1981 to 2000
0
50
100
150
200
250
300
350
1981 1982 1983 1984 1985 1986 1987 1988 1989 1990 1991 1992 1993 1994 1995 1996 1997 1998 1999 2000
year
Rate
of
Incid
en
ce p
er
100,0
00 o
f p
op
ula
tio
n
430-437 excluding 435

Trend in first incidence rate for females aged 40 to 64 by ICD code 430 to 437 excluding 435, per 100000 of Population,
1981 to 2000
0
50
100
150
200
250
300
350
1981 1982 1983 1984 1985 1986 1987 1988 1989 1990 1991 1992 1993 1994 1995 1996 1997 1998 1999 2000
year
Incid
en
ce r
ate
per
100,0
00 o
f p
op
ula
tio
n
430 431 432 433 434 436 (Acute stroke) 437

Summary of variation by ICD code
Heart attack: ICD 410 is improving over time (Male 3.6% p.a., Female 3.3%) ICD 413 is deteriorating (Male 5.2% p.a., Female 6.2% p.a.) Troponins?
Stroke Large component ICD 436 is improving over time (Male 5.2% p.a.,
Female 6.2%) Remaining components ICD 430, 431,432,433, 434, 437 overall are
deteriorating over time (Male 5.7% p.a., Female 4.3% p.a.) Overall deterioration (Male 1.9%, Female 1.5%) Overall flat trend over 1980’s, deterioration over 1990’s Future?

Contents Slide
Background and set the scene Variations by deprivation category Variations by ICD code Impact of smoking Future influences on rates Project population incidence rates

Contents Slide
Introduction
Variations by deprivation category
Variations by ICD code
Impact of smoking
Future influences on rates
Projecting population incidence rates

Impact of Smoking - “Ideal” Smoking Model
ix (pop) = ix(ns)* p(ns) + ix (s) * p(s) +ix(ex) * p(ex)
ix (pop) = ix(ns)* p(ns) + ix (s) * p(s) + t ix(ex t) * p(ex t)
…..
…..

Impact of Smoking - Data Available
Epidemiological evidence on smoking Case control studies, prospective cohort studies etc
Wide range of results results become even more volatile if looking for age specific or
duration smoked/quit specific results
often look at impact on mortality not incidence
cause investigated is often not an exact match e.g. coronary heart disease and not acute myocardial infarction
usually smoking status is only investigated at the start of the study period
Simplify and/or use proxies
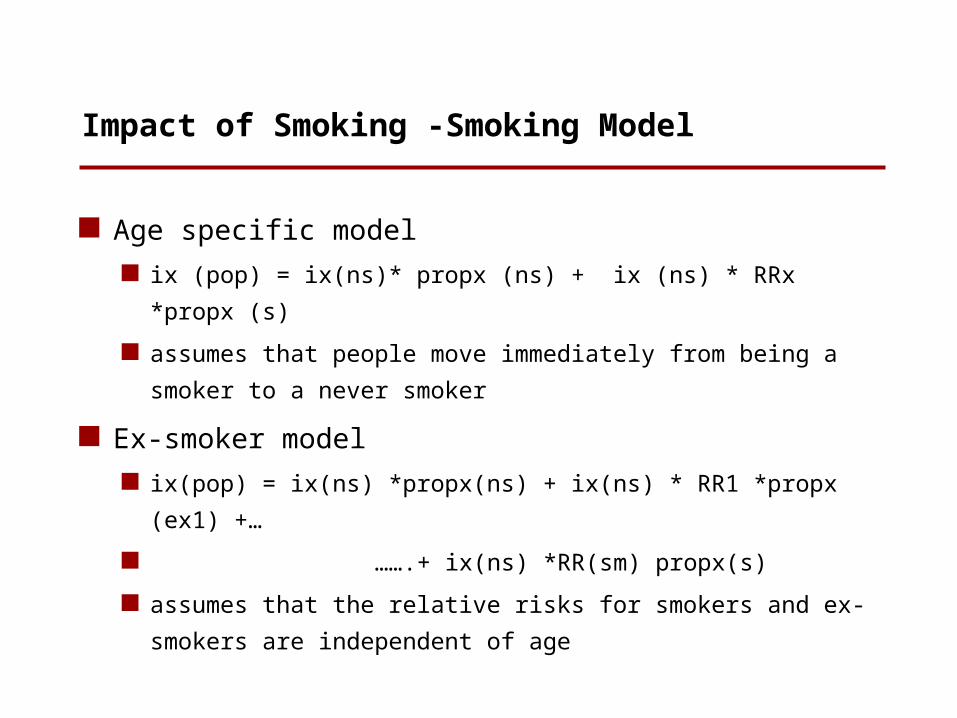
Impact of Smoking -Smoking Model
Age specific model
ix (pop) = ix(ns)* propx (ns) + ix (ns) * RRx *propx (s)
assumes that people move immediately from being a
smoker to a never smoker
Ex-smoker model
ix(pop) = ix(ns) *propx(ns) + ix(ns) * RR1 *propx (ex1) +…
…….+ ix(ns) *RR(sm) propx(s)
assumes that the relative risks for smokers and ex-smokers
are independent of age
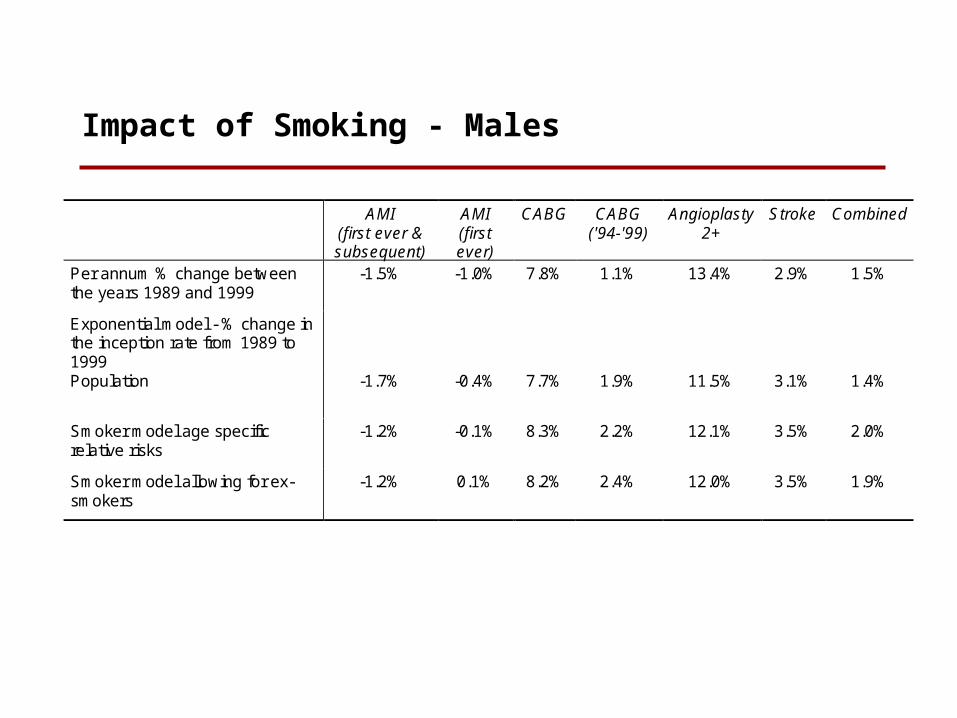
Impact of Smoking - Males
AMI(first ever &subsequent)
AMI(firstever)
CABG CABG('94-'99)
Angioplasty2+
Stroke Combined
Per annum % change betweenthe years 1989 and 1999
-1.5% -1.0% 7.8% 1.1% 13.4% 2.9% 1.5%
Exponential model - % change inthe inception rate from 1989 to1999Population -1.7% -0.4% 7.7% 1.9% 11.5% 3.1% 1.4%
Smoker model age specificrelative risks
-1.2% -0.1% 8.3% 2.2% 12.1% 3.5% 2.0%
Smoker model allowing for ex-smokers
-1.2% 0.1% 8.2% 2.4% 12.0% 3.5% 1.9%

Trends in Coronary Artery Bypass Incidence All Ages Combined
80%
130%
180%
230%
280%
330%
89/89 90/89 91/89 92/89 93/89 94/89 95/89 96/89 97/89 98/89 99/89
Females
Males

Impact of Smoking - Females
AMI(first ever &subsequent)
AMI(firstever)
CABG CABG('94-'99)
Angioplasty2+
Stroke Combined
Per annum % change betweenthe years 1989 and 1999
-1.7% -1.2% 10.7% 2.5% 16.3% 2.5% 1.2%
Exponential model - % change inthe inception rate from 1989 to1999Population -2.0% -0.6% 10.5% 3.0% 14.0% 2.7% 1.3%
Smoker model age specificrelative risks
-1.8% -0.3% 10.7% 3.2% 14.2% 2.9% 1.5%
Smoker model allowing for ex-smokers
-1.8% -0.2% 10.7% 3.4% 14.2% 2.9% 1.4%

Males - Trends in AMI (first and subsequent) 1989-1999 Percentage Change p.a.
-5%
-4%
-3%
-2%
-1%
0%
1%
2%
3%
4%
5%
25_29 35_39 45_49 55_59 65_69 75_79 85_89

Females - Trends in AMI (first and subsequent) 1989-1999 Percentage Change p.a.
-5%
-4%
-3%
-2%
-1%
0%
1%
2%
3%
4%
5%
25_29 35_39 45_49 55_59 65_69 75_79 85_89

Contents Slide
Introduction
Variations by deprivation category
Variations by ICD code
Impact of smoking
Future influences on rates
Projecting population incidence rates
Future Influences on Rates
Impact of changing risk factors on incidence
Focus on changes in diagnostic techniques and
potential shocks in incidence
Discussion of impact of troponin on heart attack
incidence
Interpreting trends in stroke incidence and the
potential impact of brain imaging techniques
Troponin and Acute Coronary Syndrome
Number of medical papers available
Generally look at the change in the number of
diagnoses in the spectrum of ACS

Spectrum of Acute Coronary Syndromes
K Fox., Heart; 2000;84;93-100

Troponin and Acute Coronary Syndrome
As might be expected sample sizes quite small
Definitions do not exactly match those used by the
insurance industry
Average age is considerably higher than that of
people who claim for critical illness
Number of medical papers available
Generally look at the change in the number of
diagnoses in the spectrum of ACS
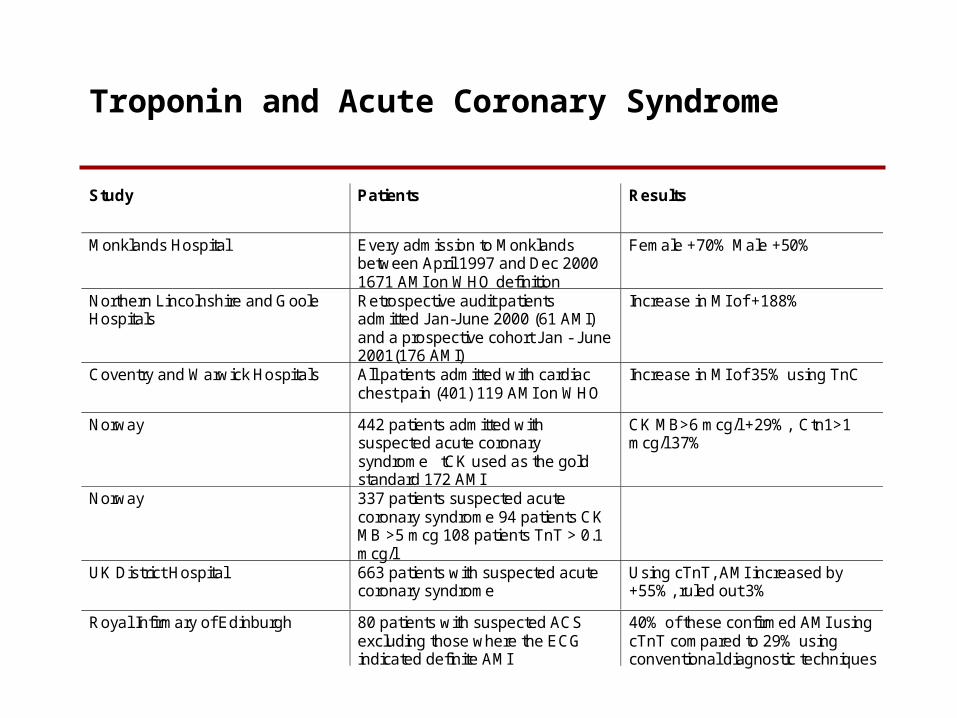
Troponin and Acute Coronary Syndrome
Study Patients Results
Monklands Hospital Every admission to Monklandsbetween April 1997 and Dec 20001671 AMI on WHO definition
Female +70% Male +50%
Northern Lincolnshire and GooleHospitals
Retrospective audit patientsadmitted Jan-June 2000 (61 AMI)and a prospective cohort Jan - June2001(176 AMI)
Increase in MI of +188%
Coventry and Warwick Hospitals All patients admitted with cardiacchest pain (401) 119 AMI on WHO
Increase in MI of 35% using TnC
Norway 442 patients admitted withsuspected acute coronarysyndrome tCK used as the goldstandard 172 AMI
CK MB>6 mcg/l +29%, Ctn1>1mcg/l 37%
Norway 337 patients suspected acutecoronary syndrome 94 patients CKMB >5 mcg 108 patients TnT > 0.1mcg/l
UK District Hospital 663 patients with suspected acutecoronary syndrome
Using cTnT, AMI increased by+55%, ruled out 3%
Royal Infirmary of Edinburgh 80 patients with suspected ACSexcluding those where the ECGindicated definite AMI
40% of these confirmed AMI usingcTnT compared to 29% usingconventional diagnostic techniques

Troponin and Critical Illness
Medical studies give a range of results
Results need careful interpretation before trying to apply
them to critical illness
More AMI being diagnosed but some an acceleration e.g.
subsequent heart attack
coronary artery bypass surgery

Troponin and Critical Illness
Percentage of hospitals where troponin is available
Scotland - 70% (Pell BMJ Vol 324)
England - 60% last year thought to be 70% to 80% this year
No clear consensus amongst cardiologists in the UK on
the definition
New definition not disseminated until September 2000 so
no effect on the data currently published

Trends in Heart Attack Incidence All Ages Combined
80%
85%
90%
95%
100%
105%
89/89 90/89 91/89 92/89 93/89 94/89 95/89 96/89 97/89 98/89 99/89
Females
Males

Stroke - Identifying Trends
“Stroke mortality is falling in many countries, but it is unclear whether this is due to a fall in stroke incidence, lower case fatality, or some artifact of the collection and analysis of routine mortality data.”
Stroke, A Practical Guide and Management. Warlow et al
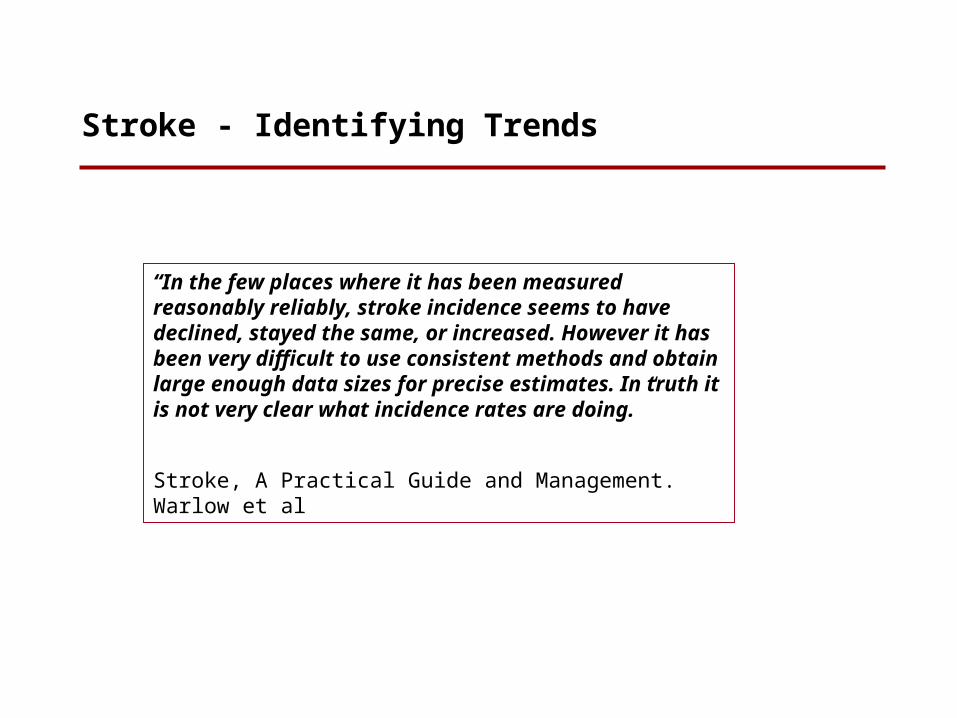
Stroke - Identifying Trends
“In the few places where it has been measured reasonably reliably, stroke incidence seems to have declined, stayed the same, or increased. However it has been very difficult to use consistent methods and obtain large enough data sizes for precise estimates. In truth it is not very clear what incidence rates are doing.”
Stroke, A Practical Guide and Management. Warlow et al

Stroke - HES Data
Patients admitted to hospital generally have more severe strokes
The proportion of all strokes admitted is unknown and
can change over time
Cannot identify first ever strokes
Double counting as patients move from one hospital
service to another
Question mark over change in incidence coinciding with
coding change

Trends in Stroke Incidence All Ages Combined
80%
90%
100%
110%
120%
130%
140%
89/89 90/89 91/89 92/89 93/89 94/89 95/89 96/89 97/89 98/89 99/89
Females
Males

Stroke - Diagnosis
ABI definition of stroke is different to that used by
clinicians and to that used by the WHO
Consequences of, for example, increased MRI scanning
could have a different impact under different definitions
Will policyholders understand the differences?
Milder strokes more often identified?
Patient expectations are rising
Diagnostically more competent
Helped by more sensitive brain imaging

Contents Slide
Introduction
Variations by deprivation category
Variations by ICD code
Impact of smoking
Future influences on rates
Projecting population incidence rates

Population - Projection of Incidence Rates
AMI, CABG, Angio2+ and Stroke
Past TrendsContinue
With Shock for AMI
Males
Population 1.6% 2.4%
Age specific model 2.1% 2.8%
Ex-smoker model 2.1% 2.8%
Females
Population 1.7% 2.3%
Age specific model 2.2% 2.8%
Ex-smoker model 2.0% 2.6%