1 supply chain and cost reduction management. speaker profile – farrah mahoney farrah mahoney is...
TRANSCRIPT
1
Supply Chain and Cost Reduction Management
Speaker Profile – Farrah MahoneyFarrah Mahoney is the Director of Business Development for Healthcare Insights, LLC, which specializes in the teaching and consulting of healthcare financial management issues. She has been with Healthcare Insights, LLC for over 7 years. In addition, Healthcare Insights has developed INSIGHTS, the industry leading management accountability and decision support software solution for the healthcare industry. As part of her responsibilities, Farrah advises clients on best practice reporting and monitoring techniques.
Prior to her role at Healthcare Insights, Farrah spent 7 years working in the finance department of several healthcare providers. These included a 350-bed acute care hospital, as well as long-term acute care providers and a physician group. She holds a Bachelors of Science degree in Accounting and a Master of Business Administration from the University of Southern Indiana.
2
Section Objectives
• Present the reasons why there is a great need and opportunity to reduce non-salary expenses
• Expose the need to manage for increased accountability in the hospital setting
• Identify specific areas of opportunity for rational supply chain expense reductions
3
Supply Chain Management
• Management of the supply chain offers a significant opportunity to reduce expenses
• It is another area where improved profitability can be achieved through overall process improvement and departmental action
4
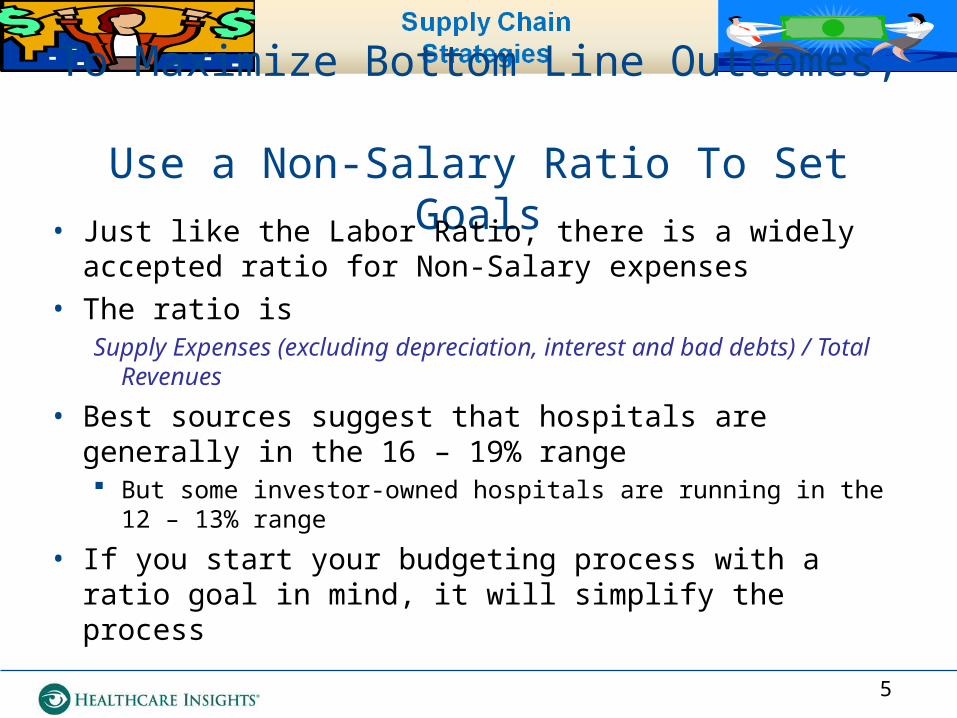
To Maximize Bottom Line Outcomes, Use a Non-Salary Ratio To Set Goals
• Just like the Labor Ratio, there is a widely accepted ratio for Non-Salary expenses
• The ratio isSupply Expenses (excluding depreciation, interest and bad debts) /
Total Revenues
• Best sources suggest that hospitals are generally in the 16 – 19% range But some investor-owned hospitals are running in the 12 – 13%
range
• If you start your budgeting process with a ratio goal in mind, it will simplify the process
5

Supply Chain Metrics
Supply Expense as a Percentage of Total Revenues
EQUATIONS:Supply costs divided by total revenues
• This metric quantifies the total cost of supplies as a percentage of the total revenues recorded by the hospital. It can be used to determine the average supply costs percentage needed to operate the facility.
• The lower the number, the better.• Benchmark information is available (from the Advisory Board) and general values are
within the 16 - 18% range.
6
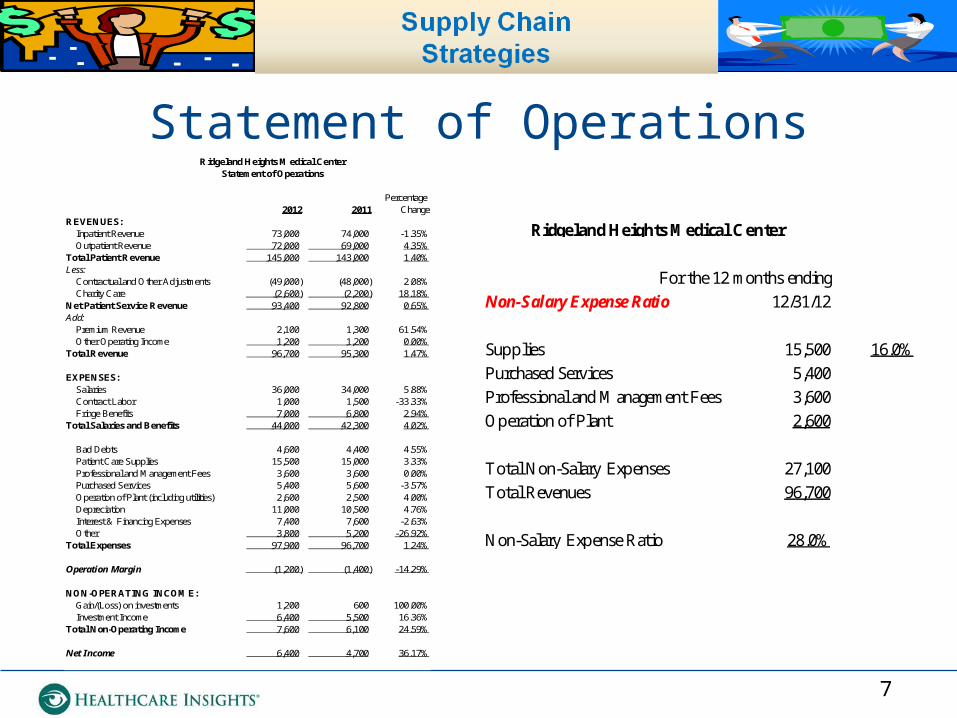
Ridgeland Heights Medical CenterStatement of Operations
Percentage 2012 2011 Change
REVENUES: Inpatient Revenue 73,000 74,000 -1.35% Outpatient Revenue 72,000 69,000 4.35%Total Patient Revenue 145,000 143,000 1.40%Less: Contractual and Other Adjustments (49,000) (48,000) 2.08% Charity Care (2,600) (2,200) 18.18%Net Patient Service Revenue 93,400 92,800 0.65%Add: Premium Revenue 2,100 1,300 61.54% Other Operating Income 1,200 1,200 0.00%Total Revenue 96,700 95,300 1.47%
EXPENSES: Salaries 36,000 34,000 5.88% Contract Labor 1,000 1,500 -33.33% Fringe Benefits 7,000 6,800 2.94%Total Salaries and Benefits 44,000 42,300 4.02%
Bad Debts 4,600 4,400 4.55% Patient Care Supplies 15,500 15,000 3.33% Professional and Management Fees 3,600 3,600 0.00% Purchased Services 5,400 5,600 -3.57% Operation of Plant (including utilities) 2,600 2,500 4.00% Depreciation 11,000 10,500 4.76% Interest & Financing Expenses 7,400 7,600 -2.63% Other 3,800 5,200 -26.92%Total Expenses 97,900 96,700 1.24%
Operation Margin (1,200) (1,400) -14.29%
NON-OPERATING INCOME: Gain/(Loss) on investments 1,200 600 100.00% Investment Income 6,400 5,500 16.36%Total Non-Operating Income 7,600 6,100 24.59%
Net Income 6,400 4,700 36.17%
Statement of Operations
7
For the 12 months ending
Non-Salary Expense Ratio 12/31/12
Supplies 15,500 16.0%
Purchased Services 5,400
Professional and Management Fees 3,600
Operation of Plant 2,600
Total Non-Salary Expenses 27,100
Total Revenues 96,700
Non-Salary Expense Ratio 28.0%
Ridgeland Heights Medical Center
Supply Chain Management Cycle Overview
8
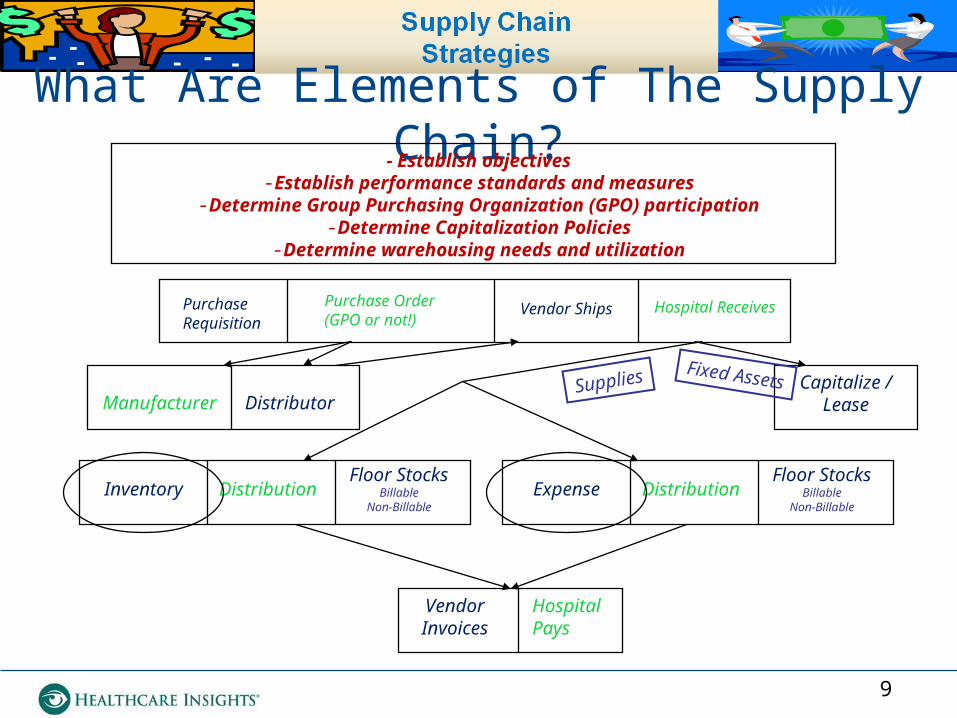
What Are Elements of The Supply Chain?- Establish objectives
-Establish performance standards and measures-Determine Group Purchasing Organization (GPO) participation
-Determine Capitalization Policies-Determine warehousing needs and utilization
Purchase Requisition
Purchase Order(GPO or not!)
Hospital ReceivesVendor Ships
Vendor Invoices
Hospital Pays
Manufacturer Distributor
Inventory DistributionFloor Stocks
BillableNon-Billable
Expense DistributionFloor Stocks
BillableNon-Billable
Supplies Capitalize / Lease
Fixed Assets
9
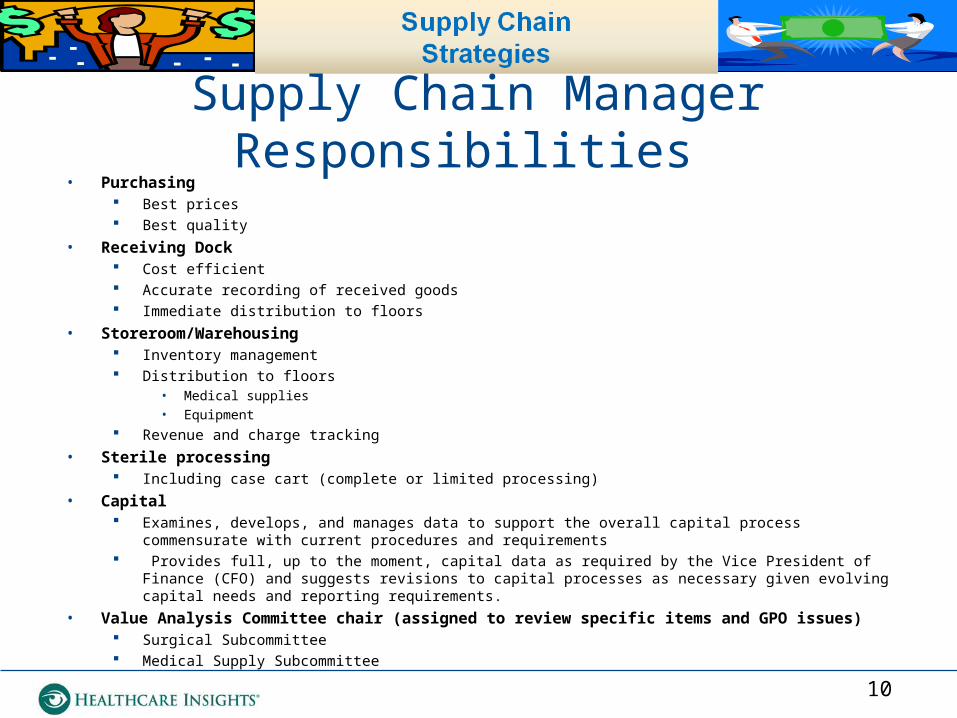
Supply Chain Manager Responsibilities • Purchasing
Best prices Best quality
• Receiving Dock Cost efficient Accurate recording of received goods Immediate distribution to floors
• Storeroom/Warehousing Inventory management Distribution to floors
• Medical supplies• Equipment
Revenue and charge tracking
• Sterile processing Including case cart (complete or limited processing)
• Capital Examines, develops, and manages data to support the overall capital process commensurate with current
procedures and requirements Provides full, up to the moment, capital data as required by the Vice President of Finance (CFO) and suggests
revisions to capital processes as necessary given evolving capital needs and reporting requirements.
• Value Analysis Committee chair (assigned to review specific items and GPO issues) Surgical Subcommittee Medical Supply Subcommittee
10
Which Departments Are Involved in the Supply Chain?
• Purchasing• Receiving • Warehousing (Storeroom)• Sterile Processing• Facilities Management• Accounts Payable, and• Every hospital department and…their staffs
11

Key Steps to Strategic Supply Chain Management
1. Build relationships
2. Align with physicians
3. Practice evidence-based medicine
4. Focus on clinical integration
5. Automate the supply chain
6. Adopt standards
7. Enhance value analysis
8. Think lean
Source: “Strategic Supply Chain Management”, by Lee Ann Jarousse and Chuck Lazar, H&HN Magazine, December 2011
Improvement Opportunities Within
the Supply Chain
13

Improvement Opportunities
• Revenue Enhancements Reduction in lost and late charges Getting Supply Chain Management involved in managed care
contracting
• Expense Reductions Value Analysis Committee and process Improved communications Standardization through formulary and others usage Accounts payable/purchasing audits
14
Improvement Opportunities Example
Banner Health – Supply Chain Blue Book
1. Set a target: Reduce Supply Expenses
2. Identified needs based on current state
3. Determined the intent of the information
4. Established target audience
5. Created a reporting tool for the audience
6. Provided training and established accountability
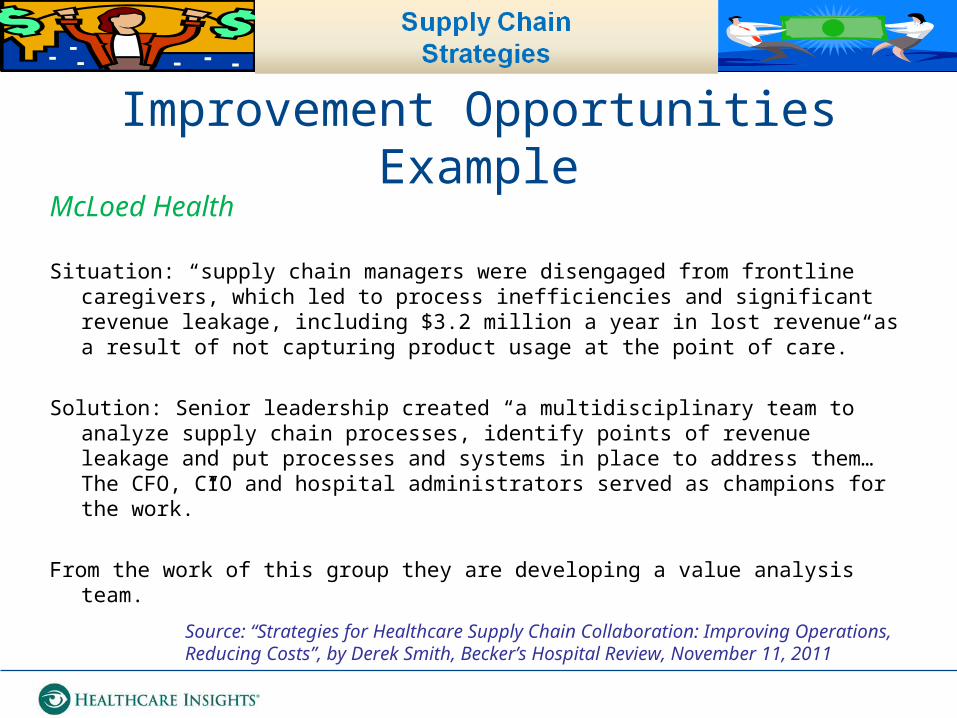
McLoed Health
Situation: “supply chain managers were disengaged from frontline caregivers, which led to process inefficiencies and significant revenue leakage, including $3.2 million a year in lost revenue as a result of not capturing product usage at the point of care.”
Solution: Senior leadership created “a multidisciplinary team to analyze supply chain processes, identify points of revenue leakage and put processes and systems in place to address them…The CFO, CIO and hospital administrators served as champions for the work.”
From the work of this group they are developing a value analysis team.
Improvement Opportunities Example
Source: “Strategies for Healthcare Supply Chain Collaboration: Improving Operations, Reducing Costs”, by Derek Smith, Becker’s Hospital Review, November 11, 2011
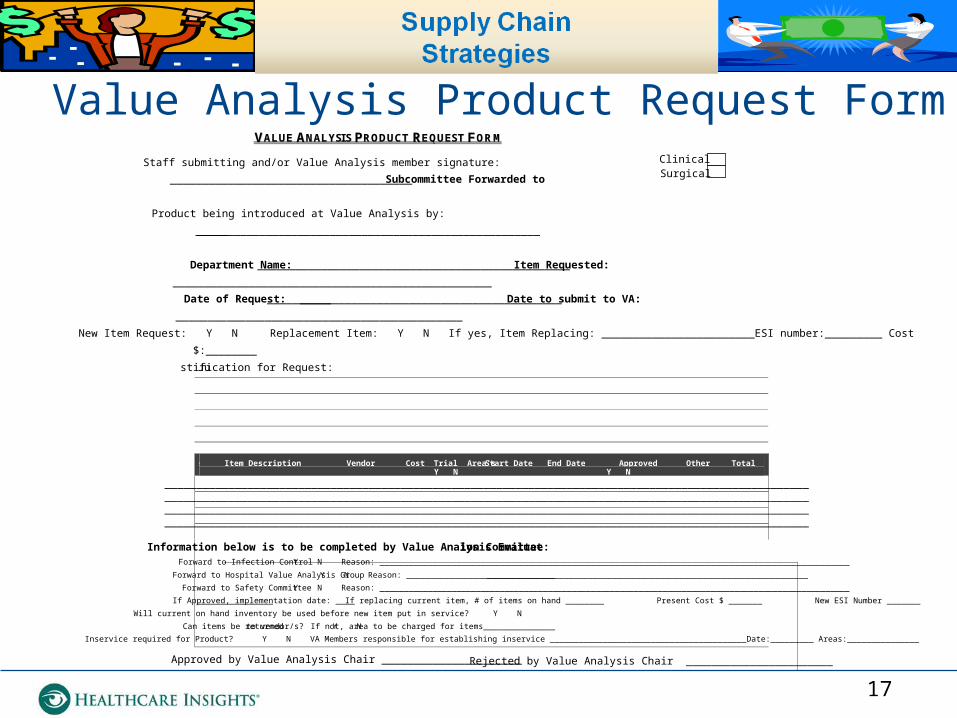
VVAALLUUEE AANNAALLYYSSIISS PPRROODDUUCCTT RREEQQUUEESSTT FFOORRMM
Staff submitting and/or Value Analysis member signature:
______________________________________ Subcommittee Forwarded to
Product being introduced at Value Analysis by:
___________________________________________________________
Department Name: _________________________________________________ Item Requested:
__________________________________________________
Date of Request: ___________________________________________________ Date to submit to VA:
_____________________________________________
New Item Request: Y N Replacement Item: Y N If yes, Item Replacing: ________________________ESI number:_________ Cost
$:________
Justification for Request:
Date Item Description Vendor Cost Trial Area’s Start Date End Date Approved Other Total Y N Y N
Information below is to be completed by Value Analysis Evaluation Committee: Forward to Infection Control Y N Reason: __________________________________________________________________________________________________
Forward to Hospital Value Analysis Group Y N Reason: __________________________________________________________________________________________________
Forward to Safety Committee Y N Reason: __________________________________________________________________________________________________
If Approved, implementation date: ____________________ If replacing current item, # of items on hand ________ Present Cost $ _______ New ESI Number _______
Will current on hand inventory be used before new item put in service? Y N
Can items be returned to vendor/s? Y N If not, area to be charged for items_______________
Inservice required for Product? Y N VA Members responsible for establishing inservice _________________________________________Date:_________ Areas:_______________
ClinicalSurgical
Approved by Value Analysis Chair ______________________ Rejected by Value Analysis Chair _______________________
____________________________________________________________________________________________________________________________________________________________________________________________________________________________________________________________________________________________________________________________________________________________________________________________________________________
Value Analysis Product Request Form
17
Value Analysis Committee – Purpose and Policy
Purpose:
The Value Analysis Committee will establish and monitor a process for the timely, cost-effective, value-oriented acquisition of needed supplies, materials and services.
Policy:
1. Selection and acquisition of all product supplies and equipment must be coordinated through the Materials Management Department and the Medical and Surgical Sub Section Value Analysis Committees.
2. The Director of Materials Management has the authority to direct selection of most products through the Value Analysis Committee; the Director may elect to work directly with sub committee and/or the using department if indicated.
3. Recommendations to add products and/or change vendors must be submitted a request utilizing the “Request for Product Review/Value Analysis Worksheet” to the Director of Materials Management who will review the worksheet and forward to the appropriate committee for review.
4. Products recommended for trial will be coordinated by designated personnel, with the assistance of a designated Materials Management Buyer.
18
Value Analysis Committee – Product Introduction
Product Introduction:
1. Internal. Any member can introduce a new product or bring a product currently in use before the Sub Section Value Analysis Committee for review by requesting a Committee Leader to place it on the agenda for the next meeting once a request form is filled out and submitted.
2. Once the request form has been reviewed by the Director of Materials Management and/or Designee it will be forwarded to the proper sub committee for analysis. Anyone on the hospital staff can bring new products, product changes, and/or complaints about products to the Sub Committee Leader or a member of the Value Analysis Committee. Physician requests for evaluation and trial of a new product are handled in the same manner.
3. External. Representatives of suppliers who wish to introduce their product to the hospital must first present it to the Materials Management Department. If the product merits further investigation, the Materials Management Department will refer it to the Sub Committee Leader. The Sub Committee Leader will refer the item to the committee for consensus of opinion on the merits of the product.
4. A “Request for Product Review/Value Analysis Worksheet” form should be returned by sub committee leader to the Value Analysis Committee for final approval. Implementation of product will be arranged with Sub Committee Leader and a Materials Management Buyer.
19
Value Analysis Committee – Product Survey
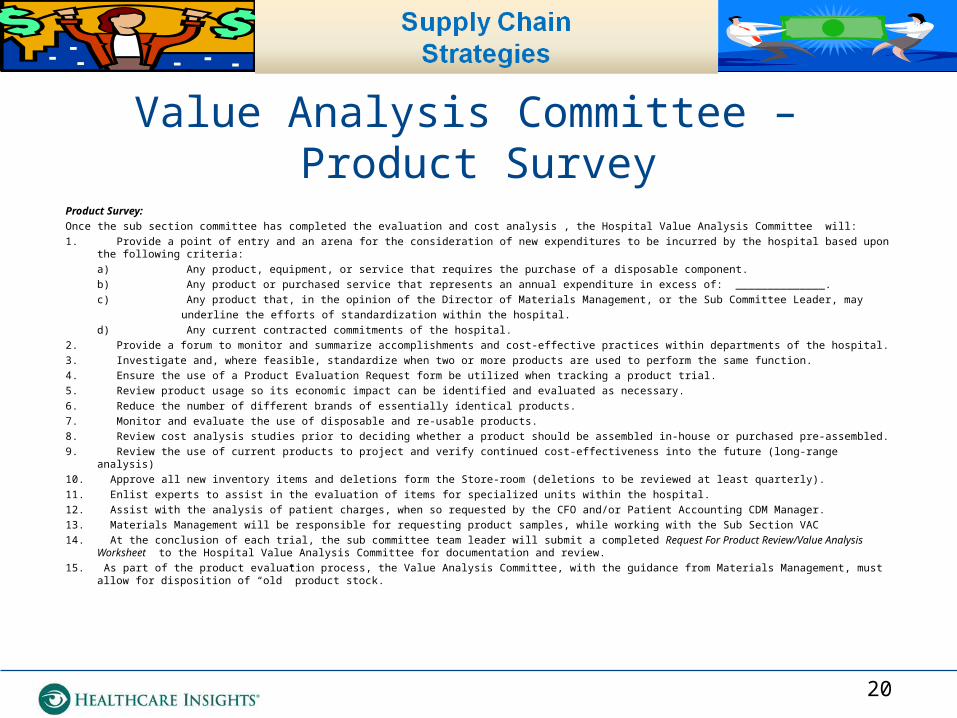
Product Survey:
Once the sub section committee has completed the evaluation and cost analysis , the Hospital Value Analysis Committee will:
1. Provide a point of entry and an arena for the consideration of new expenditures to be incurred by the hospital based upon the following criteria:
a) Any product, equipment, or service that requires the purchase of a disposable component.
b) Any product or purchased service that represents an annual expenditure in excess of: ______________.
c) Any product that, in the opinion of the Director of Materials Management, or the Sub Committee Leader, may
underline the efforts of standardization within the hospital.
d) Any current contracted commitments of the hospital.
2. Provide a forum to monitor and summarize accomplishments and cost-effective practices within departments of the hospital.
3. Investigate and, where feasible, standardize when two or more products are used to perform the same function.
4. Ensure the use of a Product Evaluation Request form be utilized when tracking a product trial.
5. Review product usage so its economic impact can be identified and evaluated as necessary.
6. Reduce the number of different brands of essentially identical products.
7. Monitor and evaluate the use of disposable and re-usable products.
8. Review cost analysis studies prior to deciding whether a product should be assembled in-house or purchased pre-assembled.
9. Review the use of current products to project and verify continued cost-effectiveness into the future (long-range analysis)
10. Approve all new inventory items and deletions form the Store-room (deletions to be reviewed at least quarterly).
11. Enlist experts to assist in the evaluation of items for specialized units within the hospital.
12. Assist with the analysis of patient charges, when so requested by the CFO and/or Patient Accounting CDM Manager.
13. Materials Management will be responsible for requesting product samples, while working with the Sub Section VAC
14. At the conclusion of each trial, the sub committee team leader will submit a completed Request For Product Review/Value Analysis Worksheet to the Hospital Value Analysis Committee for documentation and review.
15. As part of the product evaluation process, the Value Analysis Committee, with the guidance from Materials Management, must allow for disposition of “old” product stock.
20
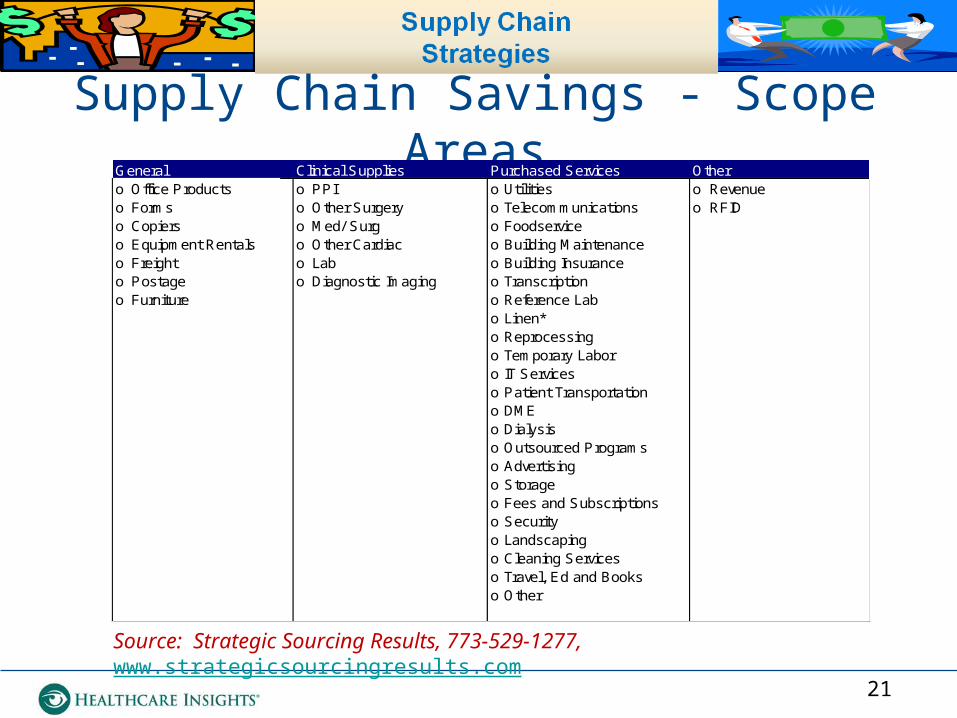
Supply Chain Savings - Scope AreasGeneral Clinical Supplies Purchased Services Othero Office Products o PPI o Utilities o Revenueo Forms o Other Surgery o Telecommunications o RFIDo Copiers o Med/ Surg o Foodserviceo Equipment Rentals o Other Cardiac o Building Maintenanceo Freight o Lab o Building Insuranceo Postage o Diagnostic Imaging o Transcriptiono Furniture o Reference Lab
o Linen*o Reprocessingo Temporary Laboro IT Serviceso Patient Transportationo DMEo Dialysiso Outsourced Programso Advertisingo Storageo Fees and Subscriptionso Securityo Landscapingo Cleaning Serviceso Travel, Ed and Bookso Other
21
Source: Strategic Sourcing Results, 773-529-1277, www.strategicsourcingresults.com
Current Issues That Involve
Saving Money and
Improving Quality
22

Section Objectives
• Recognize where some non-salary expense reductions opportunities are hiding
• Determine how to take actions to improve (reduce) costs in these areas
• Define the implementation steps to use ensuring that the actions are achieved
23
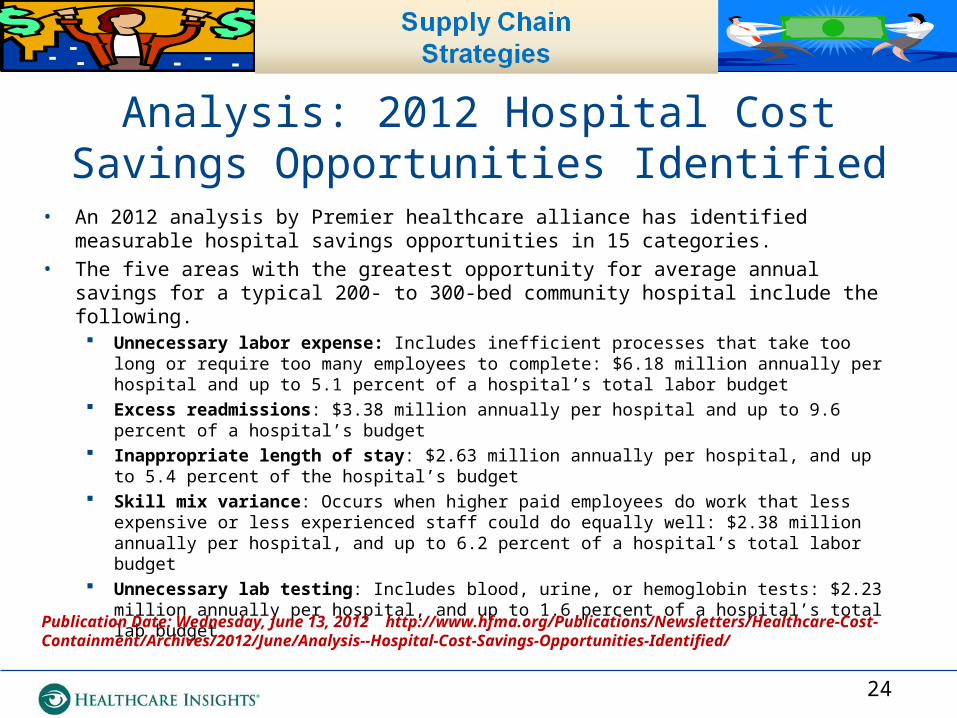
Analysis: 2012 Hospital Cost Savings Opportunities Identified
• An 2012 analysis by Premier healthcare alliance has identified measurable hospital savings opportunities in 15 categories.
• The five areas with the greatest opportunity for average annual savings for a typical 200- to 300-bed community hospital include the following. Unnecessary labor expense: Includes inefficient processes that take too long or require too
many employees to complete: $6.18 million annually per hospital and up to 5.1 percent of a hospital’s total labor budget
Excess readmissions: $3.38 million annually per hospital and up to 9.6 percent of a hospital’s budget
Inappropriate length of stay: $2.63 million annually per hospital, and up to 5.4 percent of the hospital’s budget
Skill mix variance: Occurs when higher paid employees do work that less expensive or less experienced staff could do equally well: $2.38 million annually per hospital, and up to 6.2 percent of a hospital’s total labor budget
Unnecessary lab testing: Includes blood, urine, or hemoglobin tests: $2.23 million annually per hospital, and up to 1.6 percent of a hospital’s total lab budget
24
Publication Date: Wednesday, June 13, 2012 http://www.hfma.org/Publications/Newsletters/Healthcare-Cost-Containment/Archives/2012/June/Analysis--Hospital-Cost-Savings-Opportunities-Identified/
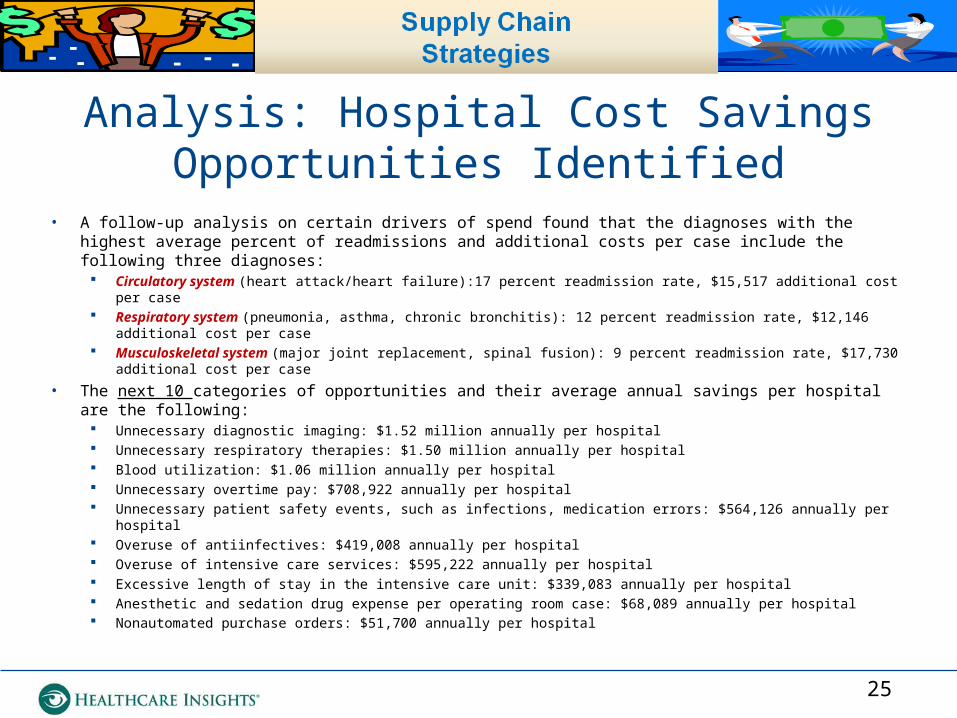
• A follow-up analysis on certain drivers of spend found that the diagnoses with the highest average percent of readmissions and additional costs per case include the following three diagnoses:
Circulatory system (heart attack/heart failure):17 percent readmission rate, $15,517 additional cost per case Respiratory system (pneumonia, asthma, chronic bronchitis): 12 percent readmission rate, $12,146
additional cost per case Musculoskeletal system (major joint replacement, spinal fusion): 9 percent readmission rate, $17,730
additional cost per case
• The next 10 categories of opportunities and their average annual savings per hospital are the following:
Unnecessary diagnostic imaging: $1.52 million annually per hospital Unnecessary respiratory therapies: $1.50 million annually per hospital Blood utilization: $1.06 million annually per hospital Unnecessary overtime pay: $708,922 annually per hospital Unnecessary patient safety events, such as infections, medication errors: $564,126 annually per hospital Overuse of antiinfectives: $419,008 annually per hospital Overuse of intensive care services: $595,222 annually per hospital Excessive length of stay in the intensive care unit: $339,083 annually per hospital Anesthetic and sedation drug expense per operating room case: $68,089 annually per hospital Nonautomated purchase orders: $51,700 annually per hospital
25
Analysis: Hospital Cost Savings Opportunities Identified
Healthcare CEOs Develop Checklist to Save Money and Improve Quality
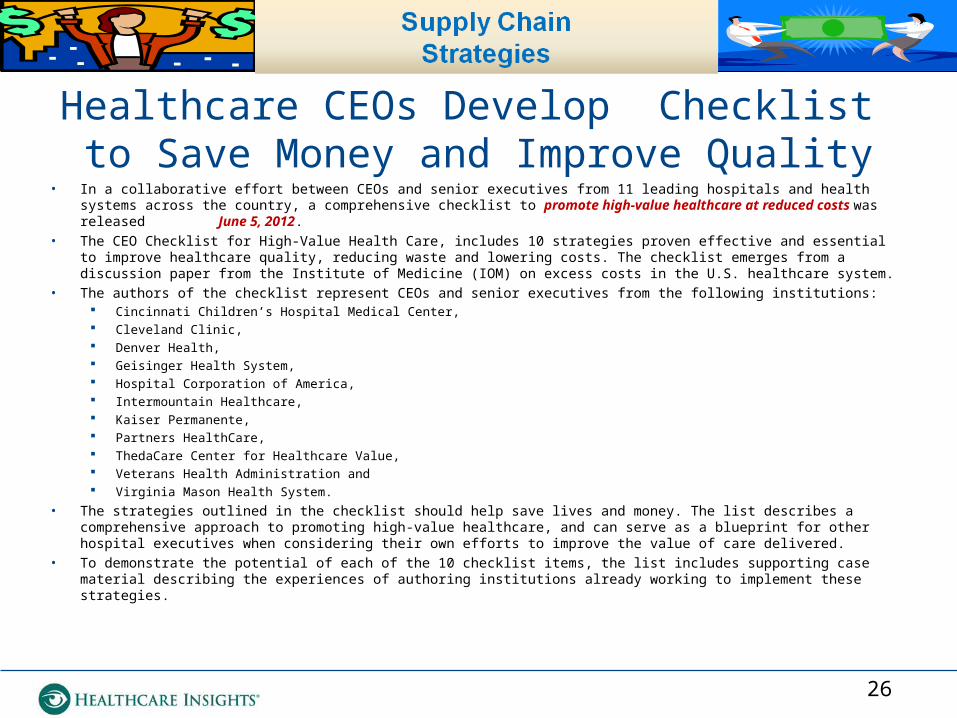
• In a collaborative effort between CEOs and senior executives from 11 leading hospitals and health systems across the country, a comprehensive checklist to promote high-value healthcare at reduced costs was released June 5, 2012.
• The CEO Checklist for High-Value Health Care, includes 10 strategies proven effective and essential to improve healthcare quality, reducing waste and lowering costs. The checklist emerges from a discussion paper from the Institute of Medicine (IOM) on excess costs in the U.S. healthcare system.
• The authors of the checklist represent CEOs and senior executives from the following institutions: Cincinnati Children’s Hospital Medical Center, Cleveland Clinic, Denver Health, Geisinger Health System, Hospital Corporation of America, Intermountain Healthcare, Kaiser Permanente, Partners HealthCare, ThedaCare Center for Healthcare Value, Veterans Health Administration and Virginia Mason Health System.
• The strategies outlined in the checklist should help save lives and money. The list describes a comprehensive approach to promoting high-value healthcare, and can serve as a blueprint for other hospital executives when considering their own efforts to improve the value of care delivered.
• To demonstrate the potential of each of the 10 checklist items, the list includes supporting case material describing the experiences of authoring institutions already working to implement these strategies.
26
Healthcare CEOs Develop Checklist to Save Money and Improve Quality
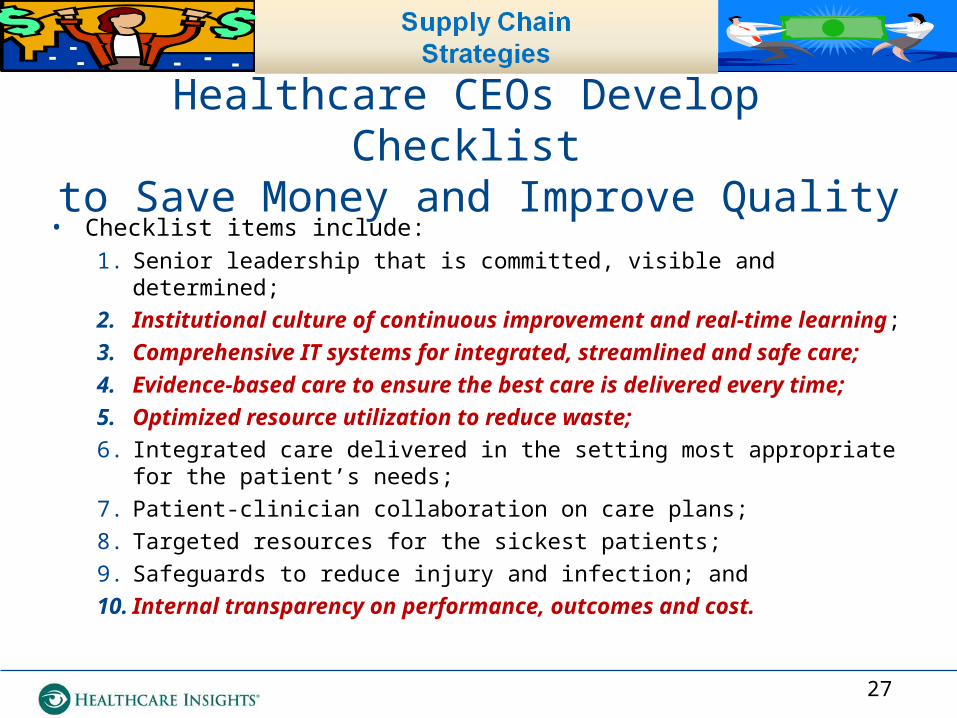
• Checklist items include:1. Senior leadership that is committed, visible and determined;
2. Institutional culture of continuous improvement and real-time learning;
3. Comprehensive IT systems for integrated, streamlined and safe care;
4. Evidence-based care to ensure the best care is delivered every time;
5. Optimized resource utilization to reduce waste;
6. Integrated care delivered in the setting most appropriate for the patient’s needs;
7. Patient-clinician collaboration on care plans;
8. Targeted resources for the sickest patients;
9. Safeguards to reduce injury and infection; and
10. Internal transparency on performance, outcomes and cost.
27
HFMA Leadership Magazine2012 Most Read Articles
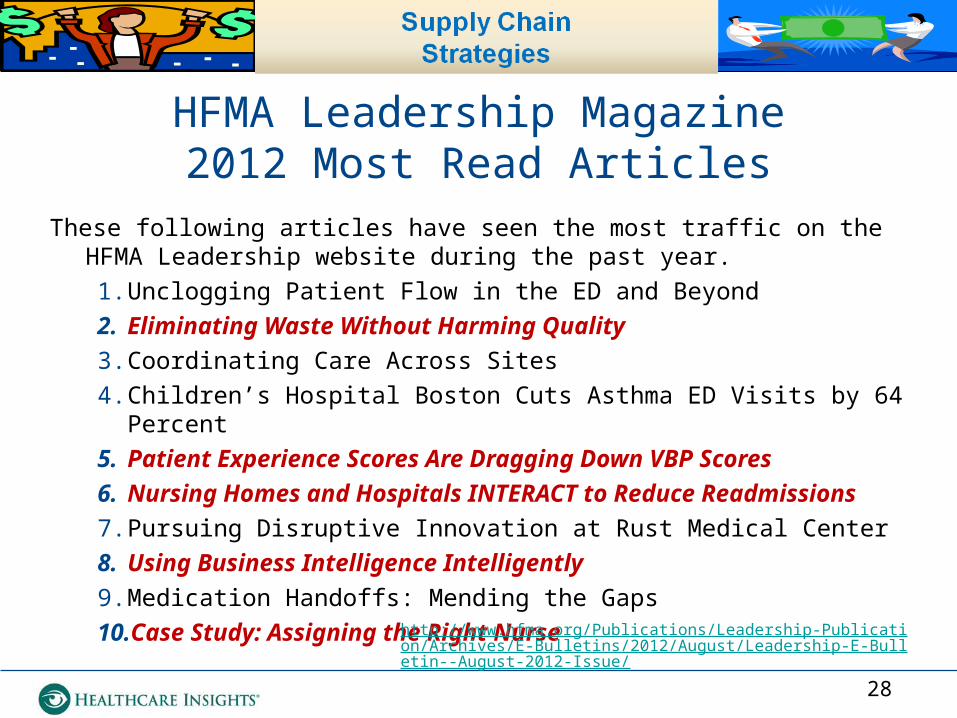
These following articles have seen the most traffic on the HFMA Leadership website during the past year.
1. Unclogging Patient Flow in the ED and Beyond
2. Eliminating Waste Without Harming Quality
3. Coordinating Care Across Sites
4. Children’s Hospital Boston Cuts Asthma ED Visits by 64 Percent
5. Patient Experience Scores Are Dragging Down VBP Scores
6. Nursing Homes and Hospitals INTERACT to Reduce Readmissions
7. Pursuing Disruptive Innovation at Rust Medical Center
8. Using Business Intelligence Intelligently
9. Medication Handoffs: Mending the Gaps
10.Case Study: Assigning the Right Nurse
28
http://www.hfma.org/Publications/Leadership-Publication/Archives/E-Bulletins/2012/August/Leadership-E-Bulletin--August-2012-Issue/
8 Waste Areas Driving Healthcare Costs• There's a tremendous amount of waste occurring in the healthcare industry. In order to
address that waste, organizations are moving to lean management because it exposes what and where these wastes are and rethinks the way work is done via value streams.
• Most providers are set up by departments, or vertical silos. In the case of manufacturing, it's products that traverse these departments, from receiving an order to collecting the money for it. In healthcare, what traverses departments are the patients.
• Tracking patients horizontally through a healthcare value stream changes the way you think about what's value-added and what's not said Marc Hafer, author of the book Simpler Healthcare and CEO of Simpler, a firm globally dedicated to lean application, techniques and transformation in healthcare. "When you reconstruct patient flow through an experience at a clinic and you think horizontally... that's when you see all the waste there really is," he said.
• Hafer shared with Healthcare Finance News the eight different types of waste that inhibit patient flow, add cost, increase poor quality and infection and decrease patient and clinician satisfaction. "
29
August 14, 2012 | Steff Deschenes, New Media Producer, Healthcare Finance News http://www.healthcarefinancenews.com/news/8-kinds-waste-driving-healthcare-costs?topic=04,14,22,25,24

Non-Value Added Healthcare Costs1. Too much Transportation – Patients and Equipment
2. Excess Inventory – Pharmaceuticals, Other supplies, Patient waiting
3. Unnecessary Motions – Ergonomic issues
4. Waiting – Clinicians, Patients, Managers
5. Overproducing – Departmental miscommunication / Repetitive testing
6. Processing Waste – Unused efforts / Bad Reporting not used
7. Defects – Hospital Acquired Infections, Incomplete Medical Records, Bad Registrations
8. Unused Human Potential – Redesigning work for optimal outcomes
30
Nonprofit Hospitals Must Do More With Less
• Moody's Investors Service said recently that in order for nonprofit hospitals to survive the "transition period" to less Medicare reimbursement, they will have to drastically curtail free or discounted services offered to lower-income patients.
• The ratings firm said in its May 9 report that in the face of tightened federal funding, nonprofit hospitals "face an imperative to deliver higher-quality service with lower reimbursement rates per unit of service."
• Moody's has a negative outlook for the sector and expects the number of ratings downgrades to outpace the number of upgrades this year.
• Hospitals positioned to survive the funding drought are looking for new areas to cut beyond where they cut spending during the last recession.
• Moody's said that hospitals are also using financial models to gauge future gaps and are creating economies of scale through partnerships as a way to cut costs. From Nonprofit U.S. Hospitals to Do More With Less -- Moody's
Reuters (05/09/12)
31
Action Items
• Understand the elements of the supply chain and other non-salary costs so that informed decisions can be made
• Make a conscious and concerted effort to recognize the many areas of opportunities for supply chain cost improvements
• Use Supply Chain and other non-salary metrics to set goals and monitor outcomes
• Involve your physicians in supply chain improvement efforts Make sure appropriate and effective information is available Be firm about achieving improvements
• Establish a Value Analysis committee if it currently does not exist• Determine how to improve Value Analysis committee outcomes if one
already exists
32

Conclusion
• There are untold millions of dollars being misspent within a hospital’s supply chain
• Significant opportunities exist to reduce overall supply chain expenditures by up to 30%
• Identifying the most likely areas of cost reduction opportunities is not that difficult and needs to be undertaken by hospitals for good management purposes
• Enlisting the assistance of the physicians will be essential to maximizing reduction opportunities
33