1q11 earnings presentation final
TRANSCRIPT
F I N A N C I A L R E S U L T S
1Q11
April 13, 2011
1Q11
1Q11 Financial highlights
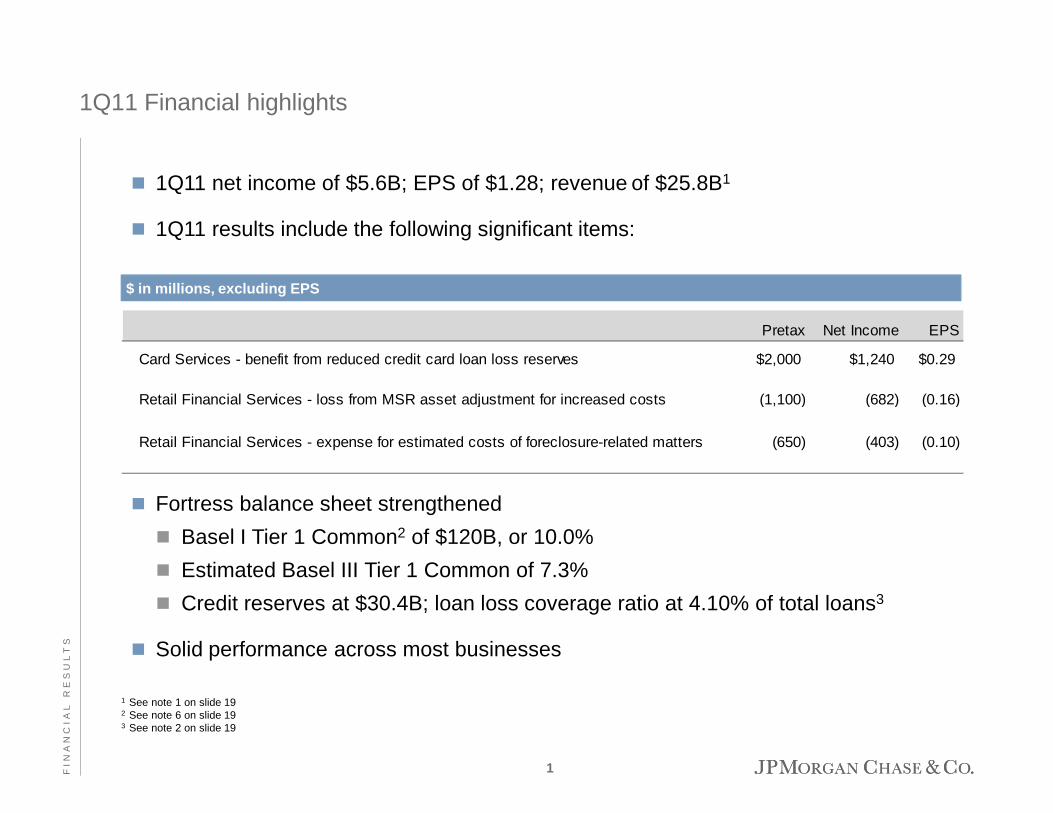
$ in millions, excluding EPS
Pretax Net Income EPS
Card Services - benefit from reduced credit card loan loss reserves $2,000 $1,240 $0.29
Retail Financial Services - loss from MSR asset adjustment for increased costs (1,100) (682) (0.16)
� 1Q11 net income of $5.6B; EPS of $1.28; revenue of $25.8B1
� 1Q11 results include the following significant items:
1 See note 1 on slide 192 See note 6 on slide 193 See note 2 on slide 19
Retail Financial Services - loss from MSR asset adjustment for increased costs (1,100) (682) (0.16)
Retail Financial Services - expense for estimated costs of foreclosure-related matters (650) (403) (0.10)
� Fortress balance sheet strengthened
� Basel I Tier 1 Common2 of $120B, or 10.0%
� Estimated Basel III Tier 1 Common of 7.3%
� Credit reserves at $30.4B; loan loss coverage ratio at 4.10% of total loans3
� Solid performance across most businesses
1FIN
AN
CIA
LR
ES
UL
TS
1Q11 Financial results1
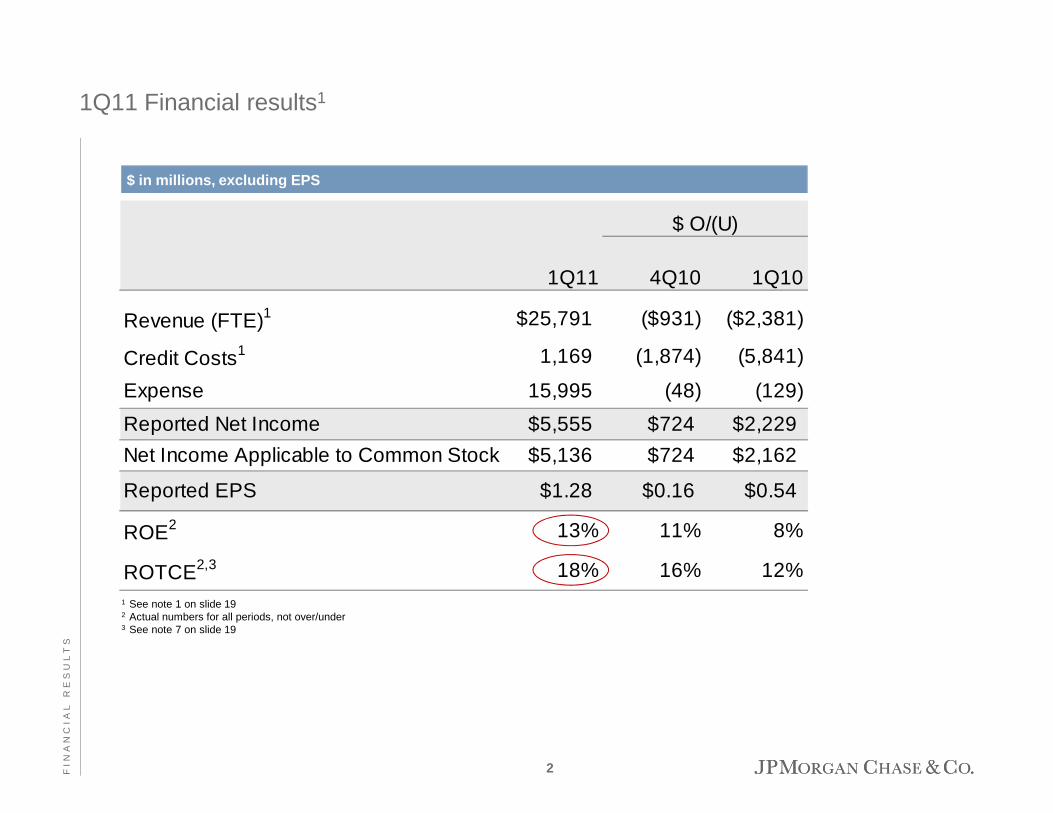
$ in millions, excluding EPS
1Q11 4Q10 1Q10
Revenue (FTE)1 $25,791 ($931) ($2,381)
Credit Costs1 1,169 (1,874) (5,841)
Expense 15,995 (48) (129)
$ O/(U)
1 See note 1 on slide 192 Actual numbers for all periods, not over/under3 See note 7 on slide 19
Reported Net Income $5,555 $724 $2,229
Net Income Applicable to Common Stock $5,136 $724 $2,162
Reported EPS $1.28 $0.16 $0.54
ROE2 13% 11% 8%
ROTCE2,3 18% 16% 12%
2FIN
AN
CIA
LR
ES
UL
TS
Investment Bank1
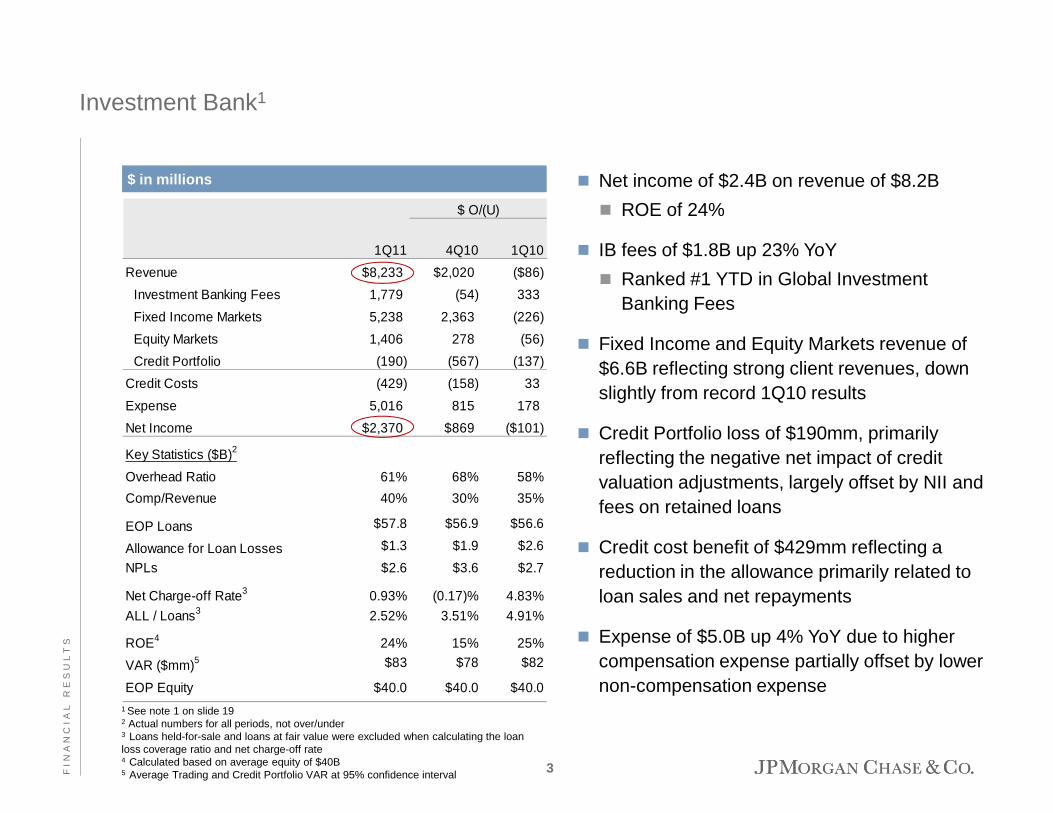
$ in millions
1Q11 4Q10 1Q10
Revenue $8,233 $2,020 ($86)
Investment Banking Fees 1,779 (54) 333
Fixed Income Markets 5,238 2,363 (226)
Equity Markets 1,406 278 (56)
Credit Portfolio (190) (567) (137)
Credit Costs (429) (158) 33
Expense 5,016 815 178
$ O/(U)
� Net income of $2.4B on revenue of $8.2B
� ROE of 24%
� IB fees of $1.8B up 23% YoY
� Ranked #1 YTD in Global Investment Banking Fees
� Fixed Income and Equity Markets revenue of $6.6B reflecting strong client revenues, down slightly from record 1Q10 results
1 See note 1 on slide 192 Actual numbers for all periods, not over/under3 Loans held-for-sale and loans at fair value were excluded when calculating the loan loss coverage ratio and net charge-off rate4 Calculated based on average equity of $40B 5 Average Trading and Credit Portfolio VAR at 95% confidence interval
Expense 5,016 815 178
Net Income $2,370 $869 ($101)
Key Statistics ($B)2
Overhead Ratio 61% 68% 58%
Comp/Revenue 40% 30% 35%
EOP Loans $57.8 $56.9 $56.6
Allowance for Loan Losses $1.3 $1.9 $2.6
NPLs $2.6 $3.6 $2.7
Net Charge-off Rate3 0.93% (0.17)% 4.83%
ALL / Loans3 2.52% 3.51% 4.91%
ROE4 24% 15% 25%
VAR ($mm)5 $83 $78 $82
EOP Equity $40.0 $40.0 $40.0
� Credit Portfolio loss of $190mm, primarily reflecting the negative net impact of credit valuation adjustments, largely offset by NII and fees on retained loans
� Credit cost benefit of $429mm reflecting a reduction in the allowance primarily related to loan sales and net repayments
� Expense of $5.0B up 4% YoY due to higher compensation expense partially offset by lower non-compensation expense
3FIN
AN
CIA
LR
ES
UL
TS
1Q11 4Q10 1Q10
Retail Financial Services
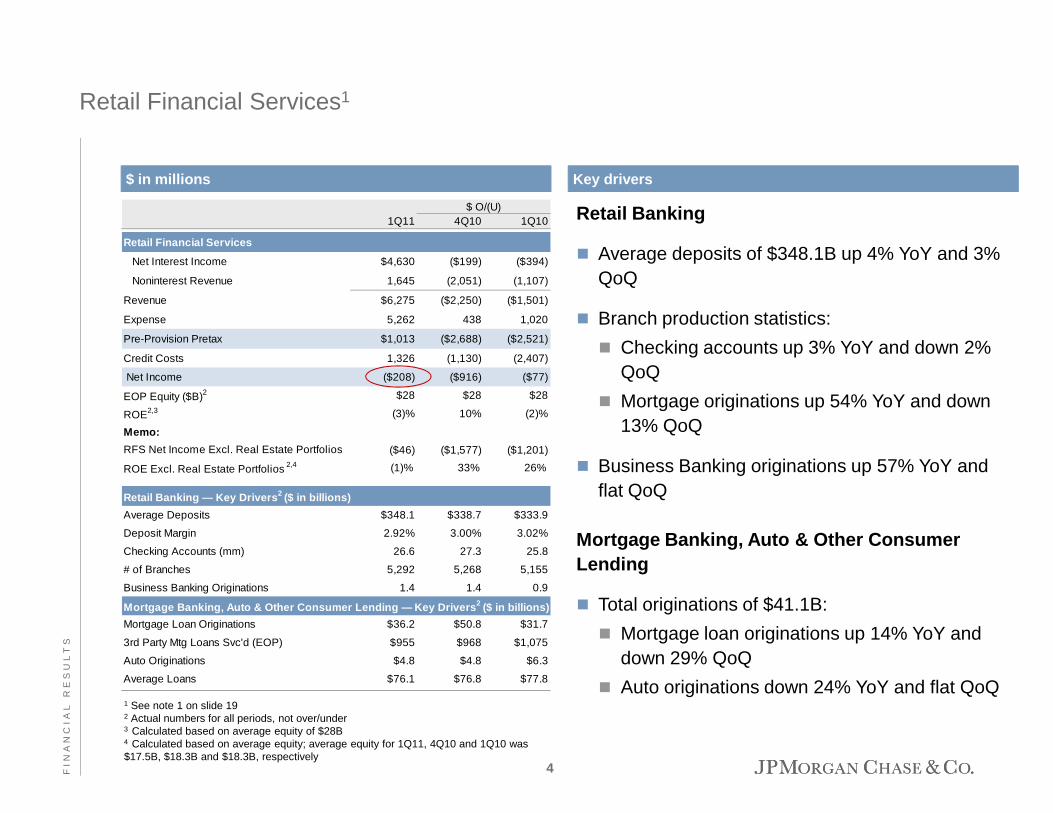
Net Interest Income $4,630 ($199) ($394)
Noninterest Revenue 1,645 (2,051) (1,107)
Revenue $6,275 ($2,250) ($1,501)
Expense 5,262 438 1,020
Pre-Provision Pretax $1,013 ($2,688) ($2,521)
Credit Costs 1,326 (1,130) (2,407)
Net Income ($208) ($916) ($77)
EOP Equity ($B)2 $28 $28 $28 2,3
$ O/(U)
Retail Financial Services1
Key drivers
Retail Banking
� Average deposits of $348.1B up 4% YoY and 3% QoQ
� Branch production statistics:
� Checking accounts up 3% YoY and down 2% QoQ
� Mortgage originations up 54% YoY and down
$ in millions
ROE2,3 (3)% 10% (2)%
Memo:
RFS Net Income Excl. Real Estate Portfolios ($46) ($1,577) ($1,201)
ROE Excl. Real Estate Portfolios 2,4 (1)% 33% 26%
Retail Banking — Key Drivers 2 ($ in billions)
Average Deposits $348.1 $338.7 $333.9
Deposit Margin 2.92% 3.00% 3.02%
Checking Accounts (mm) 26.6 27.3 25.8
# of Branches 5,292 5,268 5,155
Business Banking Originations 1.4 1.4 0.9
Mortgage Banking, Auto & Other Consumer Lending — Key Drivers 2 ($ in billions)
Mortgage Loan Originations $36.2 $50.8 $31.7
3rd Party Mtg Loans Svc'd (EOP) $955 $968 $1,075
Auto Originations $4.8 $4.8 $6.3
Average Loans $76.1 $76.8 $77.8
1 See note 1 on slide 192 Actual numbers for all periods, not over/under3 Calculated based on average equity of $28B 4 Calculated based on average equity; average equity for 1Q11, 4Q10 and 1Q10 was $17.5B, $18.3B and $18.3B, respectively
� Mortgage originations up 54% YoY and down 13% QoQ
� Business Banking originations up 57% YoY and flat QoQ
Mortgage Banking, Auto & Other Consumer Lending
� Total originations of $41.1B:
� Mortgage loan originations up 14% YoY and down 29% QoQ
� Auto originations down 24% YoY and flat QoQ
4FIN
AN
CIA
LR
ES
UL
TS
1Q11 4Q10 1Q10
Retail Banking
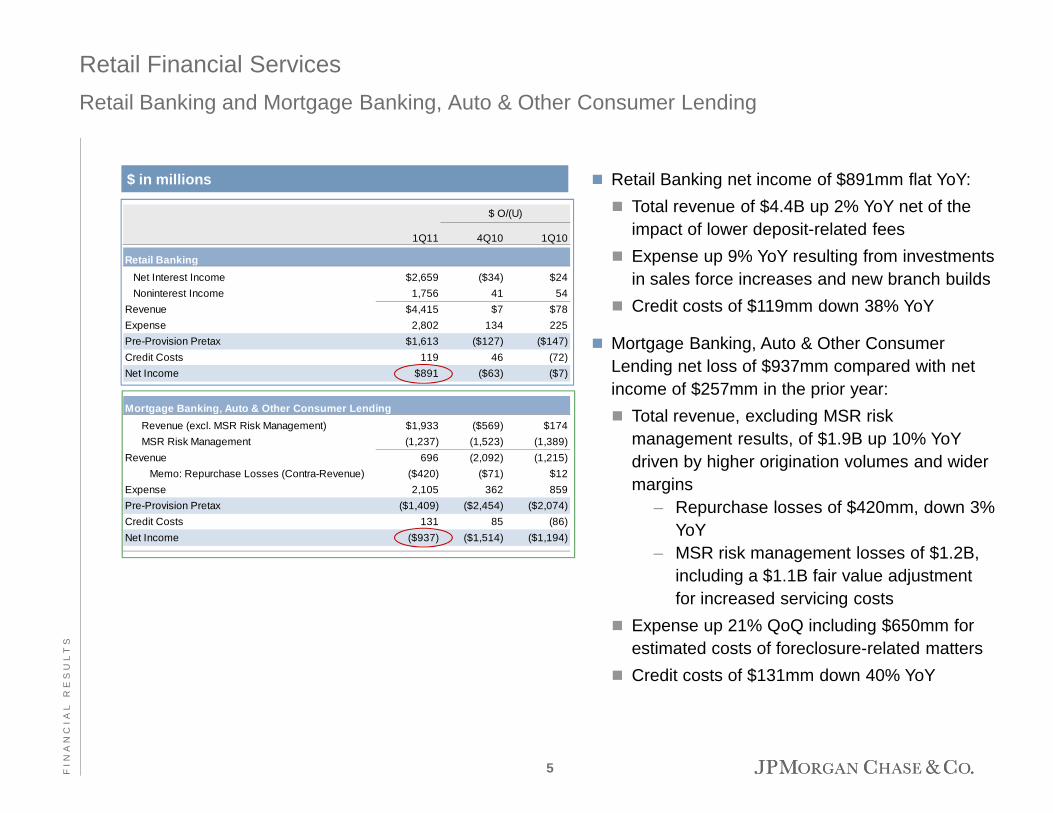
Net Interest Income $2,659 ($34) $24
Noninterest Income 1,756 41 54
Revenue $4,415 $7 $78
Expense 2,802 134 225
Pre-Provision Pretax $1,613 ($127) ($147)
Credit Costs 119 46 (72)
Net Income $891 ($63) ($7)
Mortgage Banking, Auto & Other Consumer Lending
$ O/(U)
Retail Financial Services
Retail Banking and Mortgage Banking, Auto & Other Consumer Lending
$ in millions � Retail Banking net income of $891mm flat YoY:
� Total revenue of $4.4B up 2% YoY net of the impact of lower deposit-related fees
� Expense up 9% YoY resulting from investments in sales force increases and new branch builds
� Credit costs of $119mm down 38% YoY
� Mortgage Banking, Auto & Other Consumer Lending net loss of $937mm compared with net income of $257mm in the prior year:
Total revenue, excluding MSR risk Mortgage Banking, Auto & Other Consumer Lending
Revenue (excl. MSR Risk Management) $1,933 ($569) $174
MSR Risk Management (1,237) (1,523) (1,389)
Revenue 696 (2,092) (1,215)
Memo: Repurchase Losses (Contra-Revenue) ($420) ($71) $12
Expense 2,105 362 859
Pre-Provision Pretax ($1,409) ($2,454) ($2,074)
Credit Costs 131 85 (86)
Net Income ($937) ($1,514) ($1,194)
� Total revenue, excluding MSR risk management results, of $1.9B up 10% YoY driven by higher origination volumes and wider margins
– Repurchase losses of $420mm, down 3% YoY
– MSR risk management losses of $1.2B, including a $1.1B fair value adjustment for increased servicing costs
� Expense up 21% QoQ including $650mm for estimated costs of foreclosure-related matters
� Credit costs of $131mm down 40% YoY
5FIN
AN
CIA
LR
ES
UL
TS
Retail Financial Services
Real Estate Portfolios
$ in millions
1Q11 4Q10 1Q10
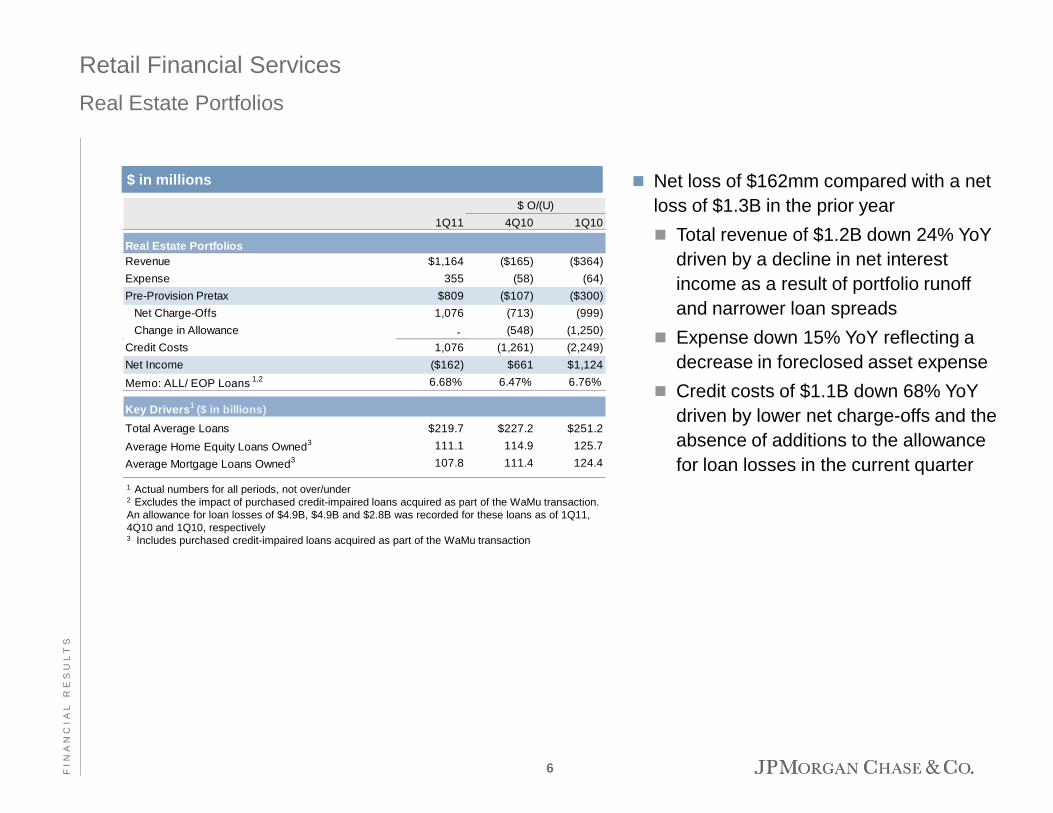
Real Estate PortfoliosRevenue $1,164 ($165) ($364)
Expense 355 (58) (64)
Pre-Provision Pretax $809 ($107) ($300)
Net Charge-Offs 1,076 (713) (999)
Change in Allowance - (548) (1,250)
Credit Costs 1,076 (1,261) (2,249)
Net Income ($162) $661 $1,124
Memo: ALL/ EOP Loans 1,2 6.68% 6.47% 6.76%
Key Drivers 1 ($ in billions)
$ O/(U)
� Net loss of $162mm compared with a net loss of $1.3B in the prior year
� Total revenue of $1.2B down 24% YoY driven by a decline in net interest income as a result of portfolio runoff and narrower loan spreads
� Expense down 15% YoY reflecting a decrease in foreclosed asset expense
� Credit costs of $1.1B down 68% YoY driven by lower net charge-offs and the Key Drivers 1 ($ in billions)
Total Average Loans $219.7 $227.2 $251.2
Average Home Equity Loans Owned3 111.1 114.9 125.7
Average Mortgage Loans Owned3 107.8 111.4 124.4
1 Actual numbers for all periods, not over/under2 Excludes the impact of purchased credit-impaired loans acquired as part of the WaMu transaction. An allowance for loan losses of $4.9B, $4.9B and $2.8B was recorded for these loans as of 1Q11, 4Q10 and 1Q10, respectively3 Includes purchased credit-impaired loans acquired as part of the WaMu transaction
driven by lower net charge-offs and the absence of additions to the allowance for loan losses in the current quarter
6FIN
AN
CIA
LR
ES
UL
TS
Home Lending update
Key statistics 1
4Q10 4Q101Q11 Adjusted Reported 1Q10
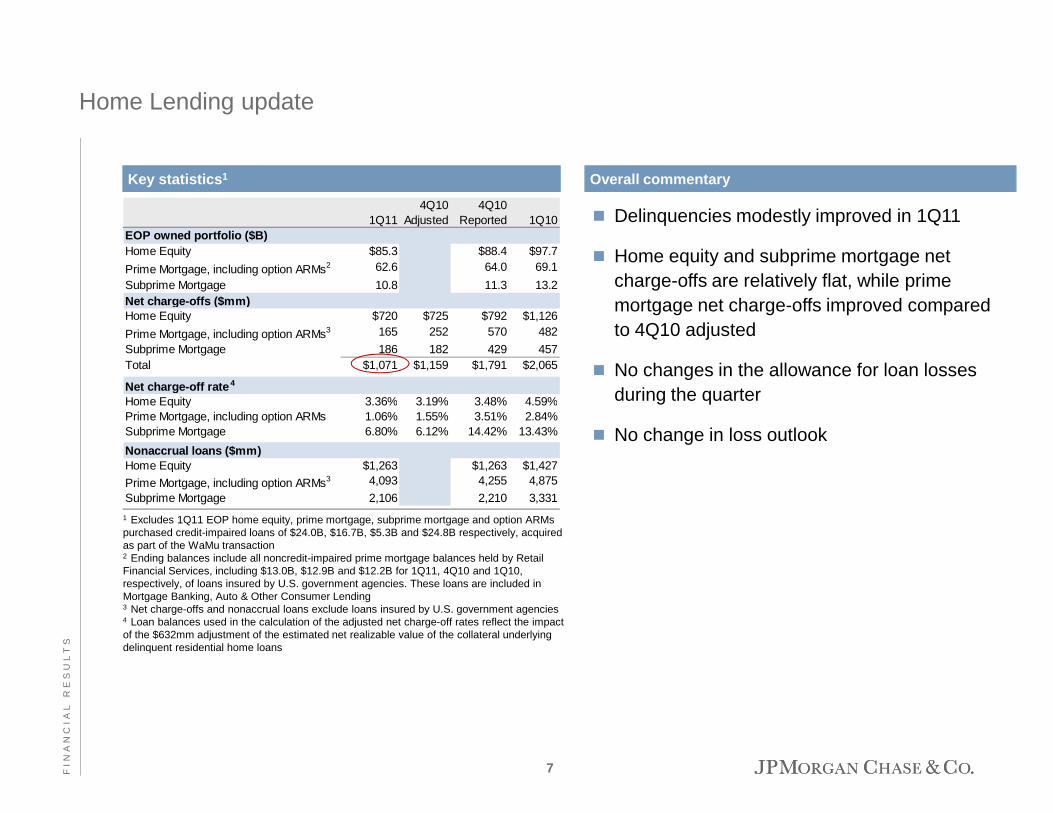
EOP owned portfolio ($B)Home Equity $85.3 $88.4 $97.7
Prime Mortgage, including option ARMs2 62.6 64.0 69.1
Subprime Mortgage 10.8 11.3 13.2Net charge-offs ($mm)Home Equity $720 $725 $792 $1,126
Prime Mortgage, including option ARMs3 165 252 570 482
Subprime Mortgage 186 182 429 457Total $1,071 $1,159 $1,791 $2,065
Net charge-off rate 4
Home Equity 3.36% 3.19% 3.48% 4.59%
Overall commentary
� Delinquencies modestly improved in 1Q11
� Home equity and subprime mortgage net charge-offs are relatively flat, while prime mortgage net charge-offs improved compared to 4Q10 adjusted
� No changes in the allowance for loan losses during the quarterHome Equity 3.36% 3.19% 3.48% 4.59%
Prime Mortgage, including option ARMs 1.06% 1.55% 3.51% 2.84%Subprime Mortgage 6.80% 6.12% 14.42% 13.43%
Nonaccrual loans ($mm)Home Equity $1,263 $1,263 $1,427
Prime Mortgage, including option ARMs3 4,093 4,255 4,875
Subprime Mortgage 2,106 2,210 3,331
1 Excludes 1Q11 EOP home equity, prime mortgage, subprime mortgage and option ARMs purchased credit-impaired loans of $24.0B, $16.7B, $5.3B and $24.8B respectively, acquired as part of the WaMu transaction2 Ending balances include all noncredit-impaired prime mortgage balances held by Retail Financial Services, including $13.0B, $12.9B and $12.2B for 1Q11, 4Q10 and 1Q10, respectively, of loans insured by U.S. government agencies. These loans are included in Mortgage Banking, Auto & Other Consumer Lending3 Net charge-offs and nonaccrual loans exclude loans insured by U.S. government agencies4 Loan balances used in the calculation of the adjusted net charge-off rates reflect the impact of the $632mm adjustment of the estimated net realizable value of the collateral underlying delinquent residential home loans
� No change in loss outlook
7FIN
AN
CIA
LR
ES
UL
TS
Card Services
$ in millions
1Q11 4Q10 1Q10
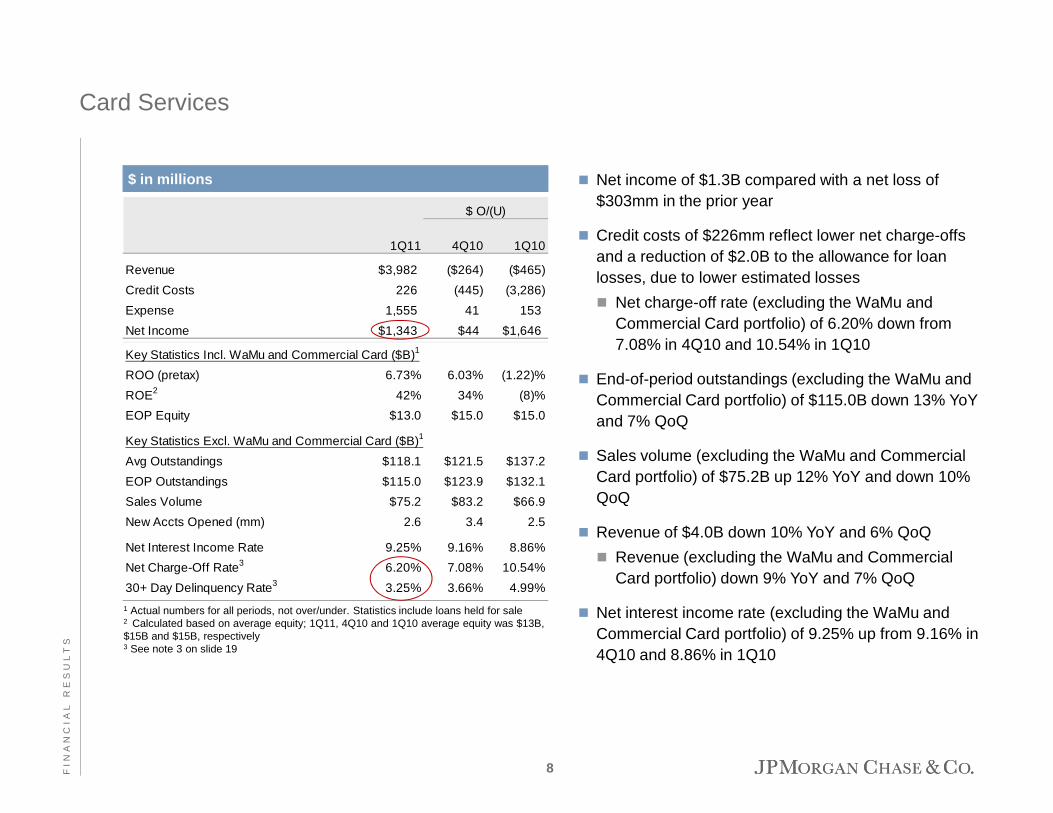
Revenue $3,982 ($264) ($465)
Credit Costs 226 (445) (3,286)
Expense 1,555 41 153
Net Income $1,343 $44 $1,646
Key Statistics Incl. WaMu and Commercial Card ($B)1
ROO (pretax) 6.73% 6.03% (1.22)%
ROE2 42% 34% (8)%
$ O/(U)
� Net income of $1.3B compared with a net loss of $303mm in the prior year
� Credit costs of $226mm reflect lower net charge-offs and a reduction of $2.0B to the allowance for loan losses, due to lower estimated losses
� Net charge-off rate (excluding the WaMu and Commercial Card portfolio) of 6.20% down from 7.08% in 4Q10 and 10.54% in 1Q10
� End-of-period outstandings (excluding the WaMu and Commercial Card portfolio) of $115.0B down 13% YoY
1 Actual numbers for all periods, not over/under. Statistics include loans held for sale2 Calculated based on average equity; 1Q11, 4Q10 and 1Q10 average equity was $13B, $15B and $15B, respectively3 See note 3 on slide 19
EOP Equity $13.0 $15.0 $15.0
Key Statistics Excl. WaMu and Commercial Card ($B)1
Avg Outstandings $118.1 $121.5 $137.2
EOP Outstandings $115.0 $123.9 $132.1
Sales Volume $75.2 $83.2 $66.9
New Accts Opened (mm) 2.6 3.4 2.5
Net Interest Income Rate 9.25% 9.16% 8.86%
Net Charge-Off Rate3 6.20% 7.08% 10.54%
30+ Day Delinquency Rate3 3.25% 3.66% 4.99%
Commercial Card portfolio) of $115.0B down 13% YoY and 7% QoQ
� Sales volume (excluding the WaMu and Commercial Card portfolio) of $75.2B up 12% YoY and down 10% QoQ
� Revenue of $4.0B down 10% YoY and 6% QoQ
� Revenue (excluding the WaMu and Commercial Card portfolio) down 9% YoY and 7% QoQ
� Net interest income rate (excluding the WaMu and Commercial Card portfolio) of 9.25% up from 9.16% in 4Q10 and 8.86% in 1Q10
8FIN
AN
CIA
LR
ES
UL
TS

Commercial Banking1
$ in millions
1Q11 4Q10 1Q10
Revenue $1,516 ($95) $100
Middle Market Banking 755 (26) 9
Corporate Client Banking 290 (12) 27
Commercial Term Lending 286 (15) 57
Real Estate Banking 88 (29) (12)
Other 97 (13) 19
Credit Costs 47 (105) (167)
Expense 563 5 24
Net Income $546 $16 $156
$ O/(U)
� Net income of $546mm up 40% YoY
� Average loan balances up 3% YoY and 1% QoQ
� Average liability balances of $156B up 17% YoY
� Revenue of $1.5B up 7% YoY
� Credit costs of $47mm
� Net charge-offs of $31mm down 86% YoY
1 See note 1 on slide 192 Actual numbers for all periods, not over/under3 Includes deposits and deposits swept to on-balance sheet liabilities4 Loans held-for-sale and loans at fair value were excluded when calculating the loan loss coverage ratio and net charge-off rate5 Calculated based on average equity of $8B
Net Income $546 $16 $156
Key Statistics ($B)2
Average Loans & Leases $99.6 $98.4 $96.6
EOP Loans & Leases $100.2 $98.9 $95.7
Average Liability Balances3 $156.2 $147.5 $133.1
Allowance for Loan Losses $2.6 $2.6 $3.0
NPLs $2.0 $2.0 $3.0
Net Charge-Off Rate4 0.13% 1.16% 0.96%
ALL / Loans4 2.59% 2.61% 3.15%
ROE5 28% 26% 20%
Overhead Ratio 37% 35% 38%
EOP Equity $8.0 $8.0 $8.0
and 89% QoQ
� Expense up 4% YoY; overhead ratio of 37%
9FIN
AN
CIA
LR
ES
UL
TS

� Net income of $316mm up 13% YoY and 23% QoQ
� Pretax margin of 26%
� Liability balances up 7% YoY
� Record assets under custody of $16.6T up 9% YoY
� Revenue of $1.8B up 5% YoY
� WSS revenue of $949mm up 9% YoY
1Q11 4Q10 1Q10
Revenue $1,840 ($73) $84
Worldwide Securities Services 949 (11) 75
Treasury Services 891 (62) 9
Expense 1,377 (93) 52
Credit Allocation Income/(Expense)2 27 57 57
Net Income $316 $59 $37
Key Statistics3
$ O/(U)
Treasury & Securities Services1
$ in millions
� WSS revenue of $949mm up 9% YoY
� TS revenue of $891mm up 1% YoY
� Expense up 4% YoY driven by continued investment in new product platforms, primarily related to international expansion, partially offset by the transfer of the Commercial Card business to Card Services
� Credit allocation benefit of $27mm related to shared credit portfolio
Key Statistics3
Average Liability Balances ($B)4 $265.7 $256.7 $247.9
Assets under Custody ($T) $16.6 $16.1 $15.3
Pretax Margin 26% 21% 25%
ROE5 18% 16% 17%
TSS Firmwide Revenue $2,445 $2,637 $2,450
TS Firmwide Revenue $1,496 $1,677 $1,576
TSS Firmwide Average Liab Bal ($B)4 $421.9 $404.2 $381.0
EOP Equity ($B) $7.0 $6.5 $6.5
1 See notes 1 and 4 on slide 192 IB manages credit exposures related to the Global Corporate Bank ("GCB“) on behalf of IB and TSS. Effective January 1, 2011, IB and TSS will share the economics related to the Firm’s GCB clients. Included within this allocation are net revenues, provision for credit losses as well as expenses. Prior-year periods reflected a reimbursement to the IB for a portion of the total costs of managing the credit portfolio3 Actual numbers for all periods, not over/under4 Includes deposits and deposits swept to on-balance sheet liabilities5 Calculated based on average equity; 1Q11, 4Q10, and 1Q10 average equity was $7.0B, $6.5B, and $6.5B respectively
10FIN
AN
CIA
LR
ES
UL
TS
Asset Management
$ in millions
1Q11 4Q10 1Q10
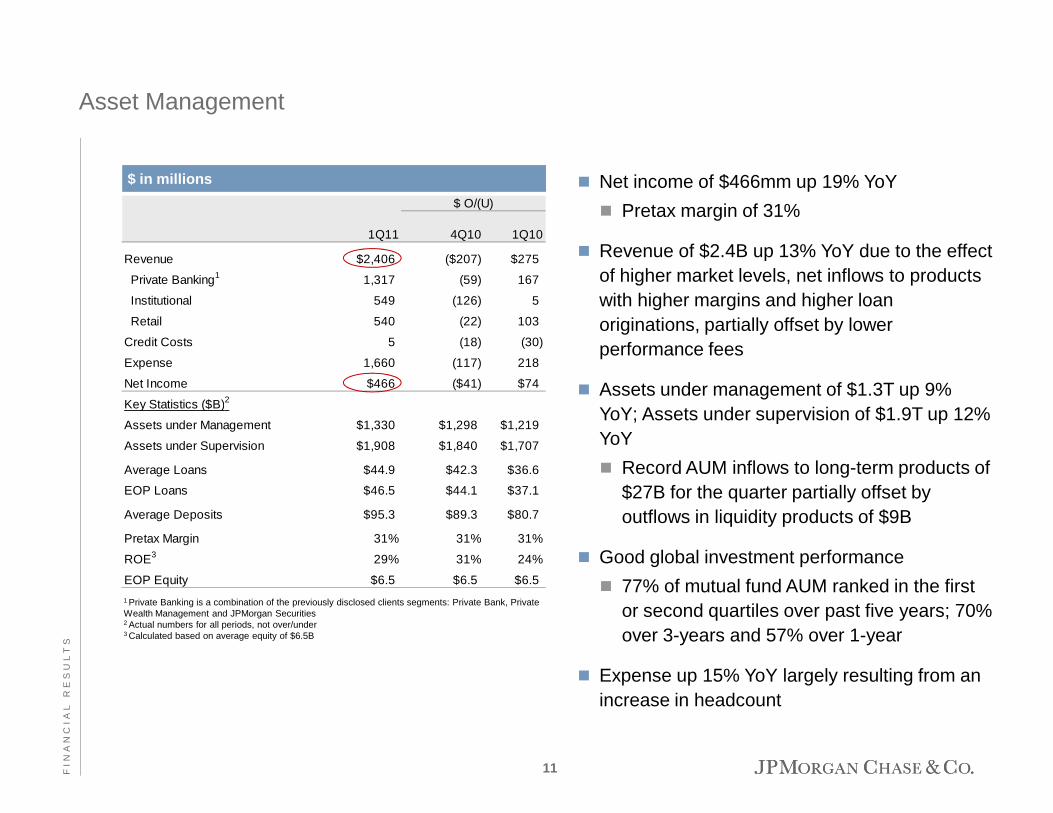
Revenue $2,406 ($207) $275
Private Banking1 1,317 (59) 167
Institutional 549 (126) 5
Retail 540 (22) 103
Credit Costs 5 (18) (30)
Expense 1,660 (117) 218
Net Income $466 ($41) $74
Key Statistics ($B)2
$ O/(U)
� Net income of $466mm up 19% YoY
� Pretax margin of 31%
� Revenue of $2.4B up 13% YoY due to the effect of higher market levels, net inflows to products with higher margins and higher loan originations, partially offset by lower performance fees
� Assets under management of $1.3T up 9% YoY; Assets under supervision of $1.9T up 12%
Key Statistics ($B)
Assets under Management $1,330 $1,298 $1,219
Assets under Supervision $1,908 $1,840 $1,707
Average Loans $44.9 $42.3 $36.6
EOP Loans $46.5 $44.1 $37.1
Average Deposits $95.3 $89.3 $80.7
Pretax Margin 31% 31% 31%
ROE3 29% 31% 24%
EOP Equity $6.5 $6.5 $6.5
YoY; Assets under supervision of $1.9T up 12% YoY
� Record AUM inflows to long-term products of $27B for the quarter partially offset by outflows in liquidity products of $9B
� Good global investment performance
� 77% of mutual fund AUM ranked in the first or second quartiles over past five years; 70% over 3-years and 57% over 1-year
� Expense up 15% YoY largely resulting from an increase in headcount
1 Private Banking is a combination of the previously disclosed clients segments: Private Bank, Private Wealth Management and JPMorgan Securities2 Actual numbers for all periods, not over/under3 Calculated based on average equity of $6.5B
11FIN
AN
CIA
LR
ES
UL
TS
Corporate/Private Equity
Net Income ($ in millions) Private Equity
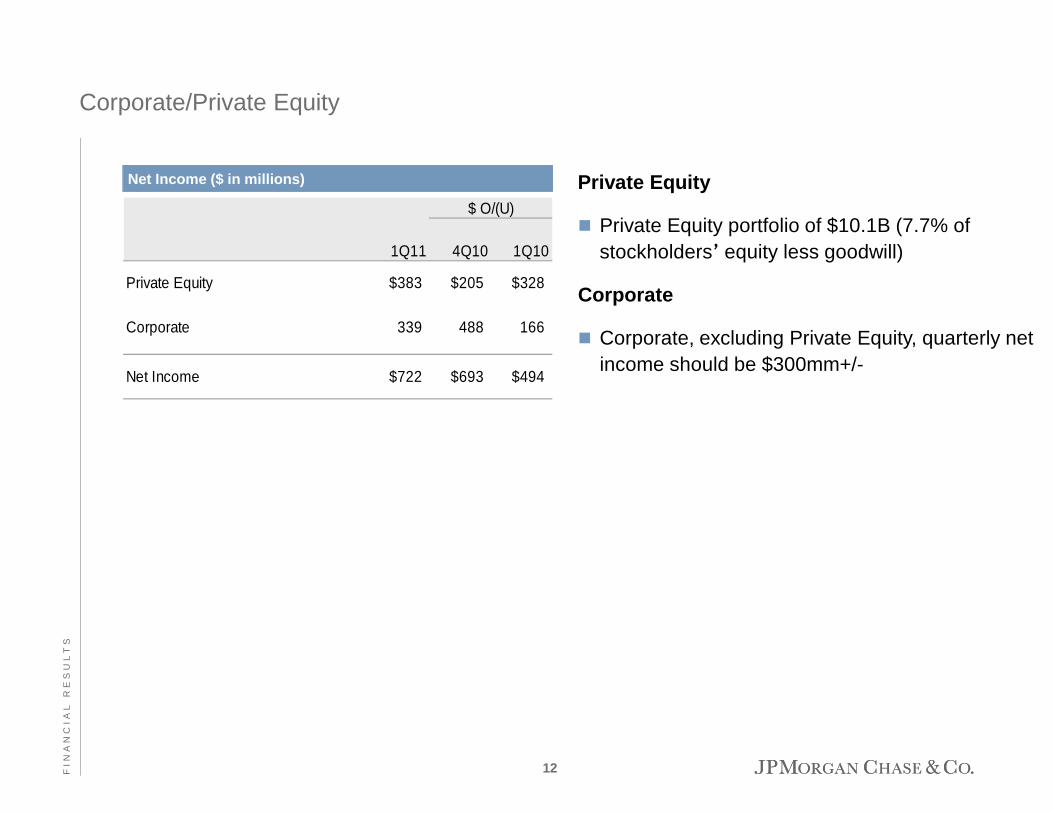
� Private Equity portfolio of $10.1B (7.7% of stockholders’ equity less goodwill)
Corporate
� Corporate, excluding Private Equity, quarterly net income should be $300mm+/-
1Q11 4Q10 1Q10
Private Equity $383 $205 $328
Corporate 339 488 166
Net Income $722 $693 $494
$ O/(U)
12FIN
AN
CIA
LR
ES
UL
TS
Fortress balance sheet
$ in billions
1Q11 4Q10 1Q10
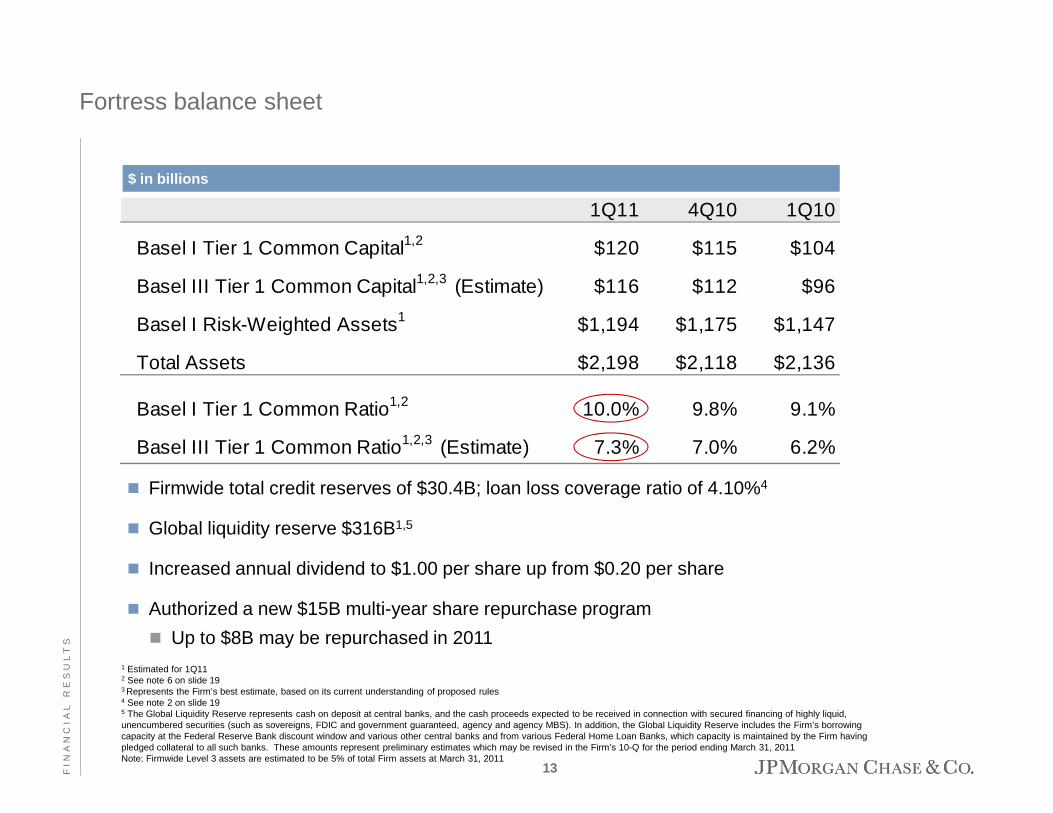
Basel I Tier 1 Common Capital1,2 $120 $115 $104
Basel III Tier 1 Common Capital1,2,3 (Estimate) $116 $112 $96
Basel I Risk-Weighted Assets1 $1,194 $1,175 $1,147
Total Assets $2,198 $2,118 $2,136
Basel I Tier 1 Common Ratio1,2 10.0% 9.8% 9.1%
� Firmwide total credit reserves of $30.4B; loan loss coverage ratio of 4.10%4
� Global liquidity reserve $316B1,5
� Increased annual dividend to $1.00 per share up from $0.20 per share
� Authorized a new $15B multi-year share repurchase program
� Up to $8B may be repurchased in 20111 Estimated for 1Q11 2 See note 6 on slide 193 Represents the Firm’s best estimate, based on its current understanding of proposed rules4 See note 2 on slide 195 The Global Liquidity Reserve represents cash on deposit at central banks, and the cash proceeds expected to be received in connection with secured financing of highly liquid, unencumbered securities (such as sovereigns, FDIC and government guaranteed, agency and agency MBS). In addition, the Global Liquidity Reserve includes the Firm’s borrowing capacity at the Federal Reserve Bank discount window and various other central banks and from various Federal Home Loan Banks, which capacity is maintained by the Firm having pledged collateral to all such banks. These amounts represent preliminary estimates which may be revised in the Firm’s 10-Q for the period ending March 31, 2011Note: Firmwide Level 3 assets are estimated to be 5% of total Firm assets at March 31, 2011
Basel I Tier 1 Common Ratio1,2 10.0% 9.8% 9.1%
Basel III Tier 1 Common Ratio1,2,3 (Estimate) 7.3% 7.0% 6.2%
13FIN
AN
CIA
LR
ES
UL
TS
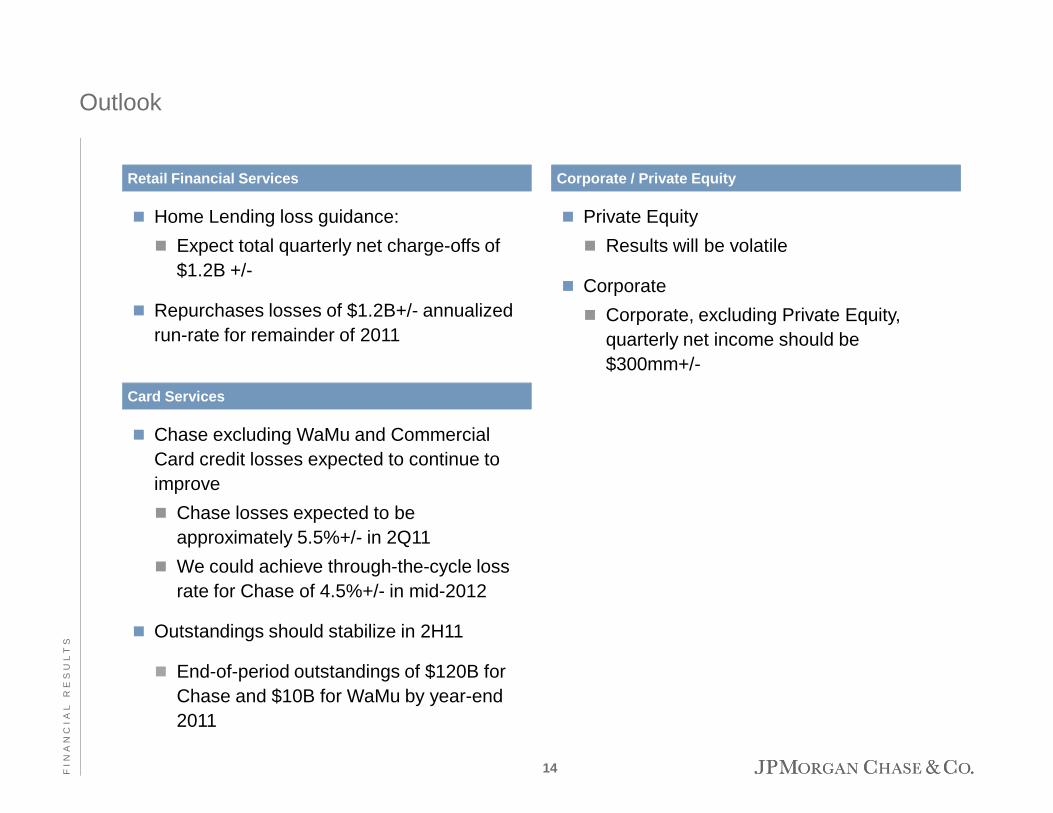
Outlook
� Home Lending loss guidance:
� Expect total quarterly net charge-offs of $1.2B +/-
� Repurchases losses of $1.2B+/- annualized run-rate for remainder of 2011
Retail Financial Services
Card Services
Corporate / Private Equity
� Private Equity
� Results will be volatile
� Corporate
� Corporate, excluding Private Equity, quarterly net income should be $300mm+/-
� Chase excluding WaMu and Commercial Card credit losses expected to continue to improve
� Chase losses expected to be approximately 5.5%+/- in 2Q11
� We could achieve through-the-cycle loss rate for Chase of 4.5%+/- in mid-2012
� Outstandings should stabilize in 2H11
� End-of-period outstandings of $120B for Chase and $10B for WaMu by year-end 2011
14FIN
AN
CIA
LR
ES
UL
TS
Agenda
Page
Appendix 15
15FIN
AN
CIA
LR
ES
UL
TS
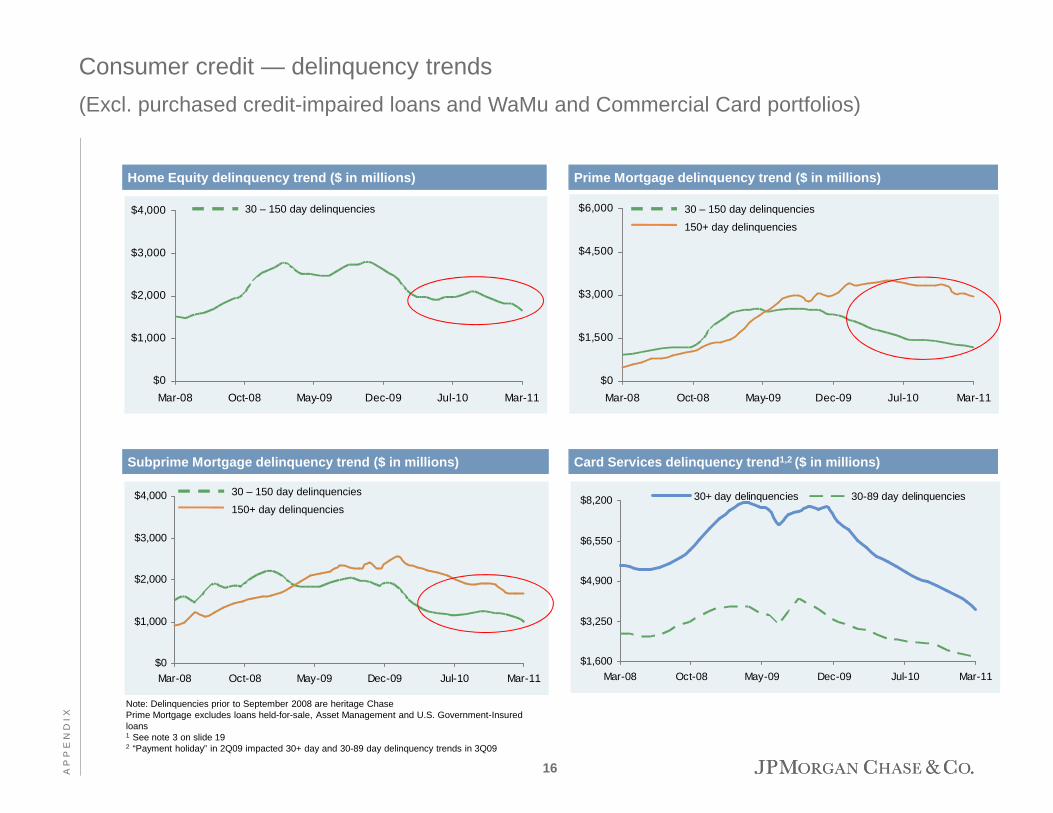
Consumer credit — delinquency trends
(Excl. purchased credit-impaired loans and WaMu and Commercial Card portfolios)
Prime Mortgage delinquency trend ($ in millions)Home Equity delinquency trend ($ in millions)
$0
$1,000
$2,000
$3,000
$4,000
Mar-08 Oct-08 May-09 Dec-09 Jul-10 Mar-11
$0
$1,500
$3,000
$4,500
$6,000
Mar-08 Oct-08 May-09 Dec-09 Jul-10 Mar-11
30 – 150 day delinquencies
150+ day delinquencies
30 – 150 day delinquencies
$1,600
$3,250
$4,900
$6,550
$8,200
Mar-08 Oct-08 May-09 Dec-09 Jul-10 Mar-11
30+ day delinquencies 30-89 day delinquencies
Card Services delinquency trend 1,2 ($ in millions)
Note: Delinquencies prior to September 2008 are heritage ChasePrime Mortgage excludes loans held-for-sale, Asset Management and U.S. Government-Insured loans1 See note 3 on slide 192 “Payment holiday” in 2Q09 impacted 30+ day and 30-89 day delinquency trends in 3Q09
Subprime Mortgage delinquency trend ($ in millions)
$0
$1,000
$2,000
$3,000
$4,000
Mar-08 Oct-08 May-09 Dec-09 Jul-10 Mar-11
30 – 150 day delinquencies
150+ day delinquencies
16AP
PE
ND
IX
14,785 17,767 17,564 17,050 16,179 15,503 14,841
29,07230,633 31,602
27,381
35,836
29,750
32,266
34,16138,186
2.00%
3.00%
4.00%
5.00%
6.00%
100%
200%
300%
400%
500%
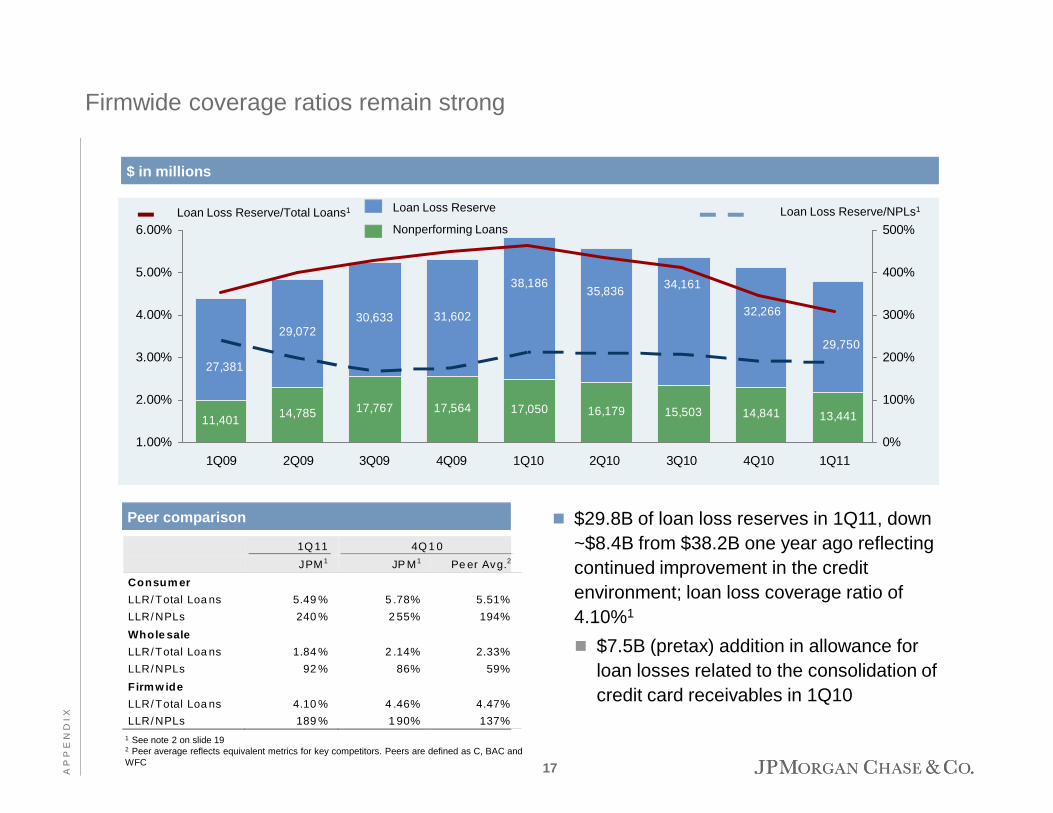
Firmwide coverage ratios remain strong
Loan Loss Reserve
Nonperforming LoansLoan Loss Reserve/Total Loans1 Loan Loss Reserve/NPLs1
$ in millions
14,785 17,767 17,564 17,050 16,179 15,503 14,841 13,44111,401
1.00%
1Q09 2Q09 3Q09 4Q09 1Q10 2Q10 3Q10 4Q10 1Q11
0%
� $29.8B of loan loss reserves in 1Q11, down ~$8.4B from $38.2B one year ago reflecting continued improvement in the credit environment; loan loss coverage ratio of 4.10%1
� $7.5B (pretax) addition in allowance for loan losses related to the consolidation of credit card receivables in 1Q10
Peer comparison
1Q 11 4Q 1 0
JPM1 JP M1 Pe er Avg.2
Consum er
LLR/ Total Loa ns 5.49 % 5 .78% 5.51%
LLR/ NPLs 240 % 2 55% 194%
Whole sale
LLR/ Total Loa ns 1.84 % 2 .14% 2.33%
LLR/ NPLs 92 % 86% 59%
Firmw ide
LLR/ Total Loa ns 4.10 % 4 .46% 4.47%
LLR/ NPLs 189 % 1 90% 137% 1 See note 2 on slide 192 Peer average reflects equivalent metrics for key competitors. Peers are defined as C, BAC and WFC 17A
PP
EN
DI
X
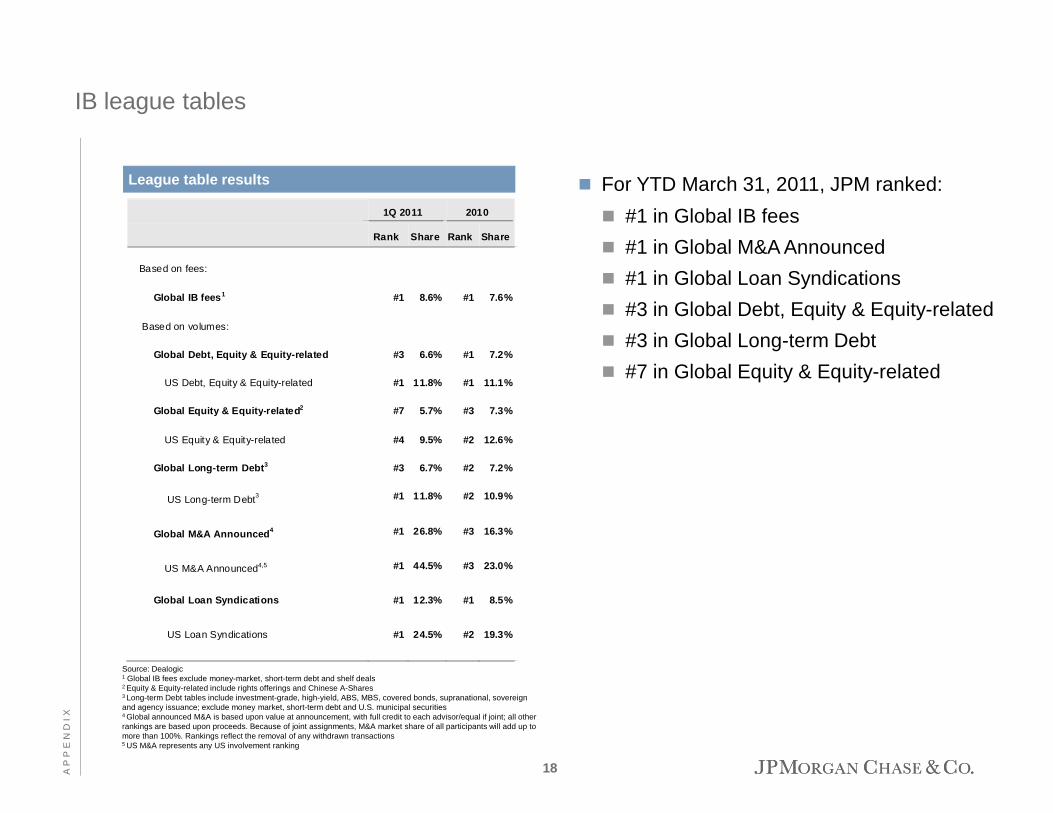
1Q 2011 2010
Rank Share Rank Share
Based on fees:
Global IB fees 1 #1 8.6% #1 7.6%
Based on volumes:
Global Debt, Equity & Equity-related #3 6.6% #1 7.2%
US Debt, Equity & Equity-related #1 11.8% #1 11.1%
Global Equity & Equity -related 2 #7 5.7% #3 7.3%
IB league tables
League table results � For YTD March 31, 2011, JPM ranked:
� #1 in Global IB fees
� #1 in Global M&A Announced
� #1 in Global Loan Syndications
� #3 in Global Debt, Equity & Equity-related
� #3 in Global Long-term Debt
� #7 in Global Equity & Equity-related
Global Equity & Equity -related 2 #7 5.7% #3 7.3%
US Equity & Equity-related #4 9.5% #2 12.6%
Global Long-term Debt 3 #3 6.7% #2 7.2%
US Long-term Debt3 #1 11.8% #2 10.9%
Global M&A Announced 4 #1 26.8% #3 16.3%
US M&A Announced4,5 #1 44.5% #3 23.0%
Global Loan Syndications #1 12.3% #1 8.5%
US Loan Syndications #1 24.5% #2 19.3%
Source: Dealogic1 Global IB fees exclude money-market, short-term debt and shelf deals2 Equity & Equity-related include rights offerings and Chinese A-Shares3 Long-term Debt tables include investment-grade, high-yield, ABS, MBS, covered bonds, supranational, sovereign and agency issuance; exclude money market, short-term debt and U.S. municipal securities4 Global announced M&A is based upon value at announcement, with full credit to each advisor/equal if joint; all other rankings are based upon proceeds. Because of joint assignments, M&A market share of all participants will add up to more than 100%. Rankings reflect the removal of any withdrawn transactions5 US M&A represents any US involvement ranking
18AP
PE
ND
IX
1. In addition to analyzing the Firm’s results on a reported basis, management reviews the Firm’s results and the results of the lines of business on a “managed” basis, which is a non-GAAP financial measure. The Firm’s definition of managed basis starts with the reported U.S. GAAP results and includes certain reclassifications to present total net revenue for the Firm (and each of the business segments) on a FTE basis. Accordingly, revenue from tax-exempt securities and investments that receive tax credits is presented in the managed results on a basis comparable to taxable securities and investments. This non-GAAP financial measure allows management to assess the comparability of revenue arising from both taxable and tax-exempt sources. The corresponding income tax impact related to tax-exempt items is recorded within income tax expense. These adjustments have no impact on net income as reported by the Firm as a whole or by the lines of business.
2. The ratio of the allowance for loan losses to end-of-period loans excludes the following: loans accounted for at fair value and loans held-for-sale; purchased credit-impaired (“PCI”) loans; and the allowance for loan losses related to PCI loans. Additionally, Real Estate Portfolios net charge-offs exclude the impact of PCI loans. The allowance for loan losses related to the purchased credit-impaired portfolio totaled $4.9 billion, $4.9 billion and $2.8 billion at March 31, 2011, December 31, 2010, and March 31, 2010, respectively.
3. In Card Services, supplemental information is provided for Chase, excluding Washington Mutual and Commercial Card portfolios, to provide more meaningful measures that enable comparability with prior periods.
4. Treasury & Securities Services firmwide metrics include certain TSS product revenue and liability balances reported in other lines of business related to customers whoare also customers of those other lines of business. In order to capture the firmwide impact of TSS products and revenue, management reviews firmwide metrics such as liability balances, revenue and overhead ratios in assessing financial performance for TSS. Firmwide metrics are necessary, in management’s view, in order to
Notes on non-GAAP financial measures
as liability balances, revenue and overhead ratios in assessing financial performance for TSS. Firmwide metrics are necessary, in management’s view, in order to understand the aggregate TSS business.
5. Pretax margin represents income before income tax expense divided by total net revenue, which is, in management’s view, a comprehensive measure of pretax performance derived by measuring earnings after all costs are taken into consideration. It is, therefore, another basis that management uses to evaluate the performance of TSS and AM against the performance of their respective competitors.
6. Basel I Tier 1 common ratio and Basel III Tier 1 common ratio is Tier 1 common divided by risk-weighted assets. Tier 1 common is defined as Tier 1 capital less elements of capital not in the form of common equity – such as perpetual preferred stock, noncontrolling interests in subsidiaries and trust preferred capital debt securities. Tier 1 common, a non-GAAP financial measure, is used by banking regulators, investors and analysts to assess and compare the quality and composition of the Firm’s capital with the capital of other financial services companies. The Firm uses Tier 1 common along with the other capital measures to assess and monitor its capital position.
7. Tangible common equity (“TCE”) represents common stockholders’ equity (i.e., total stockholders’ equity less preferred stock) less identifiable intangible assets (other than MSRs) and goodwill, net of related deferred tax liabilities. Return on tangible common equity (“ROTCE”), a non-GAAP financial ratio, measures the Firm’s earnings as a percentage of TCE and is, in management’s view, a meaningful measure to assess the Firm’s use of equity.
8. Headcount-related expense includes salary and benefits (excluding performance-based incentives), and other noncompensation costs related to employees.
19AP
PE
ND
IX

Forward-looking statements
This presentation contains forward-looking statements within the meaning of the Private Securities Litigation Reform Act of 1995. Such statements are based upon the current beliefs and expectations of JPMorgan Chase & Co.’s management and are subject to significant risks and uncertainties. Actual results may differ from those set forth in the forward-looking statements. Factors that could cause JPMorgan Chase & Co.’s actual results to differ materially from those described in the forward-looking statements can be found in JPMorgan Chase & Co.’s Annual Report on Form 10-K for the year ended December 31, 2010, which has been filed with the Securities and Exchange Commission and is available on JPMorgan Chase & Co.’s website (www.jpmorganchase.com) and on the Securities and Exchange Commission’s website (www.sec.gov). JPMorgan Chase & Co. does not undertake to update the forward-looking statements to reflect the impact of circumstances or events that may arise after the date of the forward-looking statements.date of the forward-looking statements.
20AP
PE
ND
IX