20110517 hobas be045 11 comparison of co2 emissions from trenchless … · 2012-10-03 · the waste...
TRANSCRIPT
HOBAS Engineering GmbH
Pischeldorfer Str. 128 | 9020 Klagenfurt | Austria | T +43.463.48 24 24 | F + +43.463.48 21 21 | [email protected] | www.hobas.com
HOBAS® Comparison of CO2 emissions from trenchless and
open-cut installation methods. Installation of OD 3000
mm diameter pipes for
Project Czajka, Warsaw, Poland May 2011
Author – Mag. Mag. Victor Vladimirov, HOBAS Engineering GmbH Critical Review - Prof. Jens Hölterhoff, Chairman GSTT e.V Published - 17 May 2011
CO2 Emissions Environmental Report

HOBAS Engineering GmbH
Pischeldorfer Str. 128 | 9020 Klagenfurt | Austria | [email protected] | www.hobas.com 2
1. Introduction
The challenges of climate change require renewed efforts on behalf of municipalities worldwide to provide public services, meet development needs and to ensure environmental protection. The issue is even more actual when it comes to urban areas and especially high density human agglomerations. Starting with the last century, economic development and the increase in private car ownership represented the main drivers of urban growth in many parts of the world. Resources for cleaning up or for preventing the associated environmental consequences were minimized, and strategic choices for avoiding damaging consequences in the first place were rarely considered. The results of this unbalanced development are polluted air, traffic congestion, failing infrastructure and social issues together with their associated costs. In regard to infrastructure projects, construction or rehabilitation of sewer pipelines can create significant damages to the ecosystems through excavation and generate traffic disruptions which result in increasing carbon emissions, economic losses and discomfort for the inhabitants. Traditional open cut methods are usually obtrusive to the environment (i.e. digging out and transporting large amounts of earth), require increased consumption of resources both directly (i.e. fuel, electricity) and indirectly (for instance, thorough traffic delays). Thus, such methods are rather highly polluting and also tend to take longer amounts of time until completion, as compared with no-dig methods. Trenchless technology provides a sustainable alternative more than often. Using trenchless as an environmentally conscious choice ensures less air pollution (less CO2 emissions, less dust, less noise), reduce traffic disruptions and protect the natural habitat (i.e. preserving the trees that would otherwise be torn down for open-cut). Putting trenchless and open-cut on a balance, a strategic choice was taken by the Municipality of Warsaw in 2009 when it chose HOBAS three meter diameter jacking pipes for the rehabilitation of the waste treatment plant Czajka. This study compares carbon dioxide emissions of two scenarios for the Czajka Project: the actual implemented situation, with trenchless technology and the theoretical, open cut scenario. Emissions from production activities, transport before installation, installation-specific activities and local traffic are calculated and compared. One aspect of particular interest is the Modlińska Street in Warsaw where works were performed on a two and a half kilometre section of a busy six-lane urban street.

HOBAS Engineering GmbH
Pischeldorfer Str. 128 | 9020 Klagenfurt | Austria | [email protected] | www.hobas.com 3
2. The Project The waste water treatment plant Czajka is currently being erected on the right river bank of the Vistula River in Warsaw, Poland. After its completion, it shall treat 80% of the Polish capital’s effluents and furthermore make sure that no more untreated sewage will harm the flora and fauna of the Vistula - 30% of effluents are currently flowing directly into the river. As part of the plan, a collector leading to the plant is also under construction. Due to this project’s size, it was broken down into three sections. The first is approximately 5.7 km long and realized with HOBAS Jacking Pipes OD 3000 (DN 2800) which were installed along the right side of the Vistula, whereas 1.4 km OD 3000 are laid on the left river bank. The pipelines meet in the third section where two lines DN 1600 are inserted in a 4.5 m diameter tunnel crossing beneath the Vistula. Figure 1
Worthwhile mentioning is the 840 m long part of the first section where the pipes were supposed to be jacked from both ends meeting in the middle. However, installations with HOBAS Pipes can be conducted so precisely that the section could be jacked with one single drive and from one side only. The smooth and even outer surface and high stiffness (SN 50000 und 64000) of the relatively light-walled HOBAS Pipes were significant for this success. As shown in Figure 1, the project can be divided in three parts: Czajka I (right side of the river), Czajka II (left side of the river) and Czajka III (under the river).
HOBAS Engineering GmbH
Pischeldorfer Str. 128 | 9020 Klagenfurt | Austria | [email protected] | www.hobas.com 4
2.1 Study Goal The scope of this study for the Czajka I Project is to examine the hypothesis “Trenchless installation method of sewer pipe is a better environmental choice in regard to climate change than open-cut”. To this purpose, the following elements will be analyzed: o Trenchless scenario (actual scenario) carbon emissions calculation
o Open cut scenario (theoretical scenario) carbon emission calculation
o Comparison of trenchless and open-cut scenarios
2.2 Study Scope 2.2.1 Geographical scope The geographical scope of the study is in Poland and in Germany. Pipes and manholes for the project are produced at the Polish factory and then transported to the construction site in Warsaw. Couplings are produced in the German factory. These are transported to the factory in Poland where they are mounted on the pipes. Regarding the construction site, the focus is set on Czajka I (right side of the river) which represents most of the pipe line (5,7 km). Calculations will cover this part of the project; this part also includes the 2,54 kilometres section of the six-lane Modlińska Street. The main reason for focusing on Czajka I is the availability of data. The Czajka I project started in June 2009 and was completed at the beginning of September 2010. Czajka I constitutes the largest part of the total project ensuring therefore representativeness of this study. 2.2.2 Emissions GHG emissions, grouped under CO2 equivalent are considered in this study. GHG emissions include CO2, CH4, N2O, Hydrofluoracarbons, Perfluorocarbons and Sulfur Hexaflouride. GHG emissions can be classified in three scopes, respectively Scope 1, 2 and 3. Scope 1 emissions are direct GHG emissions from sources that are owned or controlled by the company. Scope 2 emissions are indirect GHG emissions from heat, purchased electricity or steam which are consumed but not directly generated at the facility. Scope 3 emissions are other indirect emissions which are a consequence of the activities of a company but are emitted from sources not owned or controlled by the company. This study includes emissions covering Scope 1, 2 and 3.

HOBAS Engineering GmbH
Pischeldorfer Str. 128 | 9020 Klagenfurt | Austria | [email protected] | www.hobas.com 5
2.3 Data Sources Three main data sources constitute the basis of this study; these concern: (1) CO2 emissions before pipes delivery at the construction site (production and transportation of
pipes and of raw materials). This data was provided form the production and logistic departments of the company.
(2) CO2 emissions at the construction site (construction and associated transport activities). CO2
emissions for both scenarios were determined based on calculations according to the Polish Catalogue of Capital Expenditures (KNR). KNR represents a standard tool, according to Polish construction norms, that is used to determine costing basis of construction projects.
(3) Traffic measurements for the 2,544 km section of Modlińska Street. On site measurements were
organized in June 2010 (during construction work) and in February 2011 (after completion of works).
2.4 Calculation Model 2.4.1 Levels of Calculation This study is divided in four calculation levels:
o Production
o Transport activities before construction site
o Pipe installation
o Traffic
A graphical depiction of the calculation model is available in Figure 2 below.
Figure 2
Production data is calculated from the HOBAS Polish and German factories.
Transport activities before installation refer to the transport of couplings from Germany to Poland and
to the transport of pipes with couplings and of manholes from the Polish plant to the installation site.
HOBAS Engineering GmbH
Pischeldorfer Str. 128 | 9020 Klagenfurt | Austria | [email protected] | www.hobas.com 6
Also included are the raw materials and the transportation of raw materials from the suppliers to the
Polish, respectively to the German factory.
Pipe installation includes the activities of preparing the installation of pipes, the actual installation and
the finishing works once the installation is complete.
Traffic emissions focus on the 2,544 km six-lane section of Modlińska Street.
2.4.2 Calculation Software
CO2 modelling and calculations have been performed with a specialized software, Umberto for Carbon
Footprint (v1.0). This is a tool designed for modeling, calculating and analysing carbon footprints. This
software solution is compliant with PAS 2050, GHG Protocol Product Standard and ISO 14067.
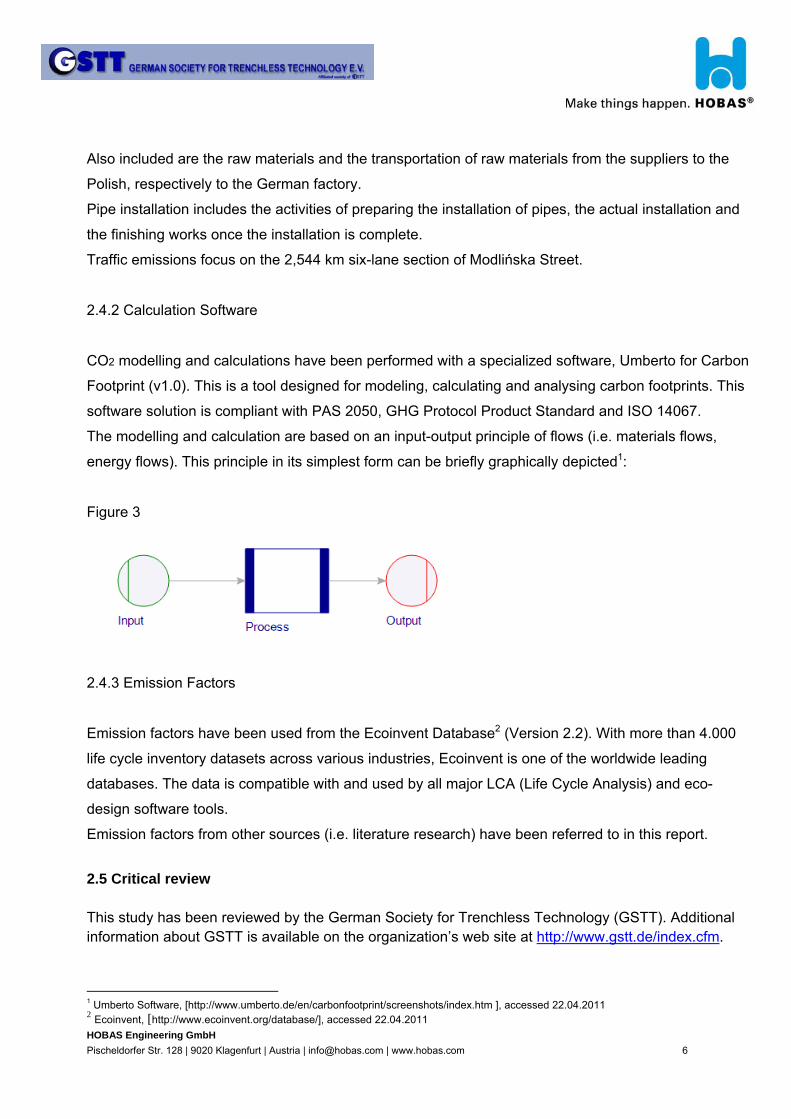
The modelling and calculation are based on an input-output principle of flows (i.e. materials flows,
energy flows). This principle in its simplest form can be briefly graphically depicted1:
Figure 3
2.4.3 Emission Factors
Emission factors have been used from the Ecoinvent Database2 (Version 2.2). With more than 4.000
life cycle inventory datasets across various industries, Ecoinvent is one of the worldwide leading
databases. The data is compatible with and used by all major LCA (Life Cycle Analysis) and eco-
design software tools.
Emission factors from other sources (i.e. literature research) have been referred to in this report.
2.5 Critical review
This study has been reviewed by the German Society for Trenchless Technology (GSTT). Additional information about GSTT is available on the organization’s web site at http://www.gstt.de/index.cfm.
1 Umberto Software, [http://www.umberto.de/en/carbonfootprint/screenshots/index.htm ], accessed 22.04.2011 2 Ecoinvent, [http://www.ecoinvent.org/database/], accessed 22.04.2011
HOBAS Engineering GmbH
Pischeldorfer Str. 128 | 9020 Klagenfurt | Austria | [email protected] | www.hobas.com 7
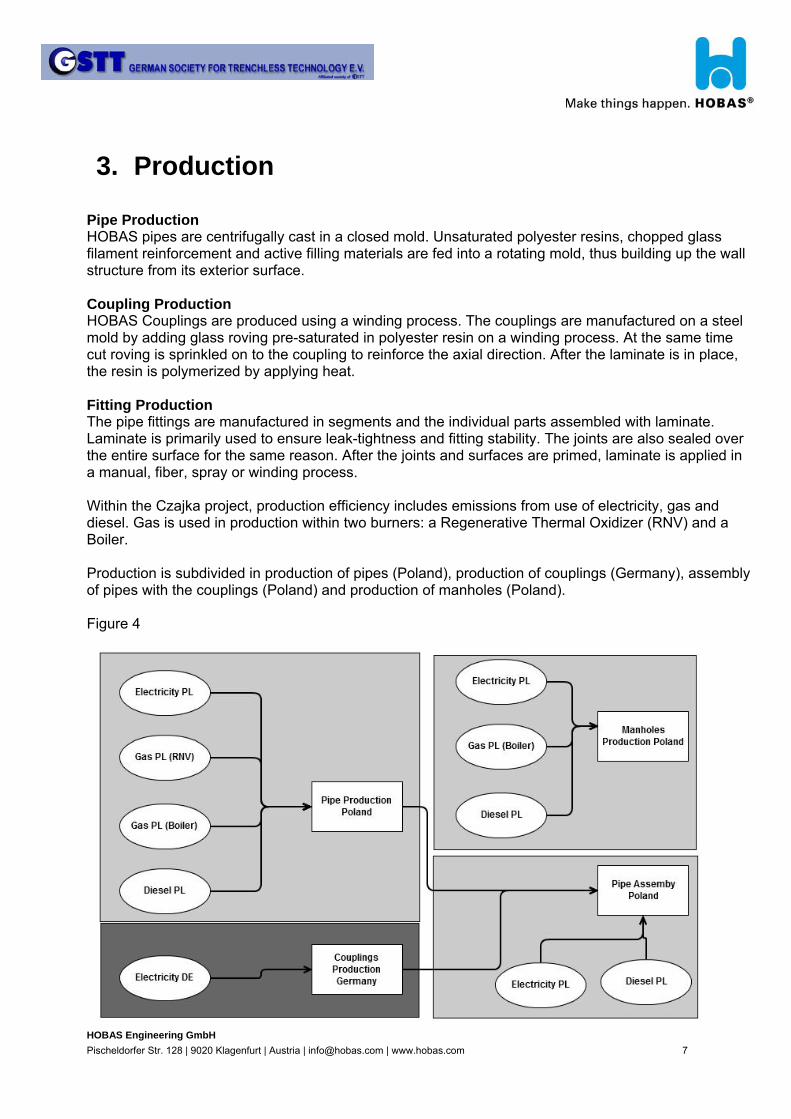
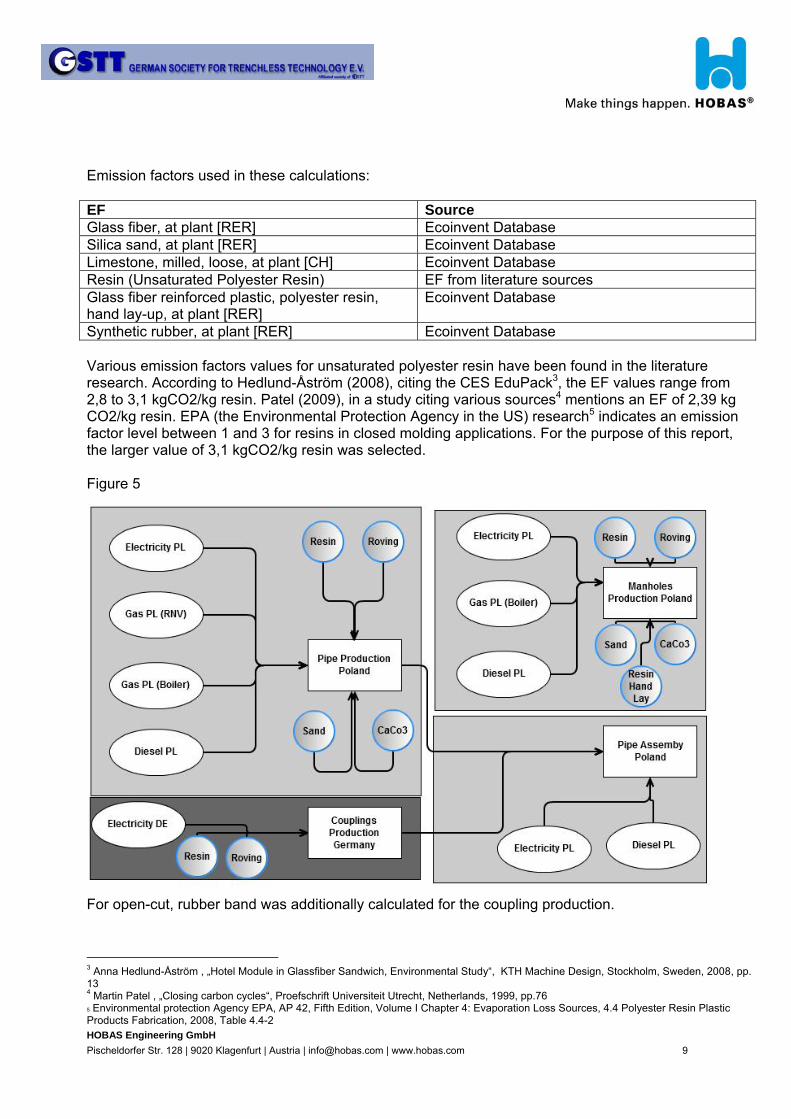
3. Production Pipe Production HOBAS pipes are centrifugally cast in a closed mold. Unsaturated polyester resins, chopped glass filament reinforcement and active filling materials are fed into a rotating mold, thus building up the wall structure from its exterior surface. Coupling Production HOBAS Couplings are produced using a winding process. The couplings are manufactured on a steel mold by adding glass roving pre-saturated in polyester resin on a winding process. At the same time cut roving is sprinkled on to the coupling to reinforce the axial direction. After the laminate is in place, the resin is polymerized by applying heat. Fitting Production The pipe fittings are manufactured in segments and the individual parts assembled with laminate. Laminate is primarily used to ensure leak-tightness and fitting stability. The joints are also sealed over the entire surface for the same reason. After the joints and surfaces are primed, laminate is applied in a manual, fiber, spray or winding process. Within the Czajka project, production efficiency includes emissions from use of electricity, gas and diesel. Gas is used in production within two burners: a Regenerative Thermal Oxidizer (RNV) and a Boiler. Production is subdivided in production of pipes (Poland), production of couplings (Germany), assembly of pipes with the couplings (Poland) and production of manholes (Poland). Figure 4

HOBAS Engineering GmbH
Pischeldorfer Str. 128 | 9020 Klagenfurt | Austria | [email protected] | www.hobas.com 8
Example of calculation: All inputs are calculated similarly and then added-up. Electricity PL = Electricity consumption for pipe production in Poland Pipe Production Poland = Production of pipe activity EF = Emission factor Emission factors used in these calculations: EF Source Electricity medium voltage, at grid, [PL] Ecoinvent Database Gas PL (RNV) EF supplied by manufacturer of Regenerative
Thermal Oxidizer (RNV) Gas PL (Boiler) Heat, natural gas at boiler modulating >100 kWh [RER]
Ecoinvent Database
Diesel, burned in diesel-electric generating set [GLO]
Ecoinvent Database
Diesel Ecoinvent Database Raw Materials Glass Fiber The major reinforcing material used for HOBAS Pipes to achieve the recommended mechanical properties in the axial and circumferential direction is glass fiber. There are some layers in the wall structure of a HOBAS Pipe in which the fibers are the main component and responsible for the excellent mechanical properties. Resin Very detailed specifications have been compiled for Unsaturated Polyesters intended for use in pipe production by centrifugal casting in order to ensure the processing (gel, exothermic and curing times, viscosity), the compound performance (elastic modulus, tensile and bending strength/strain, glass transition) and the service performance of the pipe during its life cycle (chemical resistance, molecular weight, acid number, heat deflection temperature). In addition to mold casting production, hand lay-up is an open mold process; alternate layers of resin and reinforcement material are applied. This process is performed at room temperature and continues until the specified thickness is achieved. Reinforcing Materials Generally it is possible to mix unsaturated polyester resins with various reinforcing materials of natural or artificial origin. These reinforcing materials are used to achieve certain mechanical properties (stiffness) and also to reduce resin consumption during production. The reinforcing types used in this project are calcium carbonate (CaCO3) and sand.
Electricity PL (kWh) x EF Electricity medium voltage, at grid, [PL] = CO2-e Emissions
HOBAS Engineering GmbH
Pischeldorfer Str. 128 | 9020 Klagenfurt | Austria | [email protected] | www.hobas.com 9
Emission factors used in these calculations: EF Source Glass fiber, at plant [RER] Ecoinvent Database Silica sand, at plant [RER] Ecoinvent Database Limestone, milled, loose, at plant [CH] Ecoinvent Database Resin (Unsaturated Polyester Resin) EF from literature sources Glass fiber reinforced plastic, polyester resin, hand lay-up, at plant [RER]
Ecoinvent Database
Synthetic rubber, at plant [RER] Ecoinvent Database Various emission factors values for unsaturated polyester resin have been found in the literature research. According to Hedlund-Åström (2008), citing the CES EduPack3, the EF values range from 2,8 to 3,1 kgCO2/kg resin. Patel (2009), in a study citing various sources4 mentions an EF of 2,39 kg CO2/kg resin. EPA (the Environmental Protection Agency in the US) research5 indicates an emission factor level between 1 and 3 for resins in closed molding applications. For the purpose of this report, the larger value of 3,1 kgCO2/kg resin was selected. Figure 5
For open-cut, rubber band was additionally calculated for the coupling production.
3 Anna Hedlund-Åström , „Hotel Module in Glassfiber Sandwich, Environmental Study“, KTH Machine Design, Stockholm, Sweden, 2008, pp. 13 4 Martin Patel , „Closing carbon cycles“, Proefschrift Universiteit Utrecht, Netherlands, 1999, pp.76 5 Environmental protection Agency EPA, AP 42, Fifth Edition, Volume I Chapter 4: Evaporation Loss Sources, 4.4 Polyester Resin Plastic Products Fabrication, 2008, Table 4.4-2
HOBAS Engineering GmbH
Pischeldorfer Str. 128 | 9020 Klagenfurt | Austria | [email protected] | www.hobas.com 10
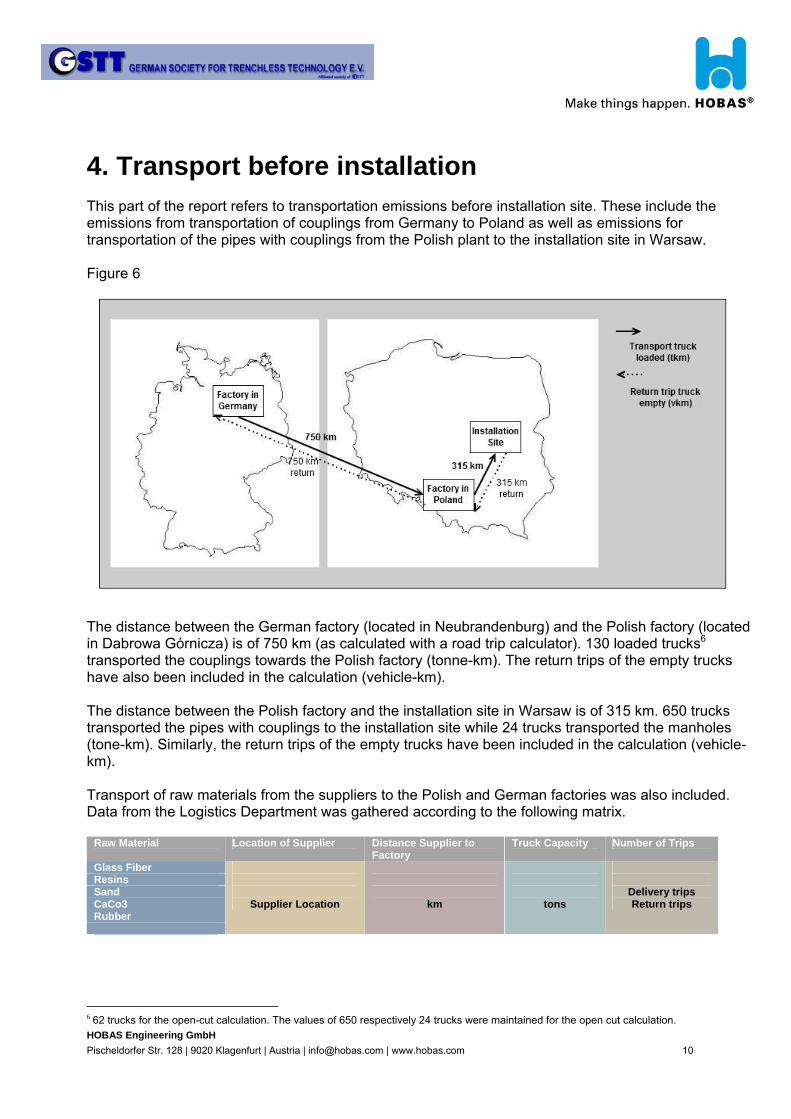
4. Transport before installation This part of the report refers to transportation emissions before installation site. These include the emissions from transportation of couplings from Germany to Poland as well as emissions for transportation of the pipes with couplings from the Polish plant to the installation site in Warsaw. Figure 6
The distance between the German factory (located in Neubrandenburg) and the Polish factory (located in Dabrowa Górnicza) is of 750 km (as calculated with a road trip calculator). 130 loaded trucks6 transported the couplings towards the Polish factory (tonne-km). The return trips of the empty trucks have also been included in the calculation (vehicle-km). The distance between the Polish factory and the installation site in Warsaw is of 315 km. 650 trucks transported the pipes with couplings to the installation site while 24 trucks transported the manholes (tone-km). Similarly, the return trips of the empty trucks have been included in the calculation (vehicle-km). Transport of raw materials from the suppliers to the Polish and German factories was also included. Data from the Logistics Department was gathered according to the following matrix.
Raw Material
Location of Supplier Distance Supplier to Factory
Truck Capacity Number of Trips
Glass Fiber
Supplier Location
km
tons
Delivery trips Return trips
Resins Sand CaCo3 Rubber
6 62 trucks for the open-cut calculation. The values of 650 respectively 24 trucks were maintained for the open cut calculation.
HOBAS Engineering GmbH
Pischeldorfer Str. 128 | 9020 Klagenfurt | Austria | [email protected] | www.hobas.com 11
The transportation CO2 emissions were calculated for fiber glass, resins (resin for closed mold production and resin for hand lay-up production), sand, CaCo3 and rubber. The distances in km from the suppliers to the factories were determined, the truck capacity, as well the number of delivery and return trips needed to supply both locations. Example of calculation: All inputs are calculated similarly and then added-up. Distance (tkm) = Distance traveled by loaded truck Distance (vkm) = Distance traveled on return trip by empty truck EF = Emission factor Emission factors used in these calculations: EF Source Transport, lorry 16-32t, EURO3 [RER] Ecoinvent Database Operation, lorry 16-32t, EURO3 [RER] Ecoinvent Database
Distance (tkm) x EF truck + Distance (vkm) x EF truck = CO2-e Emissions
HOBAS Engineering GmbH
Pischeldorfer Str. 128 | 9020 Klagenfurt | Austria | [email protected] | www.hobas.com 12
5. Installation Installation calculations in this report refer to Czajka I (right side of the river – see Figure 1) which represents most of the pipe line (5,7 km). Installation refers to the preparatory work for the installation of pipes and manholes, the actual installation as well as the closing works once installation is finished. CO2 emissions were determined based on calculations according to the Polish Catalogue of Capital Expenditures (KNR). KNR represents a standard tool, according to Polish construction norms, that is used to determine costing basis of construction projects. Both scenarios were calculated on basis of the KNR: trenchless installation (as implemented) and the open-cut scenario. The models of these calculations are further explained in this chapter.
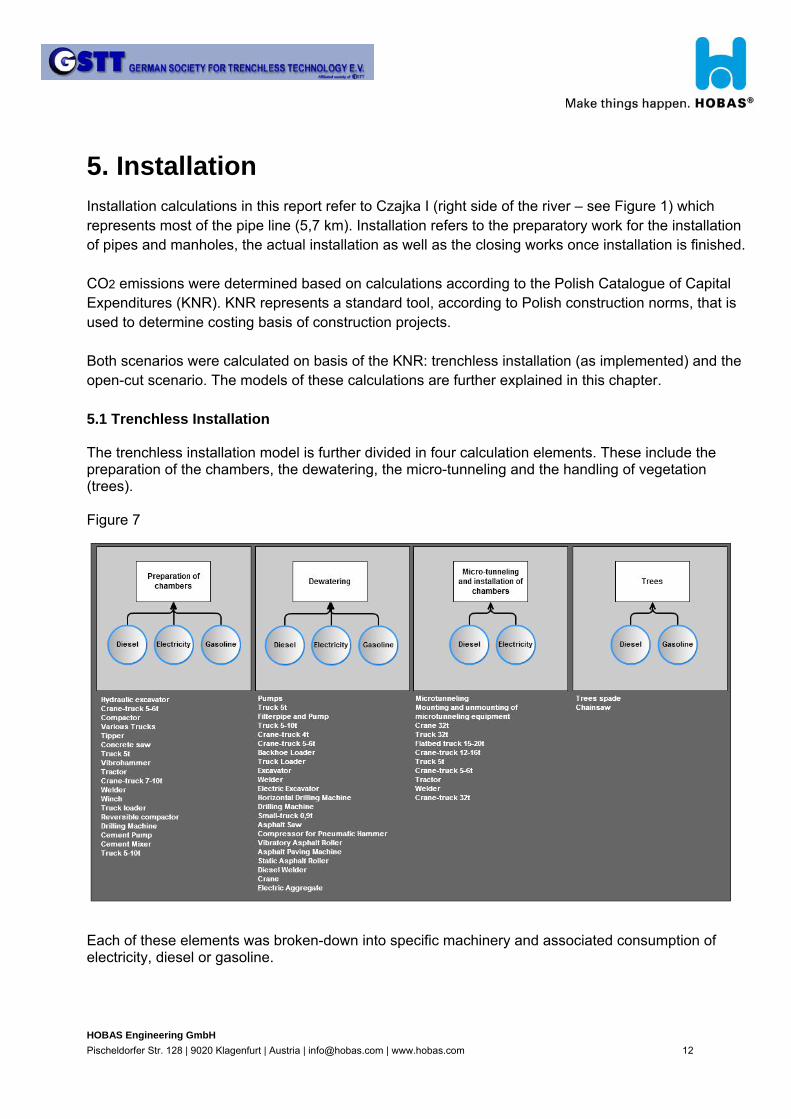
5.1 Trenchless Installation The trenchless installation model is further divided in four calculation elements. These include the preparation of the chambers, the dewatering, the micro-tunneling and the handling of vegetation (trees). Figure 7
Each of these elements was broken-down into specific machinery and associated consumption of electricity, diesel or gasoline.
HOBAS Engineering GmbH
Pischeldorfer Str. 128 | 9020 Klagenfurt | Austria | [email protected] | www.hobas.com 13
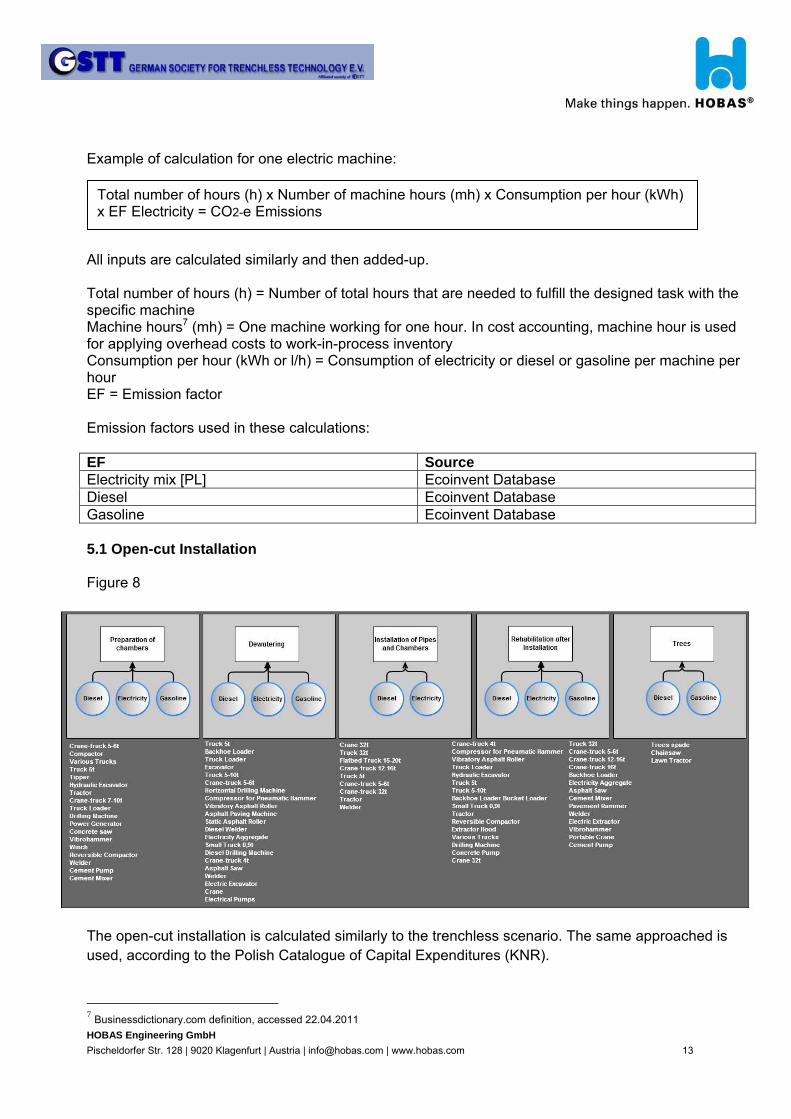
Example of calculation for one electric machine: All inputs are calculated similarly and then added-up. Total number of hours (h) = Number of total hours that are needed to fulfill the designed task with the specific machine Machine hours7 (mh) = One machine working for one hour. In cost accounting, machine hour is used for applying overhead costs to work-in-process inventory Consumption per hour (kWh or l/h) = Consumption of electricity or diesel or gasoline per machine per hour EF = Emission factor Emission factors used in these calculations: EF Source Electricity mix [PL] Ecoinvent Database Diesel Ecoinvent Database Gasoline Ecoinvent Database 5.1 Open-cut Installation Figure 8
The open-cut installation is calculated similarly to the trenchless scenario. The same approached is used, according to the Polish Catalogue of Capital Expenditures (KNR).
7 Businessdictionary.com definition, accessed 22.04.2011
Total number of hours (h) x Number of machine hours (mh) x Consumption per hour (kWh) x EF Electricity = CO2-e Emissions
HOBAS Engineering GmbH
Pischeldorfer Str. 128 | 9020 Klagenfurt | Austria | [email protected] | www.hobas.com 14
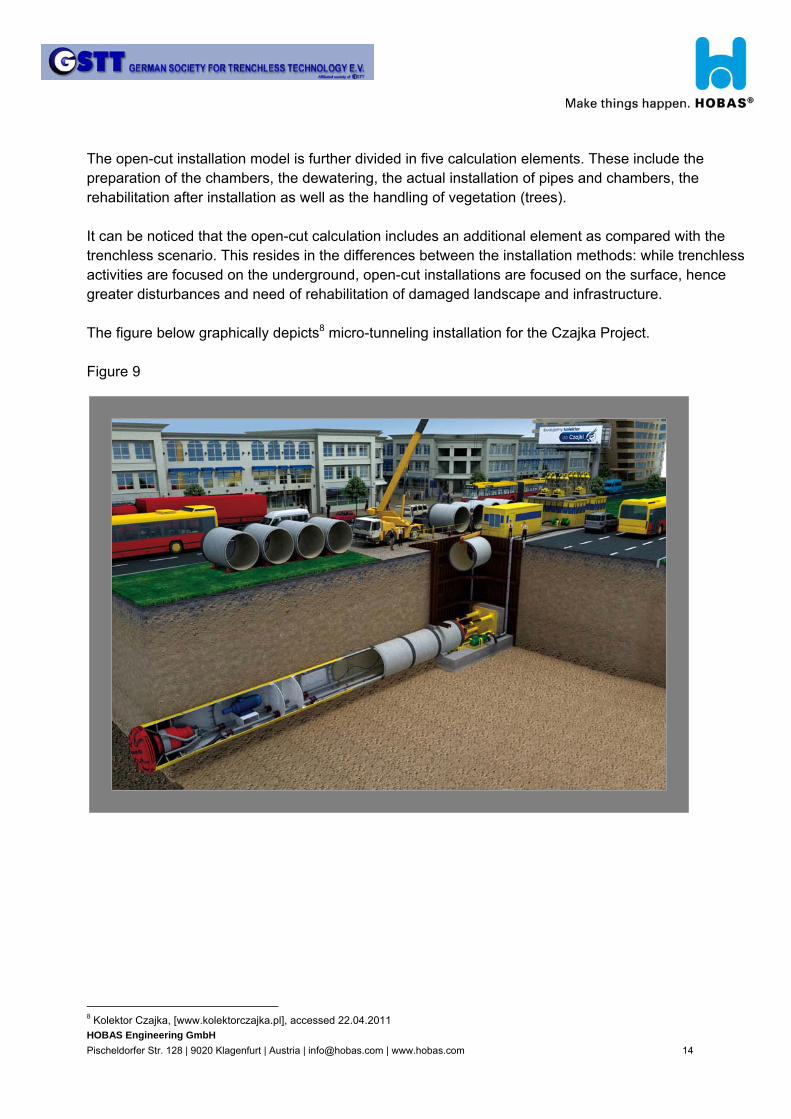
The open-cut installation model is further divided in five calculation elements. These include the preparation of the chambers, the dewatering, the actual installation of pipes and chambers, the rehabilitation after installation as well as the handling of vegetation (trees). It can be noticed that the open-cut calculation includes an additional element as compared with the trenchless scenario. This resides in the differences between the installation methods: while trenchless activities are focused on the underground, open-cut installations are focused on the surface, hence greater disturbances and need of rehabilitation of damaged landscape and infrastructure. The figure below graphically depicts8 micro-tunneling installation for the Czajka Project. Figure 9
8 Kolektor Czajka, [www.kolektorczajka.pl], accessed 22.04.2011

HOBAS Engineering GmbH
Pischeldorfer Str. 128 | 9020 Klagenfurt | Austria | [email protected] | www.hobas.com 15
6. Traffic Traffic was measured on location for the 2,54 km six-lane section of Modlińska Street. On site measurements were organized in June 2010 (during construction work) and in February 2011 (after completion of works). Figure 10
Traffic volumes were assessed from traffic counts. Annual average daily traffic, abbreviated AADT, is the total volume of vehicle traffic of road for a year divided by 365 days. AADT is used to measure how busy a road is. For the purpose of calculation of AADT from peak hour traffic volumes, it was assumed that peak hour traffic volumes represent 11% of AADT9. The period where traffic was affected is the time for preparation of chambers, dewatering, micro-tunnelling and installation of pipes. On Modlińska Street there were five sections (trenchless scenario as well as open-cut scenario). Based on the KNR (Polish Catalogue of Capital Expenditures) calculations, the number of days-estimate for job completion for Modlińska Street was 300 days for the trenchless calculation and 350 days for the open-cut. In the case of the open-cut installation the estimation indicates a best-case installation scenario when the job would be executed simultaneously on all sections of the project; this would be possible with the approval of the road administrator. However, in practice the actual number of days to completion can be higher. For example, based on on-site observation, the number of days for the 2,544 km section of Modlińska Street included ≈108 days for micro-tunnelling, ≈90 days for preparation of chambers, ≈90 days for
9 Territory and Municipal Services (TAMS), Design standards for urban infrastructure – Chapter 6, Latest version, Canberra City ACT 2601, Australia, pp.9

HOBAS Engineering GmbH
Pischeldorfer Str. 128 | 9020 Klagenfurt | Austria | [email protected] | www.hobas.com 16
reception of chambers and ≈420 days for installation of the tangential manholes (3 weeks for every tangential chamber x 20 tangential chambers); in total, ≈708 days. This is more than double as the estimated value (300 days). However, it could be argued that the installation of the tangential chambers may have less influence on the traffic than the previous preparatory steps. According to Jung and Shina (2004), existing trenchless and open-cut projects show that in most cases the lane closure scenarios for both trenchless and open-cut projects were similar in terms of lane closure. “However, it was believed that the job duration would be different” and that in general “trenchless technology saves time in the overall construction”.10 As a result, this study takes the KNR estimated values as a basis for calculation (300 days for trenchless and 350 days for open-cut) as well as the assumption that maximum one lane (per sub-section of the works) was blocked along the 2,544 km section for both scenarios. In the trenchless, actual scenario, sections of one lane were blocked at a time as the works advanced; in the open-cut scenario it is estimated that one lane would be blocked for the entire length of the 2,544 km. Example of calculation for personal cars: All inputs are calculated similarly and then added-up. AADT Personal Cars (measured value) = Annual average daily traffic determined by on-site measurements Number of days (days) = The total number of days that traffic was affected on the 2,544 km section of Modlińska Street EF = Emission factor Emission factors used in these calculations: EF Source Operation, passenger car [RER] Ecoinvent Database Operation, van < 3.5t [RER] Ecoinvent Database Operation, lorry 3.5-16t, fleet average [RER] Ecoinvent Database Operation, regular bus [CH] Ecoinvent Database Vehicle-kilometers emission factors have been used for this part of the calculation; even though traffic counts were performed on site it is difficult to estimate the degree of occupancy or the load-degree of vehicles (i.e. person-kilometers or tons-kilometers). The carbon dioxide emissions are therefore determined based on the premises that the vehicles are merely operated (and not necessarily additionally occupied in case of passengers or additionally loaded in case of trucks). Traffic volumes for the trenchless scenario as well as for the regular traffic have been assessed based on actual traffic counts. Subsequently, carbon dioxide emissions have been calculated as described above. For the open-cut scenario (theoretical scenario) however, actual traffic counts could not be performed. 10 Yeun J. Jung, Sunil K. Sinha, „Trenchless Technology: An Efficient and Environmentally Sound Approach for Underground Municipal Pipeline Infrastructure Systems”, No Dig 2004, New Orleans, pp7.
AADT Personal Cars (measured value) x Number of days (days) x EF Passenger car = CO2-e Emissions
HOBAS Engineering GmbH
Pischeldorfer Str. 128 | 9020 Klagenfurt | Austria | [email protected] | www.hobas.com 17
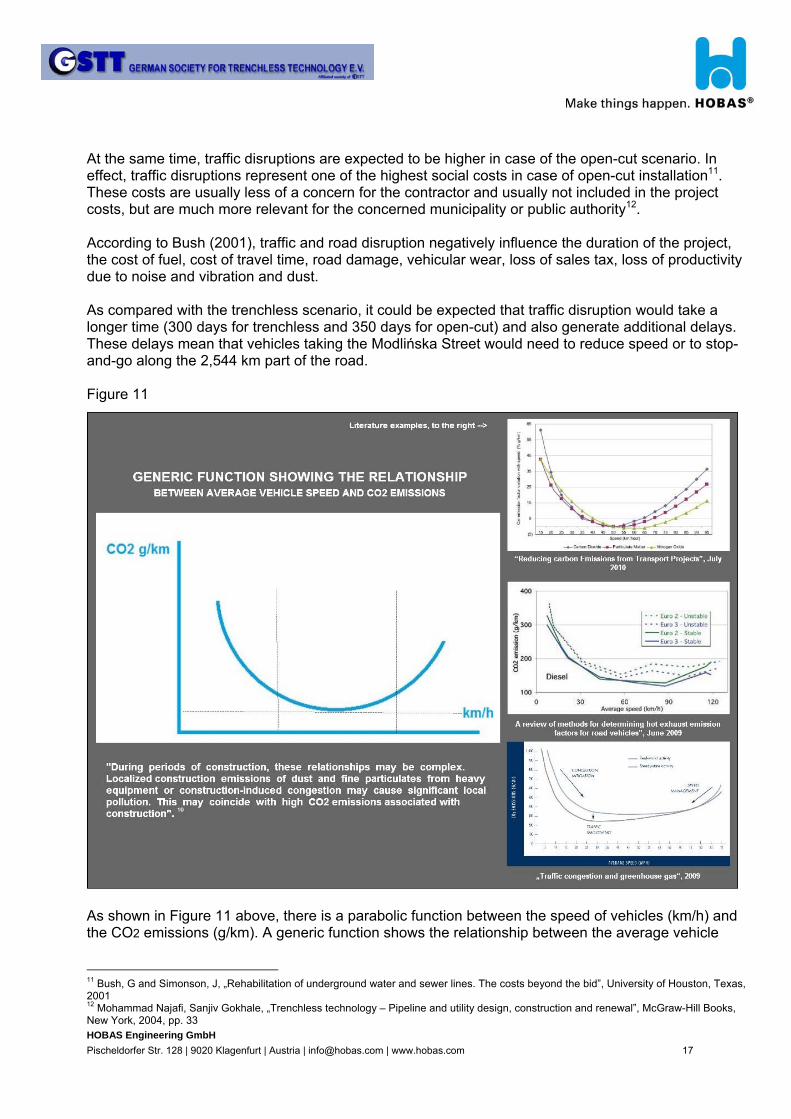
At the same time, traffic disruptions are expected to be higher in case of the open-cut scenario. In effect, traffic disruptions represent one of the highest social costs in case of open-cut installation11. These costs are usually less of a concern for the contractor and usually not included in the project costs, but are much more relevant for the concerned municipality or public authority12. According to Bush (2001), traffic and road disruption negatively influence the duration of the project, the cost of fuel, cost of travel time, road damage, vehicular wear, loss of sales tax, loss of productivity due to noise and vibration and dust. As compared with the trenchless scenario, it could be expected that traffic disruption would take a longer time (300 days for trenchless and 350 days for open-cut) and also generate additional delays. These delays mean that vehicles taking the Modlińska Street would need to reduce speed or to stop-and-go along the 2,544 km part of the road. Figure 11
As shown in Figure 11 above, there is a parabolic function between the speed of vehicles (km/h) and the CO2 emissions (g/km). A generic function shows the relationship between the average vehicle
11 Bush, G and Simonson, J, „Rehabilitation of underground water and sewer lines. The costs beyond the bid”, University of Houston, Texas, 2001 12 Mohammad Najafi, Sanjiv Gokhale, „Trenchless technology – Pipeline and utility design, construction and renewal”, McGraw-Hill Books, New York, 2004, pp. 33

HOBAS Engineering GmbH
Pischeldorfer Str. 128 | 9020 Klagenfurt | Austria | [email protected] | www.hobas.com 18
speed and the CO2 emissions. This generic function13 was drawn from literature examples, which are inserted to the right. Boulter, Barlow, Latham and McCrae14 also differentiate if the speed is constant (stable) or unsteady (unstable). In case of unsteady speed, CO2 emissions tend to increase. The authors also detail on the fuel type, providing both diesel and petrol (see Figure 12 below). Figure 12
In a different study, “Reducing carbon Emissions from Transport Projects”, July 201015
, it is noted that CO2 pollution tends to decrease as traffic speed approaches the 40–60 km per hour range, and then increase again at higher speeds (as shown in Figure 12). Figure 13
According to Barth and Boriboonsomsin16 (2009) very low average speeds generally represent stop-and-go driving, and vehicles do not travel far. Therefore, the emission rates are quite high. Conversely,
13 The value of the emission factors varies from one study to another according to study scope and methodology. 14 PG Boulter, T J Barlow, S Latham, I S McCrae, “Emission Factors 2009, Report 1- A review of methods for determining hot exhaust emission factors for road vehicles”, TRL Limited, June 2009, pp. 40 15 Asian Development Bank, Independent Evaluation Department, “Reducing carbon Emissions from Transport Projects”, July 2010, pp. 18 16 Matthew Barth and Kanok Boriboonsomsin, „Traffic congestion and greenhouse gas“, Access – Transportation research at the University of California, 2009, pp. 5

HOBAS Engineering GmbH
Pischeldorfer Str. 128 | 9020 Klagenfurt | Austria | [email protected] | www.hobas.com 19
when vehicles travel at much higher speeds, they demand very high engine loads, which require more fuel, and which therefore lead to high CO2 emission rates. As a result, this emissions-speed curve has a distinctive parabolic shape, with high emission rates on both ends.
Park and Rakha17 (2005) also establish a correlation between the speed of vehicles (km/h) and the CO2 emissions (g/km) (Figure 14 below). The study demonstrates that the impact of roadway grade is significant with increases in vehicle fuel consumption and emission rates in excess of 9% for a 1% increase in roadway grade. Consequently, a reduction in roadway grades in the range of 1% can offer savings that are equivalent to various forms of advanced traffic management systems.
Figure 14
While the general conclusion that low and high speeds generate high emission factors, the value of the emission factors varies from one study to another according to the study scope and methodology. The cited studies refer to emissions from LDV (light-duty vehicles), HDV (heavy-duty vehicles) or both. However, it can be observed that in all studies a mix situation of stop-and-go and low speed (under 40 km/h) multiplies the emissions factors two to seven times. According to the IRU (International Road Transport Union)18, taking the example of a 40t lorry, road congestion increases fuel consumption and thus CO2 emissions by 300% and free flowing traffic is a prerequisite for reducing CO2 emissions. As a result, a threefold-multiplicator to the vehicles emission factors in conjunction with a 350 days traffic disturbance period was considered in this study for the traffic emissions of the open-cut scenario. Figure 15 below presents an aerial view19 of the traffic situation for the trenchless installation.
17 Sangjun Park and Hesham Rakha, „Energy and environmental impact of roadway grades”, Department of Civil and Environmental Engineering, Virginia Tech, 2005, pp. 14 18 IRU (International Road Transport Union), http://www.iru.org/index/en_policy_co2_response_flowingtraffic, accessed 08.04.2011 19 Kolektor Czajka, [www.kolektorczajka.pl], accessed 22.04.2011
HOBAS Engineering GmbH
Pischeldorfer Str. 128 | 9020 Klagenfurt | Austria | [email protected] | www.hobas.com 20
7. Results 7.1 TOTAL CO2 Emissions
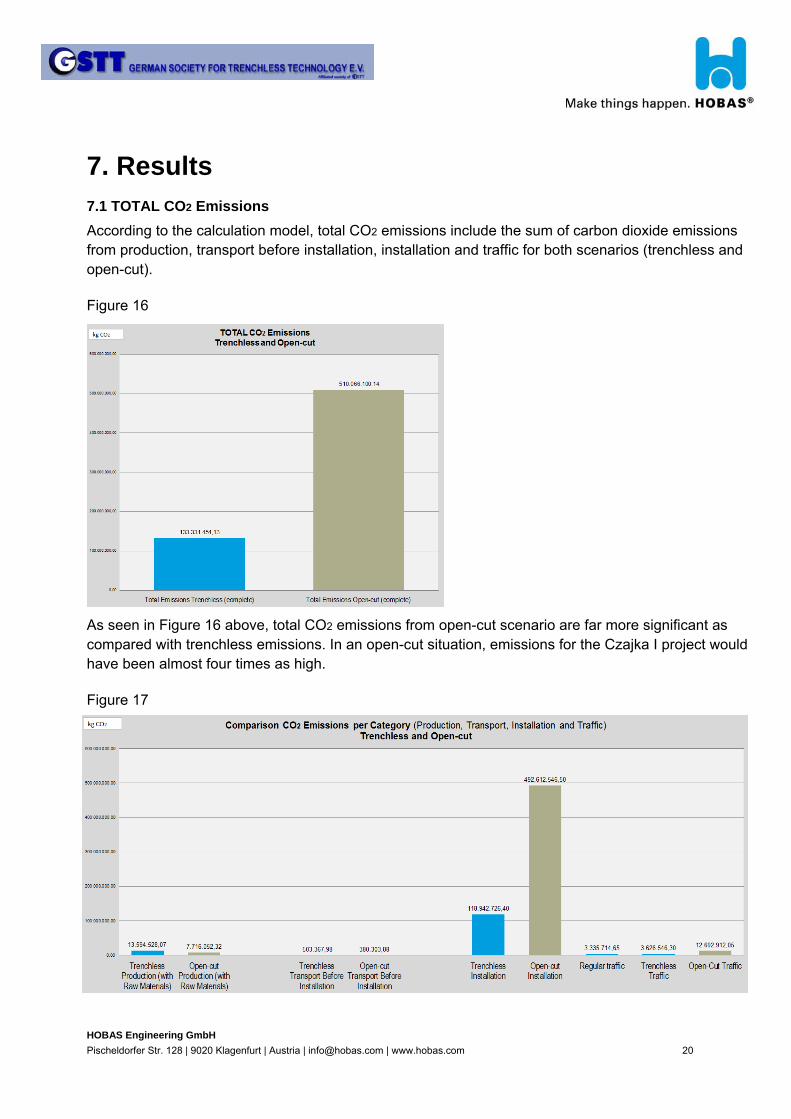
According to the calculation model, total CO2 emissions include the sum of carbon dioxide emissions from production, transport before installation, installation and traffic for both scenarios (trenchless and open-cut). Figure 16
As seen in Figure 16 above, total CO2 emissions from open-cut scenario are far more significant as compared with trenchless emissions. In an open-cut situation, emissions for the Czajka I project would have been almost four times as high. Figure 17
HOBAS Engineering GmbH
Pischeldorfer Str. 128 | 9020 Klagenfurt | Austria | [email protected] | www.hobas.com 21
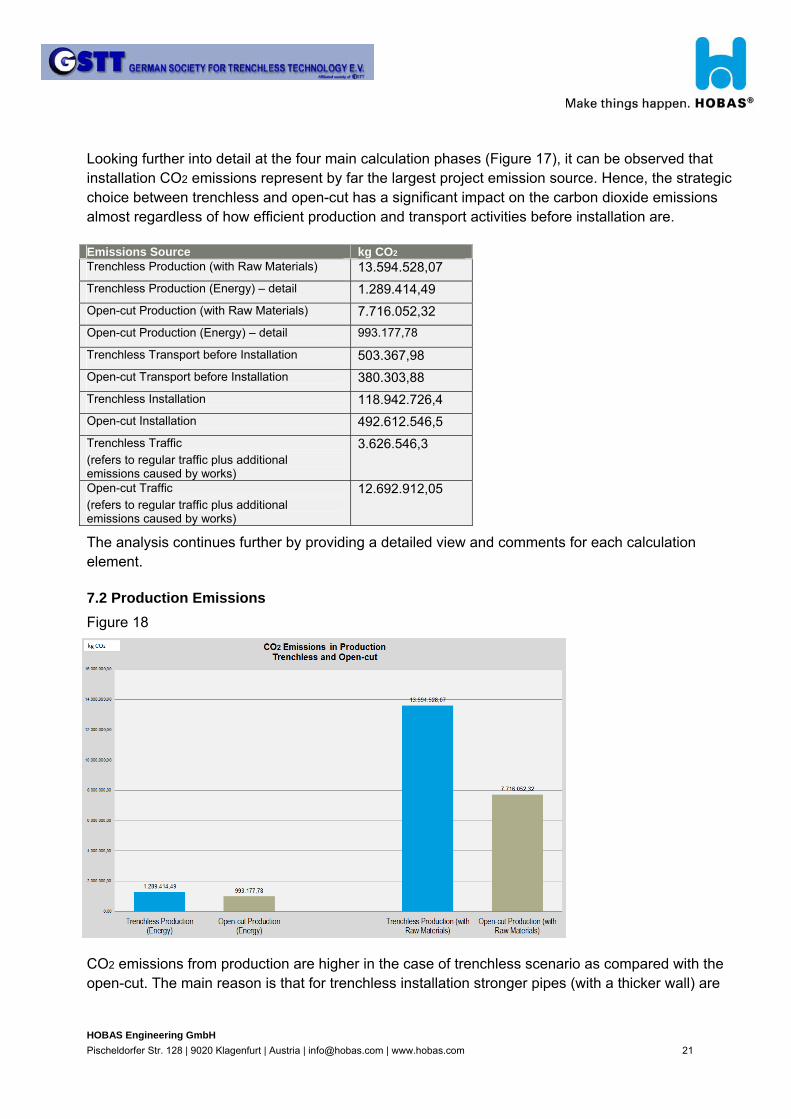
Looking further into detail at the four main calculation phases (Figure 17), it can be observed that installation CO2 emissions represent by far the largest project emission source. Hence, the strategic choice between trenchless and open-cut has a significant impact on the carbon dioxide emissions almost regardless of how efficient production and transport activities before installation are. Emissions Source kg CO2
Trenchless Production (with Raw Materials)
13.594.528,07
Trenchless Production (Energy) – detail
1.289.414,49
Open-cut Production (with Raw Materials)
7.716.052,32
Open-cut Production (Energy) – detail
993.177,78
Trenchless Transport before Installation
503.367,98
Open-cut Transport before Installation
380.303,88
Trenchless Installation
118.942.726,4
Open-cut Installation
492.612.546,5
Trenchless Traffic
(refers to regular traffic plus additional emissions caused by works)
3.626.546,3
Open-cut Traffic
(refers to regular traffic plus additional emissions caused by works)
12.692.912,05
The analysis continues further by providing a detailed view and comments for each calculation element. 7.2 Production Emissions
Figure 18
CO2 emissions from production are higher in the case of trenchless scenario as compared with the open-cut. The main reason is that for trenchless installation stronger pipes (with a thicker wall) are
HOBAS Engineering GmbH
Pischeldorfer Str. 128 | 9020 Klagenfurt | Austria | [email protected] | www.hobas.com 22
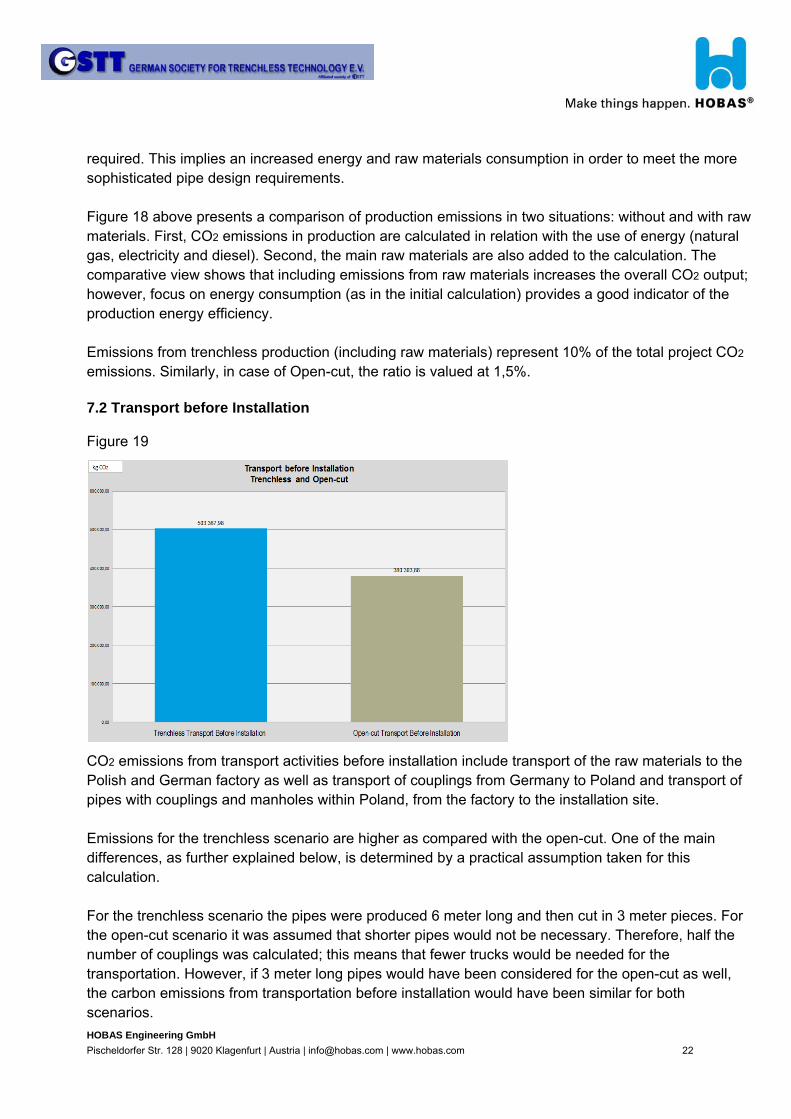
required. This implies an increased energy and raw materials consumption in order to meet the more sophisticated pipe design requirements. Figure 18 above presents a comparison of production emissions in two situations: without and with raw materials. First, CO2 emissions in production are calculated in relation with the use of energy (natural gas, electricity and diesel). Second, the main raw materials are also added to the calculation. The comparative view shows that including emissions from raw materials increases the overall CO2 output; however, focus on energy consumption (as in the initial calculation) provides a good indicator of the production energy efficiency. Emissions from trenchless production (including raw materials) represent 10% of the total project CO2 emissions. Similarly, in case of Open-cut, the ratio is valued at 1,5%. 7.2 Transport before Installation Figure 19
CO2 emissions from transport activities before installation include transport of the raw materials to the Polish and German factory as well as transport of couplings from Germany to Poland and transport of pipes with couplings and manholes within Poland, from the factory to the installation site. Emissions for the trenchless scenario are higher as compared with the open-cut. One of the main differences, as further explained below, is determined by a practical assumption taken for this calculation. For the trenchless scenario the pipes were produced 6 meter long and then cut in 3 meter pieces. For the open-cut scenario it was assumed that shorter pipes would not be necessary. Therefore, half the number of couplings was calculated; this means that fewer trucks would be needed for the transportation. However, if 3 meter long pipes would have been considered for the open-cut as well, the carbon emissions from transportation before installation would have been similar for both scenarios.
HOBAS Engineering GmbH
Pischeldorfer Str. 128 | 9020 Klagenfurt | Austria | [email protected] | www.hobas.com 23
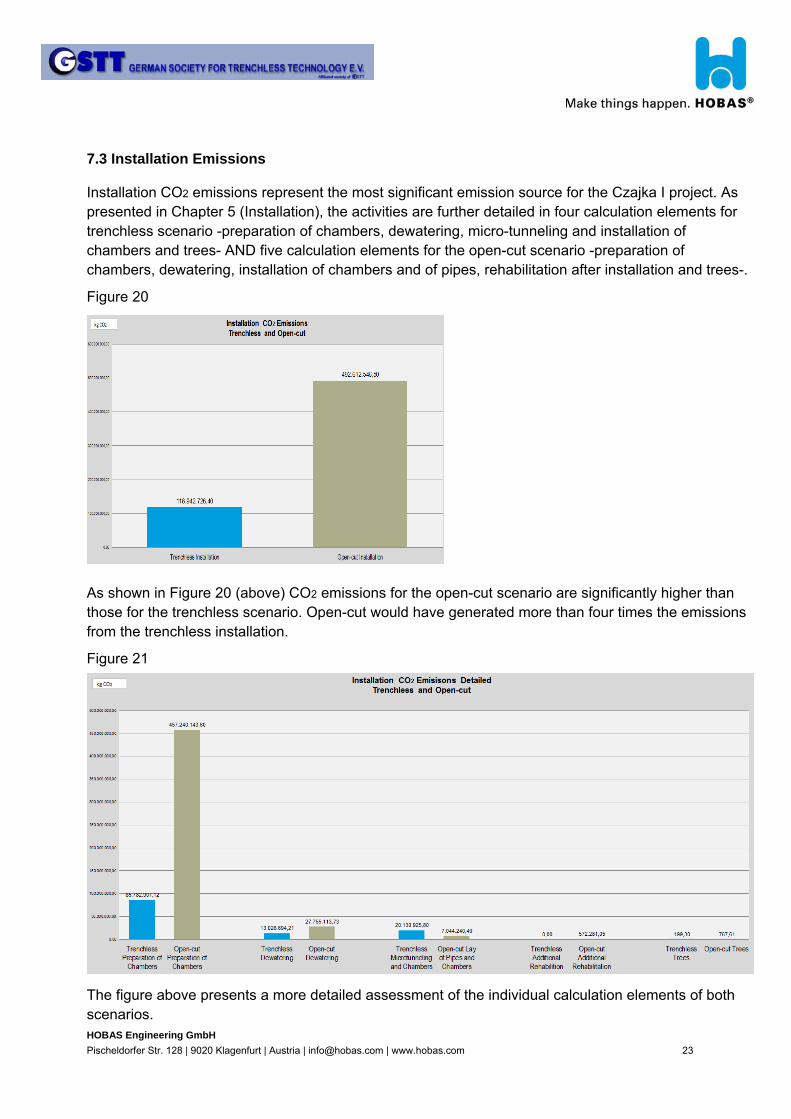
7.3 Installation Emissions Installation CO2 emissions represent the most significant emission source for the Czajka I project. As presented in Chapter 5 (Installation), the activities are further detailed in four calculation elements for trenchless scenario -preparation of chambers, dewatering, micro-tunneling and installation of chambers and trees- AND five calculation elements for the open-cut scenario -preparation of chambers, dewatering, installation of chambers and of pipes, rehabilitation after installation and trees-.
Figure 20
As shown in Figure 20 (above) CO2 emissions for the open-cut scenario are significantly higher than those for the trenchless scenario. Open-cut would have generated more than four times the emissions from the trenchless installation.
Figure 21
The figure above presents a more detailed assessment of the individual calculation elements of both scenarios.
HOBAS Engineering GmbH
Pischeldorfer Str. 128 | 9020 Klagenfurt | Austria | [email protected] | www.hobas.com 24
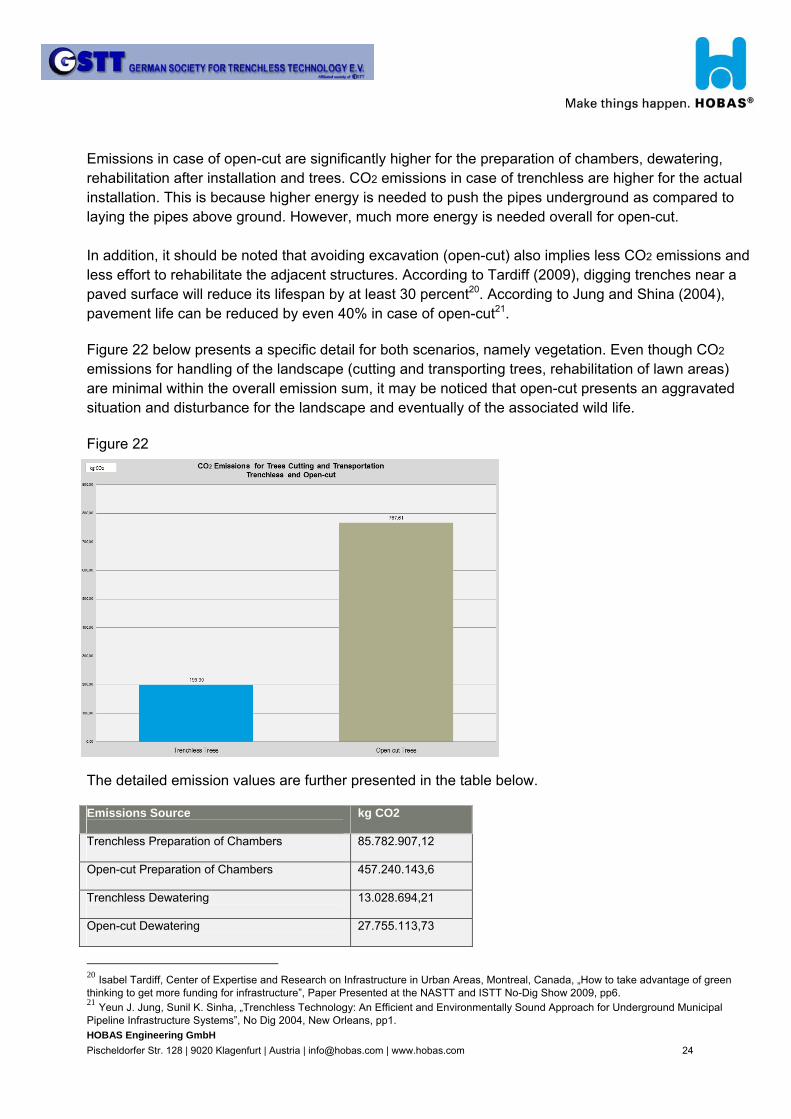
Emissions in case of open-cut are significantly higher for the preparation of chambers, dewatering, rehabilitation after installation and trees. CO2 emissions in case of trenchless are higher for the actual installation. This is because higher energy is needed to push the pipes underground as compared to laying the pipes above ground. However, much more energy is needed overall for open-cut. In addition, it should be noted that avoiding excavation (open-cut) also implies less CO2 emissions and less effort to rehabilitate the adjacent structures. According to Tardiff (2009), digging trenches near a paved surface will reduce its lifespan by at least 30 percent20. According to Jung and Shina (2004), pavement life can be reduced by even 40% in case of open-cut21. Figure 22 below presents a specific detail for both scenarios, namely vegetation. Even though CO2 emissions for handling of the landscape (cutting and transporting trees, rehabilitation of lawn areas) are minimal within the overall emission sum, it may be noticed that open-cut presents an aggravated situation and disturbance for the landscape and eventually of the associated wild life. Figure 22
The detailed emission values are further presented in the table below. Emissions Source
kg CO2
Trenchless Preparation of Chambers
85.782.907,12
Open-cut Preparation of Chambers
457.240.143,6
Trenchless Dewatering
13.028.694,21
Open-cut Dewatering
27.755.113,73
20 Isabel Tardiff, Center of Expertise and Research on Infrastructure in Urban Areas, Montreal, Canada, „How to take advantage of green thinking to get more funding for infrastructure”, Paper Presented at the NASTT and ISTT No-Dig Show 2009, pp6. 21 Yeun J. Jung, Sunil K. Sinha, „Trenchless Technology: An Efficient and Environmentally Sound Approach for Underground Municipal Pipeline Infrastructure Systems”, No Dig 2004, New Orleans, pp1.

HOBAS Engineering GmbH
Pischeldorfer Str. 128 | 9020 Klagenfurt | Austria | [email protected] | www.hobas.com 25
Trenchless Micro-tunneling and Installation of Chambers
20.130.925,8
Open-cut Lay of Pipes and Installation of Chambers
7.044.240,49
Trenchless Additional Rehabilitation
0,00
Open-cut Additional Rehabilitation
572.281,05
Trenchless Trees
199,3
Open-cut Trees
767,61
HOBAS Engineering GmbH
Pischeldorfer Str. 128 | 9020 Klagenfurt | Austria | [email protected] | www.hobas.com 26
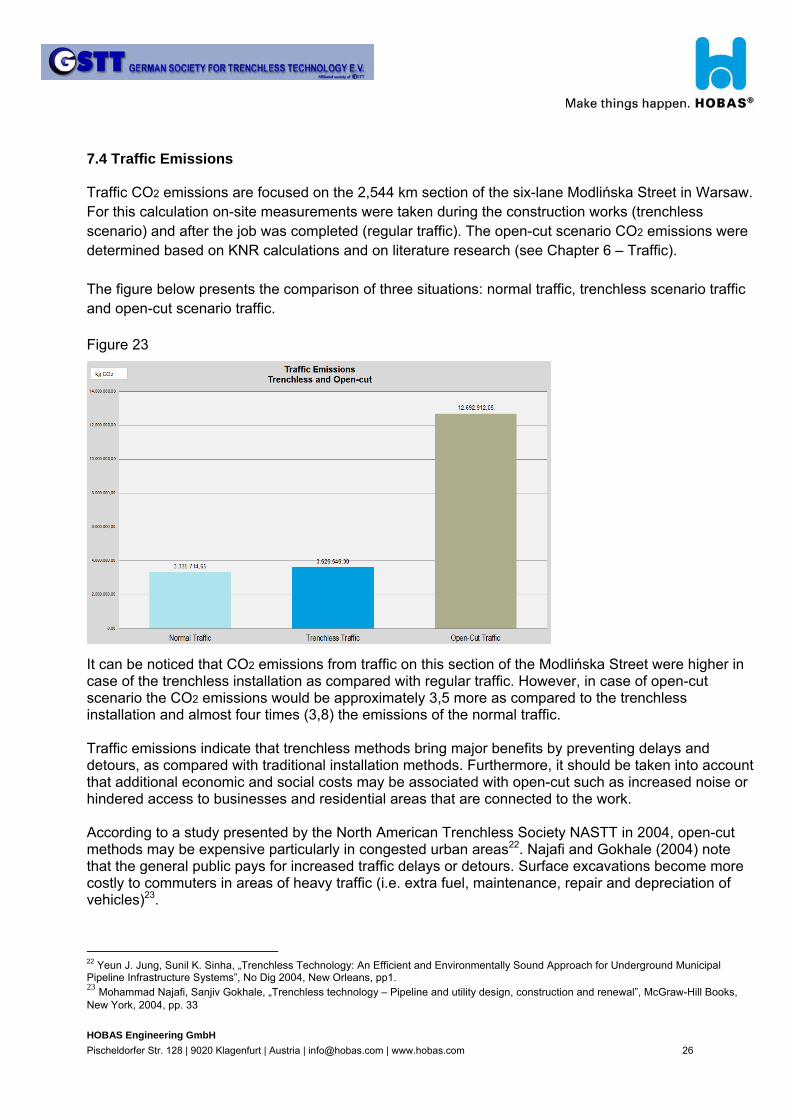
7.4 Traffic Emissions Traffic CO2 emissions are focused on the 2,544 km section of the six-lane Modlińska Street in Warsaw. For this calculation on-site measurements were taken during the construction works (trenchless scenario) and after the job was completed (regular traffic). The open-cut scenario CO2 emissions were determined based on KNR calculations and on literature research (see Chapter 6 – Traffic). The figure below presents the comparison of three situations: normal traffic, trenchless scenario traffic and open-cut scenario traffic. Figure 23
It can be noticed that CO2 emissions from traffic on this section of the Modlińska Street were higher in case of the trenchless installation as compared with regular traffic. However, in case of open-cut scenario the CO2 emissions would be approximately 3,5 more as compared to the trenchless installation and almost four times (3,8) the emissions of the normal traffic. Traffic emissions indicate that trenchless methods bring major benefits by preventing delays and detours, as compared with traditional installation methods. Furthermore, it should be taken into account that additional economic and social costs may be associated with open-cut such as increased noise or hindered access to businesses and residential areas that are connected to the work. According to a study presented by the North American Trenchless Society NASTT in 2004, open-cut methods may be expensive particularly in congested urban areas22. Najafi and Gokhale (2004) note that the general public pays for increased traffic delays or detours. Surface excavations become more costly to commuters in areas of heavy traffic (i.e. extra fuel, maintenance, repair and depreciation of vehicles)23.
22 Yeun J. Jung, Sunil K. Sinha, „Trenchless Technology: An Efficient and Environmentally Sound Approach for Underground Municipal Pipeline Infrastructure Systems”, No Dig 2004, New Orleans, pp1. 23 Mohammad Najafi, Sanjiv Gokhale, „Trenchless technology – Pipeline and utility design, construction and renewal”, McGraw-Hill Books, New York, 2004, pp. 33
HOBAS Engineering GmbH
Pischeldorfer Str. 128 | 9020 Klagenfurt | Austria | [email protected] | www.hobas.com 27
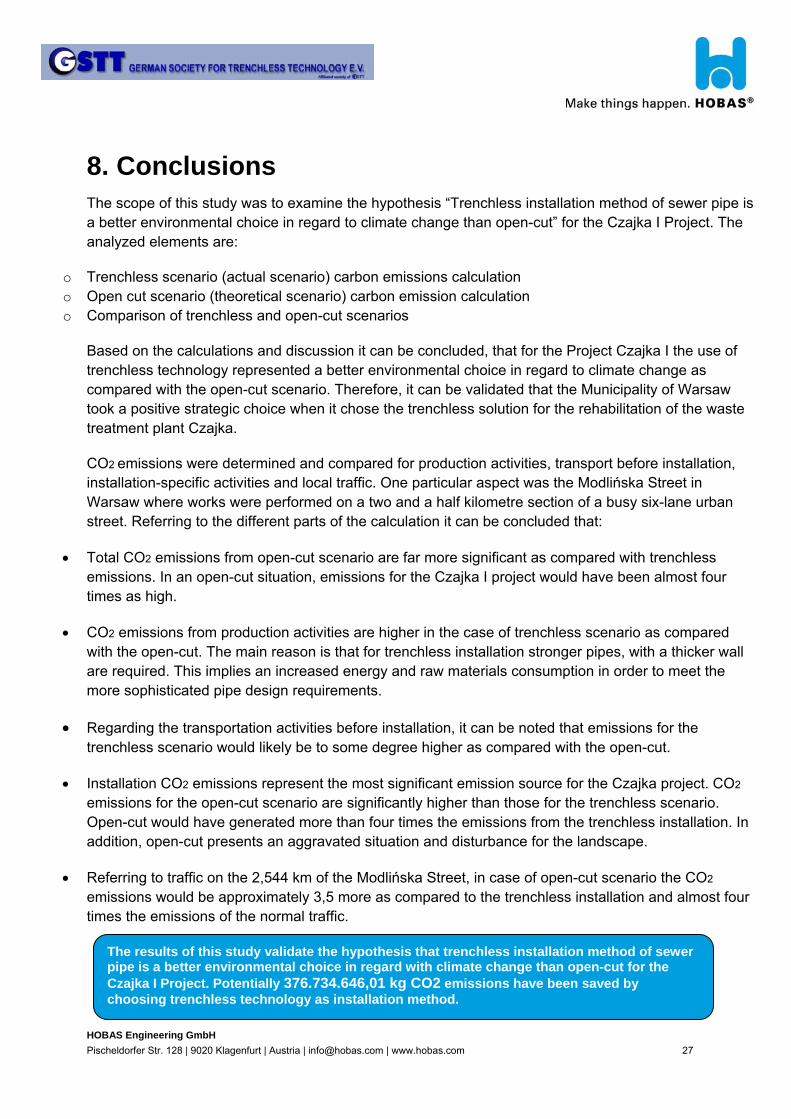
8. Conclusions The scope of this study was to examine the hypothesis “Trenchless installation method of sewer pipe is a better environmental choice in regard to climate change than open-cut” for the Czajka I Project. The analyzed elements are:
o Trenchless scenario (actual scenario) carbon emissions calculation o Open cut scenario (theoretical scenario) carbon emission calculation o Comparison of trenchless and open-cut scenarios
Based on the calculations and discussion it can be concluded, that for the Project Czajka I the use of trenchless technology represented a better environmental choice in regard to climate change as compared with the open-cut scenario. Therefore, it can be validated that the Municipality of Warsaw took a positive strategic choice when it chose the trenchless solution for the rehabilitation of the waste treatment plant Czajka.
CO2 emissions were determined and compared for production activities, transport before installation, installation-specific activities and local traffic. One particular aspect was the Modlińska Street in Warsaw where works were performed on a two and a half kilometre section of a busy six-lane urban street. Referring to the different parts of the calculation it can be concluded that:
Total CO2 emissions from open-cut scenario are far more significant as compared with trenchless emissions. In an open-cut situation, emissions for the Czajka I project would have been almost four times as high.
CO2 emissions from production activities are higher in the case of trenchless scenario as compared with the open-cut. The main reason is that for trenchless installation stronger pipes, with a thicker wall are required. This implies an increased energy and raw materials consumption in order to meet the more sophisticated pipe design requirements.
Regarding the transportation activities before installation, it can be noted that emissions for the trenchless scenario would likely be to some degree higher as compared with the open-cut.
Installation CO2 emissions represent the most significant emission source for the Czajka project. CO2 emissions for the open-cut scenario are significantly higher than those for the trenchless scenario. Open-cut would have generated more than four times the emissions from the trenchless installation. In addition, open-cut presents an aggravated situation and disturbance for the landscape.
Referring to traffic on the 2,544 km of the Modlińska Street, in case of open-cut scenario the CO2 emissions would be approximately 3,5 more as compared to the trenchless installation and almost four times the emissions of the normal traffic.
The results of this study validate the hypothesis that trenchless installation method of sewer pipe is a better environmental choice in regard with climate change than open-cut for the Czajka I Project. Potentially 376.734.646,01 kg CO2 emissions have been saved by choosing trenchless technology as installation method.

HOBAS Engineering GmbH
Pischeldorfer Str. 128 | 9020 Klagenfurt | Austria | [email protected] | www.hobas.com 28
9. Critical Review The comparison of CO2 emissions for the trenchless and conventional
installation methods using the example of the Czajka Project in Warsaw
was initiated and supported by the GSTT. The present work has been
examined by GSTT and critically reviewed.
Of particular interest is the approach to investigate CO2 emissions of a
specific project, from production, to transportation and to installation of the
pipe system. Equally interesting is the study of traffic disruptions using on-
site traffic counts during installation works. Special attention was paid to
the installation-phase and to the traffic emissions, as these provide the
most significant CO2 reduction potential.
About 76% less CO2 emissions were generated in the installation-phase by using trenchless
technology for this project, as compared with conventional installation methods. The GSTT has
determined in previous investigations 63% less CO2 emissions, however for a much smaller diameter
jacking pipe system (DN 600) and in the absence of groundwater drainage. The determined values for
this specific project are therefore deemed reasonable.
The biggest CO2 emissions reduction potential subsists with the traffic emissions. However, by
reviewing various investigations on the subject, it can be inferred that determination of carbon
emissions poses the most difficulty precisely in this area. There are few projects for which both open-
cut and trenchless installation methods are alongside employed; therefore assumptions to determinate
CO2 traffic emissions are usually needed for one of the two situations. On-site traffic counts were taken
for the Czajka Project both in normal traffic conditions and in relatively low traffic disturbances caused
by trenchless installation. The result confirms our experience that temporary, point by point restrictions
of one lane only increase emissions marginally. Actual measurements for this study indicate a 9%
increase in carbon emissions. Much more aggravated traffic emissions result from the comparison
between trenchless and open-cut methods. In this case, the increase in traffic emissions was
determined at 350%. The calculation is based on various studies used in conjunction with the
Ecoinvent database. Random checks in the calculation confirm the results. A very conservative
assumption is the number of days estimated for job completion. It was considered that open-cut would
take with only 16% more time as compared with trenchless installation, whereas our experience
indicates between 30 and 50% more time, with other studies reporting up to 60%. The assumption that
for open-cut one lane would be blocked for the entire length is also in reality difficult to perform.

HOBAS Engineering GmbH
Pischeldorfer Str. 128 | 9020 Klagenfurt | Austria | [email protected] | www.hobas.com 29
Excavating the soil and related loading activities in relation with the total volume of soil represent in
case of open-cut a logistical challenge. The probability that at least sectionally an additional lane would
be closed is relatively high. Thus, the carbon emissions would increase significantly once again.
In summary, it can be stated that the present study uses reliable data sources and calculation models
and that very conservative considerations were made in cases for which assumptions had to be taken.
It can be assumed that actual savings in carbon emissions for the Czajka I Project by using trenchless
technology instead of open-cut are even higher than the value determined in the study of
376.734.646,01 kg of CO2.
Prof. Jens Hölterhoff, Chairman GSTT e.V.
HOBAS Engineering GmbH
Pischeldorfer Str. 128 | 9020 Klagenfurt | Austria | [email protected] | www.hobas.com 30
10. Bibliography
Anna Hedlund-Åström, „Hotel Module in Glassfiber Sandwich, Environmental Study“, KTH Machine Design, Stockholm, Sweden, 2008, pp. 13
Martin Patel, „Closing carbon cycles“, Proefschrift Universiteit Utrecht, Utrecht, Netherlands,
1999, pp.76
Environmental Protection Agency EPA, AP 42, Fifth Edition, Volume I Chapter 4: Evaporation Loss Sources, 4.4 Polyester Resin Plastic Products Fabrication, USA, 2008, Table 4.4-2
Territory and Municipal Services (TAMS), Design standards for urban infrastructure – Chapter
6, Latest version, Canberra City ACT 2601, Canberra, Australia, pp.9
Yeun J. Jung, Sunil K. Sinha, „Trenchless Technology: An Efficient and Environmentally Sound Approach for Underground Municipal Pipeline Infrastructure Systems”, No Dig 2004, New Orleans, USA, pp. 1, 7.
Bush, G and Simonson, J, „Rehabilitation of underground water and sewer lines. The costs
beyond the bid”, University of Houston, Texas, USA, 2001
Mohammad Najafi, Sanjiv Gokhale, „Trenchless technology – Pipeline and utility design, construction and renewal”, McGraw-Hill Books, New York, USA, 2004, pp. 33
PG Boulter, T J Barlow, S Latham, I S McCrae, “Emission Factors 2009, Report 1- A review of
methods for determining hot exhaust emission factors for road vehicles”, TRL Limited, United Kingdom, 2009, pp. 40
Asian Development Bank, Independent Evaluation Department, “Reducing carbon Emissions
from Transport Projects”, July 2010, pp. 18
Matthew Barth and Kanok Boriboonsomsin, „Traffic congestion and greenhouse gas“, Access – Transportation research at the University of California, California, USA, 2009, pp. 5
Sangjun Park and Hesham Rakha, „Energy and environmental impact of roadway grades”,
Department of Civil and Environmental Engineering, Virginia Tech, Blacksburg, USA, 2005, pp. 14
IRU (International Road Transport Union),
[http://www.iru.org/index/en_policy_co2_response_flowingtraffic], accessed 08.04.2011
Isabel Tardiff, Center of Expertise and Research on Infrastructure in Urban Areas, „How to take advantage of green thinking to get more funding for infrastructure”, Paper Presented at the NASTT and ISTT No-Dig Show 2009, Montreal, Canada, 2009, pp. 6.