2016 subdivision staging policy schools - … subdivision staging policy –schools worksession #3...
TRANSCRIPT

2016 Subdivision Staging Policy – SchoolsWorksession #3 on the Public Hearing Draft
June 23, 2016

Implement a hybrid annual school test that combines cluster utilization tests with individual school capacity deficit tests.
2
Recommendation #2: Hybrid Annual School Test

CURRENT POLICY: The annual school test is a cluster level utilization test, meaning that capacity utilization is calculated and evaluated at each school level (elementary, middle and high) across the entire cluster.
The cluster utilization is tested against two thresholds:
• 105% for school facility payments
• 120% for a moratorium
The current annual school test is only equivalent to an individual school test at the high school level.
3
Recommendation #2: Hybrid Annual School Test

RATIONALE FOR CHANGE: The current cluster-wide test does not recognize significant overutilization at individual schools.
The assumption underlying the current policy is that if capacity is adequate across a cluster, but not for an individual school, MCPS can and will redraw service area boundaries to alleviate any inadequacies that might exist. For a variety of reasons such actions are not easy to implement, and therefore not frequently used to address capacity issues at individual schools:
• the cost of conducting boundary studies
• the distance between schools with excess capacity and schools in need of additional capacity
• sometimes the other schools don’t have “excess” capacity, but are very close to 100% utilization
• for some middle schools, split articulation further complicates matters
4
Recommendation #2: Hybrid Annual School Test

RECOMMENDATION DETAILS: The recommended change maintains the current cluster utilization test and thresholds and adds a component that evaluates the adequacy of individual schools against new seat deficit thresholds as outlined below.
This new test aligns the funding of solutions through the SSP with the MCPS thresholdsused to identify schools in need of a capacity solution 5
Recommendation #2: Hybrid Annual School Test
Individual School Capacity Deficit Test
ThresholdsActionElementary Middle
School Facility Payments
92-seat capacity deficit projected in the sixth year of the CIP
150-seat capacity deficit projected in the sixth year of the CIP
School Facility Payment applies to the applicable school service area, unless a capacity project is planned elsewhere, specifically identified in the CIP to relieve over-enrollment at the school failing this adequacy test.
Moratorium 120% utilization and 110-seat capacity deficit projected in the sixth year of the CIP
120% utilization and 180-seat capacity deficit projected in the sixth year of the CIP
Moratorium applies to the applicable school service area, unless a capacity project is planned elsewhere, specifically identified in the CIP to relieve over-enrollment at the school failing this adequacy test.

Action
Inadequate Outcomes by Level
Elementary Middle HighSchool FacilityPayments
Einstein Cluster (107.4%)Gaithersburg Cluster (112.4%)Northwood Cluster (116.0%)
Quince Orchard Cluster (113.2%)Meadow Hall ES (-128), Rockville Cluster
Lake Seneca ES (-97), Seneca Valley ClusterGarrett Park ES (-106), Walter Johnson Cluster
Gaithersburg Cluster (107.5%)Rockville Cluster (116.2%)Wheaton Cluster (110.7%)
Blair (116.3%)Churchill (113.5%)Einstein (116.9%)
Gaithersburg (107.6%)Walter Johnson (113.9%)
Kennedy (112.5%)Richard Montgomery (112.2%)
Northwood (114.8%)Paint Branch (111.0%)
Quince Orchard (110.4%)
Moratorium Rosemont ES (-144, 129.9%), Gaithersburg ClusterStrawberry Knoll ES (-191, 141.0%), Gaithersburg Cluster
Summit Hall ES (-182, 129.2%), Gaithersburg Cluster
6
Recommendation #2: Hybrid Annual School Test
The following placeholder capital projects were used to determine capacities for purposes of this preliminary test:
Cluster Level Placeholder CapacityNorthwest Cluster Elementary School 20 classroomsEinstein Cluster High School 6 classroomsWalter Johnson Cluster High School 8 classroomsNorthwood Cluster High School 10 classrooms

Recommendation #2: Hybrid Annual School Test
7
COMMUNITY FEEDBACK: This recommendation was very well-received by the community.
• MCCPTA representatives have been asking for an individual school test for quite some time.
• The hybrid approach also received the support of the director of the MCPS Division of Long Range Planning and the Board of Education Fiscal Management Committee.
• The City of Gaithersburg and the City of Rockville were both highly supportive.
8
Recommendation #2: Hybrid Annual School Test

STAFF RESPONSE: Is an individual elementary school with a seat deficit of 128 students and a utilization rate of 117% adequate? Should we continue to allow development in the service area of an elementary school 191 students over capacity with a utilization rate of 141%? Staff believes the answer to both questions is “no.”
MCPS always has options to help alleviate enrollment burdens, even at the cluster level. We don’t exempt a cluster from the cluster test just because a boundary change could move students to a neighboring cluster that has excess capacity.* The mere existence of potential solutions does not alone mitigate the inadequacy.
The purpose of the SSP to identify the inadequacy (and as a result raise money to help fund a solution to the inadequacy, and if necessary, halt development until the inadequacy is resolved). The SSP is not designed to instruct MCPS on how to alleviate an infrastructure inadequacy.
Staff feels that a Subdivision Staging Policy that recognizes infrastructure inadequacies at the individual school level helps highlight these areas, and may potentially help fund a solution to the overcrowding better than the current policy of only evaluating cluster adequacy.*This used to be the practice and was termed “borrowing” – the 2007 Growth Policy removed borrowing as part of the annual school test. 9
Recommendation #2: Hybrid Annual School Test

Placeholder capacity for a particular cluster level or school can only be counted as capacity in the annual school test for two years.
10
Recommendation #6: Placeholder Limits

CURRENT POLICY: There is currently no formal policy as it relates to placeholders.
Placeholder projects have been the County Council’s way of taking quick action to reserve funds for needed school capacity, while also ensuring a cluster’s service area does not fall into moratorium.
Placeholders allow development to move forward and for School Facility Payments to continue to be collected. Lacking a thorough capacity study, the placeholder project adds a minimum projection of the capital cost required to address facility needs, and serves as a reminder that capital programming should be forthcoming.
11
Recommendation #6: Placeholder Limits

RATIONALE FOR CHANGE: One criticism of using placeholders is that the cost associated with a placeholder project, which is assumed to add capacity to the sixth year of the approved CIP, does not equal the ultimate cost of the capacity project that is required.
Another concern is that the placeholder project undermines the intent of the Subdivision Staging Policy, which is to ensure that adequate public facilities exist or are funded prior to approving new development.
Because the placeholder prevents a moratorium from being imposed despite not having a fully-funded capital project, this recommendation ensures that placeholder projects are not used to weaken the purpose of the SSP and the County’s Adequate Public Facilities Ordinance.
12
Recommendation #6: Placeholder Limits

COMMUNITY FEEDBACK: The Board of Education’s Fiscal Management Committee expressed concern that the current practice of using placeholders “takes the ‘teeth’ out of the school test.” Committee members were therefore encouraged by this recommendation.
Others, including the MCCPTA reps, agreed that this was a step in the right direction, but thought it might be best to eliminate the use of placeholders altogether.
STAFF RESPONSE: Staff believes this recommended policy would help ensure the integrity and clarity of the SSP. In many ways, this will have no impact. No placeholder has been in place for longer than two years. Nevertheless, this recommendation would assuage fears among some community members that placeholders could undermine the intent of the SSP if never replaced by a real project.
13
Recommendation #6: Placeholder Limits

KEY
PL: Placeholder for capacity in August
of indicated year
CP: Capacity project scheduled to
open in August of indicated year
MOR: Cluster placed in moratorium
CP OPEN: Capacity project open
Red text: Change in timeframe from
previous year
14
Recommendation #6: Placeholder Limits
Cluster Level
School Year / Fiscal Year2010-11 2011-12 2012-13 2013-14 2014-15 2015-16 2016-17
FY11 FY12 FY13 FY14 FY15 FY16 FY17Richard Montgomery ES PL 2015 MOR CP 2017 CP 2017 CP 2018 CP 2018 CP 2018Northwood ES PL 2016 CP 2015 CP 2015 CP 2015 CP OPENNorthwest ES PL 2016 CP 2017 CP 2017 CP 2018 CP 2018 PL 2020Bethesda-Chevy Chase MS PL 2016 CP 2017 CP 2017 CP 2017 CP 2017 CP 2017Bethesda-Chevy Chase HS PL 2017 PL 2018 CP 2018 CP 2018 CP 2018Northwood MS PL 2020 CP 2020Northwood HS PL 2020 PL 2021Gaithersburg ES PL 2020 CP 2020Wheaton MS PL 2020Einstein HS PL 2020 PL 2021Walter Johnson HS PL 2020 PL 2021

Calculate School Facility Payments and the School Impact Tax using student generation rates associated with residential structures built over the prior 10 years.
15
Recommendation #1: Student Generation Rates

HISTORICALLY (prior to 2014):
• Used survey data to estimate student generation rates
• Only looked at households that had moved in the last five years
CURRENT POLICY (since 2014):
• Generation rates calculated using actual student enrollment data
• For single family homes (both detached and attached), generation rates are based on homes built in the last ten years
• For multi-family structures, generation rates are based on units built any year
RATIONALE FOR CHANGE: School Facility Payments and School Impact Tax are intended to mitigate the school construction costs associated with new development.
16
Recommendation #1: Student Generation Rates

17
Recommendation #1: Student Generation Rates
Scenario 1: Last 10 Years Scenario 2: Built Any Year Scenario 3: Continued HybridTheory The purpose of the SSP is to
ensure the adequacy of infrastructure for new development. The Annual School Test looks five years into the future. The SSP is not intended to evaluate the impact of new development in perpetuity.
The SSP needs to comprehensively address the impact of new development over the full life of that development. To do otherwise is short-sighted.“It is important to understand that MCPS will have to serve all of the students from new housing,” regardless of time frame.
We should acknowledge the different cycles of student generation between single family and multi-family homes. Single family units generate more students in the first years of their occupancy, whereas multi-family units generate more students as these units age. It is important to reflect the greatest impact each type of new housing will have on schools, whether it occurs in the first years of single family occupancies or in the longer time frame of multi-family occupancies.

18
Recommendation #1: Student Generation Rates
Scenario 1: Last 10 Years Scenario 2: Built Any Year Scenario 3: Continued HybridNew Generation Rates
Change from Current Rates
Single Family Detached: –5%Single Family Attached: –12%Multi-family Low to Mid Rise: –51%Multi-family High Rise: –43%
Single Family Detached: –34%Single Family Attached: +18%Multi-family Low to Mid Rise: +38%Multi-family High Rise: +18%
Single Family Detached: –5%Single Family Attached: –12%Multi-family Low to Mid Rise: +38%Multi-family High Rise: +18%
ES MS HS TotalSFD 0.358 0.152 0.157 0.667SFA 0.193 0.075 0.090 0.358MFLM 0.071 0.025 0.039 0.135MFH 0.038 0.014 0.015 0.067
ES MS HS TotalSFD 0.205 0.109 0.148 0.463SFA 0.234 0.107 0.143 0.484MFLM 0.203 0.079 0.103 0.385MFH 0.071 0.029 0.038 0.139
ES MS HS TotalSFD 0.358 0.152 0.157 0.667SFA 0.193 0.075 0.090 0.358MFLM 0.203 0.079 0.103 0.385MFH 0.071 0.029 0.038 0.139

COMMUNITY FEEDBACK:
• Concern over impact on School Impact Taxes:Large cuts in the revenue generated from developers would open a gap in school construction funding recently closed by increasing recordation and property taxes on residents
19
Recommendation #1: Student Generation Rates
Scenario 1: Last 10 Years Scenario 2: Built Any Year Scenario 3: Continued HybridNew School Impact Taxes 90% Cost Impact Tax % Change
SFD $24,022 –10%SFA $12,915 –36%MFLM $4,925 –61%MFH $2,416 –55%
90% Cost Impact Tax % ChangeSFD $17,010 –37%SFA $17,687 –12%MFLM $13,960 +9%MFH $5,041 –7%
90% Cost Impact Tax % ChangeSFD $24,022 –10%SFA $12,915 –36%MFLM $13,960 +9%MFH $5,041 –7%

COMMUNITY FEEDBACK:
• Concern over impact on School Impact Taxes:Large cuts in the revenue generated from developers would open a gap in school construction funding recently closed by increasing recordation and property taxes on residents
20
Recommendation #1: Student Generation Rates
$20,236,770
$35,963,357 $36,902,869
$0
$5,000,000
$10,000,000
$15,000,000
$20,000,000
$25,000,000
$30,000,000
$35,000,000
$40,000,000
Scenario 1: Last 10 Years Scenario 2: Built Any Year Scenario 3: Continued Hybrid
Comparison of Estimated Impact Tax Revenue Under Different Generation Rate ScenariosBased on Actual Units Built in 2015 (at 90% Cost)*
* These are based on the total units built (not permitted) in 2015 and does not account for excluded units built in current and former Enterprise Zones, or excluded de minimisdevelopment. We have assumed a 12.5% reduction for the MPDU exemption.

COMMUNITY FEEDBACK:
• Likewise, concern over impact on School Facility Payments:
21
Recommendation #1: Student Generation Rates
Scenario 1: Last 10 Years Scenario 2: Built Any Year Scenario 3: Continued HybridNew Generation Rates
60% Cost ES MS HSSFD $7,994 $3,601 $4,421SFA $4,311 $1,779 $2,520MFLM $1,573 $605 $1,105MFH $855 $334 $421
60% Cost ES MS HSSFD $4,576 $2,601 $4,163SFA $5,221 $2,549 $4,021MFLM $4,523 $1,875 $2,909MFH $1,592 $690 $1,079
60% Cost ES MS HS
SFD $7,994 $3,601 $4,421SFA $4,311 $1,779 $2,520MFLM $4,523 $1,875 $2,909MFH $1,592 $690 $1,079

STAFF RESPONSE:
Staff does not believe a hybrid approach should be continued. Ultimately, however, this will be a policy decision for the Board, on whether the impact of new development on schools should be evaluated over the short-term or full life of the dwelling unit.
22
Recommendation #1: Student Generation Rates

Remove the 0.9 multiplier in the School Impact Tax, to capture the full cost of school construction associated with a new residential unit.
23
Recommendation #8: Impact Tax Multiplier
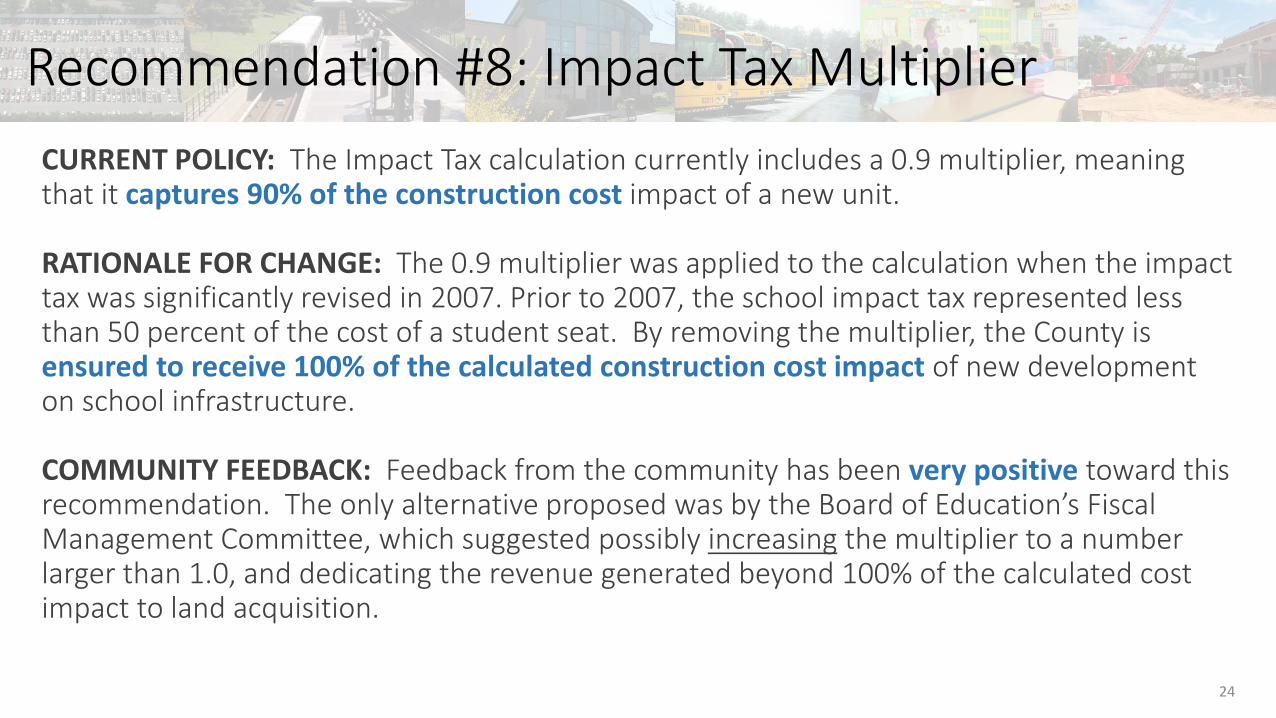
CURRENT POLICY: The Impact Tax calculation currently includes a 0.9 multiplier, meaning that it captures 90% of the construction cost impact of a new unit.
RATIONALE FOR CHANGE: The 0.9 multiplier was applied to the calculation when the impact tax was significantly revised in 2007. Prior to 2007, the school impact tax represented less than 50 percent of the cost of a student seat. By removing the multiplier, the County is ensured to receive 100% of the calculated construction cost impact of new development on school infrastructure.
COMMUNITY FEEDBACK: Feedback from the community has been very positive toward this recommendation. The only alternative proposed was by the Board of Education’s Fiscal Management Committee, which suggested possibly increasing the multiplier to a number larger than 1.0, and dedicating the revenue generated beyond 100% of the calculated cost impact to land acquisition.
24
Recommendation #8: Impact Tax Multiplier
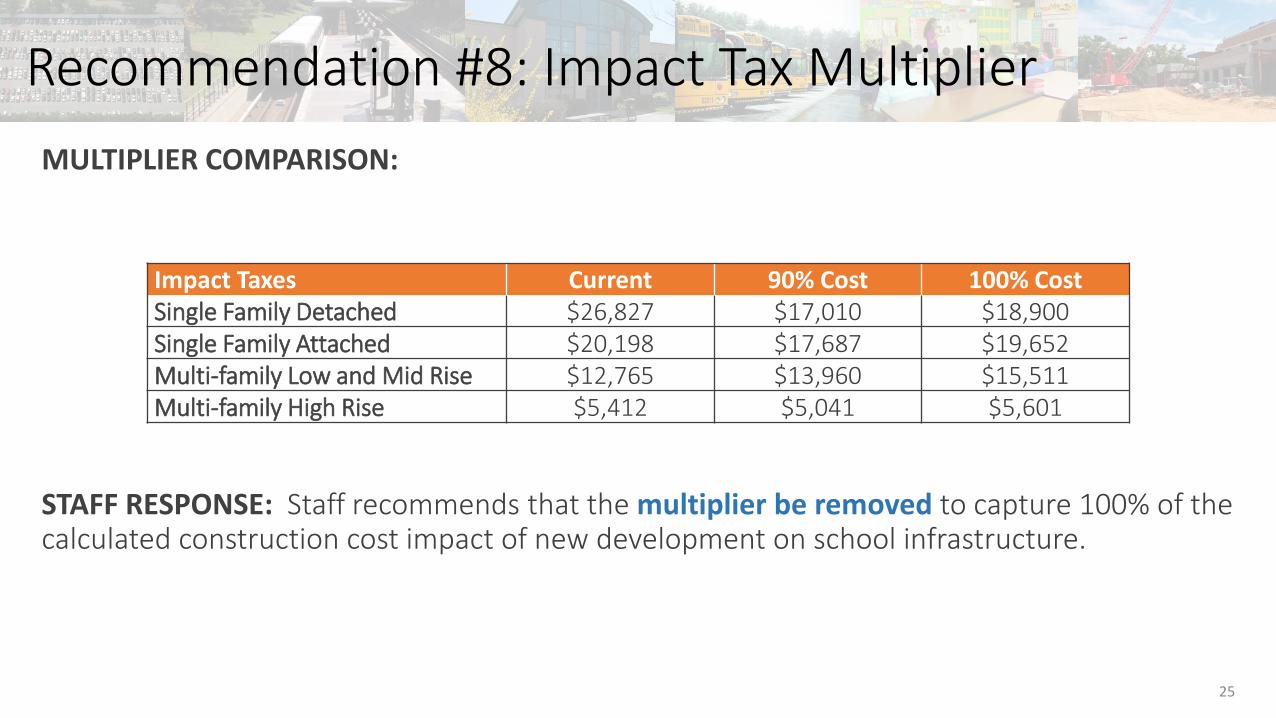
MULTIPLIER COMPARISON:
STAFF RESPONSE: Staff recommends that the multiplier be removed to capture 100% of the calculated construction cost impact of new development on school infrastructure.
Impact Taxes Current 90% Cost 100% CostSingle Family Detached $26,827 $17,010 $18,900Single Family Attached $20,198 $17,687 $19,652Multi-family Low and Mid Rise $12,765 $13,960 $15,511Multi-family High Rise $5,412 $5,041 $5,601
25
Recommendation #8: Impact Tax Multiplier

Require a portion of the School Facility Payment equivalent to 10 percent of the cost of a student seat be dedicated to land acquisition for new schools in the cluster for which the payment is collected.
26
Recommendation #5: Land Acquisition Fund

CURRENT POLICY: There is no policy currently that requires any portion of the collected School Facility Payments or School Impact Taxes be dedicated to land acquisition for new schools.
RATIONALE FOR CHANGE: The cost of acquiring land for new schools has become prohibitively expensive. Dedicating funds for land acquisition will help ensure that MCPS has more options available in their quest to provide adequate school infrastructure.
27
Recommendation #5: Land Acquisition Fund

COMMUNITY FEEDBACK: The MCCPTA reps supported the concept of dedicating funds for land acquisition, but felt that pulling the dedicated funds from School Facility Payments would not generate enough money to actually make land acquisition a viable option to MCPS.
They also did not want it taken out of the increased School Impact Tax payment. Since the school construction cost component of the School Impact Tax calculation does not factor in the cost of acquiring land, the MCCPTA reps felt that this dedicated funding should not be pulled from the School Impact Tax.
MCCPTA recommends having a separate land acquisition tax, equivalent to 10% of the school construction cost impact.
28
Recommendation #5: Land Acquisition Fund

COMMUNITY FEEDBACK: The Board of Education’s Fiscal Management Committee feels that identifying a funding source for school site acquisition is important, but that it should not cut into the funds collected through the School Impact Tax for school construction.
Instead, the Committee recommends the creation of a separate impact tax or increasing the School Impact Tax beyond 100% of the school construction cost impact of a new unit.
29
Recommendation #5: Land Acquisition Fund

STAFF RESPONSE: Staff feels strongly that the funds dedicated for land acquisition should not be pulled from the School Facility Payments. Unless there is interest in creating a separate impact tax for school land acquisition, staff believes there’s merit in dedicating the Impact Tax increase resulting from elimination of the multiplier to land acquisition.
The table below shows the amount of funding that would have been dedicated to land acquisition over the last five fiscal years, under each scenario:
30
Recommendation #5: Land Acquisition Fund
Fiscal YearDedicated Land Acquisition Funding Based on…
Facility Payment Collected Impact Tax Collected2011 $1,041 $1,608,983 2012 $27,320 $1,829,155 2013 $2,542 $3,100,195 2014 $334,729 $5,093,030 2015 $327,965 $3,630,753
TOTAL $693,597 $15,262,116

Modify the calculation of the School Facility Payments to apply a 0.5 multiplier instead of the current 0.6 multiplier.
31
Recommendation #4: Facility Payment Multiplier

CURRENT POLICY: The current multiplier is 0.6, meaning that when a School Facility Payment is made it captures 60% of the construction cost impact of a new unit at the level deemed inadequate.
The payment is made in addition to the School Impact Tax (which is paid on all school levels regardless of adequacy). The Impact Tax calculation currently includes a 0.9 multiplier, meaning that it captures 90% of the construction cost impact of a new unit. Therefore, developers could pay up to 150% of the school construction cost impact generated by a new unit, depending on how many school levels require facility payments.
32
Recommendation #4: Facility Payment Multiplier

RATIONALE FOR CHANGE: Recommendation #8 changes the calculation of the Impact Tax to remove the 0.9 multiplier, increasing it to capture 100% of the construction cost impact of a new dwelling unit. The rationale for this recommendation, which cuts the School Facility Payment multiplier from 0.6 to 0.5, was to maintain the maximum 150% payment level when a School Facility Payment applies.
33
Recommendation #4: Facility Payment Multiplier

COMMUNITY FEEDBACK: MCCPTA felt strongly that the multiplier should not be cut, but instead should be increased to 0.75.
• These payments help fund desperately needed capacity increases at schools and clusters with the most need.
• Unlike the School Impact Taxes, which are used to fund capital projects across the County, School Facility Payments directly target the impact of the new development for which they are collected by restricting their use to the impacted cluster and school level.
• To make the MCCPTA reps’ suggested change would mean to charge developers 175% of the construction cost impact generated by a new unit for any level for which a School Facility Payment applies.
The City of Gaithersburg submitted testimony in favor of this recommended change to decrease the multiplier from 0.6 to 0.5, but did not provide any rationale for its support.
34
Recommendation #4: Facility Payment Multiplier

35
Recommendation #4: Facility Payment Multiplier
75% Cost ES MS HSSFD $5,719 $3,252 $5,204SFA $6,526 $3,186 $5,027MFLM $5,653 $2,343 $3,636MFH $1,989 $862 $1,349
50% Cost ES MS HSSFD $3,813 $2,168 $3,469SFA $4,350 $2,124 $3,351MFLM $3,769 $1,562 $2,424MFH $1,326 $575 $899
60% Cost ES MS HSSFD $4,576 $2,601 $4,163SFA $5,221 $2,549 $4,021MFLM $4,523 $1,875 $2,909MFH $1,592 $690 $1,079
Current ES MS HSSFD $6,940 $3,251 $4,631SFA $4,160 $1,743 $2,754MFLM $2,838 $1,169 $1,877MFH $1,166 $531 $804

STAFF RESPONSE: In light of the community response and also in light of staff’s recommendation on Recommendation #5, which would dedicate all of the increase in the Impact Tax resulting from removal of the 0.9 multiplier to land acquisition for new schools, staff does not believe a cut in the School Facility Payment multiplier is necessary.
Staff recommends maintaining the current multiplier of 0.6, which would continue to dedicate 150% of a new unit’s school construction cost impact to funding new school infrastructure while also dedicating 10% of the cost impact to land acquisition. The total cost impact to new development would be 160% of a new unit’s school cost impact.
36
Recommendation #4: Facility Payment Multiplier

Update the calculation of the School Impact Taxes on a biennial basis (concurrent with the annual school test) using the latest student generation rates and school construction cost data.
37
Recommendation #7: Impact Tax Updates

CURRENT POLICY: Updates to the School Impact Taxes are not specifically addressed through the Subdivision Staging Policy. The School Impact Taxes actually fall under a different part of the County Code from the SSP. The construction cost component of the School Impact Tax is updated on a biennial basis using a construction cost index. The calculation has not been reset with current generation rates or construction costs since 2007.
RATIONALE FOR CHANGE: Actual per pupil construction costs have not kept pace with the construction cost index used to update the School Impact Tax. Therefore, it is important to reset the School Impact Tax to accurately and fairly include current MCPS school construction costs. Formalizing a timeframe for updating the School Impact Taxes ensures that the taxes are fair.
38
Recommendation #7: Impact Tax Updates

RECOMMENDATION DETAILS: The table below shows the data used to calculate the 2016 per student school construction costs:
39
Recommendation #7: Impact Tax Updates
Elementary School Middle School High School
Capacity/Core 740 1,200 2,400
Building Size (sf) 99,000 165,000 400,000
Project Cost $27,522,000 $47,520,000 $112,500,000
2016 Cost per Pupil $37,192 $39,600 $46,875
2007 Cost per Pupil $32,525 $42,352 $47,502
Change Since 2007 +$4,667 –$2,752 –$627
Note: Figures reflect average cost based on 2016 construction market conditions and will vary, pending proposed programs and existing conditions of each project. Figures include all
site work, furniture and equipment.
Source: MCPS Department of Facilities Management.
Elementary School Middle School High School
Capacity/Core 740 1,200 2,400
Building Size (sf) 99,000 165,000 400,000
Project Cost $27,522,000 $47,520,000 $112,500,000
2016 Cost per Pupil $37,192 $39,600 $46,875

COMMUNITY FEEDBACK: Feedback on this particular recommendation was consistently positive. The Board of Education’s Fiscal Management Committee suggested that we might want to consider updating the construction cost component on an annual basis. Others expressed concern that frequent updates to the taxes would result in a higher degree of uncertainty for developers and the housing market.
STAFF RESPONSE: Staff recommends modifying the text of this recommendation to say “concurrent with the annual school test or with the update to the SSP.” The SSP updates are not finalized until the County Council adopts the SSP in November. The Annual School Test, however, is completed in June of each year. Without this additional language, it’s possible the School Impact Tax might change twice in one year – once in June with the annual school test and again in November if the SSP update modifies the calculation in any way.
As impact taxes are currently modified based on a construction cost index on a biennial basis, updating the impact taxes to reflect more accurate construction costs and generation rates would not change the pace at which the rates are revised.
40
Recommendation #7: Impact Tax Updates

Update the calculation of the School Facility Payment on a biennial basis (concurrent with the annual school test) using the latest student generation rates and school construction cost data.
41
Recommendation #3: Facility Payment Updates

CURRENT POLICY: Updates to the School Facility Payment amounts have regularly occurred with each update to the Subdivision Staging Policy. The generation rates used to calculate the School Facility Payments were last updated in 2014, but the per pupil construction costs were last updated with the adoption of the 2012 SSP.
RATIONALE FOR CHANGE: Formalizing a timeframe for updating the School Facility Payments by requiring that the generation rates and construction costs are both updated every two years ensures that the School Facility Payments are as current and accurate as possible.
42
Recommendation #3: Facility Payment Updates

COMMUNITY FEEDBACK: Feedback on this particular recommendation was consistently positive. The Board of Education’s Fiscal Management Committee suggested that we might want to consider updating the construction cost component on an annual basis. Others expressed concern that frequent updates to the payments would result in a higher degree of uncertainty for developers and the housing market.
STAFF RESPONSE: Staff recommends modifying the text of this recommendation to say “concurrent with the annual school test or with the update to the SSP.” The SSP updates are not finalized until the County Council adopts the SSP in November. The Annual School Test, however, is completed in June of each year. Without this additional language, it’s possible the School Facility Payments might change twice in one year – once in June with annual school test and again in November if the SSP update modifies the calculation in any way.
43
Recommendation #3: Facility Payment Updates

Remove the School Impact Tax and School Facility Payments exemptions in former Enterprise Zones through a phased approach.
44
Recommendation #9: Former Enterprise Zones

CURRENT POLICY: New development in current and former Enterprise Zones is exempt from School Impact Taxes and School Facility Payments, if otherwise applicable.
RATIONALE FOR CHANGE: Maryland’s Enterprise Zone program offers businesses income and property tax credits for creating jobs within these areas. Currently, the Silver Spring CBD is the County’s only former Enterprise Zone. The designation had just expired when significant changes to the SSP and Impact Tax laws were adopted in 2007. The sentiment at the time was to provide Silver Spring a little longer to solidify its redevelopment. It has now been 10 years since the designation expired and exemption with respect to this status no longer seems applicable.
Since the Silver Spring CBD lost its designation 10 years ago, 3,784 multi-family high rise units have been built within the former Enterprise Zone. Our student generation rates suggest those units include 255 MCPS students. The exemption has resulted in a savings for developers of over $20 million.
45
Recommendation #9: Former Enterprise Zones

RECOMMENDATION DETAILS:
• For the first three years following the expiration of the Enterprise Zone designation, the standard School Impact Tax and School Facility Payments (if applicable) would be discounted by 50 percent.
• After three years, the School Impact Taxes and School Facility Payments will increase to the full level.
• All former Enterprise Zones at the time of adoption would enter into the three-year discount phase, regardless of the length of time since the Enterprise Zone designation expired.
46
Recommendation #9: Former Enterprise Zones

COMMUNITY FEEDBACK: Several people and organizations, including the MCCPTA and the League of Women Voters, testified in favor of this change. Others requested that consideration be given to continued exclusion for development projects currently in progress.
STAFF RESPONSE: Staff believes a case could be made for removing the exemption from current Enterprise Zones as well, but is reluctant to make such a recommendation until new criteria that directly relate to residential development and schools can be developed for identifying areas of the County eligible for impact tax and facility payment exemption.
Staff further agrees with those who requested a “grandfathering” of the exemption for those projects currently in progress. It seems appropriate that any project that has an accepted application within the Silver Spring CBD by the effective date of this SSP (or in another Enterprise Zone prior to the expiration of its designation) be allowed to proceed without payment of School Impact Taxes or School Facility Payments.
47
Recommendation #9: Former Enterprise Zones
Conduct further research to develop the criteria and process by which an area of the County can be exempted from the School Impact Tax and School Facility Payments.
48
Recommendation #10: Future Exemptions

RATIONALE: There is a tenuous relationship between the purpose of Enterprise Zones, which is to stimulate job creation and economic growth, and the exemption of impact taxes and facility payments for new dwelling units within the Enterprise Zones. There could be criteria that more directly relates to residential development (and schools) – by which we designate areas of the county for impact tax and facility payment exemptions.
COMMUNITY FEEDBACK: There was little feedback on this particular recommendation. The feedback that was received was generally positive.
49
Recommendation #10: Future Exemptions

Other School Tests in Maryland
50
1 The City of Rockville test is the same as the Montgomery County test. 2 The City of Gaithersburg requires any school payment to be used to relieve over-utilization at the school where it was collected. If no capacity can be added there, the funds can be used to support additional
capacity at the school that will relieve the over-utilized school.
Locality Test Area Test Time Frame
Test Outcomes
Payment Moratorium Other
Montgomery Co. Cluster 5 years Utilization* > 105% Utilization* > 120% Placeholder projects for utilizations 106-119%
City of Rockville1 Cluster 5 years None Utilization* > 120%
City of Gaithersburg2 School 6 years Utilization* > 105% Utilization* > 150%
Prince George’s Co. Cluster Residential completion date or end of each stage
Utilization* > 105% Utilization* > 120%
Anne Arundel Co. School 3 years If “Closed” Wait list for closed areas with 6 year max wait
Frederick Co. School 2 years Utilization** > 100% Utilization** > 120% Request to redistrict***
Carroll Co. School 6 years Utilization** > 120% Permit restrictions for utilizations 110-119%
Harford Co. School 3 years Utilization** > 110%
Howard Co. School Region and School
Scheduled project or phase completion year
If “Closed” Utilization** > 115% Limit of 300 housing unit allocations per ES service area if ES Region > 100%
St. Mary’s Co. County 3 years Utilization** > 107% for ES; > 109% for MS; >116% for HS
Source: Montgomery County Public Schools Division of Long Range Planning (DRAFT).* Capacity as determined by the BOE is used in utilization calculations.** State-rated capacity is used in utilization calculations.*** A request to redistrict may be made by an applicant if an adjoining district is below 20% capacity and the BOE determines redistricting to be a viable option.

FY15 Impact Taxes in Maryland Jurisdictions
Jurisdiction Rate Basis Highest Fee Lowest Fee
Anne Arundel County Unit Sq. Ft. $10,502 $2,273
Calvert County Unit Type $7,800 $2,600
Caroline County Flat Rate $5,000 $5,000
Carroll County Unit Type $533 $438
Charles County Unit Type $13,366 $9,646
Frederick County Unit Type $13,478 $5,595
Harford County Unit Type $6,000 $1,200
Howard County Unit Sq. Ft. $1.25/Sq. Ft. $1.25/Sq. Ft.
Montgomery County Unit Type $26,827 $5,412
Prince George’s County Location1 $15,489 $9,035
Queen Anne's County Unit Sq. Ft. $3.96/Sq. Ft. $3.96/Sq. Ft.
St. Mary's County Unit $3,375 $3,375Source: Maryland Dept. of Legislative Services
1The higher impact charge applies to development located outside the Beltway while the lower charge applies to development located inside the Beltway and/or near mass transit (abutting an existing or planned mass transit rail station site operated by WMATA).
51