2017 annual report - lincoln electric
TRANSCRIPT

2017 Annual Report

63Facilities
42 Technical Application
Facilities
2 0 1 7 Y E A R A T A G L A N C E
At Lincoln Electric, we are Greater As One: One company, one team, with one shared strategy.:
In 2017, investments in innovation and the Air Liquide Welding acquisition continued to differentiate Lincoln Electric with greater reach, broader capabilities, and unique solutions for customers. Collaboration and best practices advanced financial performance and operational excellence towards our 2020 Vision and Strategy goals.
Working together, we are Greater As One.
160+Country Distribution
23Countries
11,000Employees

F I N A N C I A L H I G H L I G H T S
YEARS ENDED DECEMBER 31, (dollars in millions, except per share) 2017 2016 2015
Net Sales $2,624 $2,275 $2,536
Net Income 248 198 127
Net Income excluding special items(1) 253 224 260
Diluted Earnings per Share 3.71 2.91 1.70
Diluted Earnings per Share excluding special items(1) 3.79 3.29 3.48
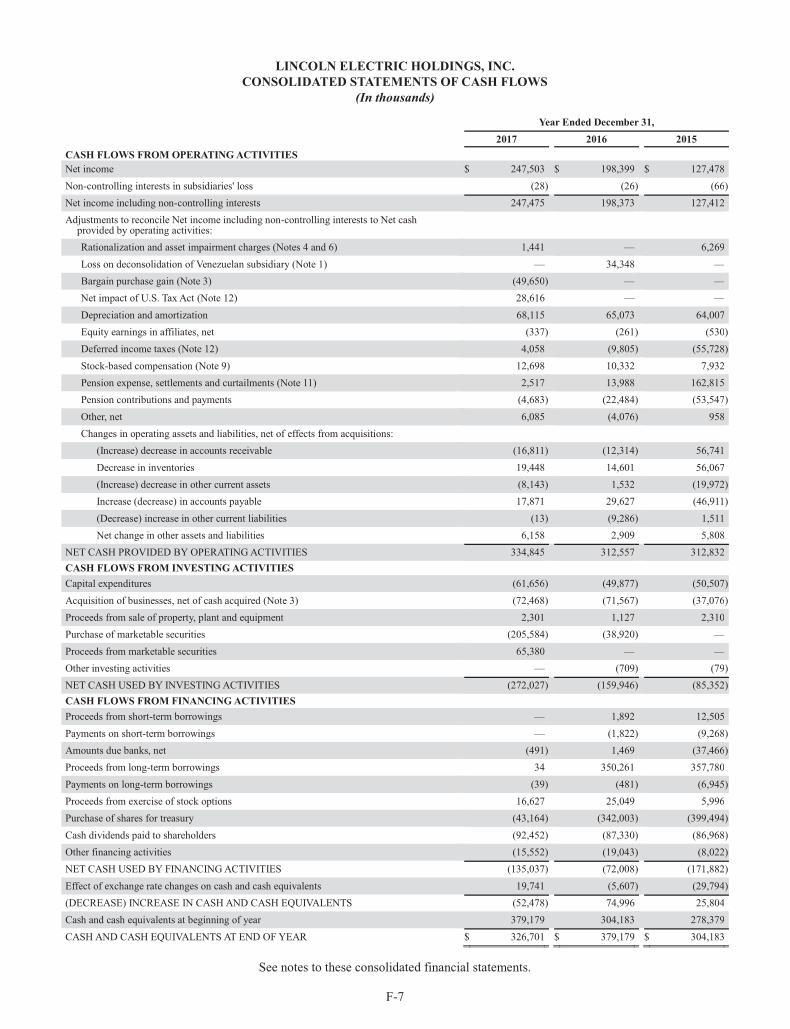
Cash Provided by Operations 335 313 313
Cash Dividends per Share of Common Stock(2) 1.40 1.28 1.16
Average Operating Working Capital Ratio(3) 15.9 % 15.6 % 17.1%
Return on Invested Capital(1) 16.2 % 16.6 % 21.1%
Current Ratio 2.6 2.7 2.5
Total Assets $2,407 $1,943 $1,784
Total Equity 932 712 932
(1) Net Income excluding special items, Diluted Earnings per Share excluding special items, Return on Invested Capital and Operating Income Margin excluding special items are non-GAAP financial measures that management believes are important to investors to evaluate and compare the Company’s financial performance from period to period. Management uses this information in assessing and evaluating the Company’s underlying operating performance. Non-GAAP financial measures should be read in conjunction with the GAAP financial measures, as non-GAAP measures are a supplement to, and not a replacement for, GAAP financial measures. Please refer to the reconciliation tables of non-GAAP results to our most closely comparable GAAP results on the “Non-GAAP Financial Measures” page.
(2) Reflects Board-approved annual dividend amounts.
(3) Average Operating Working Capital Ratio is defined as net operating working capital as of period end divided by annualized rolling three months of sales. Net operating working capital is defined as Accounts receivable plus Inventory, less Trade accounts payable. Average Operating Working Capital Ratio, excluding the Air Liquide Welding acquisition, was 14.2% in 2017.
NET SALES AND OPERATINGAA INCOME MARGIN ( 1 )
($ in millions)DILUTED EARNINGS ( 1 )
($ per share)
CASH PROVIDED BY OPERATIONS AND CASH CONVERSION ( 1 )
($ in millions)
1Excluding special items
1Cash flow conversion is defined as Net cash provided by operating activities less Capital expenditures divided by Adjusted net income
2Excluding special items and acquisitions
2015
2016
2017
$2,53614.7%
$2,27514.2%
$2,62413.8%|14.7%(2)
1Excluding special items
2015
2016
2017
$3.48
$3.29
$3.79
CASH RETURNED TO SHAREHOLDERS($ in millions) dividends and share repurchases
2015
2016
2017
$468
$429
$136
2015
2016
2017
101%$313
117%$313
108%$335
L I N C O L N E L E C T R I C / / 2 0 1 7 A N N U A L R E P O R T 1

L I N C O L N E L E C T R I C / / 2 0 1 7 A N N U A L R E P O R T2
S H A R E H O L D E R L E T T E R
2017 PROGRESS
An industrial sector recovery in late 2017 revitalized broad growth in the
welding and cutting industry after a multi-year down-cycle. Our 2017 sales
increased approximately 15% to $2.6 billion, driven by 7% organic and 8%
acquisition growth. All reportable segments, product areas, and key geogra-
phies achieved organic growth in the year, often exceeding market rates as
we continued to expand in key applications and broadened our presence in new
accounts. These wins position us well to deliver accelerated growth in 2018.
We continued to pursue profitability growth despite persistent raw material
inflation. Effective pricing management combined with our strategy of richen-
ing our product mix and driving operational excellence through productivity
improvements yielded solid results. Our adjusted operating income, excluding
acquisitions, increased 12% and our margin expanded 50 basis points to 14.7%.
We achieved this growth while continuing to invest in commercial initiatives,
people development, increasing employee incentive compensation and wages,
and charitable donations.
Our diluted earnings per share (EPS) increased to $3.71. Excluding special items,
our adjusted EPS increased 15% to $3.79 as compared with the prior year. Cash
flow from operations increased 7% to $335 million and we generated a 108%
free cash flow conversion rate from improved earnings and best-in-class
working capital management. Excluding the ALW acquisition, our business
achieved a record 14.2% average operating working capital to sales ratio—
which exceeds our 2020 Vision and Strategy goal of 15.0%. Additionally, we
generated top-quartile return on invested capital results as compared with
peers, at 16.2%.
Creating long-term value from a balanced capital allocation strategy remains
a priority. In 2017, 50% of cash was invested in growth (capital expenditures
and acquisitions) and 50% was returned to shareholders through our dividend
program and share repurchases. Looking ahead to 2018, our Board of Directors
increased the dividend payout rate by 11.4%, marking 22 years of consecutive
dividend increases.
Our 2020 Vision and Strategy and the related structural changes we have
made to the business continue to drive improved results with a strong balance
sheet, which positions us well for long-term growth and superior value creation.
PRIORITIZING INVESTMENTS FOR IMPACT
An Industry-Leading R&D ProgramTechnology and research and development remained a priority in 2017 with
R&D investments up 7% compared with the prior year. We also continued to
be a leading patent filer in the industry. The commercial effectiveness of our
R&D investment is reflected in our 34% vitality index (% of Lincoln Electric sales from products launched within the last 5 years). Today, we are leveraging
our unique footprint of 42 global technical application facilities to showcase
our newest solutions and collaborate with customers to identify products and
processes that will have a measurable impact on their operations.
Shaping Our European Platform We successfully closed the Air Liquide Welding acquisition on July 31st, which
doubles the size of our European business and presents exciting long-term
opportunities for the organization. By bringing together two of the region’s
leading welding and cutting teams, we are confident that we can improve
customers’ experience and operational effectiveness. Today, we are actively
shaping the regional businesses into one cohesive organization that leverages
a “best-in-class” manufacturing platform, product portfolio, and organization.
Our aggressive integration program is on track and we are confident in our
ability to generate $30 million of incremental pre-tax operating benefits by the
fourth year of ownership. This would establish the European business at a 10+%
operating income margin, which aligns with our 2020 strategy goals. These
achievements could not be accomplished without the scale, channel reach, and
capabilities of the Air Liquide Welding business—making us Greater As One.
Advanced ManufacturingAs customers look to change how they operate and invest in advanced manu-
facturing platforms to increase capacity, as well as achieve greater productivity
and consistent quality, the demand for automation, human-machine interfaces
(HMI) and the use of intelligent data is accelerating. We are capitalizing on
these shifting needs towards a “smart factory” with our leadership position in
welding and cutting automation and industrial laser applications. Our team is
also at the forefront of breaking barriers with our development of metal additive
robotic solutions, which we believe will ultimately drive unparalleled productivity
efficiencies for key applications. Today, our portfolio of automation solutions
has grown to $360 million in sales worldwide and our order trends continue to
improve across diverse industry sectors. We are also helping customers with
semi-automated solutions that leverage HMI. Our Weld Sequencer™ technology
is an HMI-driven solution that delivers process control for welders to ensure
Dear Fellow Shareholders,
We capped off 2017 with strong momentum, solid operational and financial performance, and the successful close of our largest acquisition. These accomplishments demonstrate the strength and value of our industry-leading team, enhanced collaboration, and best practices that are deployed across our company. I am thankful for the tremendous focus and hard work of our 11,000 employees and for the ongoing support of our shareholders, customers, and employees. Working together as one company, one team, with one strategy—we are Greater As One.
L I N C O L N E L E C T R I C / / 2 0 1 7 A N N U A L R E P O R T 3
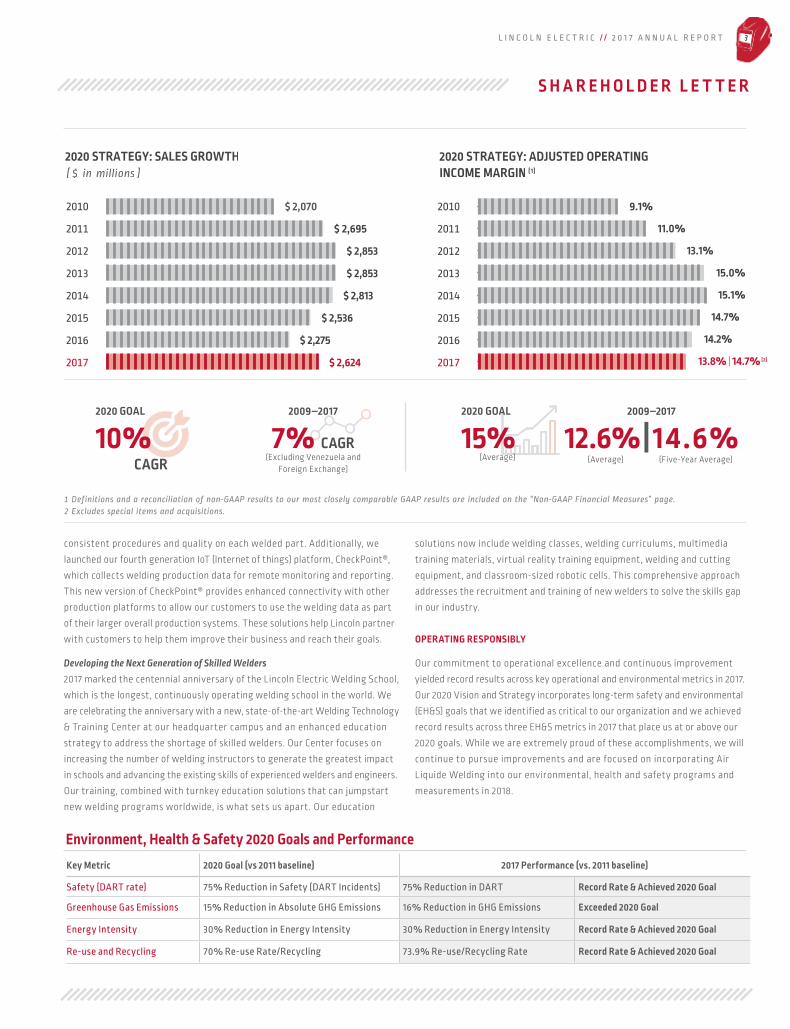
1 Definitions and a reconciliation of non-GAAP results to our most closely comparable GAAP results are included on the “Non-GAAP Financial Measures” page.2 Excludes special items and acquisitions.
2020 GOAL
10%CAGR
2020 GOAL
15%(Average)
2009–2017
7% CAGR(Excluding Venezuela and
Foreign Exchange)
2009–2017
12.6%|14.6%
S H A R E H O L D E R L E T T E R
consistent procedures and quality on each welded part. Additionally, we
launched our fourth generation IoT (Internet of things) platform, CheckPoint®,
which collects welding production data for remote monitoring and reporting.
This new version of CheckPoint® provides enhanced connectivity with other
production platforms to allow our customers to use the welding data as part
of their larger overall production systems. These solutions help Lincoln partner
with customers to help them improve their business and reach their goals.
Developing the Next Generation of Skilled Welders 2017 marked the centennial anniversary of the Lincoln Electric Welding School,
which is the longest, continuously operating welding school in the world. We
are celebrating the anniversary with a new, state-of-the-art Welding Technology
& Training Center at our headquarter campus and an enhanced education
strategy to address the shortage of skilled welders. Our Center focuses on
increasing the number of welding instructors to generate the greatest impact
in schools and advancing the existing skills of experienced welders and engineers.
Our training, combined with turnkey education solutions that can jumpstart
new welding programs worldwide, is what sets us apart. Our education
solutions now include welding classes, welding curriculums, multimedia
training materials, virtual reality training equipment, welding and cutting
equipment, and classroom-sized robotic cells. This comprehensive approach
addresses the recruitment and training of new welders to solve the skills gap
in our industry.
OPERATING RESPONSIBLY
Our commitment to operational excellence and continuous improvement
yielded record results across key operational and environmental metrics in 2017.
Our 2020 Vision and Strategy incorporates long-term safety and environmental
(EH&S) goals that we identified as critical to our organization and we achieved
record results across three EH&S metrics in 2017 that place us at or above our
2020 goals. While we are extremely proud of these accomplishments, we will
continue to pursue improvements and are focused on incorporating Air
Liquide Welding into our environmental, health and safety programs and
measurements in 2018.
(Average) (Five-Year Average)
Key Metric 2020 Goal (vs 2011 baseline) 2017 Performance (vs. 2011 baseline)
Safety (DART rate) 75% Reduction in Safety (DART Incidents) 75% Reduction in DART Record Rate & Achieved 2020 Goal
Greenhouse Gas Emissions 15% Reduction in Absolute GHG Emissions 16% Reduction in GHG Emissions Exceeded 2020 Goal
Energy Intensity 30% Reduction in Energy Intensity 30% Reduction in Energy Intensity Record Rate & Achieved 2020 Goal
Re-use and Recycling 70% Re-use Rate/Recycling 73.9% Re-use/Recycling Rate Record Rate & Achieved 2020 Goal
2020 STRATEGY: SALES GROWTH($ in millions)
2010
2011
2013
2012
2015
2014
2016
2017
$ 2,070
$ 2,853
$ 2,853
$ 2,695
$ 2,813
$ 2,536
$ 2,275
$ 2,624
2010
2011
2013
2012
2015
2014
2016
2017
9.1%
15.0%
13.1%
11.0%
15.1%
14.7%
14.2%
2020 STRATEGY: ADJUSTED OPERATING INCOME MARGIN ( 1 )
13.8%|14.7% ( 2 )
Environment, Health & Safety 2020 Goals and Performance

L I N C O L N E L E C T R I C / / 2 0 1 7 A N N U A L R E P O R T4
POSITIVE IMPACT—FOR OUR TEAM, FOR OUR COMMUNITIES
Investing in our team’s development was a priority in 2017. We launched our
second global leadership program to support high performer leadership
development and continued to roll-out functional education programs, such
as our Supply Chain Academy to promote standardized best practices world-
wide. This year, we will also be launching global manager training programs,
which are expected to reach over 100 managers in the initial year.
As a culture based on the “Golden Rule,” integrity and honesty have been a
cornerstone of our values and are practiced daily across our global footprint.
In 2017, we were pleased to be recognized for our ethics and code of conduct
by being named one of the 2018 world’s most ethical companies by the
Ethisphere® Institute.
We also strive to enrich the communities in which we live and work. In 2017,
we continued our partnerships with WorldSkills™ and SkillsUSA® as the
welding sponsor of their flagship competitions to promote skilled trades and
celebrated our 70th anniversary partnering with Future Farmers of America
(FFA). The Lincoln Electric Foundation celebrated our 65th anniversary by
expanding its grant and scholarship program with the launch of an employee
matching gifts program, which will help our employees make a bigger impact in
their communities. The Foundation and employee gifts also supported hurri-
cane and earthquake disaster relief efforts across several regions. In addition
to in-kind gifts, our global team continued to volunteer with local organizations,
sponsor key fundraising events, and engage on nonprofit boards. In 2017, we
donated over $2.9 million to nonprofit organizations with whom we partner to
make a difference.
DELIVERING GROWTH IN 2018
I am extremely pleased with our progress and achievements: what we have
accomplished as an organization and the positive impact our efforts have had
on our customers and the communities we touch. Our successful execution of our
2020 Vision and Strategy, our commitment to excellence, and our values con-
tinue to drive progress and create value. As growth momentum accelerates
in 2018, we are prepared to capitalize on the opportunities ahead and make a
positive impact.
On behalf of the Board of Directors and the employees at Lincoln Electric, thank
you for your continued support as our shareholder. As The Welding Experts® we
remain passionate about our business, our employees and our customers.
By working together, we are Greater As One.
Christopher L. Mapes
Chairman, President and Chief Executive Officer
S H A R E H O L D E R L E T T E R
2020 GOAL
15%2020 GOAL
15%(Average)
2017
15.9%|14.2%(2)
2009 - 2017
16.6%(Average)
1Definitions and a reconciliation of non-GAAP results to our most closely comparable GAAP results are included on the “Non-GAAP Financial Measures” page.2Excludes the Air Liquide Welding acquisition.
2020 STRATEGY: AVERAGE OPERATING WORKINGCAPITAL RATIO
2010
2011
2013
2012
2015
2014
2016
2017
20.7%
17.6%
18.8%
21.0%
17.1%
17.1%
15.6%
15.9%|14.2% ( 2 )
2010
2011
2013
2012
2015
2014
2016
2017
10.6%
20.2%
19.3%
16.6%
22.9%
21.1%
16.6%
16.2%
2020 STRATEGY: RETURN ON INVESTED CAPITAL ( 1 )
All trademarks and registered trademarks are the property of their respective owners.

NON-GAAP FINANCIAL MEASURES //
NON-GAAP FINANCIAL MEASURESAdjusted Operating Income, Adjusted Operating Income Margin, Adjusted Net Income, Diluted Earnings per Share excluding special items (Adjusted Diluted Earnings per Share), and Return on Invested Capital are non-GAAP financial measures thatmanagement believes are important to investors to evaluate and compare the Company’s financial performance from periodto period. Management uses this information in assessing and evaluating the Company’s underlying operating performance.
ADJUSTED OPERATING INCOMEThe following table presents a reconciliation of Operating income as reported to Adjusted operating income for the yearsended December 31, 2009 to 2017:
YEAR ENDED DECEMBER 31,($ in millions) 2017 2016 2015 2014 2013 2012 2011 2010 2009
Operating income (as reported) $ 377.7 $ 288.3 $ 181.7 $ 373.7 $ 407.0 $ 362.1 $ 296.7 $ 186.4 $ 93.2Special items (pre-tax):
Rationalization and assetimpairment charges 6.6 20.0 30.1 8.5 9.4 0.3 (0.4) 29.9
Venezuela deconsolidation and remeasurement losses — 34.3 27.2 21.1 12.2 3.1
Pension settlement charges 8.2 142.7 (2.1)Bargain purchase gain (49.7)Acquisition transaction and
integration costs 15.0Amortization of step up in
value of acquired inventories 4.6Other — 0.7 1.4
Adjusted operating income $ 362.4 $ 322.6 $ 371.6 $ 424.9 $ 428.4 $ 372.8 $ 297.0 $ 189.2 $ 121.0Adjusted operating income margin 13.8% 14.2% 14.7% 15.1% 15.0% 13.1% 11.0% 9.1% 7.0%
ADJUSTED NET INCOME AND ADJUSTED DILUTED EARNINGS PER SHAREThe following table presents reconciliations of Net income and Diluted earnings per share as reported to Adjusted net income and Adjusted diluted earnings per share for the years ended December 31, 2009 to 2017:
YEAR ENDED DECEMBER 31,($ in millions except per share amounts) 2017 2016 2015 2014 2013 2012 2011 2010 2009
Net income (as reported) $ 247.5 $ 198.4 $ 127.5 $ 254.7 $ 293.8 $ 257.4 $ 217.2 $ 130.2 $ 48.6Special items (after-tax):
Rationalization and assetimpairment charges 6.2 18.2 30.9 7.6 7.4 0.2 (0.9) 23.8
Venezuela deconsolidation and remeasurement losses — 33.3 27.2 21.1 12.2 3.6
Pension settlement charges 5.0 87.3 (2.1)Bargain purchase gain (49.7)Acquisition transaction
and integration costs 11.6Amortization of step up in
value of acquired inventories 3.5Net impact of U.S. Tax Act 28.6Income tax impact from change
in tax regulations, audit settlements and other items — (7.2) (4.8) (5.1)
Other — (0.8) (0.4) 0.9 1.8 2.9Adjusted net income $ 252.7 $ 224.5 $ 260.2 $ 305.9 $ 313.2 $ 265.8 $ 212.6 $ 129.6 $ 73.1Diluted earnings per share
(as reported) $ 3.71 $ 2.91 $ 1.70 $ 3.18 $ 3.54 $ 3.06 $ 2.56 $ 1.53 $ 0.57Special items per share 0.08 0.38 1.78 0.64 0.23 0.10 (0.05) (0.01) 0.29
Adjusted diluted earnings per share $ 3.79 $ 3.29 $ 3.48 $ 3.82 $ 3.77 $ 3.16 $ 2.51 $ 1.52 $ 0.86
RETURN ON INVESTED CAPITAL (ROIC)The following table presents calculations of ROIC for the years ended December 31, 2009 to 2017:
YEAR ENDED DECEMBER 31,($ in millions) 2017 2016 2015 2014 2013 2012 2011 2010 2009
Adjusted net income $ 252.7 $ 224.5 $ 260.2 $ 305.9 $ 313.2 $ 265.8 $ 212.6 $ 129.6 $ 73.1Plus: Interest expense
(after-tax) 14.9 11.8 13.5 6.4 1.8 2.6 4.2 4.2 5.3Less: Interest income
(after-tax) 3.0 1.3 1.7 1.9 2.0 2.5 1.9 1.5 2.2Net operating profit
after taxes 264.7 234.9 272.0 310.5 312.9 265.9 214.8 132.3 76.2Invested capital 1,638.7 1,417.8 1,287.1 1,356.4 1,549.8 1,378.6 1,296.6 1,247.2 1,209.4Return on invested capital 16.2% 16.6% 21.1% 22.9% 20.2% 19.3% 16.6% 10.6% 6.3%
Invested capital is defined as total debt plus total equity.

[THIS PAGE INTENTIONALLY LEFT BLANK]


[THIS PAGE INTENTIONALLY LEFT BLANK]

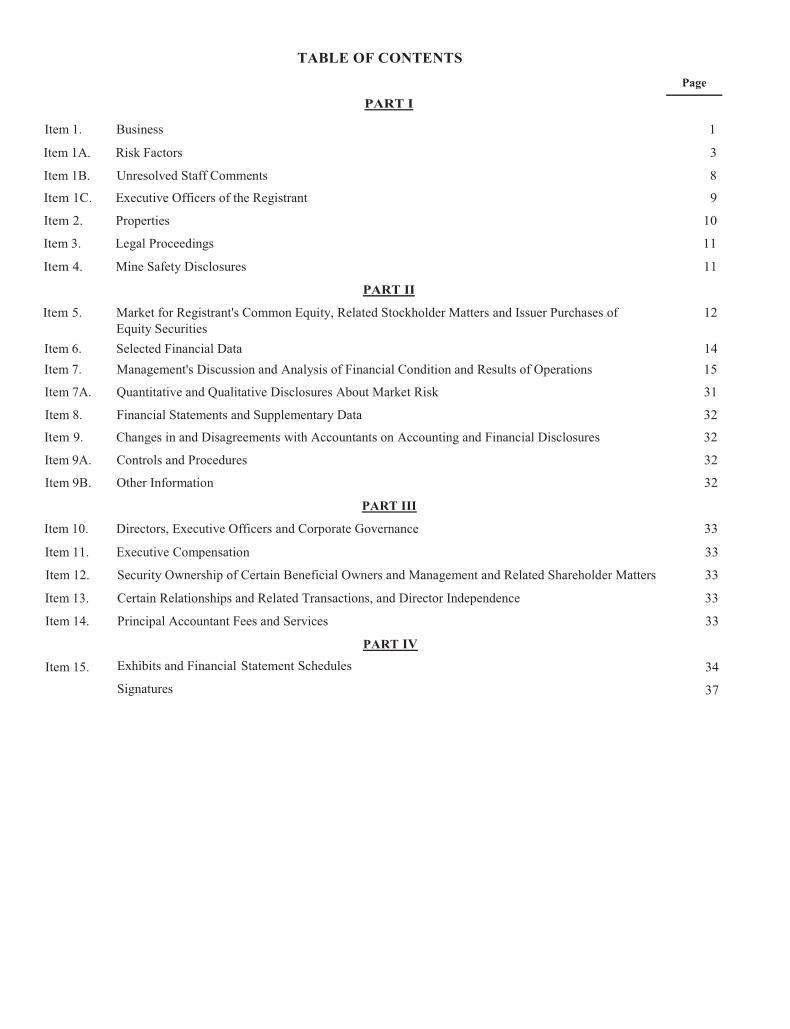
TABLE OF CONTENTS Page
PART I
PART II
PART III
PART IV


[THIS PAGE INTENTIONALLY LEFT BLANK]

[THIS PAGE INTENTIONALLY LEFT BLANK]

BOARD OF DIRECTORS
Curtis E. EspelandExecutive Vice President andChief Financial Officer,Eastman Chemical Company
Stephen G. HanksFormer President and Chief Executive Officer,Washington Group International, Inc.
Michael F. HiltonPresident and Chief Executive Officer,Nordson Corporation
G. Russell LincolnPresident, N.A.S.T. Inc.
Kathryn Jo LincolnChair and Chief Investment Officer,Lincoln Institute of Land Policy
William E. MacDonald IIIFormer Vice Chairman,National City Corporation
Christopher L. MapesChairman, President and Chief Executive Officer,Lincoln Electric
Phillip J. MasonFormer President, Ecolab EMEA sector
Ben P. PatelVice President and Chief Technology Officer, Tenneco Inc.
Hellene S. RuntaghFormer President and Chief Executive Officer, Berwind Group
RETIRING DIRECTORS
David H. GunningLead DirectorFormer Vice Chairman, Cliffs Natural Resources, Inc.
George H. Walls, Jr.Former Chief Deputy Auditor,State of North Carolina
COMPANY OFFICERS AND EXECUTIVE MANAGEMENT
Geoffrey P. Allman*Senior Vice PresidentCorporate Controller
Jennifer I. Ansberry*Executive Vice PresidentGeneral Counsel and Secretary
Anthony K. BattleSenior Vice President, Internal Audit and Chief Compliance Officer
George D. Blankenship*Executive Vice PresidentPresident, Americas Welding
Gabriel Bruno*Executive Vice PresidentChief Human Resources Officer
Thomas A. Flohn*Senior Vice PresidentPresident, Asia Pacific Region
Steven B. Hedlund*Executive Vice PresidentPresident, International Welding
Michele R. Kuhrt*Executive Vice PresidentChief Information Officer
Douglas S. LanceSenior Vice PresidentPresident, Cleveland Operations
Christopher L. Mapes*Chairman, President and Chief Executive Officer
William T. MatthewsSenior Vice President, Technology and Research and Development
Michael S. MintunSenior Vice PresidentNorth America Sales & Marketing
David J. Nangle*Senior Vice PresidentPresident, Harris Products Group
Vincent K. Petrella*Executive Vice PresidentChief Financial Officer and Treasurer
Michael J. WhiteheadSenior Vice President Strategy and Business Development
*Member of the Management Committee
CORPORATE INFORMATION
For additional corporate information and copies of Lincoln Electric’s 2017 Annual Report and Form 10-K, please contact Amanda Butler in Investor Relations at (216) 383-2534, email: [email protected], 22801 St. Clair Avenue, Cleveland, Ohio 44117-1199 USA, or visit www.lincolnelectric.com.
TRANSFER AGENT AND REGISTRAR
Inquiries about dividends, shareholder records, share transfers, changes in ownership and address changes should be directed to Equiniti Trust Company:
MailEQ Shareowner ServicesP.O. Box 64856St. Paul, Minnesota 55164-0856
CourierEQ Shareowner Services1110 Centre Pointe Curve, Suite 101Mendota Heights, Minnesota 55120-4100
Direct(800) 468-9716 or (651) 450-4064www.shareowneronline.com
ENVIRONMENTAL, HEALTH & SAFETY (EH&S)
Visit http://lincolnelectricehs.com to learn about our EH&S performance and goals.
INDEPENDENT REGISTERED PUBLIC ACCOUNTING FIRM
Ernst & Young LLP
ANNUAL MEETING
Thursday, April 19, 201811:00 a.m. Eastern TimeLincoln Electric Welding Technology & Training Center22800 St. Clair Avenue, Cleveland, Ohio 44117
STOCK INFORMATION
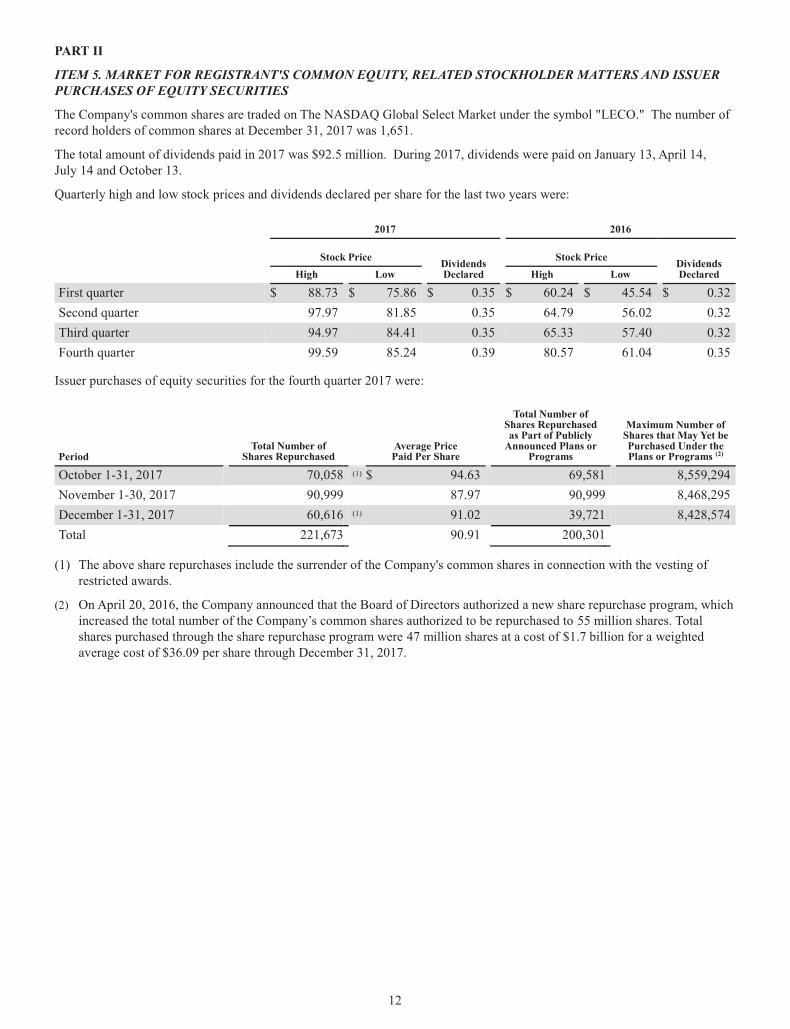
The Company’s stock is traded on the NASDAQ Stock Market (“NASDAQ”) under the symbol LECO.
Number of record holders of common shares at December 31, 2017: 1,651
C O R P O R AT E I N F O R M AT I O N

L I N C O L N E L E C T R I C H O L D I N G S , I N C .
22801 St. Clair Avenue Cleveland, Ohio 44117-1199 U.S.A.
www.lincolnelectric.com