4q20 gwr report - text
TRANSCRIPT
Quarterly Monitoring Report Chino Basin Recycled Water Groundwater Recharge Program
I certify under penalty of law that I have personally examined and am familiar with the information submitted in this document and all attachments thereto; and that, based on my inquiry of the individuals immediately responsible for obtaining the information, I believe that the information is true, accurate, and complete. I am aware that there are significant penalties for submitting false information, including the possibility of fine and imprisonment.
February
Executive Manager of Operations/ Assistant General Manager
General Manager
Inland Empire Utilities Agency Chino Basin Watermaster P.O. Box 9020 9641 San Bernardino Road Chino Hills, CA 91708 Rancho Cucamonga, CA 91730 909.993.1740 909.484.3888
Randy Lee Digitally signed by Randy Lee Date: 2021.02.10 16:53:39 -08'00'
Chino Basin Recycled Water
Groundwater Recharge Program
Quarterly Monitoring Report October 1 through December 31, 2020
Prepared by:
February 15, 2021
Chino Basin Recycled Water Quarterly Monitoring Report: Groundwater Recharge Program October 1 through December 31, 2020 Order No. R8-2007-0039 Fourth Quarter of 2020
i
Table of Contents
1. Introduction ............................................................................................................... 1
A. Order No. R8-2007-0039 ................................................................................ 1
B. Order No. R8-2009-0057 ................................................................................ 1
C. Revised Monitoring & Reporting Program No. R8-2007-0039 ................................ 1
D. Title 22, Division 4, Chapter 3. Article 5.1 §60320.100 ........................................ 2
E. Outline of the Quarterly Report ........................................................................ 2
2. Monitoring Results .................................................................................................... 2
A. Recycled Water: RP-1 and RP-4 ....................................................................... 2
B. Recycled Water: Basin and Lysimeter Samples ................................................... 6
C. Recycled Water: Alternative Monitoring Plans for TOC and TN ............................... 6
D. Diluent Water ................................................................................................ 7
E. Groundwater Monitoring Wells .......................................................................... 8
3. Recharge Operations ................................................................................................ 9
4. Operational Problems & Preventive or Corrective Actions ................................... 9
5. Certification of Non-Pumping in the Buffer Zones ................................................. 9
6. MVWD ASR Project ................................................................................................. 10
Chino Basin Recycled Water Quarterly Monitoring Report: Groundwater Recharge Program October 1 through December 31, 2020 Order No. R8-2007-0039 Fourth Quarter of 2020
ii
LIST OF TABLES
2-1a 2-1b 2-1c
Recycled Water Monitoring: RP-1 & RP-4 Effluent Water Quality (Recycled Water Quality Specifications A.5, A.7, A.8, & A.9)
2-2 Recycled Water Monitoring: Agency-Wide Flow-Weighted TIN & TDS (Recycled Water Quality Specifications A.6)
2-3a 2-3b
Recycled Water Monitoring: Recycled Water Quality Specifications A.1, A.2, A.3, & A.15
2-4a 2-4b
Recycled Water Monitoring: Remaining Priority Pollutants, EDCs & Pharmaceuticals, and Unregulated Chemicals (Monitoring & Reporting Program)
2-5a Lysimeter and Surface Water Monitoring: TOC, Nitrogen Species, and EC
2-5b Alternative Monitoring Plans
2-6 RWC, TOC Average, and TN Compliance Summary
2-7a Diluent Water Monitoring: Local Runoff / Stormwater
2-7b Diluent Water Monitoring: State Water Project – Silverwood Lake
2-8 Summary of Wells in Groundwater Monitoring Networks
2-9a Groundwater Monitoring Well Results (Quarterly)
2-9b Groundwater Monitoring Well Results - Priority Toxic Pollutants (Quarterly)
3-1 Diluent & Recycled Water Recharge Volumes
6-1 MVWD ASR Project - TIN/TDS Mass Balance
LIST OF FIGURES
1-1 Basin Locations
2-1 Monitoring Well Network: Hickory and Banana Basins
2-2 Monitoring Well Network: Turner Basins
2-3 Monitoring Well Network: 7th & 8th Street Basins
2-4 Monitoring Well Network: Ely Basins
2-5 Monitoring Well Network: Brooks Basin
2-6 Monitoring Well Network: RP3 Basins & Declez Basin
2-7 Monitoring Well Network: San Sevaine & Victoria Basins
Chino Basin Recycled Water Quarterly Monitoring Report: Groundwater Recharge Program October 1 through December 31, 2020 Order No. R8-2007-0039 Fourth Quarter of 2020
Page 1
1. Introduction
Inland Empire Utilities Agency (IEUA), Chino Basin Watermaster (Watermaster), Chino Basin Water Conservation District, and San Bernardino County Flood Control District are partners in the implementation of the Chino Basin Recycled Water Groundwater Recharge Program. This is part of a comprehensive water supply program to enhance water supply reliability and improve the groundwater quality in local drinking water wells throughout the Chino Groundwater Basin by increasing the recharge of stormwater, imported water and recycled water. This program is an integral part of Watermaster’s Optimum Basin Management Program (OBMP).
A. Order No. R8-2007-0039
On June 29, 2007, the Santa Ana Regional Water Quality Control Board (Regional Board) adopted Order No. R8-2007-0039 (Order) which prescribes the requirements for recycled water use for groundwater recharge in 13 recharge sites within the Chino-North Groundwater Management Zone. The locations of recharge basins in the Chino Basin Groundwater Recharge Program are shown in Figure 1-1.
As a provision of this Order, IEUA and Watermaster must also comply with Monitoring and Reporting Program No. R8-2007-0039 (MRP). The MRP includes the water quality monitoring requirements of the Chino Basin Recycled Water Groundwater Recharge Program and the requirement for the submittal of quarterly and annual reports. This document is the quarterly report for the fourth quarter of 2020 (4Q20).
The quarterly report includes the following elements as prescribed in the MRP:
Monitoring results for recycled water (including lysimeter monitoring), diluent water, and groundwater.
Recycled water and diluent water volumes recharged at each basin.
Reporting of any non-compliance events due to water quality, including records of any operational problems, plant upset and equipment breakdowns or malfunctions, and any diversion(s) of off-specification recycled water and the location(s) of final disposal. All corrective or preventive action(s) taken.
Certification that no groundwater has been pumped for domestic water supply use from the buffer zone that extends 500 feet and 6-months underground travel time from the recharge basin(s) where recycled water is applied.
B. Order No. R8-2009-0057
On October 23, 2009, the Regional Board adopted Order No. R8-2009-0057, which amended the recharge permit (Order No. R8-2007-0039) by extending the previously 60-month averaging period to 120 months for determining a recharge site’s recycled water contribution (RWC). The Order No. R8-2009-0057 also allowed a fraction of the groundwater underflow of the Chino Basin aquifers to be used as a source of diluent water when calculating the running average RWC.
C. Revised Monitoring & Reporting Program No. R8-2007-0039
On October 27, 2010, the Regional Board revised Monitoring and Reporting Program No. R8-2007-0039 (MRP) based on requests for modifications from IEUA and approved by the State Water Resources Control Board – Division of Drinking Water (DDW, formerly California Department of Public Health). The following changes were made to the MRP:
1) Sampling Requirements A.3, A.4, and A.5 were modified by specifying that samples shall be collected on a representative day instead of the 10th day.
Chino Basin Recycled Water Quarterly Monitoring Report: Groundwater Recharge Program October 1 through December 31, 2020 Order No. R8-2007-0039 Fourth Quarter of 2020
Page 2
2) Groundwater Monitoring Program Requirement V.1. was modified by adding a sentence to the paragraph that allows IEUA to analyze the groundwater samples collected on a quarterly basis from non-active municipal drinking water wells for dissolved metals, instead of total recoverable metals.
3) Reporting Requirement VI.B.3.b. was modified and footnote No. 18 was added to reflect that IEUA uses groundwater monitoring information contained in the State of the Basin report prepared on a biennial basis by the Chino Basin Watermaster, amongst other sources, for the annual determination of the recycled water groundwater flow path.
D. Title 22, Division 4, Chapter 3. Article 5.1 §60320.100
On June 18, 2014, the DDW adopted new regulations pertaining to Groundwater Replenishment Reuse Projects (GRRP), which can be found in Title 22 California Code of Regulations, Division 4, Chapter 3. Article 5.1 “Indirect Potable Reuse: Groundwater Replenishment - Surface Application” found in Sections §60320.100 through 60320.130. Pursuant to the new GRRP regulations, additional monitoring and reporting began in 3Q15.
The DDW GRRP regulations require that all GRRPs permitted prior to June 18, 2014 submit a report to the DDW and Regional Board to assess compliance of the existing permit in alignment with the GRRP requirements. The IEUA submitted the Compliance Assessment Report (CAR) for the Chino Basin Recycled Water Groundwater Recharge Project dated June 18, 2015 and a revised CAR dated December 12, 2018. On July 25, 2019, the DDW sent a letter to IEUA with their comments on the CAR. The DDW granted a deadline extension for IEUA to submit responses in an October 21, 2019 email. IEUA responded to the DDW comment letter on November 27, 2019.
E. Outline of the Quarterly Report
Section 2 of this quarterly report discusses the water quality monitoring results for recycled water recharge (water recycling plant effluent, distribution system, basin surface water, and lysimeter data), diluent water, and groundwater. Section 3 provides an overview of recharge operations including the volume of diluent water and recycled water recharged. Section 4 describes any operational problems and preventive and/or corrective actions taken. Section 5 contains the certification of non-pumping in the 500-foot buffer zones around each basin. Section 6 is a brief overview of the Monte Vista Water District’s (MVWD) Aquifer Storage and Recovery (ASR) project.
2. Monitoring Results
A. Recycled Water: RP-1 and RP-4
The requirements for recycled water monitoring are described in the MRP. Tables 2-1 through 2-4 include all of the requisite 4Q20 data.
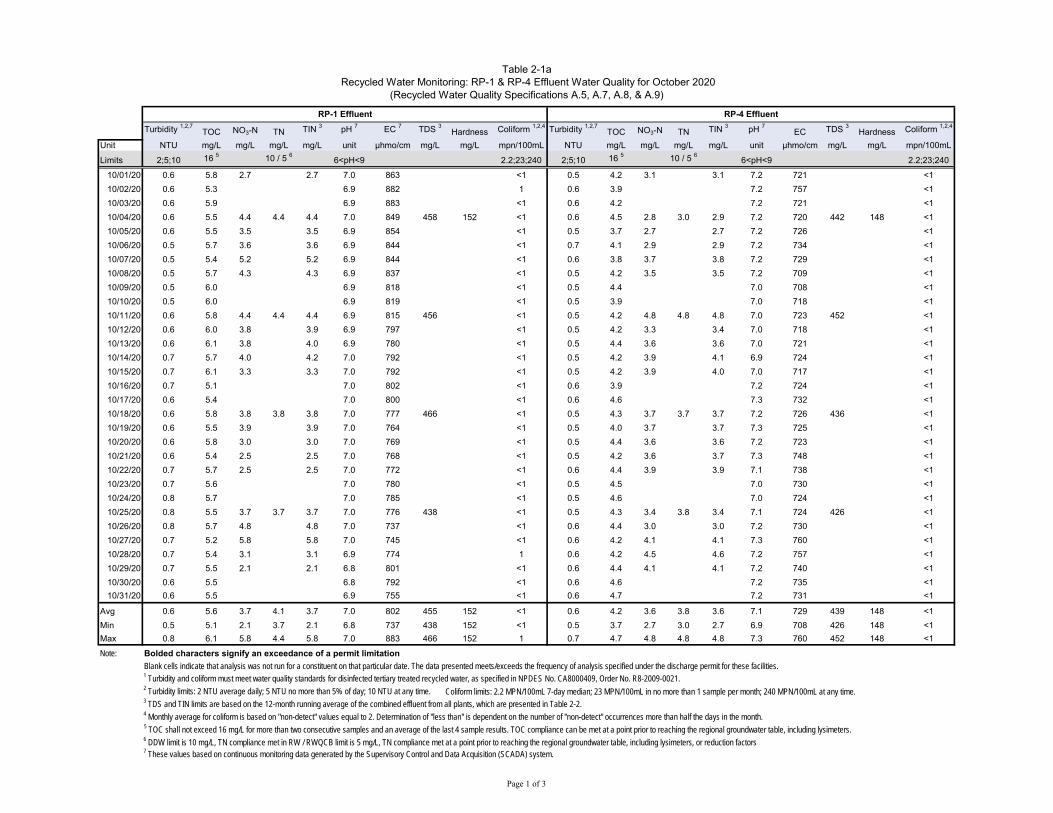
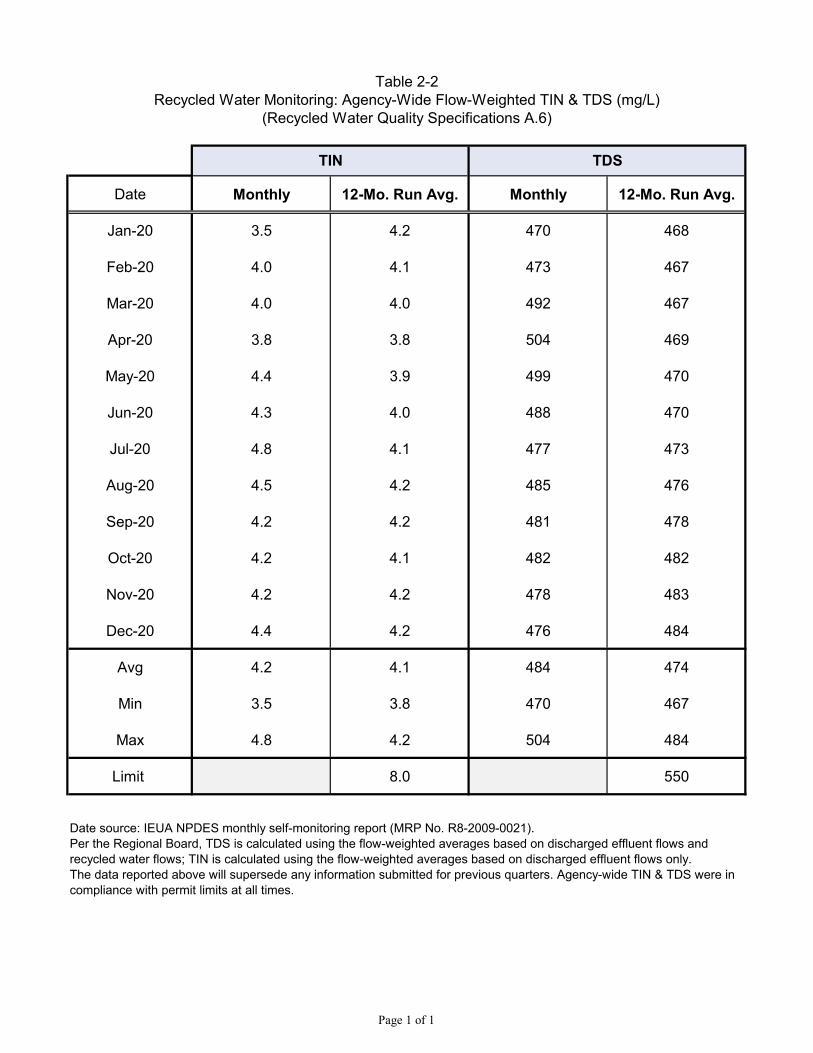
Recycled Water Specifications A.5 through A.9 in the Order are the narrative limits established in the permit. The corresponding monitoring data used to determine compliance with the Order are presented in Tables 2-1 and 2-2. The monitoring data in Table 2-1 is collected from samples of RP-1 and RP-4 effluent; however, recycled water compliance with the total nitrogen (TN) limit of 5 mg/L (Specification A.7) can also be met at the lysimeters (Table 2-5a) or at locations specified in alternative monitoring plans (Table 2-5b, and discussed in further detail in Section 2.C). During 4Q20, there were no exceedances of the TN limit. Table 2-2 shows the agency-wide monthly and 12-month running average concentrations for Total Inorganic Nitrogen (TIN) and Total Dissolved Solids (TDS). TDS and TIN were not exceeded during 4Q20.
Chino Basin Recycled Water Quarterly Monitoring Report: Groundwater Recharge Program October 1 through December 31, 2020 Order No. R8-2007-0039 Fourth Quarter of 2020
Page 3
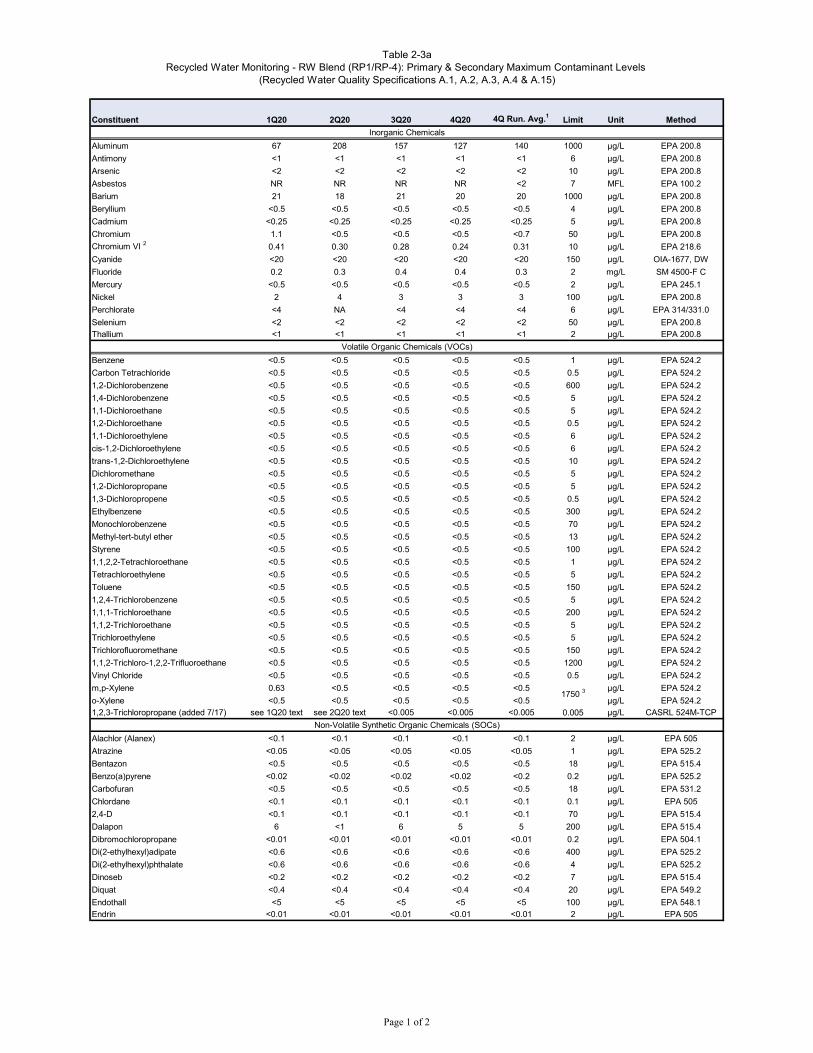
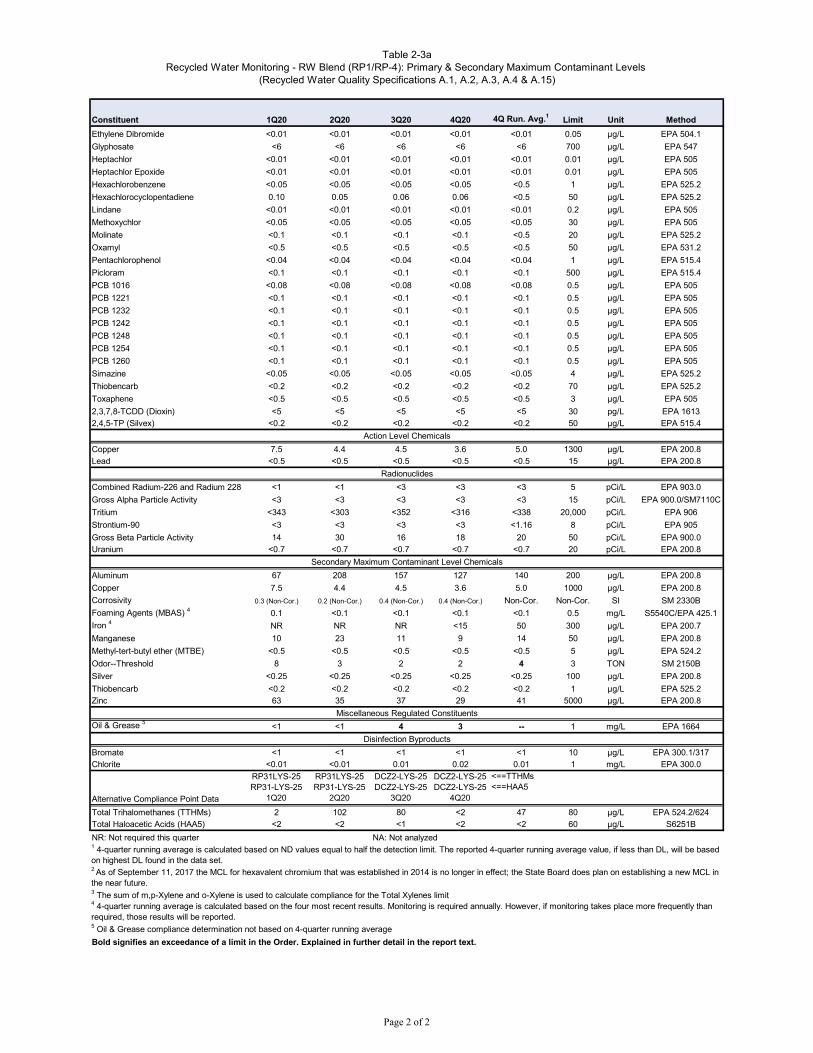
Recycled Water Specifications A.1 through A.4 of the Order are numerical limits based on the Federal and State primary maximum contaminant levels (MCLs), secondary MCLs, and Action Levels. Recycled Water Specification A.15 is a numerical limit for oil and grease.
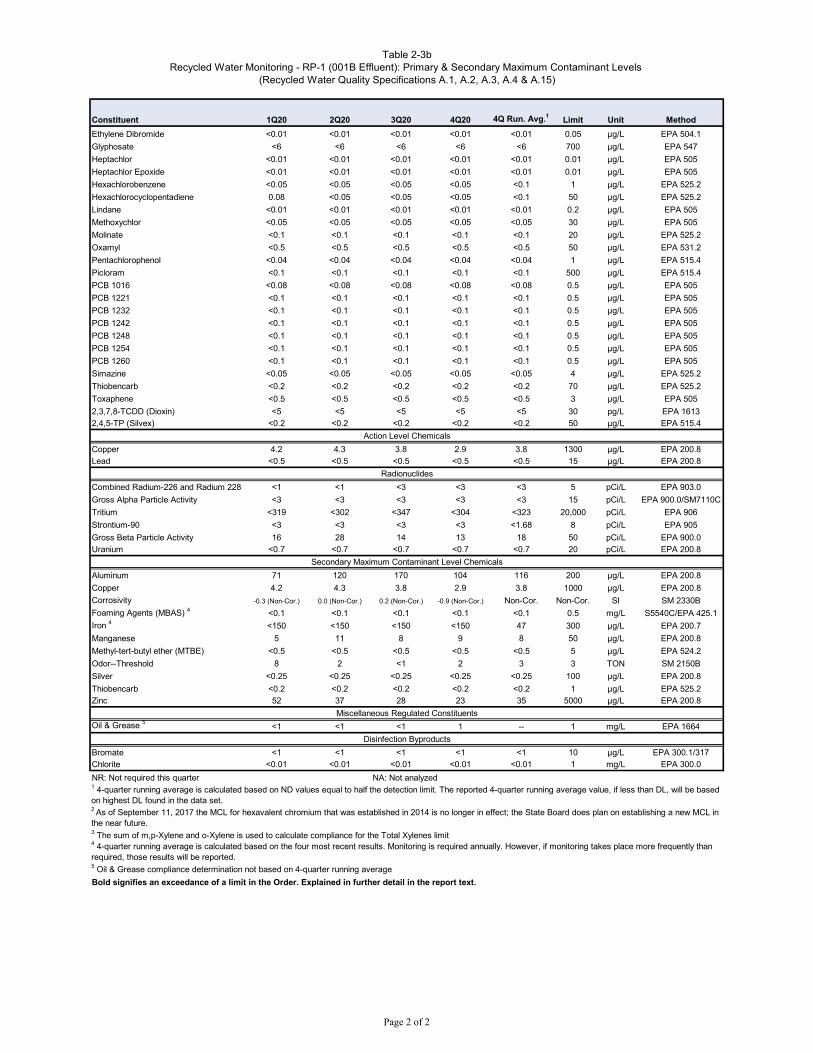
Table 2-3a shows the results for the DDW approved sample location representative of the recycled water blend from RP-1 and RP-4 used for recharge located at the RP-4 1299 Pressure Zone Pump Station (RW Blend). Table 2-3b shows results for the RP-1 001B effluent. During the CAR review, DDW identified that 001B effluent must be sampled and reported independently of the RW Blend.
In the Order, compliance for all constituents with MCLs or Action Levels is based on a 4-quarter running average (Recycled Water Specifications A.1 through A.4). Table 2-3a (RW Blend) and Table 2-3b (RP-1 001B effluent) summarize the 4-quarter running average concentration for each parameter from 1Q20 through 4Q20 and lists the corresponding compliance limits.
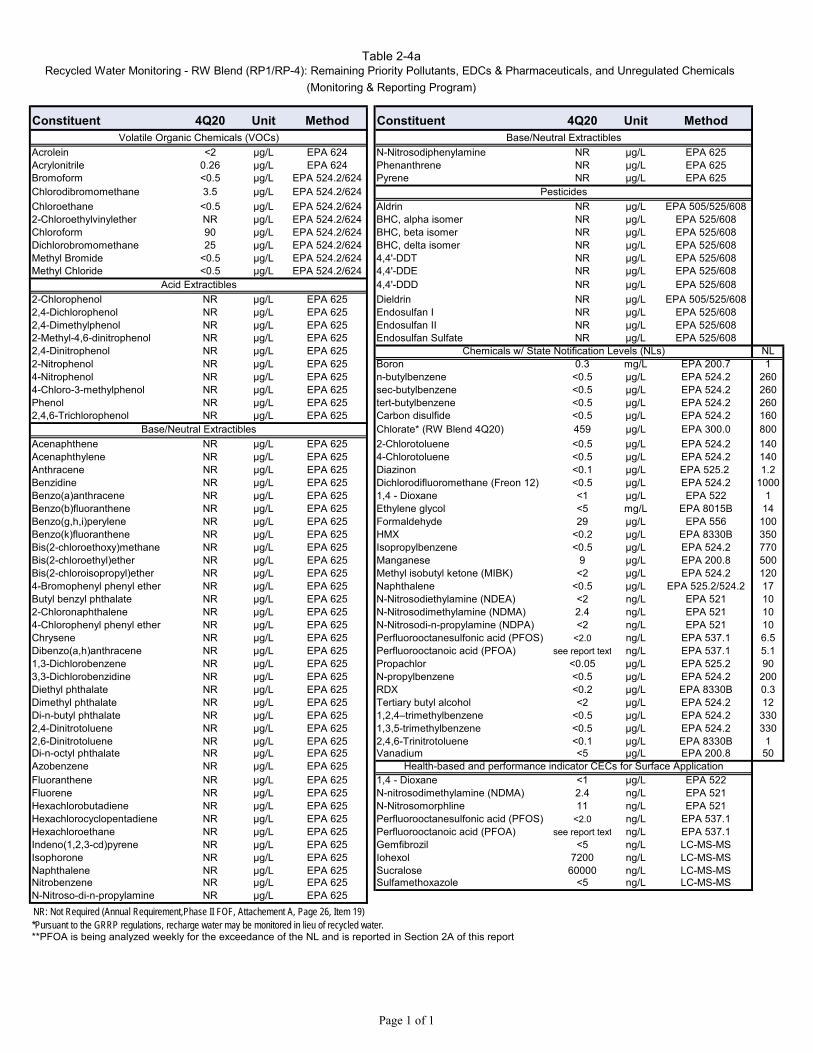
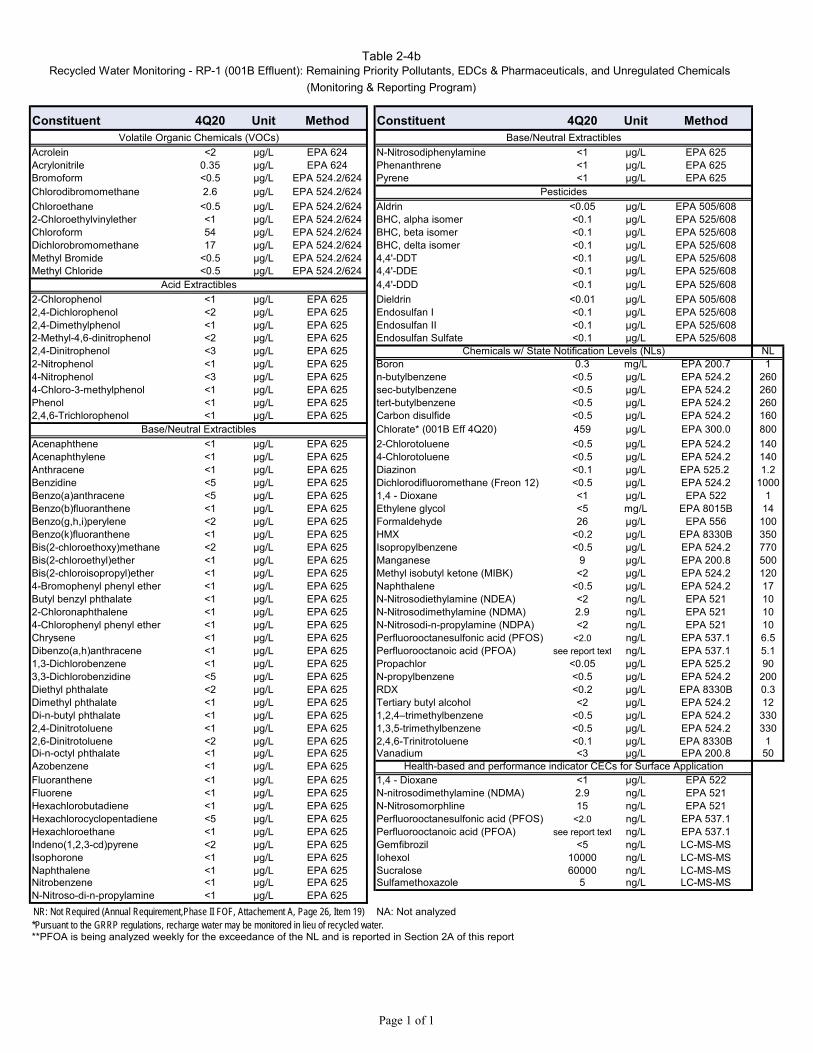
Tables 2-4a (RW Blend) and 2-4b (RP-1 001B Effluent) summarize the quarterly monitoring results of recycled water for constituents with no MCLs or Action Levels; this includes priority pollutants, chemicals of emerging concern (CECs), and chemicals with state notification levels.
Note that in Tables 2-4a and 2-4b there is an updated section named “Health-based and performance indicator CECs for Surface Application”, which includes CECs listed as monitoring requirements in the State Water Resources Control Board’s (State Water Board) amendment to the Policy for Water Quality Control for Recycled Water (Recycled Water Policy) adopted on December 11, 2018, and effective as of April 8, 2019. The amendment included updates to the CECs monitoring list based on the 2018 Science Advisory Panel recommendations.
There were no exceedances for the parameters analyzed during 4Q20 in the following categories: primary MCLs for inorganic chemicals; volatile organic compounds (VOCs); non-volatile synthetic organic chemicals (SOCs); radionuclides; disinfection byproducts; action levels for lead and copper; notification level chemicals (NLs), with the exception of Perfluorooctanoic acid (PFOA); and secondary MCLs for required constituents, with the exception of odor. PFOA, odor, and oil & grease exceedances are detailed below:
PFOA
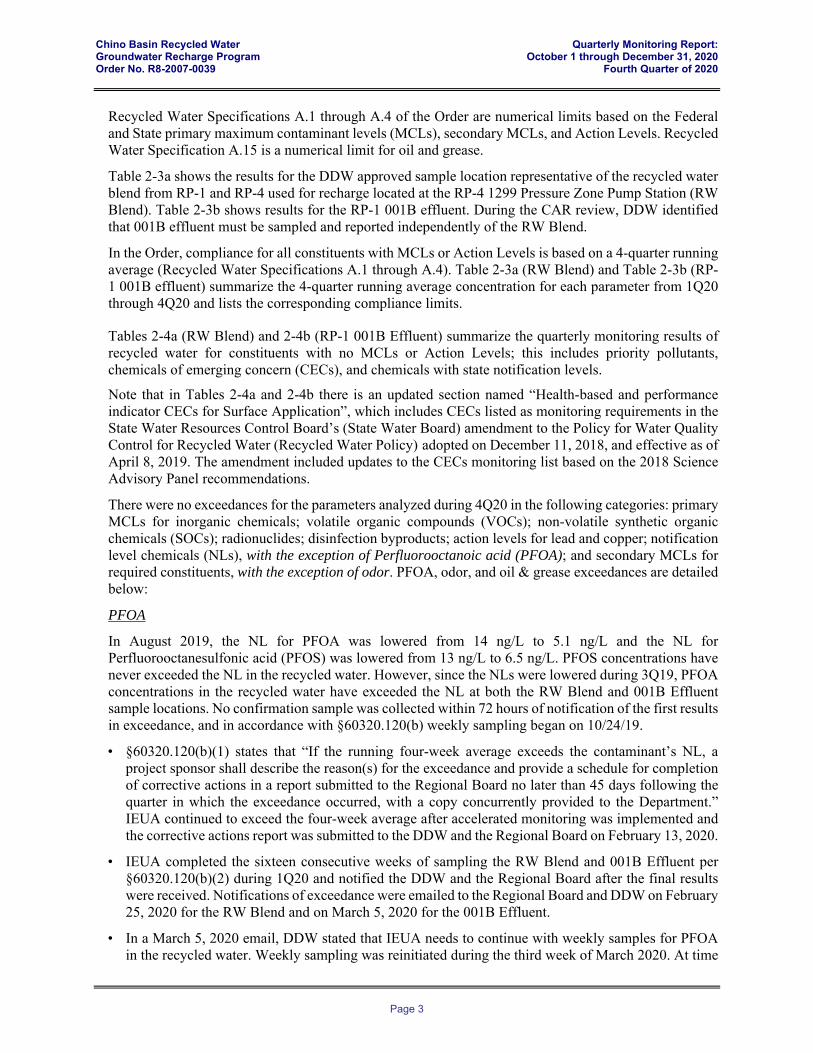
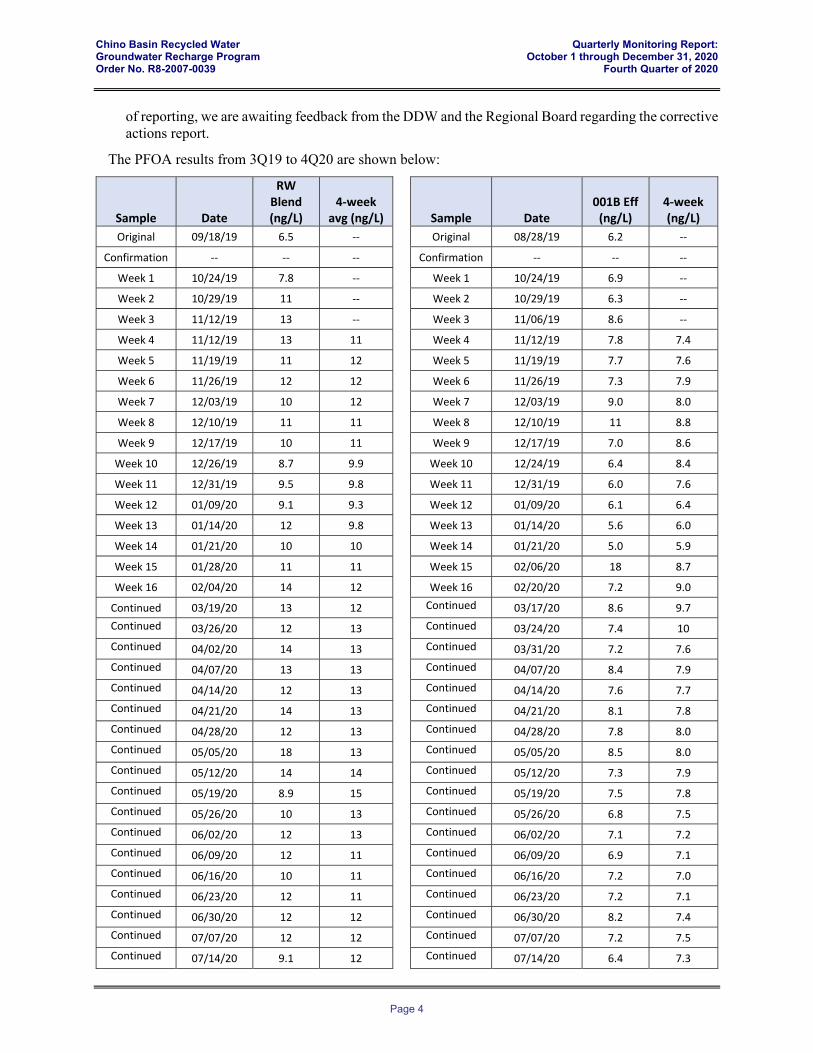
In August 2019, the NL for PFOA was lowered from 14 ng/L to 5.1 ng/L and the NL for Perfluorooctanesulfonic acid (PFOS) was lowered from 13 ng/L to 6.5 ng/L. PFOS concentrations have never exceeded the NL in the recycled water. However, since the NLs were lowered during 3Q19, PFOA concentrations in the recycled water have exceeded the NL at both the RW Blend and 001B Effluent sample locations. No confirmation sample was collected within 72 hours of notification of the first results in exceedance, and in accordance with §60320.120(b) weekly sampling began on 10/24/19.
• §60320.120(b)(1) states that “If the running four-week average exceeds the contaminant’s NL, a project sponsor shall describe the reason(s) for the exceedance and provide a schedule for completion of corrective actions in a report submitted to the Regional Board no later than 45 days following the quarter in which the exceedance occurred, with a copy concurrently provided to the Department.” IEUA continued to exceed the four-week average after accelerated monitoring was implemented and the corrective actions report was submitted to the DDW and the Regional Board on February 13, 2020.
• IEUA completed the sixteen consecutive weeks of sampling the RW Blend and 001B Effluent per §60320.120(b)(2) during 1Q20 and notified the DDW and the Regional Board after the final results were received. Notifications of exceedance were emailed to the Regional Board and DDW on February 25, 2020 for the RW Blend and on March 5, 2020 for the 001B Effluent.
• In a March 5, 2020 email, DDW stated that IEUA needs to continue with weekly samples for PFOA in the recycled water. Weekly sampling was reinitiated during the third week of March 2020. At time
Chino Basin Recycled Water Quarterly Monitoring Report: Groundwater Recharge Program October 1 through December 31, 2020 Order No. R8-2007-0039 Fourth Quarter of 2020
Page 4
of reporting, we are awaiting feedback from the DDW and the Regional Board regarding the corrective actions report.
The PFOA results from 3Q19 to 4Q20 are shown below:
Sample Date
RW Blend (ng/L)
4‐week avg (ng/L) Sample Date
001B Eff (ng/L)
4‐week (ng/L)
Original 09/18/19 6.5 ‐‐ Original 08/28/19 6.2 ‐‐
Confirmation ‐‐ ‐‐ ‐‐ Confirmation ‐‐ ‐‐ ‐‐
Week 1 10/24/19 7.8 ‐‐ Week 1 10/24/19 6.9 ‐‐
Week 2 10/29/19 11 ‐‐ Week 2 10/29/19 6.3 ‐‐
Week 3 11/12/19 13 ‐‐ Week 3 11/06/19 8.6 ‐‐
Week 4 11/12/19 13 11 Week 4 11/12/19 7.8 7.4
Week 5 11/19/19 11 12 Week 5 11/19/19 7.7 7.6
Week 6 11/26/19 12 12 Week 6 11/26/19 7.3 7.9
Week 7 12/03/19 10 12 Week 7 12/03/19 9.0 8.0
Week 8 12/10/19 11 11 Week 8 12/10/19 11 8.8
Week 9 12/17/19 10 11 Week 9 12/17/19 7.0 8.6
Week 10 12/26/19 8.7 9.9 Week 10 12/24/19 6.4 8.4
Week 11 12/31/19 9.5 9.8 Week 11 12/31/19 6.0 7.6
Week 12 01/09/20 9.1 9.3 Week 12 01/09/20 6.1 6.4
Week 13 01/14/20 12 9.8 Week 13 01/14/20 5.6 6.0
Week 14 01/21/20 10 10 Week 14 01/21/20 5.0 5.9
Week 15 01/28/20 11 11 Week 15 02/06/20 18 8.7
Week 16 02/04/20 14 12 Week 16 02/20/20 7.2 9.0
Continued 03/19/20 13 12 Continued 03/17/20 8.6 9.7
Continued 03/26/20 12 13 Continued 03/24/20 7.4 10
Continued 04/02/20 14 13 Continued 03/31/20 7.2 7.6
Continued 04/07/20 13 13 Continued 04/07/20 8.4 7.9
Continued 04/14/20 12 13 Continued 04/14/20 7.6 7.7
Continued 04/21/20 14 13 Continued 04/21/20 8.1 7.8
Continued 04/28/20 12 13 Continued 04/28/20 7.8 8.0
Continued 05/05/20 18 13 Continued 05/05/20 8.5 8.0
Continued 05/12/20 14 14 Continued 05/12/20 7.3 7.9
Continued 05/19/20 8.9 15 Continued 05/19/20 7.5 7.8
Continued 05/26/20 10 13 Continued 05/26/20 6.8 7.5
Continued 06/02/20 12 13 Continued 06/02/20 7.1 7.2
Continued 06/09/20 12 11 Continued 06/09/20 6.9 7.1
Continued 06/16/20 10 11 Continued 06/16/20 7.2 7.0
Continued 06/23/20 12 11 Continued 06/23/20 7.2 7.1
Continued 06/30/20 12 12 Continued 06/30/20 8.2 7.4
Continued 07/07/20 12 12 Continued 07/07/20 7.2 7.5
Continued 07/14/20 9.1 12 Continued 07/14/20 6.4 7.3
Chino Basin Recycled Water Quarterly Monitoring Report: Groundwater Recharge Program October 1 through December 31, 2020 Order No. R8-2007-0039 Fourth Quarter of 2020
Page 5
Sample Date
RW Blend (ng/L)
4‐week avg (ng/L) Sample Date
001B Eff (ng/L)
4‐week (ng/L)
Continued 07/21/20 8.6 10 Continued 07/21/20 7.8 7.4
Continued 07/28/20 10 9.9 Continued 07/28/20 9.0 7.6
Continued 08/04/20 7.8 8.9 Continued 08/04/20 7.0 7.6
Continued 08/11/20 8.7 8.8 Continued 08/11/20 7.5 7.8
Continued 08/18/20 8.3 8.7 Continued 08/18/20 5.9 7.4
Continued 08/25/20 8.6 8.4 Continued 08/25/20 7.5 7.0
Continued 09/01/20 11 9.2 Continued 09/01/20 7.7 7.2
Continued 09/08/20 12 10 Continued 09/08/20 6.7 7.0
Continued 09/15/20 13 11 Continued 09/15/20 7.2 7.3
Continued 09/22/20 8.7 11 Continued 09/22/20 7.0 7.2
Continued 09/29/20 8.7 11 Continued 09/29/20 8.0 7.2
Continued 10/06/20 13 11 Continued 10/06/20 6.8 7.3
Continued 10/13/20 15 12 Continued 10/13/20 9.3 7.8
Continued 10/20/20 11 13 Continued 10/20/20 8.4 8.1
Continued 10/28/20 12 13 Continued 10/27/20 8.5 8.3
Continued 11/03/20 14 13 Continued 11/03/20 8.4 8.7
Continued 11/11/20 8.5 11 Continued 11/11/20 7.7 8.3
Continued 11/17/20 12 12 Continued 11/24/20 8.7 8.3
Continued 11/24/20 12 12 Continued 12/01/20 7.7 8.1
Continued 12/01/20 13 11 Continued 12/08/20 8.2 8.1
Continued 12/08/20 18 14 Continued 12/15/20 6.5 7.8
Continued 12/15/20 13 14 Continued 12/22/20 6.9 7.3
Continued 12/22/20 12 14 Continued 12/29/20 8.9 7.6
Continued 12/29/20 19 16
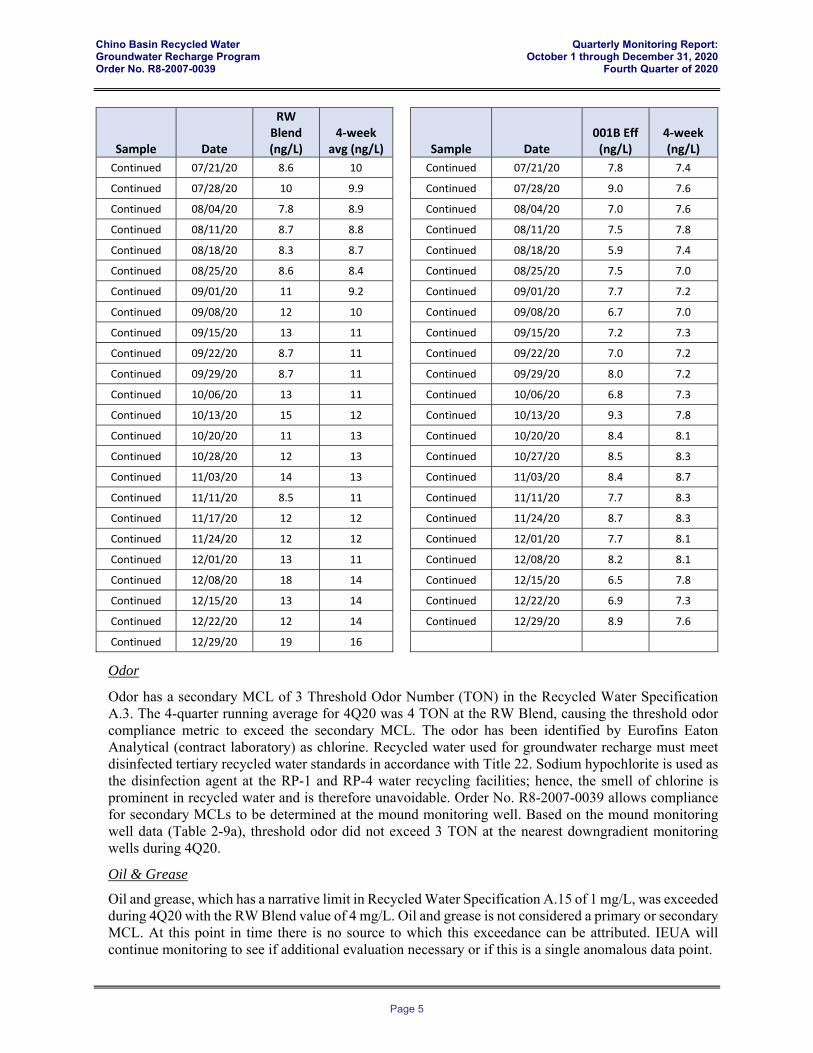
Odor
Odor has a secondary MCL of 3 Threshold Odor Number (TON) in the Recycled Water Specification A.3. The 4-quarter running average for 4Q20 was 4 TON at the RW Blend, causing the threshold odor compliance metric to exceed the secondary MCL. The odor has been identified by Eurofins Eaton Analytical (contract laboratory) as chlorine. Recycled water used for groundwater recharge must meet disinfected tertiary recycled water standards in accordance with Title 22. Sodium hypochlorite is used as the disinfection agent at the RP-1 and RP-4 water recycling facilities; hence, the smell of chlorine is prominent in recycled water and is therefore unavoidable. Order No. R8-2007-0039 allows compliance for secondary MCLs to be determined at the mound monitoring well. Based on the mound monitoring well data (Table 2-9a), threshold odor did not exceed 3 TON at the nearest downgradient monitoring wells during 4Q20.
Oil & Grease
Oil and grease, which has a narrative limit in Recycled Water Specification A.15 of 1 mg/L, was exceeded during 4Q20 with the RW Blend value of 4 mg/L. Oil and grease is not considered a primary or secondary MCL. At this point in time there is no source to which this exceedance can be attributed. IEUA will continue monitoring to see if additional evaluation necessary or if this is a single anomalous data point.
Chino Basin Recycled Water Quarterly Monitoring Report: Groundwater Recharge Program October 1 through December 31, 2020 Order No. R8-2007-0039 Fourth Quarter of 2020
Page 6
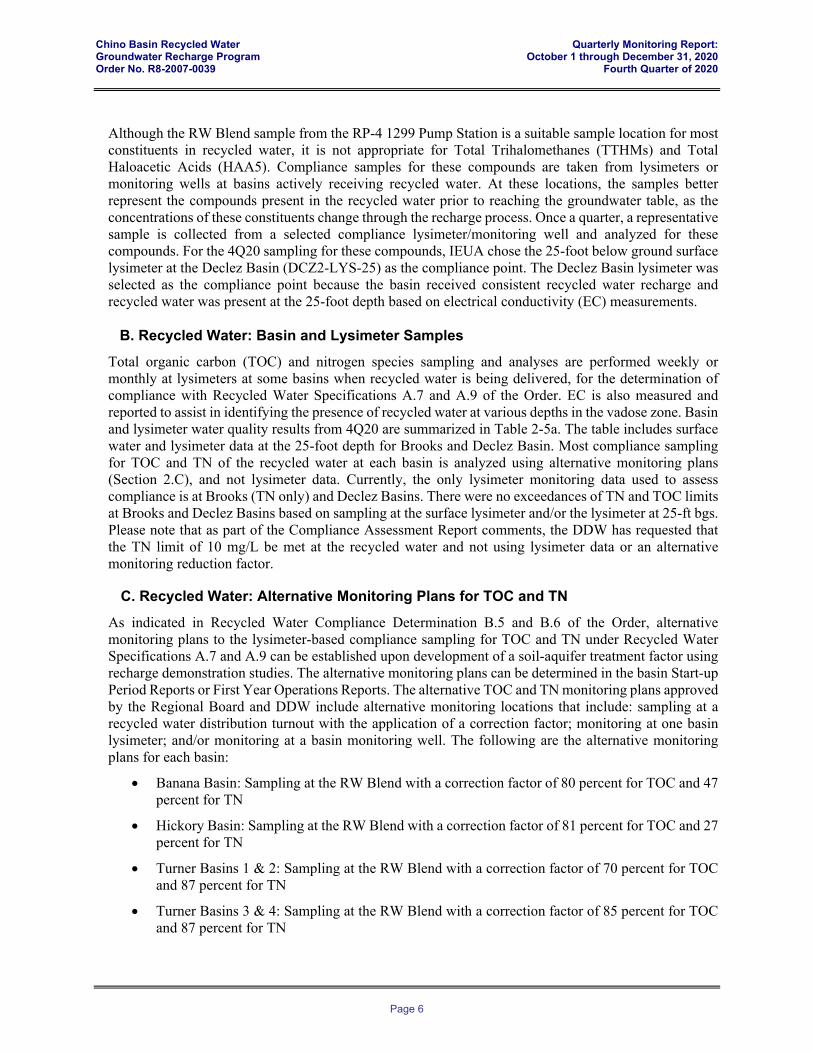
Although the RW Blend sample from the RP-4 1299 Pump Station is a suitable sample location for most constituents in recycled water, it is not appropriate for Total Trihalomethanes (TTHMs) and Total Haloacetic Acids (HAA5). Compliance samples for these compounds are taken from lysimeters or monitoring wells at basins actively receiving recycled water. At these locations, the samples better represent the compounds present in the recycled water prior to reaching the groundwater table, as the concentrations of these constituents change through the recharge process. Once a quarter, a representative sample is collected from a selected compliance lysimeter/monitoring well and analyzed for these compounds. For the 4Q20 sampling for these compounds, IEUA chose the 25-foot below ground surface lysimeter at the Declez Basin (DCZ2-LYS-25) as the compliance point. The Declez Basin lysimeter was selected as the compliance point because the basin received consistent recycled water recharge and recycled water was present at the 25-foot depth based on electrical conductivity (EC) measurements.
B. Recycled Water: Basin and Lysimeter Samples
Total organic carbon (TOC) and nitrogen species sampling and analyses are performed weekly or monthly at lysimeters at some basins when recycled water is being delivered, for the determination of compliance with Recycled Water Specifications A.7 and A.9 of the Order. EC is also measured and reported to assist in identifying the presence of recycled water at various depths in the vadose zone. Basin and lysimeter water quality results from 4Q20 are summarized in Table 2-5a. The table includes surface water and lysimeter data at the 25-foot depth for Brooks and Declez Basin. Most compliance sampling for TOC and TN of the recycled water at each basin is analyzed using alternative monitoring plans (Section 2.C), and not lysimeter data. Currently, the only lysimeter monitoring data used to assess compliance is at Brooks (TN only) and Declez Basins. There were no exceedances of TN and TOC limits at Brooks and Declez Basins based on sampling at the surface lysimeter and/or the lysimeter at 25-ft bgs. Please note that as part of the Compliance Assessment Report comments, the DDW has requested that the TN limit of 10 mg/L be met at the recycled water and not using lysimeter data or an alternative monitoring reduction factor.
C. Recycled Water: Alternative Monitoring Plans for TOC and TN
As indicated in Recycled Water Compliance Determination B.5 and B.6 of the Order, alternative monitoring plans to the lysimeter-based compliance sampling for TOC and TN under Recycled Water Specifications A.7 and A.9 can be established upon development of a soil-aquifer treatment factor using recharge demonstration studies. The alternative monitoring plans can be determined in the basin Start-up Period Reports or First Year Operations Reports. The alternative TOC and TN monitoring plans approved by the Regional Board and DDW include alternative monitoring locations that include: sampling at a recycled water distribution turnout with the application of a correction factor; monitoring at one basin lysimeter; and/or monitoring at a basin monitoring well. The following are the alternative monitoring plans for each basin:
Banana Basin: Sampling at the RW Blend with a correction factor of 80 percent for TOC and 47 percent for TN
Hickory Basin: Sampling at the RW Blend with a correction factor of 81 percent for TOC and 27 percent for TN
Turner Basins 1 & 2: Sampling at the RW Blend with a correction factor of 70 percent for TOC and 87 percent for TN
Turner Basins 3 & 4: Sampling at the RW Blend with a correction factor of 85 percent for TOC and 87 percent for TN
Chino Basin Recycled Water Quarterly Monitoring Report: Groundwater Recharge Program October 1 through December 31, 2020 Order No. R8-2007-0039 Fourth Quarter of 2020
Page 7
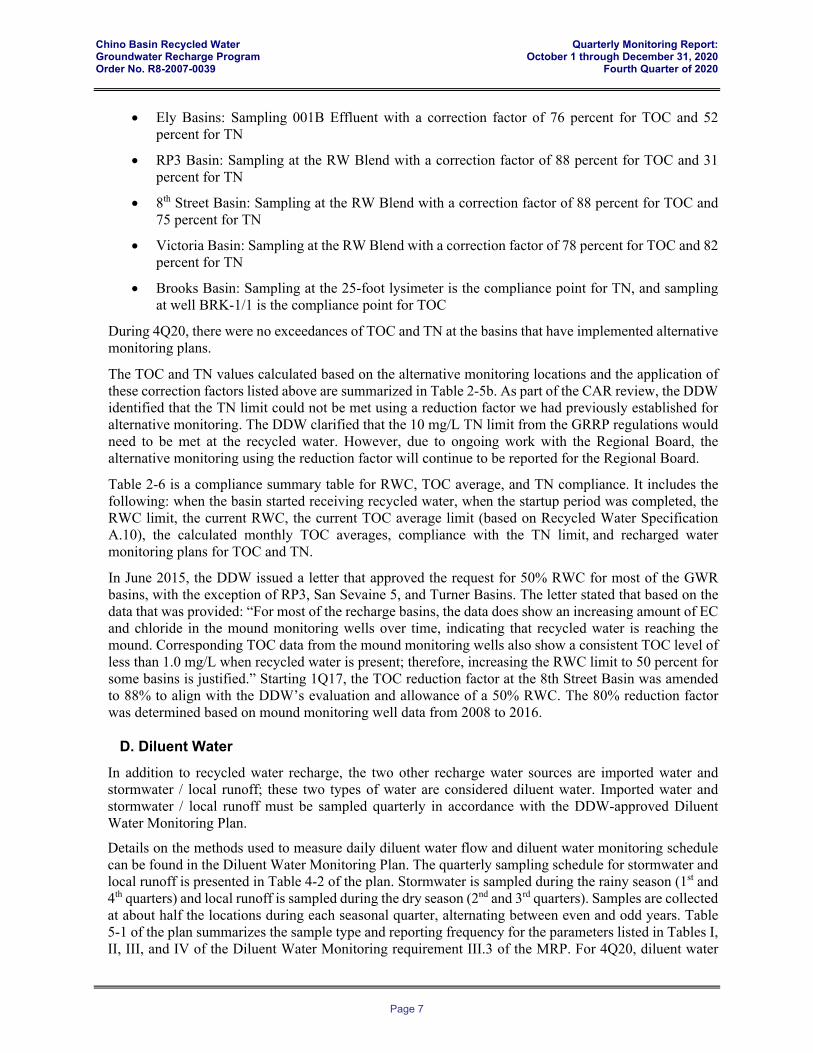
Ely Basins: Sampling 001B Effluent with a correction factor of 76 percent for TOC and 52 percent for TN
RP3 Basin: Sampling at the RW Blend with a correction factor of 88 percent for TOC and 31 percent for TN
8th Street Basin: Sampling at the RW Blend with a correction factor of 88 percent for TOC and 75 percent for TN
Victoria Basin: Sampling at the RW Blend with a correction factor of 78 percent for TOC and 82 percent for TN
Brooks Basin: Sampling at the 25-foot lysimeter is the compliance point for TN, and sampling at well BRK-1/1 is the compliance point for TOC
During 4Q20, there were no exceedances of TOC and TN at the basins that have implemented alternative monitoring plans.
The TOC and TN values calculated based on the alternative monitoring locations and the application of these correction factors listed above are summarized in Table 2-5b. As part of the CAR review, the DDW identified that the TN limit could not be met using a reduction factor we had previously established for alternative monitoring. The DDW clarified that the 10 mg/L TN limit from the GRRP regulations would need to be met at the recycled water. However, due to ongoing work with the Regional Board, the alternative monitoring using the reduction factor will continue to be reported for the Regional Board.
Table 2-6 is a compliance summary table for RWC, TOC average, and TN compliance. It includes the following: when the basin started receiving recycled water, when the startup period was completed, the RWC limit, the current RWC, the current TOC average limit (based on Recycled Water Specification A.10), the calculated monthly TOC averages, compliance with the TN limit, and recharged water monitoring plans for TOC and TN.
In June 2015, the DDW issued a letter that approved the request for 50% RWC for most of the GWR basins, with the exception of RP3, San Sevaine 5, and Turner Basins. The letter stated that based on the data that was provided: “For most of the recharge basins, the data does show an increasing amount of EC and chloride in the mound monitoring wells over time, indicating that recycled water is reaching the mound. Corresponding TOC data from the mound monitoring wells also show a consistent TOC level of less than 1.0 mg/L when recycled water is present; therefore, increasing the RWC limit to 50 percent for some basins is justified.” Starting 1Q17, the TOC reduction factor at the 8th Street Basin was amended to 88% to align with the DDW’s evaluation and allowance of a 50% RWC. The 80% reduction factor was determined based on mound monitoring well data from 2008 to 2016.
D. Diluent Water
In addition to recycled water recharge, the two other recharge water sources are imported water and stormwater / local runoff; these two types of water are considered diluent water. Imported water and stormwater / local runoff must be sampled quarterly in accordance with the DDW-approved Diluent Water Monitoring Plan.
Details on the methods used to measure daily diluent water flow and diluent water monitoring schedule can be found in the Diluent Water Monitoring Plan. The quarterly sampling schedule for stormwater and local runoff is presented in Table 4-2 of the plan. Stormwater is sampled during the rainy season (1st and 4th quarters) and local runoff is sampled during the dry season (2nd and 3rd quarters). Samples are collected at about half the locations during each seasonal quarter, alternating between even and odd years. Table 5-1 of the plan summarizes the sample type and reporting frequency for the parameters listed in Tables I, II, III, and IV of the Diluent Water Monitoring requirement III.3 of the MRP. For 4Q20, diluent water
Chino Basin Recycled Water Quarterly Monitoring Report: Groundwater Recharge Program October 1 through December 31, 2020 Order No. R8-2007-0039 Fourth Quarter of 2020
Page 8
quality sampling of four local runoff sites (due to limited rain events) and one stormwater site were conducted during the month of December 2020. Table 2-7a lists the results of the local runoff and stormwater sampling and analyses. The maximum level to trigger a source water evaluation has been exceeded currently or historically for both primary and secondary MCLs for aluminum; the secondary MCLs for surfactants and manganese; and the notification level for PFOA and PFOS. IEUA has submitted a preliminary evaluation of potential source for all the contaminants where concentrations exceed the maximum level to trigger a source evaluation as part of the CAR and is awaiting a response from DDW regarding the need to complete a source water evaluation.
State Water Project water was not delivered as diluent water during 4Q20. Table 2-7b lists the results from Metropolitan Water District’s (MWD) general mineral and physical analysis of source water from Silverwood Lake.
E. Groundwater Monitoring Wells
Monitoring is conducted at groundwater monitoring wells quarterly and annually to evaluate groundwater quality conditions in the vicinity of the recharge basins utilizing recycled water. Groundwater monitoring results can be used to assess background conditions, time the arrival of recharge waters, and the impact that recharged water has on downgradient water supplies. The wells in the monitoring well networks for Hickory and Banana, Turner, 8th Street, Ely, Brooks, RP3, San Sevaine, Victoria, and Declez Basins are summarized in Table 2-8, and presented on Figures 2-1 through 2-7, respectively. Groundwater quality samples are collected and tested quarterly for all constituents listed in Table 1 of Section V in the MRP R8-2007-0039, and annually for constituents specified in the Phase II Findings of Fact, Attachment A in the permit (Bullet 27 in the Conditions Section). The groundwater constituents analyzed from the monitoring wells during quarterly monitoring are presented in Table 2-9a.
Any 4Q20 sample which exceeded primary or secondary MCLs are shown in Table 2-9a in bold italic font. The DDW is notified within 48 hours of receiving the results for primary MCL exceedances or coliform presence at active municipal drinking water wells. Exceedances of primary MCLs and coliform presence at non-drinking water monitoring wells and all secondary MCL exceedances are not reported to the DDW but are reported in the quarterly reports. Of note are the analyses for the following wells and constituents:
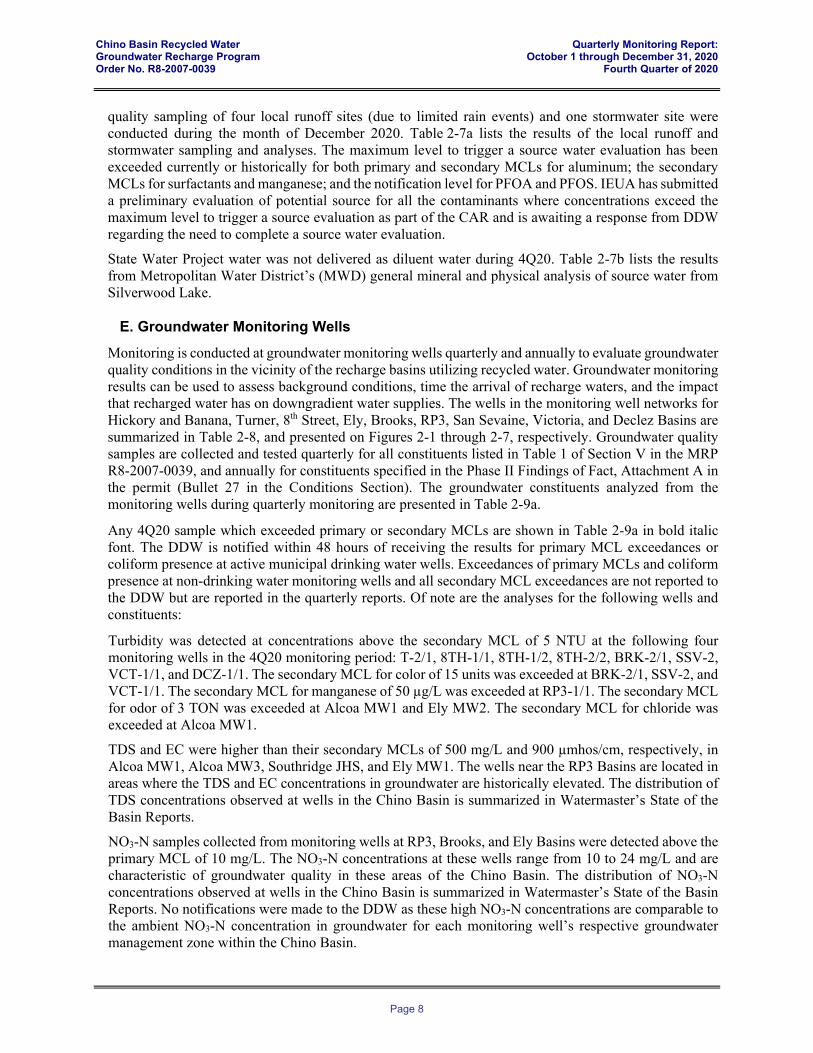
Turbidity was detected at concentrations above the secondary MCL of 5 NTU at the following four monitoring wells in the 4Q20 monitoring period: T-2/1, 8TH-1/1, 8TH-1/2, 8TH-2/2, BRK-2/1, SSV-2, VCT-1/1, and DCZ-1/1. The secondary MCL for color of 15 units was exceeded at BRK-2/1, SSV-2, and VCT-1/1. The secondary MCL for manganese of 50 µg/L was exceeded at RP3-1/1. The secondary MCL for odor of 3 TON was exceeded at Alcoa MW1 and Ely MW2. The secondary MCL for chloride was exceeded at Alcoa MW1.
TDS and EC were higher than their secondary MCLs of 500 mg/L and 900 µmhos/cm, respectively, in Alcoa MW1, Alcoa MW3, Southridge JHS, and Ely MW1. The wells near the RP3 Basins are located in areas where the TDS and EC concentrations in groundwater are historically elevated. The distribution of TDS concentrations observed at wells in the Chino Basin is summarized in Watermaster’s State of the Basin Reports.
NO3-N samples collected from monitoring wells at RP3, Brooks, and Ely Basins were detected above the primary MCL of 10 mg/L. The NO3-N concentrations at these wells range from 10 to 24 mg/L and are characteristic of groundwater quality in these areas of the Chino Basin. The distribution of NO3-N concentrations observed at wells in the Chino Basin is summarized in Watermaster’s State of the Basin Reports. No notifications were made to the DDW as these high NO3-N concentrations are comparable to the ambient NO3-N concentration in groundwater for each monitoring well’s respective groundwater management zone within the Chino Basin.
Chino Basin Recycled Water Quarterly Monitoring Report: Groundwater Recharge Program October 1 through December 31, 2020 Order No. R8-2007-0039 Fourth Quarter of 2020
Page 9
The current State of the Basin Report, which is the “Chino Basin Optimum Basin Management Program 2018 State of the Basin Report” published in June 2019 was prepared by Wildermuth Environmental for the CBWM. The 2018 State of the Basin report can be downloaded from CBWM’s website, www.cbwm.org.
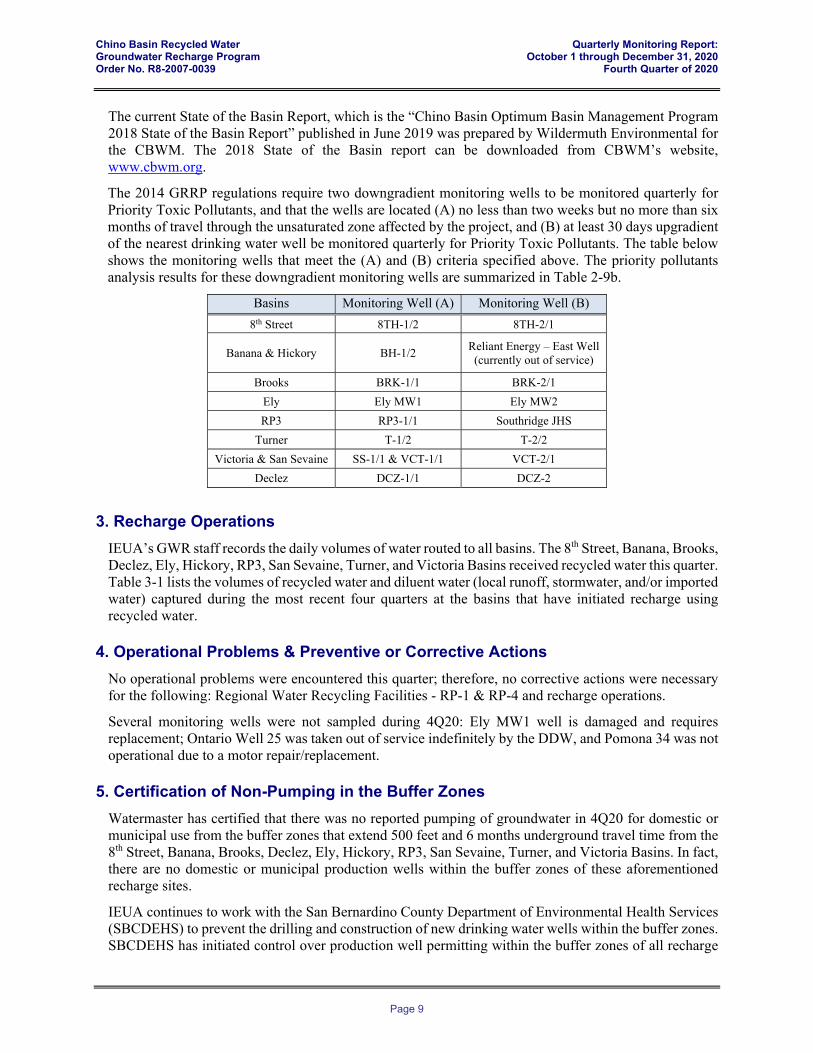
The 2014 GRRP regulations require two downgradient monitoring wells to be monitored quarterly for Priority Toxic Pollutants, and that the wells are located (A) no less than two weeks but no more than six months of travel through the unsaturated zone affected by the project, and (B) at least 30 days upgradient of the nearest drinking water well be monitored quarterly for Priority Toxic Pollutants. The table below shows the monitoring wells that meet the (A) and (B) criteria specified above. The priority pollutants analysis results for these downgradient monitoring wells are summarized in Table 2-9b.
Basins Monitoring Well (A) Monitoring Well (B)
8th Street 8TH-1/2 8TH-2/1
Banana & Hickory BH-1/2 Reliant Energy – East Well (currently out of service)
Brooks BRK-1/1 BRK-2/1
Ely Ely MW1 Ely MW2
RP3 RP3-1/1 Southridge JHS
Turner T-1/2 T-2/2
Victoria & San Sevaine SS-1/1 & VCT-1/1 VCT-2/1
Declez DCZ-1/1 DCZ-2
3. Recharge Operations
IEUA’s GWR staff records the daily volumes of water routed to all basins. The 8th Street, Banana, Brooks, Declez, Ely, Hickory, RP3, San Sevaine, Turner, and Victoria Basins received recycled water this quarter. Table 3-1 lists the volumes of recycled water and diluent water (local runoff, stormwater, and/or imported water) captured during the most recent four quarters at the basins that have initiated recharge using recycled water.
4. Operational Problems & Preventive or Corrective Actions
No operational problems were encountered this quarter; therefore, no corrective actions were necessary for the following: Regional Water Recycling Facilities - RP-1 & RP-4 and recharge operations.
Several monitoring wells were not sampled during 4Q20: Ely MW1 well is damaged and requires replacement; Ontario Well 25 was taken out of service indefinitely by the DDW, and Pomona 34 was not operational due to a motor repair/replacement.
5. Certification of Non-Pumping in the Buffer Zones
Watermaster has certified that there was no reported pumping of groundwater in 4Q20 for domestic or municipal use from the buffer zones that extend 500 feet and 6 months underground travel time from the 8th Street, Banana, Brooks, Declez, Ely, Hickory, RP3, San Sevaine, Turner, and Victoria Basins. In fact, there are no domestic or municipal production wells within the buffer zones of these aforementioned recharge sites.
IEUA continues to work with the San Bernardino County Department of Environmental Health Services (SBCDEHS) to prevent the drilling and construction of new drinking water wells within the buffer zones. SBCDEHS has initiated control over production well permitting within the buffer zones of all recharge

Chino Basin Recycled Water Quarterly Monitoring Report: Groundwater Recharge Program October 1 through December 31, 2020 Order No. R8-2007-0039 Fourth Quarter of 2020
Page 10
sites through the use of buffer zone maps that utilize the same land coordinate system (Township/Range/Section/40-acre Parcel) that is used in the permitting process. SBCDEHS reviews new well permit applications, in part, by checking the proposed location of a new drinking water well against recharge basin location maps and parcel lists, both provided by IEUA. The maps and lists show township/range/section parcels (40-acre parcels) that abut recharge basins and their 500-foot buffers.
If a proposed well falls within an abutting parcel, SBCDEHS will review the well location using maps of the basins and buffer zones. If the well falls too near the buffer zone boundary for SBCDEHS to determine the relationship of the proposed well location to the buffer boundary, SBCDEHS will defer to IEUA for a prompt field review of the proposed well location. The field review may include contacting and having the well applicant identify the exact location of the proposed well casing. To conduct a detailed field review, SBCDEHS will contact and provide the IEUA Groundwater Recharge Coordinator with a copy of the well permit application and a timeline for the completion of IEUA’s review. Following the review, IEUA will notify SBCDEHS of its findings in writing. IEUA will also notify the DDW and the Regional Board of well permit applications that it recommends should be declined due to well locations determined to fall with a 500-foot buffer zone.
6. MVWD ASR Project
Reporting for the Monte Vista Water District (MVWD) Aquifer Storage and Recovery (ASR) project was allowed by the Regional Board to be included under IEUA/Watermaster Phase I Groundwater Recharge Order No. R8-2005-0033 and subsequent permit updates. In April 2007, MVWD, Watermaster, and IEUA entered into an agreement to report the MVWD ASR project groundwater injection/recovery volumes and TIN/TDS mass balance in the recharge program quarterly reports. Initial injection began in June 2007. In June 2019, MVWD restarted injection activities for the first time since May 2018. The injection activities continued through 4Q19. Table 6-1 summarizes the monthly volumes and TIN/TDS of injected and recovered water. The table also includes the mass balance of TIN/TDS from the injection-recovery cycles for the last year.
Turbidity 1,2,7TOC NO3-N TN TIN 3 pH 7 EC 7 TDS 3 Hardness Coliform 1,2,4 Turbidity 1,2,7
TOC NO3-N TN TIN 3 pH 7 EC TDS 3 Hardness Coliform 1,2,4
Unit NTU mg/L mg/L mg/L mg/L unit µhmo/cm mg/L mg/L mpn/100mL NTU mg/L mg/L mg/L mg/L unit µhmo/cm mg/L mg/L mpn/100mL
Limits 2;5;10 16 5 10 / 5 6 6<pH<9 2.2;23;240 2;5;10 16 5 10 / 5 6 6<pH<9 2.2;23;240
10/01/20 0.6 5.8 2.7 2.7 7.0 863 <1 0.5 4.2 3.1 3.1 7.2 721 <1
10/02/20 0.6 5.3 6.9 882 1 0.6 3.9 7.2 757 <1
10/03/20 0.6 5.9 6.9 883 <1 0.6 4.2 7.2 721 <1
10/04/20 0.6 5.5 4.4 4.4 4.4 7.0 849 458 152 <1 0.6 4.5 2.8 3.0 2.9 7.2 720 442 148 <1
10/05/20 0.6 5.5 3.5 3.5 6.9 854 <1 0.5 3.7 2.7 2.7 7.2 726 <1
10/06/20 0.5 5.7 3.6 3.6 6.9 844 <1 0.7 4.1 2.9 2.9 7.2 734 <1
10/07/20 0.5 5.4 5.2 5.2 6.9 844 <1 0.6 3.8 3.7 3.8 7.2 729 <1
10/08/20 0.5 5.7 4.3 4.3 6.9 837 <1 0.5 4.2 3.5 3.5 7.2 709 <1
10/09/20 0.5 6.0 6.9 818 <1 0.5 4.4 7.0 708 <1
10/10/20 0.5 6.0 6.9 819 <1 0.5 3.9 7.0 718 <1
10/11/20 0.6 5.8 4.4 4.4 4.4 6.9 815 456 <1 0.5 4.2 4.8 4.8 4.8 7.0 723 452 <1
10/12/20 0.6 6.0 3.8 3.9 6.9 797 <1 0.5 4.2 3.3 3.4 7.0 718 <1
10/13/20 0.6 6.1 3.8 4.0 6.9 780 <1 0.5 4.4 3.6 3.6 7.0 721 <1
10/14/20 0.7 5.7 4.0 4.2 7.0 792 <1 0.5 4.2 3.9 4.1 6.9 724 <1
10/15/20 0.7 6.1 3.3 3.3 7.0 792 <1 0.5 4.2 3.9 4.0 7.0 717 <1
10/16/20 0.7 5.1 7.0 802 <1 0.6 3.9 7.2 724 <1
10/17/20 0.6 5.4 7.0 800 <1 0.6 4.6 7.3 732 <1
10/18/20 0.6 5.8 3.8 3.8 3.8 7.0 777 466 <1 0.5 4.3 3.7 3.7 3.7 7.2 726 436 <1
10/19/20 0.6 5.5 3.9 3.9 7.0 764 <1 0.5 4.0 3.7 3.7 7.3 725 <1
10/20/20 0.6 5.8 3.0 3.0 7.0 769 <1 0.5 4.4 3.6 3.6 7.2 723 <1
10/21/20 0.6 5.4 2.5 2.5 7.0 768 <1 0.5 4.2 3.6 3.7 7.3 748 <1
10/22/20 0.7 5.7 2.5 2.5 7.0 772 <1 0.6 4.4 3.9 3.9 7.1 738 <1
10/23/20 0.7 5.6 7.0 780 <1 0.5 4.5 7.0 730 <1
10/24/20 0.8 5.7 7.0 785 <1 0.5 4.6 7.0 724 <1
10/25/20 0.8 5.5 3.7 3.7 3.7 7.0 776 438 <1 0.5 4.3 3.4 3.8 3.4 7.1 724 426 <1
10/26/20 0.8 5.7 4.8 4.8 7.0 737 <1 0.6 4.4 3.0 3.0 7.2 730 <1
10/27/20 0.7 5.2 5.8 5.8 7.0 745 <1 0.6 4.2 4.1 4.1 7.3 760 <1
10/28/20 0.7 5.4 3.1 3.1 6.9 774 1 0.6 4.2 4.5 4.6 7.2 757 <1
10/29/20 0.7 5.5 2.1 2.1 6.8 801 <1 0.6 4.4 4.1 4.1 7.2 740 <1
10/30/20 0.6 5.5 6.8 792 <1 0.6 4.6 7.2 735 <1
10/31/20 0.6 5.5 6.9 755 <1 0.6 4.7 7.2 731 <1
Avg 0.6 5.6 3.7 4.1 3.7 7.0 802 455 152 <1 0.6 4.2 3.6 3.8 3.6 7.1 729 439 148 <1
Min 0.5 5.1 2.1 3.7 2.1 6.8 737 438 152 <1 0.5 3.7 2.7 3.0 2.7 6.9 708 426 148 <1
Max 0.8 6.1 5.8 4.4 5.8 7.0 883 466 152 1 0.7 4.7 4.8 4.8 4.8 7.3 760 452 148 <1
Note: Bolded characters signify an exceedance of a permit limitation
Blank cells indicate that analysis was not run for a constituent on that particular date. The data presented meets/exceeds the frequency of analysis specified under the discharge permit for these facilities. 1 Turbidity and coliform must meet water quality standards for disinfected tertiary treated recycled water, as specified in NPDES No. CA8000409, Order No. R8-2009-0021.2 Turbidity limits: 2 NTU average daily; 5 NTU no more than 5% of day; 10 NTU at any time. Coliform limits: 2.2 MPN/100mL 7-day median; 23 MPN/100mL in no more than 1 sample per month; 240 MPN/100mL at any time. 3 TDS and TIN limits are based on the 12-month running average of the combined effluent from all plants, which are presented in Table 2-2.4 Monthly average for coliform is based on "non-detect" values equal to 2. Determination of "less than" is dependent on the number of "non-detect" occurrences more than half the days in the month. 5 TOC shall not exceed 16 mg/L for more than two consecutive samples and an average of the last 4 sample results. TOC compliance can be met at a point prior to reaching the regional groundwater table, including lysimeters.6 DDW limit is 10 mg/L, TN compliance met in RW / RWQCB limit is 5 mg/L, TN compliance met at a point prior to reaching the regional groundwater table, including lysimeters, or reduction factors7 These values based on continuous monitoring data generated by the Supervisory Control and Data Acquisition (SCADA) system.
Table 2-1a Recycled Water Monitoring: RP-1 & RP-4 Effluent Water Quality for October 2020
RP-1 Effluent RP-4 Effluent
(Recycled Water Quality Specifications A.5, A.7, A.8, & A.9)
Page 1 of 3
Turbidity 1,2,7TOC NO3-N TN TIN 3 pH 7 EC 7 TDS 3 Hardness Coliform 1,2,4 Turbidity 1,2,7
TOC NO3-N TN TIN 3 pH 7 EC TDS 3 Hardness Coliform 1,2,4
Unit NTU mg/L mg/L mg/L mg/L unit µhmo/cm mg/L mg/L mpn/100mL NTU mg/L mg/L mg/L mg/L unit µhmo/cm mg/L mg/L mpn/100mL
Limits 2;5;10 16 5 10 / 5 6 6<pH<9 2.2;23;240 2;5;10 16 5 10 / 5 6 6<pH<9 2.2;23;240
11/01/20 0.6 5.2 3.4 4.0 3.4 6.9 753 444 142 <1 0.6 4.3 3.1 3.5 3.1 7.2 730 450 142 <1
11/02/20 0.7 5.2 3.3 3.5 6.9 739 <1 0.6 4.5 3.2 3.2 7.3 742 <1
11/03/20 0.7 5.3 3.0 3.0 6.9 717 1 0.6 4.6 3.2 3.2 7.3 745 <1
11/04/20 0.8 5.2 3.1 3.1 6.8 732 <1 0.6 4.7 3.9 3.9 7.3 745 <1
11/05/20 0.8 5.1 3.0 3.0 6.8 747 <1 0.6 4.7 4.0 4.0 7.2 725 <1
11/06/20 0.7 5.7 6.9 732 <1 0.6 4.9 7.3 719 <1
11/07/20 0.7 5.8 7.0 730 <1 0.7 5.0 7.5 721 <1
11/08/20 0.7 5.4 3.4 4.0 3.4 7.0 713 454 <1 0.4 4.4 3.8 4.1 3.8 7.5 726 448 <1
11/09/20 0.6 5.4 3.4 3.4 6.9 707 <1 0.5 4.7 3.6 3.6 7.5 743 <1
11/10/20 0.6 5.2 3.6 3.6 6.9 699 <1 0.5 4.6 3.7 3.7 7.5 747 <1
11/11/20 0.6 5.5 5.0 5.0 6.9 687 <1 0.5 4.8 4.0 4.1 7.5 747 <1
11/12/20 0.6 5.6 4.5 4.5 6.9 689 <1 0.5 4.8 7.3 737 <1
11/13/20 0.7 5.9 7.0 693 <1 0.4 5.0 7.2 741 <1
11/14/20 0.7 6.0 7.0 702 <1 0.4 5.2 7.2 745 <1
11/15/20 0.8 6.3 3.2 3.8 3.2 6.9 689 438 <1 0.4 5.1 3.5 3.7 3.5 7.1 738 442 <1
11/16/20 0.9 6.1 3.3 3.3 6.9 675 <1 0.4 4.9 3.1 3.1 7.1 739 <1
11/17/20 0.8 6.7 3.1 3.1 6.9 736 <1 0.4 4.8 3.3 3.3 7.1 746 <1
11/18/20 0.8 6.5 2.7 2.7 6.9 794 <1 0.4 5.0 3.7 3.7 7.1 739 <1
11/19/20 0.8 6.5 3.7 3.7 6.9 820 <1 0.5 4.8 4.2 4.2 7.1 740 <1
11/20/20 0.8 6.2 6.9 825 1 0.5 4.8 7.0 738 <1
11/21/20 0.9 6.3 6.9 825 <1 0.5 5.0 7.0 735 <1
11/22/20 0.9 6.1 3.7 4.3 3.7 6.9 815 444 <1 0.5 5.1 3.1 3.6 3.3 7.0 746 420 <1
11/23/20 0.9 6.3 4.4 4.4 6.9 802 <1 0.5 5.0 3.4 3.4 7.1 915 <1
11/24/20 0.8 6.4 4.1 4.1 6.9 791 <1 0.5 5.1 3.5 3.5 7.1 752 <1
11/25/20 0.6 6.3 6.9 767 <1 0.5 5.1 7.1 749 <1
11/26/20 0.6 6.1 7.0 790 1 0.5 5.1 7.2 750 <1
11/27/20 0.6 6.0 6.9 797 <1 0.5 5.2 7.3 759 <1
11/28/20 0.5 6.3 6.9 774 <1 0.6 5.4 7.1 769 <1
11/29/20 0.5 5.8 4.4 5.0 4.4 6.9 753 436 <1 0.6 5.0 3.4 4.3 3.4 7.0 765 450 <1
11/30/20 0.6 6.6 3.6 3.6 6.9 757 1 0.6 5.5 3.5 3.5 6.9 762 <1
Avg 0.7 5.9 3.6 4.2 3.6 6.9 748 443 142 <1 0.5 4.9 3.5 3.9 3.6 7.2 748 442 142 <1
Min 0.5 5.1 2.7 3.8 2.7 6.8 675 436 142 <1 0.4 4.3 3.1 3.5 3.1 6.9 719 420 142 <1
Max 0.9 6.7 5.0 5.0 5.0 7.0 825 454 142 1 0.7 5.5 4.2 4.3 4.2 7.5 915 450 142 <1
Note: Bolded characters signify an exceedance of a permit limitation
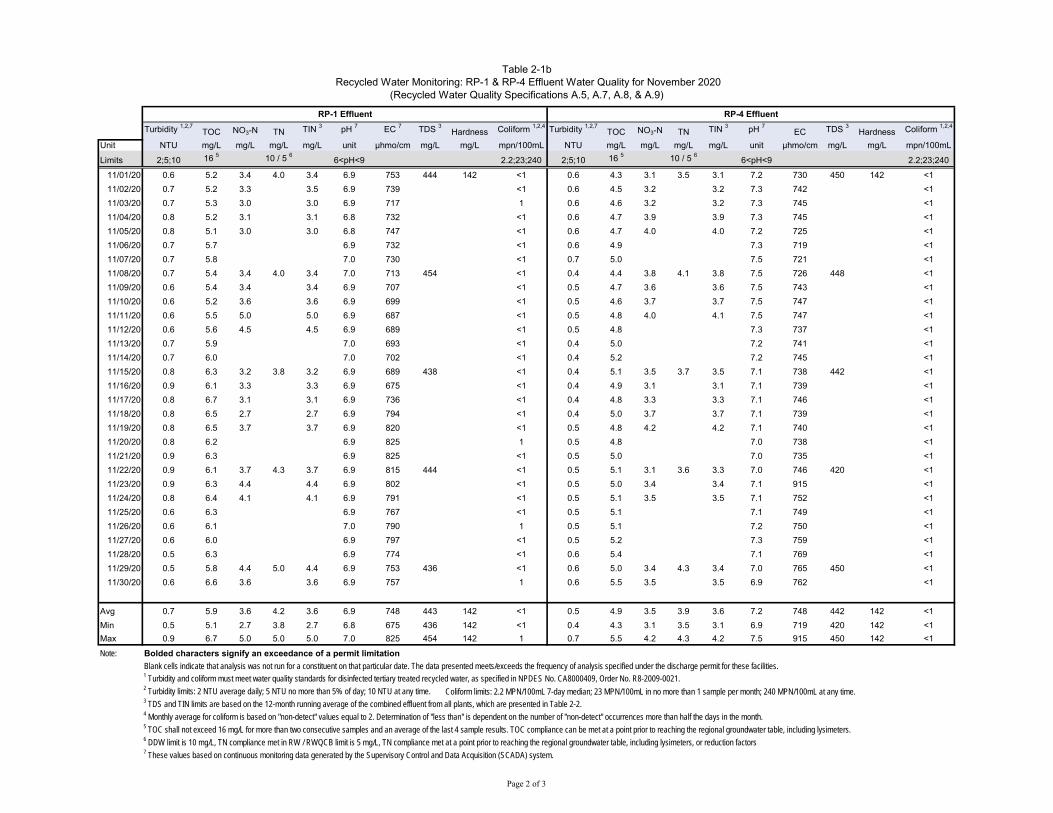
Blank cells indicate that analysis was not run for a constituent on that particular date. The data presented meets/exceeds the frequency of analysis specified under the discharge permit for these facilities. 1 Turbidity and coliform must meet water quality standards for disinfected tertiary treated recycled water, as specified in NPDES No. CA8000409, Order No. R8-2009-0021.2 Turbidity limits: 2 NTU average daily; 5 NTU no more than 5% of day; 10 NTU at any time. Coliform limits: 2.2 MPN/100mL 7-day median; 23 MPN/100mL in no more than 1 sample per month; 240 MPN/100mL at any time. 3 TDS and TIN limits are based on the 12-month running average of the combined effluent from all plants, which are presented in Table 2-2.4 Monthly average for coliform is based on "non-detect" values equal to 2. Determination of "less than" is dependent on the number of "non-detect" occurrences more than half the days in the month. 5 TOC shall not exceed 16 mg/L for more than two consecutive samples and an average of the last 4 sample results. TOC compliance can be met at a point prior to reaching the regional groundwater table, including lysimeters.6 DDW limit is 10 mg/L, TN compliance met in RW / RWQCB limit is 5 mg/L, TN compliance met at a point prior to reaching the regional groundwater table, including lysimeters, or reduction factors7 These values based on continuous monitoring data generated by the Supervisory Control and Data Acquisition (SCADA) system.
Table 2-1b Recycled Water Monitoring: RP-1 & RP-4 Effluent Water Quality for November 2020
RP-1 Effluent RP-4 Effluent
(Recycled Water Quality Specifications A.5, A.7, A.8, & A.9)
Page 2 of 3
Turbidity 1,2,7TOC NO3-N TN TIN 3 pH 7 EC 7 TDS 3 Hardness Coliform 1,2,4 Turbidity 1,2,7
TOC NO3-N TN TIN 3 pH 7 EC TDS 3 Hardness Coliform 1,2,4
Unit NTU mg/L mg/L mg/L mg/L unit µhmo/cm mg/L mg/L mpn/100mL NTU mg/L mg/L mg/L mg/L unit µhmo/cm mg/L mg/L mpn/100mL
Limits 2;5;10 16 5 10 / 5 6 6<pH<9 2.2;23;240 2;5;10 16 5 10 / 5 6 6<pH<9 2.2;23;240
12/01/20 0.6 6.8 3.2 3.2 6.8 770 <1 0.6 5.7 3.6 3.6 6.9 757 <1
12/02/20 0.7 6.8 2.9 2.9 6.8 780 1 0.5 5.7 3.9 3.9 7.0 760 <1
12/03/20 0.6 6.7 3.1 3.1 6.8 797 <1 0.6 5.7 4.4 4.4 7.1 760 1
12/04/20 0.5 6.2 6.8 784 <1 0.6 5.7 7.0 762 <1
12/05/20 0.6 6.4 6.8 780 <1 0.6 5.4 7.0 763 <1
12/06/20 0.6 7.1 3.8 3.8 3.8 6.8 779 440 152 <1 0.6 5.6 3.9 4.4 3.9 7.0 737 432 142 <1
12/07/20 0.7 6.8 3.5 3.5 6.8 764 <1 0.6 5.7 3.7 3.7 7.0 768 <1
12/08/20 0.7 6.9 3.8 3.8 6.8 781 <1 0.6 5.8 4.5 4.5 7.0 764 <1
12/09/20 0.8 6.8 3.4 3.4 6.8 789 3.1 0.6 5.2 4.7 4.7 7.0 747 <1
12/10/20 0.8 6.8 3.0 3.0 6.8 783 <1 0.6 5.2 4.9 4.9 7.0 740 <1
12/11/20 0.9 6.4 6.8 772 <1 0.5 5.1 6.9 732 <1
12/12/20 0.9 6.3 6.8 773 <1 0.5 4.9 7.0 725 <1
12/13/20 0.8 6.2 4.9 4.9 4.9 6.8 755 422 <1 0.5 5.2 5.0 5.3 5.0 7.0 722 414 <1
12/14/20 0.8 6.1 4.9 4.9 6.8 716 <1 0.5 5.2 4.6 4.6 7.0 715 <1
12/15/20 0.8 6.7 3.8 3.8 6.9 734 <1 0.4 5.4 4.8 4.8 7.0 711 <1
12/16/20 0.8 6.8 3.3 3.5 6.8 775 <1 0.4 5.4 5.6 5.7 7.0 722 <1
12/17/20 0.9 7.0 3.1 3.1 6.8 808 <1 0.5 5.7 5.2 5.4 7.1 741 <1
12/18/20 0.8 6.8 6.8 816 12 0.5 5.5 7.2 752 <1
12/19/20 0.8 6.7 6.8 816 <1 0.5 5.6 7.2 769 <1
12/20/20 0.6 6.8 3.9 3.9 3.9 6.8 802 458 <1 0.5 5.7 4.3 4.9 4.3 7.2 768 432 <1
12/21/20 0.7 7.2 4.0 4.0 6.8 794 <1 0.6 6.2 4.3 4.4 7.1 773 <1
12/22/20 0.8 7.0 3.2 6.8 739 <1 0.6 6.3 4.1 7.2 771 <1
12/23/20 0.9 7.6 3.1 6.8 659 <1 0.5 6.2 4.2 7.2 779 <1
12/24/20 0.9 7.1 6.8 668 <1 0.5 5.8 7.2 781 <1
12/25/20 0.9 6.9 6.8 650 <1 0.5 5.4 7.2 773 <1
12/26/20 0.9 6.7 6.8 641 <1 0.6 5.6 7.2 774 <1
12/27/20 0.9 7.3 4.1 4.1 4.1 6.8 660 468 <1 0.6 6.0 3.3 4.3 3.3 7.2 774 444 <1
12/28/20 0.9 7.7 3.7 3.7 6.8 649 <1 0.6 6.2 3.5 3.5 7.3 765 <1
12/29/20 0.9 7.3 3.1 3.1 6.7 609 <1 0.5 6.0 3.8 3.8 7.3 742 <1
12/30/20 0.8 7.5 2.5 2.5 2.5 6.7 663 <1 0.5 5.9 4.5 5.1 4.6 7.3 762 <1
12/31/20 0.7 7.7 6.7 712 <1 0.5 6.1 7.2 769 <1
Avg 0.8 6.8 3.5 3.8 3.6 6.8 742 447 152 <1 0.5 5.6 4.3 4.8 4.4 7.1 754 431 142 <1
Min 0.5 6.1 2.5 2.5 2.5 6.7 609 422 152 <1 0.4 4.9 3.3 4.3 3.3 6.9 711 414 142 <1
Max 0.9 7.7 4.9 4.9 4.9 6.9 816 468 152 12 0.6 6.3 5.6 5.3 5.7 7.3 781 444 142 1
Note: Bolded characters signify an exceedance of a permit limitation
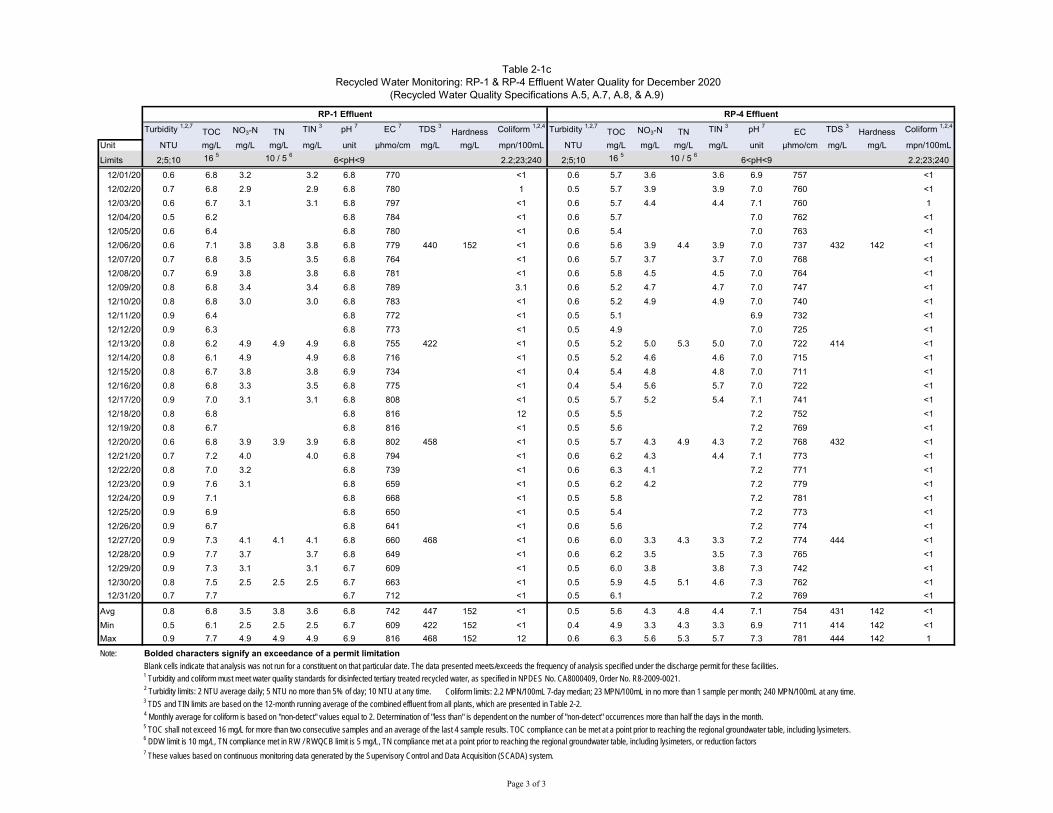
Blank cells indicate that analysis was not run for a constituent on that particular date. The data presented meets/exceeds the frequency of analysis specified under the discharge permit for these facilities. 1 Turbidity and coliform must meet water quality standards for disinfected tertiary treated recycled water, as specified in NPDES No. CA8000409, Order No. R8-2009-0021.2 Turbidity limits: 2 NTU average daily; 5 NTU no more than 5% of day; 10 NTU at any time. Coliform limits: 2.2 MPN/100mL 7-day median; 23 MPN/100mL in no more than 1 sample per month; 240 MPN/100mL at any time. 3 TDS and TIN limits are based on the 12-month running average of the combined effluent from all plants, which are presented in Table 2-2.4 Monthly average for coliform is based on "non-detect" values equal to 2. Determination of "less than" is dependent on the number of "non-detect" occurrences more than half the days in the month. 5 TOC shall not exceed 16 mg/L for more than two consecutive samples and an average of the last 4 sample results. TOC compliance can be met at a point prior to reaching the regional groundwater table, including lysimeters.6 DDW limit is 10 mg/L, TN compliance met in RW / RWQCB limit is 5 mg/L, TN compliance met at a point prior to reaching the regional groundwater table, including lysimeters, or reduction factors7 These values based on continuous monitoring data generated by the Supervisory Control and Data Acquisition (SCADA) system.
Table 2-1c Recycled Water Monitoring: RP-1 & RP-4 Effluent Water Quality for December 2020
RP-1 Effluent RP-4 Effluent
(Recycled Water Quality Specifications A.5, A.7, A.8, & A.9)
Page 3 of 3
Date Monthly 12-Mo. Run Avg. Monthly 12-Mo. Run Avg.
Jan-20 3.5 4.2 470 468
Feb-20 4.0 4.1 473 467
Mar-20 4.0 4.0 492 467
Apr-20 3.8 3.8 504 469
May-20 4.4 3.9 499 470
Jun-20 4.3 4.0 488 470
Jul-20 4.8 4.1 477 473
Aug-20 4.5 4.2 485 476
Sep-20 4.2 4.2 481 478
Oct-20 4.2 4.1 482 482
Nov-20 4.2 4.2 478 483
Dec-20 4.4 4.2 476 484
Avg 4.2 4.1 484 474
Min 3.5 3.8 470 467
Max 4.8 4.2 504 484
Limit 8.0 550
Date source: IEUA NPDES monthly self-monitoring report (MRP No. R8-2009-0021). Per the Regional Board, TDS is calculated using the flow-weighted averages based on discharged effluent flows and recycled water flows; TIN is calculated using the flow-weighted averages based on discharged effluent flows only. The data reported above will supersede any information submitted for previous quarters. Agency-wide TIN & TDS were in compliance with permit limits at all times.
Recycled Water Monitoring: Agency-Wide Flow-Weighted TIN & TDS (mg/L)Table 2-2
TDSTIN
(Recycled Water Quality Specifications A.6)
Page 1 of 1
Constituent 1Q20 2Q20 3Q20 4Q20 4Q Run. Avg.1 Limit Unit Method
Aluminum 67 208 157 127 140 1000 µg/L EPA 200.8
Antimony <1 <1 <1 <1 <1 6 µg/L EPA 200.8
Arsenic <2 <2 <2 <2 <2 10 µg/L EPA 200.8
Asbestos NR NR NR NR <2 7 MFL EPA 100.2
Barium 21 18 21 20 20 1000 µg/L EPA 200.8
Beryllium <0.5 <0.5 <0.5 <0.5 <0.5 4 µg/L EPA 200.8
Cadmium <0.25 <0.25 <0.25 <0.25 <0.25 5 µg/L EPA 200.8
Chromium 1.1 <0.5 <0.5 <0.5 <0.7 50 µg/L EPA 200.8
Chromium VI 2 0.41 0.30 0.28 0.24 0.31 10 µg/L EPA 218.6
Cyanide <20 <20 <20 <20 <20 150 µg/L OIA-1677, DW
Fluoride 0.2 0.3 0.4 0.4 0.3 2 mg/L SM 4500-F C
Mercury <0.5 <0.5 <0.5 <0.5 <0.5 2 µg/L EPA 245.1
Nickel 2 4 3 3 3 100 µg/L EPA 200.8
Perchlorate <4 NA <4 <4 <4 6 µg/L EPA 314/331.0
Selenium <2 <2 <2 <2 <2 50 µg/L EPA 200.8
Thallium <1 <1 <1 <1 <1 2 µg/L EPA 200.8
Benzene <0.5 <0.5 <0.5 <0.5 <0.5 1 µg/L EPA 524.2
Carbon Tetrachloride <0.5 <0.5 <0.5 <0.5 <0.5 0.5 µg/L EPA 524.2
1,2-Dichlorobenzene <0.5 <0.5 <0.5 <0.5 <0.5 600 µg/L EPA 524.2
1,4-Dichlorobenzene <0.5 <0.5 <0.5 <0.5 <0.5 5 µg/L EPA 524.2
1,1-Dichloroethane <0.5 <0.5 <0.5 <0.5 <0.5 5 µg/L EPA 524.2
1,2-Dichloroethane <0.5 <0.5 <0.5 <0.5 <0.5 0.5 µg/L EPA 524.2
1,1-Dichloroethylene <0.5 <0.5 <0.5 <0.5 <0.5 6 µg/L EPA 524.2
cis-1,2-Dichloroethylene <0.5 <0.5 <0.5 <0.5 <0.5 6 µg/L EPA 524.2
trans-1,2-Dichloroethylene <0.5 <0.5 <0.5 <0.5 <0.5 10 µg/L EPA 524.2
Dichloromethane <0.5 <0.5 <0.5 <0.5 <0.5 5 µg/L EPA 524.2
1,2-Dichloropropane <0.5 <0.5 <0.5 <0.5 <0.5 5 µg/L EPA 524.2
1,3-Dichloropropene <0.5 <0.5 <0.5 <0.5 <0.5 0.5 µg/L EPA 524.2
Ethylbenzene <0.5 <0.5 <0.5 <0.5 <0.5 300 µg/L EPA 524.2
Monochlorobenzene <0.5 <0.5 <0.5 <0.5 <0.5 70 µg/L EPA 524.2
Methyl-tert-butyl ether <0.5 <0.5 <0.5 <0.5 <0.5 13 µg/L EPA 524.2
Styrene <0.5 <0.5 <0.5 <0.5 <0.5 100 µg/L EPA 524.2
1,1,2,2-Tetrachloroethane <0.5 <0.5 <0.5 <0.5 <0.5 1 µg/L EPA 524.2
Tetrachloroethylene <0.5 <0.5 <0.5 <0.5 <0.5 5 µg/L EPA 524.2
Toluene <0.5 <0.5 <0.5 <0.5 <0.5 150 µg/L EPA 524.2
1,2,4-Trichlorobenzene <0.5 <0.5 <0.5 <0.5 <0.5 5 µg/L EPA 524.2
1,1,1-Trichloroethane <0.5 <0.5 <0.5 <0.5 <0.5 200 µg/L EPA 524.2
1,1,2-Trichloroethane <0.5 <0.5 <0.5 <0.5 <0.5 5 µg/L EPA 524.2
Trichloroethylene <0.5 <0.5 <0.5 <0.5 <0.5 5 µg/L EPA 524.2
Trichlorofluoromethane <0.5 <0.5 <0.5 <0.5 <0.5 150 µg/L EPA 524.2
1,1,2-Trichloro-1,2,2-Trifluoroethane <0.5 <0.5 <0.5 <0.5 <0.5 1200 µg/L EPA 524.2
Vinyl Chloride <0.5 <0.5 <0.5 <0.5 <0.5 0.5 µg/L EPA 524.2
m,p-Xylene 0.63 <0.5 <0.5 <0.5 <0.5 µg/L EPA 524.2
o-Xylene <0.5 <0.5 <0.5 <0.5 <0.5 µg/L EPA 524.2
1,2,3-Trichloropropane (added 7/17) see 1Q20 text see 2Q20 text <0.005 <0.005 <0.005 0.005 µg/L CASRL 524M-TCP
Alachlor (Alanex) <0.1 <0.1 <0.1 <0.1 <0.1 2 µg/L EPA 505
Atrazine <0.05 <0.05 <0.05 <0.05 <0.05 1 µg/L EPA 525.2
Bentazon <0.5 <0.5 <0.5 <0.5 <0.5 18 µg/L EPA 515.4
Benzo(a)pyrene <0.02 <0.02 <0.02 <0.02 <0.2 0.2 µg/L EPA 525.2
Carbofuran <0.5 <0.5 <0.5 <0.5 <0.5 18 µg/L EPA 531.2
Chlordane <0.1 <0.1 <0.1 <0.1 <0.1 0.1 µg/L EPA 505
2,4-D <0.1 <0.1 <0.1 <0.1 <0.1 70 µg/L EPA 515.4
Dalapon 6 <1 6 5 5 200 µg/L EPA 515.4
Dibromochloropropane <0.01 <0.01 <0.01 <0.01 <0.01 0.2 µg/L EPA 504.1
Di(2-ethylhexyl)adipate <0.6 <0.6 <0.6 <0.6 <0.6 400 µg/L EPA 525.2
Di(2-ethylhexyl)phthalate <0.6 <0.6 <0.6 <0.6 <0.6 4 µg/L EPA 525.2
Dinoseb <0.2 <0.2 <0.2 <0.2 <0.2 7 µg/L EPA 515.4
Diquat <0.4 <0.4 <0.4 <0.4 <0.4 20 µg/L EPA 549.2
Endothall <5 <5 <5 <5 <5 100 µg/L EPA 548.1
Endrin <0.01 <0.01 <0.01 <0.01 <0.01 2 µg/L EPA 505
Table 2-3aRecycled Water Monitoring - RW Blend (RP1/RP-4): Primary & Secondary Maximum Contaminant Levels
Inorganic Chemicals
Volatile Organic Chemicals (VOCs)
1750 3
(Recycled Water Quality Specifications A.1, A.2, A.3, A.4 & A.15)
Non-Volatile Synthetic Organic Chemicals (SOCs)
Page 1 of 2
Constituent 1Q20 2Q20 3Q20 4Q20 4Q Run. Avg.1 Limit Unit Method
Table 2-3aRecycled Water Monitoring - RW Blend (RP1/RP-4): Primary & Secondary Maximum Contaminant Levels
(Recycled Water Quality Specifications A.1, A.2, A.3, A.4 & A.15)
Ethylene Dibromide <0.01 <0.01 <0.01 <0.01 <0.01 0.05 µg/L EPA 504.1
Glyphosate <6 <6 <6 <6 <6 700 µg/L EPA 547
Heptachlor <0.01 <0.01 <0.01 <0.01 <0.01 0.01 µg/L EPA 505
Heptachlor Epoxide <0.01 <0.01 <0.01 <0.01 <0.01 0.01 µg/L EPA 505
Hexachlorobenzene <0.05 <0.05 <0.05 <0.05 <0.5 1 µg/L EPA 525.2
Hexachlorocyclopentadiene 0.10 0.05 0.06 0.06 <0.5 50 µg/L EPA 525.2
Lindane <0.01 <0.01 <0.01 <0.01 <0.01 0.2 µg/L EPA 505
Methoxychlor <0.05 <0.05 <0.05 <0.05 <0.05 30 µg/L EPA 505
Molinate <0.1 <0.1 <0.1 <0.1 <0.5 20 µg/L EPA 525.2
Oxamyl <0.5 <0.5 <0.5 <0.5 <0.5 50 µg/L EPA 531.2
Pentachlorophenol <0.04 <0.04 <0.04 <0.04 <0.04 1 µg/L EPA 515.4
Picloram <0.1 <0.1 <0.1 <0.1 <0.1 500 µg/L EPA 515.4
PCB 1016 <0.08 <0.08 <0.08 <0.08 <0.08 0.5 µg/L EPA 505
PCB 1221 <0.1 <0.1 <0.1 <0.1 <0.1 0.5 µg/L EPA 505
PCB 1232 <0.1 <0.1 <0.1 <0.1 <0.1 0.5 µg/L EPA 505
PCB 1242 <0.1 <0.1 <0.1 <0.1 <0.1 0.5 µg/L EPA 505
PCB 1248 <0.1 <0.1 <0.1 <0.1 <0.1 0.5 µg/L EPA 505
PCB 1254 <0.1 <0.1 <0.1 <0.1 <0.1 0.5 µg/L EPA 505
PCB 1260 <0.1 <0.1 <0.1 <0.1 <0.1 0.5 µg/L EPA 505
Simazine <0.05 <0.05 <0.05 <0.05 <0.05 4 µg/L EPA 525.2
Thiobencarb <0.2 <0.2 <0.2 <0.2 <0.2 70 µg/L EPA 525.2
Toxaphene <0.5 <0.5 <0.5 <0.5 <0.5 3 µg/L EPA 505
2,3,7,8-TCDD (Dioxin) <5 <5 <5 <5 <5 30 pg/L EPA 1613
2,4,5-TP (Silvex) <0.2 <0.2 <0.2 <0.2 <0.2 50 µg/L EPA 515.4
Copper 7.5 4.4 4.5 3.6 5.0 1300 µg/L EPA 200.8
Lead <0.5 <0.5 <0.5 <0.5 <0.5 15 µg/L EPA 200.8
Combined Radium-226 and Radium 228 <1 <1 <3 <3 <3 5 pCi/L EPA 903.0
Gross Alpha Particle Activity <3 <3 <3 <3 <3 15 pCi/L EPA 900.0/SM7110C
Tritium <343 <303 <352 <316 <338 20,000 pCi/L EPA 906
Strontium-90 <3 <3 <3 <3 <1.16 8 pCi/L EPA 905
Gross Beta Particle Activity 14 30 16 18 20 50 pCi/L EPA 900.0
Uranium <0.7 <0.7 <0.7 <0.7 <0.7 20 pCi/L EPA 200.8
Aluminum 67 208 157 127 140 200 µg/L EPA 200.8
Copper 7.5 4.4 4.5 3.6 5.0 1000 µg/L EPA 200.8
Corrosivity 0.3 (Non-Cor.) 0.2 (Non-Cor.) 0.4 (Non-Cor.) 0.4 (Non-Cor.) Non-Cor. Non-Cor. SI SM 2330B
Foaming Agents (MBAS) 4 0.1 <0.1 <0.1 <0.1 <0.1 0.5 mg/L S5540C/EPA 425.1
Iron 4 NR NR NR <15 50 300 µg/L EPA 200.7
Manganese 10 23 11 9 14 50 µg/L EPA 200.8
Methyl-tert-butyl ether (MTBE) <0.5 <0.5 <0.5 <0.5 <0.5 5 µg/L EPA 524.2
Odor--Threshold 8 3 2 2 4 3 TON SM 2150B
Silver <0.25 <0.25 <0.25 <0.25 <0.25 100 µg/L EPA 200.8
Thiobencarb <0.2 <0.2 <0.2 <0.2 <0.2 1 µg/L EPA 525.2
Zinc 63 35 37 29 41 5000 µg/L EPA 200.8
Oil & Grease 5 <1 <1 4 3 -- 1 mg/L EPA 1664
Bromate <1 <1 <1 <1 <1 10 µg/L EPA 300.1/317
Chlorite <0.01 <0.01 0.01 0.02 0.01 1 mg/L EPA 300.0
Alternative Compliance Point Data
RP31LYS-25RP31-LYS-25
1Q20
RP31LYS-25RP31-LYS-25
2Q20
DCZ2-LYS-25DCZ2-LYS-25
3Q20
DCZ2-LYS-25DCZ2-LYS-25
4Q20
<==TTHMs<==HAA5
Total Trihalomethanes (TTHMs) 2 102 80 <2 47 80 µg/L EPA 524.2/624
Total Haloacetic Acids (HAA5) <2 <2 <1 <2 <2 60 µg/L S6251B
NR: Not required this quarter NA: Not Analyze NA: Not analyzed
3 The sum of m,p-Xylene and o-Xylene is used to calculate compliance for the Total Xylenes limit
5 Oil & Grease compliance determination not based on 4-quarter running average
Bold signifies an exceedance of a limit in the Order. Explained in further detail in the report text.
Disinfection Byproducts
Secondary Maximum Contaminant Level Chemicals
Miscellaneous Regulated Constituents
4 4-quarter running average is calculated based on the four most recent results. Monitoring is required annually. However, if monitoring takes place more frequently than required, those results will be reported.
Action Level Chemicals
1 4-quarter running average is calculated based on ND values equal to half the detection limit. The reported 4-quarter running average value, if less than DL, will be based on highest DL found in the data set.
Radionuclides
2 As of September 11, 2017 the MCL for hexavalent chromium that was established in 2014 is no longer in effect; the State Board does plan on establishing a new MCL in the near future.
Page 2 of 2

Constituent 1Q20 2Q20 3Q20 4Q20 4Q Run. Avg.1 Limit Unit Method
Aluminum 71 120 170 104 116 1000 µg/L EPA 200.8
Antimony <1 <1 <1 <1 <1 6 µg/L EPA 200.8
Arsenic <2 <2 <2 <2 <2 10 µg/L EPA 200.8
Asbestos <0.19 NR NR NR <0.19 7 MFL EPA 100.2
Barium 20 16 18 19 18 1000 µg/L EPA 200.8
Beryllium <0.5 <0.5 <0.5 <0.5 <0.5 4 µg/L EPA 200.8
Cadmium <0.25 <0.25 <0.25 <0.25 <0.25 5 µg/L EPA 200.8
Chromium <0.5 0.6 <0.5 <0.5 <0.5 50 µg/L EPA 200.8
Chromium VI 2 0.4 0.2 0.3 0.2 0.3 10 µg/L EPA 218.6
Cyanide <20 <20 <20 <20 <20 150 µg/L OIA-1677, DW
Fluoride 0.2 0.2 0.3 0.2 0.2 2 mg/L SM 4500-F C
Mercury <0.025 <0.025 <0.025 0.037 <0.028 2 µg/L EPA 245.1
Nickel 3 4 4 5 4 100 µg/L EPA 200.8
Perchlorate <4 <4 <4 <4 <4 6 µg/L EPA 314/331.0
Selenium <2 <2 <2 <2 <2 50 µg/L EPA 200.8
Thallium <1 <1 <1 <1 <1 2 µg/L EPA 200.8
Benzene <0.5 <0.5 <0.5 <0.5 <0.5 1 µg/L EPA 524.2
Carbon Tetrachloride <0.5 <0.5 <0.5 <0.5 <0.5 0.5 µg/L EPA 524.2
1,2-Dichlorobenzene <0.5 <0.5 <0.5 <0.5 <0.5 600 µg/L EPA 524.2
1,4-Dichlorobenzene <0.5 <0.5 <0.5 <0.5 <0.5 5 µg/L EPA 524.2
1,1-Dichloroethane <0.5 <0.5 <0.5 <0.5 <0.5 5 µg/L EPA 524.2
1,2-Dichloroethane <0.5 <0.5 <0.5 <0.5 <0.5 0.5 µg/L EPA 524.2
1,1-Dichloroethylene <0.5 <0.5 <0.5 <0.5 <0.5 6 µg/L EPA 524.2
cis-1,2-Dichloroethylene <0.5 <0.5 <0.5 <0.5 <0.5 6 µg/L EPA 524.2
trans-1,2-Dichloroethylene <0.5 <0.5 <0.5 <0.5 <0.5 10 µg/L EPA 524.2
Dichloromethane <0.5 <0.5 <0.5 <0.5 <0.5 5 µg/L EPA 524.2
1,2-Dichloropropane <0.5 <0.5 <0.5 <0.5 <0.5 5 µg/L EPA 524.2
1,3-Dichloropropene <0.5 <0.5 <0.5 <0.5 <0.5 0.5 µg/L EPA 524.2
Ethylbenzene <0.5 <0.5 <0.5 <0.5 <0.5 300 µg/L EPA 524.2
Monochlorobenzene <0.5 <0.5 <0.5 <0.5 <0.5 70 µg/L EPA 524.2
Methyl-tert-butyl ether <0.5 <0.5 <0.5 <0.5 <0.5 13 µg/L EPA 524.2
Styrene <0.5 <0.5 <0.5 <0.5 <0.5 100 µg/L EPA 524.2
1,1,2,2-Tetrachloroethane <0.5 <0.5 <0.5 <0.5 <0.5 1 µg/L EPA 524.2
Tetrachloroethylene <0.5 <0.5 <0.5 <0.5 <0.5 5 µg/L EPA 524.2
Toluene 0.6 <0.5 <0.5 <0.5 <0.5 150 µg/L EPA 524.2
1,2,4-Trichlorobenzene <0.5 <0.5 <0.5 <0.5 <0.5 5 µg/L EPA 524.2
1,1,1-Trichloroethane <0.5 <0.5 <0.5 <0.5 <0.5 200 µg/L EPA 524.2
1,1,2-Trichloroethane <0.5 <0.5 <0.5 <0.5 <0.5 5 µg/L EPA 524.2
Trichloroethylene <0.5 <0.5 <0.5 <0.5 <0.5 5 µg/L EPA 524.2
Trichlorofluoromethane <0.5 <0.5 <0.5 <0.5 <0.5 150 µg/L EPA 524.2
1,1,2-Trichloro-1,2,2-Trifluoroethane <0.5 <0.5 <0.5 <0.5 <0.5 1200 µg/L EPA 524.2
Vinyl Chloride <0.5 <0.5 <0.5 <0.5 <0.5 0.5 µg/L EPA 524.2
m,p-Xylene <0.5 <0.5 <0.5 <0.5 <0.5 µg/L EPA 524.2
o-Xylene <0.5 <0.5 <0.5 <0.5 <0.5 µg/L EPA 524.2
1,2,3-Trichloropropane (added 7/17) see 1Q20 text see 2Q20 text <0.005 <0.005 <0.005 0.005 µg/L CASRL 524M-TCP
Alachlor (Alanex) <0.1 <0.1 <0.1 <0.1 <0.1 2 µg/L EPA 505
Atrazine <0.05 <0.05 <0.05 <0.05 <0.05 1 µg/L EPA 525.2
Bentazon <0.5 <0.5 <0.5 <0.5 <0.5 18 µg/L EPA 515.4
Benzo(a)pyrene <0.02 <0.02 <0.02 <0.02 <0.02 0.2 µg/L EPA 525.2
Carbofuran <0.5 <0.5 <0.5 <0.5 <0.5 18 µg/L EPA 531.2
Chlordane <0.1 <0.1 <0.1 <0.1 <0.1 0.1 µg/L EPA 505
2,4-D <0.1 <0.1 <0.1 <0.1 <0.1 70 µg/L EPA 515.4
Dalapon 4 <1 3 3 3 200 µg/L EPA 515.4
Dibromochloropropane <0.01 <0.01 <0.01 <0.01 <0.01 0.2 µg/L EPA 504.1
Di(2-ethylhexyl)adipate <0.6 <0.6 <0.6 <0.6 <0.6 400 µg/L EPA 525.2
Di(2-ethylhexyl)phthalate <0.6 <0.6 <0.6 <0.6 <0.6 4 µg/L EPA 525.2
Dinoseb <0.2 <0.2 <0.2 <0.2 <0.2 7 µg/L EPA 515.4
Diquat <0.4 <0.4 <0.4 <0.4 <0.4 20 µg/L EPA 549.2
Endothall <5 <5 <5 <5 <5 100 µg/L EPA 548.1
Endrin <0.01 <0.01 <0.01 <0.01 <0.01 2 µg/L EPA 505
1750 3
Table 2-3bRecycled Water Monitoring - RP-1 (001B Effluent): Primary & Secondary Maximum Contaminant Levels
(Recycled Water Quality Specifications A.1, A.2, A.3, A.4 & A.15)
Inorganic Chemicals
Volatile Organic Chemicals (VOCs)
Non-Volatile Synthetic Organic Chemicals (SOCs)
Page 1 of 2
Constituent 1Q20 2Q20 3Q20 4Q20 4Q Run. Avg.1 Limit Unit Method
Table 2-3bRecycled Water Monitoring - RP-1 (001B Effluent): Primary & Secondary Maximum Contaminant Levels
(Recycled Water Quality Specifications A.1, A.2, A.3, A.4 & A.15)
Ethylene Dibromide <0.01 <0.01 <0.01 <0.01 <0.01 0.05 µg/L EPA 504.1
Glyphosate <6 <6 <6 <6 <6 700 µg/L EPA 547
Heptachlor <0.01 <0.01 <0.01 <0.01 <0.01 0.01 µg/L EPA 505
Heptachlor Epoxide <0.01 <0.01 <0.01 <0.01 <0.01 0.01 µg/L EPA 505
Hexachlorobenzene <0.05 <0.05 <0.05 <0.05 <0.1 1 µg/L EPA 525.2
Hexachlorocyclopentadiene 0.08 <0.05 <0.05 <0.05 <0.1 50 µg/L EPA 525.2
Lindane <0.01 <0.01 <0.01 <0.01 <0.01 0.2 µg/L EPA 505
Methoxychlor <0.05 <0.05 <0.05 <0.05 <0.05 30 µg/L EPA 505
Molinate <0.1 <0.1 <0.1 <0.1 <0.1 20 µg/L EPA 525.2
Oxamyl <0.5 <0.5 <0.5 <0.5 <0.5 50 µg/L EPA 531.2
Pentachlorophenol <0.04 <0.04 <0.04 <0.04 <0.04 1 µg/L EPA 515.4
Picloram <0.1 <0.1 <0.1 <0.1 <0.1 500 µg/L EPA 515.4
PCB 1016 <0.08 <0.08 <0.08 <0.08 <0.08 0.5 µg/L EPA 505
PCB 1221 <0.1 <0.1 <0.1 <0.1 <0.1 0.5 µg/L EPA 505
PCB 1232 <0.1 <0.1 <0.1 <0.1 <0.1 0.5 µg/L EPA 505
PCB 1242 <0.1 <0.1 <0.1 <0.1 <0.1 0.5 µg/L EPA 505
PCB 1248 <0.1 <0.1 <0.1 <0.1 <0.1 0.5 µg/L EPA 505
PCB 1254 <0.1 <0.1 <0.1 <0.1 <0.1 0.5 µg/L EPA 505
PCB 1260 <0.1 <0.1 <0.1 <0.1 <0.1 0.5 µg/L EPA 505
Simazine <0.05 <0.05 <0.05 <0.05 <0.05 4 µg/L EPA 525.2
Thiobencarb <0.2 <0.2 <0.2 <0.2 <0.2 70 µg/L EPA 525.2
Toxaphene <0.5 <0.5 <0.5 <0.5 <0.5 3 µg/L EPA 505
2,3,7,8-TCDD (Dioxin) <5 <5 <5 <5 <5 30 pg/L EPA 1613
2,4,5-TP (Silvex) <0.2 <0.2 <0.2 <0.2 <0.2 50 µg/L EPA 515.4
Copper 4.2 4.3 3.8 2.9 3.8 1300 µg/L EPA 200.8
Lead <0.5 <0.5 <0.5 <0.5 <0.5 15 µg/L EPA 200.8
Combined Radium-226 and Radium 228 <1 <1 <3 <3 <3 5 pCi/L EPA 903.0
Gross Alpha Particle Activity <3 <3 <3 <3 <3 15 pCi/L EPA 900.0/SM7110C
Tritium <319 <302 <347 <304 <323 20,000 pCi/L EPA 906
Strontium-90 <3 <3 <3 <3 <1.68 8 pCi/L EPA 905
Gross Beta Particle Activity 16 28 14 13 18 50 pCi/L EPA 900.0
Uranium <0.7 <0.7 <0.7 <0.7 <0.7 20 pCi/L EPA 200.8
Aluminum 71 120 170 104 116 200 µg/L EPA 200.8
Copper 4.2 4.3 3.8 2.9 3.8 1000 µg/L EPA 200.8
Corrosivity -0.3 (Non-Cor.) 0.0 (Non-Cor.) 0.2 (Non-Cor.) -0.9 (Non-Cor.) Non-Cor. Non-Cor. SI SM 2330B
Foaming Agents (MBAS) 4 <0.1 <0.1 <0.1 <0.1 <0.1 0.5 mg/L S5540C/EPA 425.1
Iron 4 <150 <150 <150 <150 47 300 µg/L EPA 200.7
Manganese 5 11 8 9 8 50 µg/L EPA 200.8
Methyl-tert-butyl ether (MTBE) <0.5 <0.5 <0.5 <0.5 <0.5 5 µg/L EPA 524.2
Odor--Threshold 8 2 <1 2 3 3 TON SM 2150B
Silver <0.25 <0.25 <0.25 <0.25 <0.25 100 µg/L EPA 200.8
Thiobencarb <0.2 <0.2 <0.2 <0.2 <0.2 1 µg/L EPA 525.2
Zinc 52 37 28 23 35 5000 µg/L EPA 200.8
Oil & Grease 5 <1 <1 <1 1 -- 1 mg/L EPA 1664
Bromate <1 <1 <1 <1 <1 10 µg/L EPA 300.1/317
Chlorite <0.01 <0.01 <0.01 <0.01 <0.01 1 mg/L EPA 300.0
NR: Not required this quarter NA: Not Analyze NA: Not analyzed
3 The sum of m,p-Xylene and o-Xylene is used to calculate compliance for the Total Xylenes limit
5 Oil & Grease compliance determination not based on 4-quarter running average
Bold signifies an exceedance of a limit in the Order. Explained in further detail in the report text.
1 4-quarter running average is calculated based on ND values equal to half the detection limit. The reported 4-quarter running average value, if less than DL, will be based on highest DL found in the data set. 2 As of September 11, 2017 the MCL for hexavalent chromium that was established in 2014 is no longer in effect; the State Board does plan on establishing a new MCL in the near future.
4 4-quarter running average is calculated based on the four most recent results. Monitoring is required annually. However, if monitoring takes place more frequently than required, those results will be reported.
Action Level Chemicals
Radionuclides
Secondary Maximum Contaminant Level Chemicals
Miscellaneous Regulated Constituents
Disinfection Byproducts
Page 2 of 2
Constituent 4Q20 Unit Method Constituent 4Q20 Unit Method
Acrolein <2 µg/L EPA 624 N-Nitrosodiphenylamine NR µg/L EPA 625Acrylonitrile 0.26 µg/L EPA 624 Phenanthrene NR µg/L EPA 625Bromoform <0.5 µg/L EPA 524.2/624 Pyrene NR µg/L EPA 625Chlorodibromomethane 3.5 µg/L EPA 524.2/624
Chloroethane <0.5 µg/L EPA 524.2/624 Aldrin NR µg/L EPA 505/525/6082-Chloroethylvinylether NR µg/L EPA 524.2/624 BHC, alpha isomer NR µg/L EPA 525/608Chloroform 90 µg/L EPA 524.2/624 BHC, beta isomer NR µg/L EPA 525/608Dichlorobromomethane 25 µg/L EPA 524.2/624 BHC, delta isomer NR µg/L EPA 525/608Methyl Bromide <0.5 µg/L EPA 524.2/624 4,4'-DDT NR µg/L EPA 525/608Methyl Chloride <0.5 µg/L EPA 524.2/624 4,4'-DDE NR µg/L EPA 525/608
4,4'-DDD NR µg/L EPA 525/608
2-Chlorophenol NR µg/L EPA 625 Dieldrin NR µg/L EPA 505/525/6082,4-Dichlorophenol NR µg/L EPA 625 Endosulfan I NR µg/L EPA 525/6082,4-Dimethylphenol NR µg/L EPA 625 Endosulfan II NR µg/L EPA 525/6082-Methyl-4,6-dinitrophenol NR µg/L EPA 625 Endosulfan Sulfate NR µg/L EPA 525/6082,4-Dinitrophenol NR µg/L EPA 625 NL2-Nitrophenol NR µg/L EPA 625 Boron 0.3 mg/L EPA 200.7 14-Nitrophenol NR µg/L EPA 625 n-butylbenzene <0.5 µg/L EPA 524.2 2604-Chloro-3-methylphenol NR µg/L EPA 625 sec-butylbenzene <0.5 µg/L EPA 524.2 260Phenol NR µg/L EPA 625 tert-butylbenzene <0.5 µg/L EPA 524.2 2602,4,6-Trichlorophenol NR µg/L EPA 625 Carbon disulfide <0.5 µg/L EPA 524.2 160
Chlorate* (RW Blend 4Q20) 459 µg/L EPA 300.0 800
Acenaphthene NR µg/L EPA 625 2-Chlorotoluene <0.5 µg/L EPA 524.2 140Acenaphthylene NR µg/L EPA 625 4-Chlorotoluene <0.5 µg/L EPA 524.2 140Anthracene NR µg/L EPA 625 Diazinon <0.1 µg/L EPA 525.2 1.2Benzidine NR µg/L EPA 625 Dichlorodifluoromethane (Freon 12) <0.5 µg/L EPA 524.2 1000Benzo(a)anthracene NR µg/L EPA 625 1,4 - Dioxane <1 µg/L EPA 522 1Benzo(b)fluoranthene NR µg/L EPA 625 Ethylene glycol <5 mg/L EPA 8015B 14Benzo(g,h,i)perylene NR µg/L EPA 625 Formaldehyde 29 µg/L EPA 556 100Benzo(k)fluoranthene NR µg/L EPA 625 HMX <0.2 µg/L EPA 8330B 350Bis(2-chloroethoxy)methane NR µg/L EPA 625 Isopropylbenzene <0.5 µg/L EPA 524.2 770Bis(2-chloroethyl)ether NR µg/L EPA 625 Manganese 9 µg/L EPA 200.8 500Bis(2-chloroisopropyl)ether NR µg/L EPA 625 Methyl isobutyl ketone (MIBK) <2 µg/L EPA 524.2 1204-Bromophenyl phenyl ether NR µg/L EPA 625 Naphthalene <0.5 µg/L EPA 525.2/524.2 17Butyl benzyl phthalate NR µg/L EPA 625 N-Nitrosodiethylamine (NDEA) <2 ng/L EPA 521 102-Chloronaphthalene NR µg/L EPA 625 N-Nitrosodimethylamine (NDMA) 2.4 ng/L EPA 521 104-Chlorophenyl phenyl ether NR µg/L EPA 625 N-Nitrosodi-n-propylamine (NDPA) <2 ng/L EPA 521 10Chrysene NR µg/L EPA 625 Perfluorooctanesulfonic acid (PFOS) <2.0 ng/L EPA 537.1 6.5Dibenzo(a,h)anthracene NR µg/L EPA 625 Perfluorooctanoic acid (PFOA) see report text ng/L EPA 537.1 5.11,3-Dichlorobenzene NR µg/L EPA 625 Propachlor <0.05 µg/L EPA 525.2 903,3-Dichlorobenzidine NR µg/L EPA 625 N-propylbenzene <0.5 µg/L EPA 524.2 200Diethyl phthalate NR µg/L EPA 625 RDX <0.2 µg/L EPA 8330B 0.3Dimethyl phthalate NR µg/L EPA 625 Tertiary butyl alcohol <2 µg/L EPA 524.2 12Di-n-butyl phthalate NR µg/L EPA 625 1,2,4–trimethylbenzene <0.5 µg/L EPA 524.2 3302,4-Dinitrotoluene NR µg/L EPA 625 1,3,5-trimethylbenzene <0.5 µg/L EPA 524.2 3302,6-Dinitrotoluene NR µg/L EPA 625 2,4,6-Trinitrotoluene <0.1 µg/L EPA 8330B 1Di-n-octyl phthalate NR µg/L EPA 625 Vanadium <5 µg/L EPA 200.8 50Azobenzene NR µg/L EPA 625Fluoranthene NR µg/L EPA 625 1,4 - Dioxane <1 µg/L EPA 522Fluorene NR µg/L EPA 625 N-nitrosodimethylamine (NDMA) 2.4 ng/L EPA 521Hexachlorobutadiene NR µg/L EPA 625 N-Nitrosomorphline 11 ng/L EPA 521Hexachlorocyclopentadiene NR µg/L EPA 625 Perfluorooctanesulfonic acid (PFOS) <2.0 ng/L EPA 537.1Hexachloroethane NR µg/L EPA 625 Perfluorooctanoic acid (PFOA) see report text ng/L EPA 537.1Indeno(1,2,3-cd)pyrene NR µg/L EPA 625 Gemfibrozil <5 ng/L LC-MS-MSIsophorone NR µg/L EPA 625 Iohexol 7200 ng/L LC-MS-MSNaphthalene NR µg/L EPA 625 Sucralose 60000 ng/L LC-MS-MSNitrobenzene NR µg/L EPA 625 Sulfamethoxazole <5 ng/L LC-MS-MSN-Nitroso-di-n-propylamine NR µg/L EPA 625
NA: Not analyzed
**PFOA is being analyzed weekly for the exceedance of the NL and is reported in Section 2A of this report
Table 2-4a
(Monitoring & Reporting Program)
Base/Neutral ExtractiblesVolatile Organic Chemicals (VOCs)
Acid Extractibles
*Pursuant to the GRRP regulations, recharge water may be monitored in lieu of recycled water.
Health-based and performance indicator CECs for Surface Application
Chemicals w/ State Notification Levels (NLs)
Base/Neutral Extractibles
Recycled Water Monitoring - RW Blend (RP1/RP-4): Remaining Priority Pollutants, EDCs & Pharmaceuticals, and Unregulated Chemicals
Pesticides
NR: Not Required (Annual Requirement,Phase II FOF, Attachement A, Page 26, Item 19)
Page 1 of 1
Constituent 4Q20 Unit Method Constituent 4Q20 Unit Method
Acrolein <2 µg/L EPA 624 N-Nitrosodiphenylamine <1 µg/L EPA 625Acrylonitrile 0.35 µg/L EPA 624 Phenanthrene <1 µg/L EPA 625Bromoform <0.5 µg/L EPA 524.2/624 Pyrene <1 µg/L EPA 625Chlorodibromomethane 2.6 µg/L EPA 524.2/624
Chloroethane <0.5 µg/L EPA 524.2/624 Aldrin <0.05 µg/L EPA 505/6082-Chloroethylvinylether <1 µg/L EPA 524.2/624 BHC, alpha isomer <0.1 µg/L EPA 525/608Chloroform 54 µg/L EPA 524.2/624 BHC, beta isomer <0.1 µg/L EPA 525/608Dichlorobromomethane 17 µg/L EPA 524.2/624 BHC, delta isomer <0.1 µg/L EPA 525/608Methyl Bromide <0.5 µg/L EPA 524.2/624 4,4'-DDT <0.1 µg/L EPA 525/608Methyl Chloride <0.5 µg/L EPA 524.2/624 4,4'-DDE <0.1 µg/L EPA 525/608
4,4'-DDD <0.1 µg/L EPA 525/608
2-Chlorophenol <1 µg/L EPA 625 Dieldrin <0.01 µg/L EPA 505/6082,4-Dichlorophenol <2 µg/L EPA 625 Endosulfan I <0.1 µg/L EPA 525/6082,4-Dimethylphenol <1 µg/L EPA 625 Endosulfan II <0.1 µg/L EPA 525/6082-Methyl-4,6-dinitrophenol <2 µg/L EPA 625 Endosulfan Sulfate <0.1 µg/L EPA 525/6082,4-Dinitrophenol <3 µg/L EPA 625 NL2-Nitrophenol <1 µg/L EPA 625 Boron 0.3 mg/L EPA 200.7 14-Nitrophenol <3 µg/L EPA 625 n-butylbenzene <0.5 µg/L EPA 524.2 2604-Chloro-3-methylphenol <1 µg/L EPA 625 sec-butylbenzene <0.5 µg/L EPA 524.2 260Phenol <1 µg/L EPA 625 tert-butylbenzene <0.5 µg/L EPA 524.2 2602,4,6-Trichlorophenol <1 µg/L EPA 625 Carbon disulfide <0.5 µg/L EPA 524.2 160
Chlorate* (001B Eff 4Q20) 459 µg/L EPA 300.0 800
Acenaphthene <1 µg/L EPA 625 2-Chlorotoluene <0.5 µg/L EPA 524.2 140Acenaphthylene <1 µg/L EPA 625 4-Chlorotoluene <0.5 µg/L EPA 524.2 140Anthracene <1 µg/L EPA 625 Diazinon <0.1 µg/L EPA 525.2 1.2Benzidine <5 µg/L EPA 625 Dichlorodifluoromethane (Freon 12) <0.5 µg/L EPA 524.2 1000Benzo(a)anthracene <5 µg/L EPA 625 1,4 - Dioxane <1 µg/L EPA 522 1Benzo(b)fluoranthene <1 µg/L EPA 625 Ethylene glycol <5 mg/L EPA 8015B 14Benzo(g,h,i)perylene <2 µg/L EPA 625 Formaldehyde 26 µg/L EPA 556 100Benzo(k)fluoranthene <1 µg/L EPA 625 HMX <0.2 µg/L EPA 8330B 350Bis(2-chloroethoxy)methane <2 µg/L EPA 625 Isopropylbenzene <0.5 µg/L EPA 524.2 770Bis(2-chloroethyl)ether <1 µg/L EPA 625 Manganese 9 µg/L EPA 200.8 500Bis(2-chloroisopropyl)ether <1 µg/L EPA 625 Methyl isobutyl ketone (MIBK) <2 µg/L EPA 524.2 1204-Bromophenyl phenyl ether <1 µg/L EPA 625 Naphthalene <0.5 µg/L EPA 524.2 17Butyl benzyl phthalate <1 µg/L EPA 625 N-Nitrosodiethylamine (NDEA) <2 ng/L EPA 521 102-Chloronaphthalene <1 µg/L EPA 625 N-Nitrosodimethylamine (NDMA) 2.9 ng/L EPA 521 104-Chlorophenyl phenyl ether <1 µg/L EPA 625 N-Nitrosodi-n-propylamine (NDPA) <2 ng/L EPA 521 10Chrysene <1 µg/L EPA 625 Perfluorooctanesulfonic acid (PFOS) <2.0 ng/L EPA 537.1 6.5Dibenzo(a,h)anthracene <1 µg/L EPA 625 Perfluorooctanoic acid (PFOA) see report text ng/L EPA 537.1 5.11,3-Dichlorobenzene <1 µg/L EPA 625 Propachlor <0.05 µg/L EPA 525.2 903,3-Dichlorobenzidine <5 µg/L EPA 625 N-propylbenzene <0.5 µg/L EPA 524.2 200Diethyl phthalate <2 µg/L EPA 625 RDX <0.2 µg/L EPA 8330B 0.3Dimethyl phthalate <1 µg/L EPA 625 Tertiary butyl alcohol <2 µg/L EPA 524.2 12Di-n-butyl phthalate <1 µg/L EPA 625 1,2,4–trimethylbenzene <0.5 µg/L EPA 524.2 3302,4-Dinitrotoluene <1 µg/L EPA 625 1,3,5-trimethylbenzene <0.5 µg/L EPA 524.2 3302,6-Dinitrotoluene <2 µg/L EPA 625 2,4,6-Trinitrotoluene <0.1 µg/L EPA 8330B 1Di-n-octyl phthalate <1 µg/L EPA 625 Vanadium <3 µg/L EPA 200.8 50Azobenzene <1 µg/L EPA 625Fluoranthene <1 µg/L EPA 625 1,4 - Dioxane <1 µg/L EPA 522Fluorene <1 µg/L EPA 625 N-nitrosodimethylamine (NDMA) 2.9 ng/L EPA 521Hexachlorobutadiene <1 µg/L EPA 625 N-Nitrosomorphline 15 ng/L EPA 521Hexachlorocyclopentadiene <5 µg/L EPA 625 Perfluorooctanesulfonic acid (PFOS) <2.0 ng/L EPA 537.1Hexachloroethane <1 µg/L EPA 625 Perfluorooctanoic acid (PFOA) see report text ng/L EPA 537.1Indeno(1,2,3-cd)pyrene <2 µg/L EPA 625 Gemfibrozil <5 ng/L LC-MS-MSIsophorone <1 µg/L EPA 625 Iohexol 10000 ng/L LC-MS-MSNaphthalene <1 µg/L EPA 625 Sucralose 60000 ng/L LC-MS-MSNitrobenzene <1 µg/L EPA 625 Sulfamethoxazole 5 ng/L LC-MS-MSN-Nitroso-di-n-propylamine <1 µg/L EPA 625
NA: Not analyzed
**PFOA is being analyzed weekly for the exceedance of the NL and is reported in Section 2A of this report
Chemicals w/ State Notification Levels (NLs)
Base/Neutral Extractibles
Health-based and performance indicator CECs for Surface Application
*Pursuant to the GRRP regulations, recharge water may be monitored in lieu of recycled water.
Table 2-4bRecycled Water Monitoring - RP-1 (001B Effluent): Remaining Priority Pollutants, EDCs & Pharmaceuticals, and Unregulated Chemicals
(Monitoring & Reporting Program)
Volatile Organic Chemicals (VOCs) Base/Neutral Extractibles
Acid Extractibles
Pesticides
NR: Not Required (Annual Requirement,Phase II FOF, Attachement A, Page 26, Item 19)
Page 1 of 1
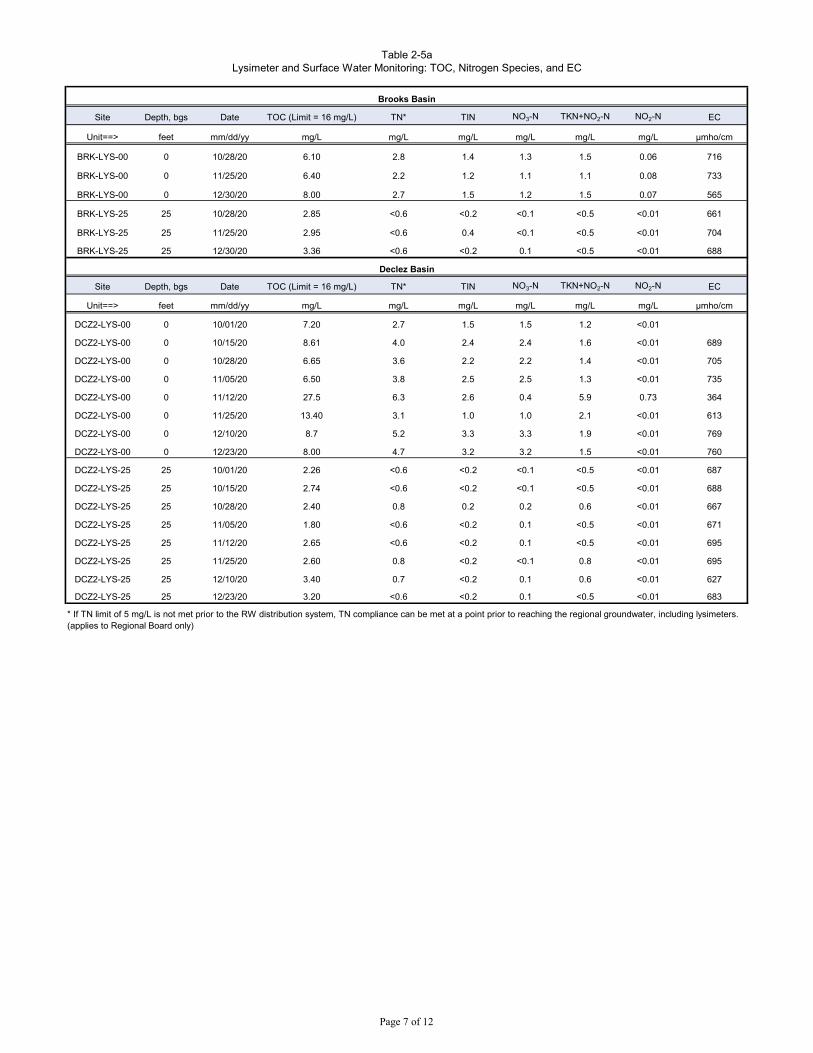
Site Depth, bgs Date TOC (Limit = 16 mg/L) TN* TIN NO3-N TKN+NO2-N NO2-N EC
Unit==> feet mm/dd/yy mg/L mg/L mg/L mg/L mg/L mg/L µmho/cm
BRK-LYS-00 0 10/28/20 6.10 2.8 1.4 1.3 1.5 0.06 716
BRK-LYS-00 0 11/25/20 6.40 2.2 1.2 1.1 1.1 0.08 733
BRK-LYS-00 0 12/30/20 8.00 2.7 1.5 1.2 1.5 0.07 565
BRK-LYS-25 25 10/28/20 2.85 <0.6 <0.2 <0.1 <0.5 <0.01 661
BRK-LYS-25 25 11/25/20 2.95 <0.6 0.4 <0.1 <0.5 <0.01 704
BRK-LYS-25 25 12/30/20 3.36 <0.6 <0.2 0.1 <0.5 <0.01 688
Site Depth, bgs Date TOC (Limit = 16 mg/L) TN* TIN NO3-N TKN+NO2-N NO2-N EC
Unit==> feet mm/dd/yy mg/L mg/L mg/L mg/L mg/L mg/L µmho/cm
DCZ2-LYS-00 0 10/01/20 7.20 2.7 1.5 1.5 1.2 <0.01
DCZ2-LYS-00 0 10/15/20 8.61 4.0 2.4 2.4 1.6 <0.01 689
DCZ2-LYS-00 0 10/28/20 6.65 3.6 2.2 2.2 1.4 <0.01 705
DCZ2-LYS-00 0 11/05/20 6.50 3.8 2.5 2.5 1.3 <0.01 735
DCZ2-LYS-00 0 11/12/20 27.5 6.3 2.6 0.4 5.9 0.73 364
DCZ2-LYS-00 0 11/25/20 13.40 3.1 1.0 1.0 2.1 <0.01 613
DCZ2-LYS-00 0 12/10/20 8.7 5.2 3.3 3.3 1.9 <0.01 769
DCZ2-LYS-00 0 12/23/20 8.00 4.7 3.2 3.2 1.5 <0.01 760
DCZ2-LYS-25 25 10/01/20 2.26 <0.6 <0.2 <0.1 <0.5 <0.01 687
DCZ2-LYS-25 25 10/15/20 2.74 <0.6 <0.2 <0.1 <0.5 <0.01 688
DCZ2-LYS-25 25 10/28/20 2.40 0.8 0.2 0.2 0.6 <0.01 667
DCZ2-LYS-25 25 11/05/20 1.80 <0.6 <0.2 0.1 <0.5 <0.01 671
DCZ2-LYS-25 25 11/12/20 2.65 <0.6 <0.2 0.1 <0.5 <0.01 695
DCZ2-LYS-25 25 11/25/20 2.60 0.8 <0.2 <0.1 0.8 <0.01 695
DCZ2-LYS-25 25 12/10/20 3.40 0.7 <0.2 0.1 0.6 <0.01 627
DCZ2-LYS-25 25 12/23/20 3.20 <0.6 <0.2 0.1 <0.5 <0.01 683
Table 2-5aLysimeter and Surface Water Monitoring: TOC, Nitrogen Species, and EC
Declez Basin
* If TN limit of 5 mg/L is not met prior to the RW distribution system, TN compliance can be met at a point prior to reaching the regional groundwater, including lysimeters. (applies to Regional Board only)
Brooks Basin
Page 7 of 12
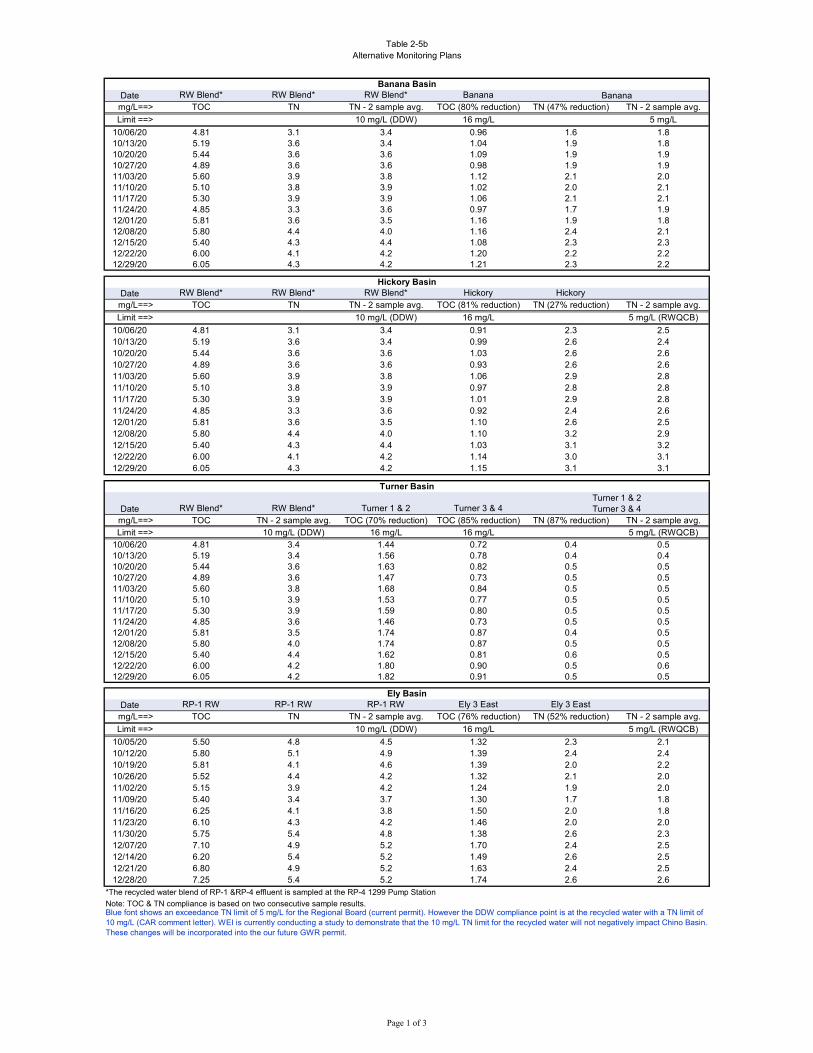
Date RW Blend* RW Blend* RW Blend* Bananamg/L==> TOC TN TN - 2 sample avg. TOC (80% reduction) TN (47% reduction) TN - 2 sample avg.
Limit ==> 10 mg/L (DDW) 16 mg/L 5 mg/L
10/06/20 4.81 3.1 3.4 0.96 1.6 1.810/13/20 5.19 3.6 3.4 1.04 1.9 1.810/20/20 5.44 3.6 3.6 1.09 1.9 1.910/27/20 4.89 3.6 3.6 0.98 1.9 1.911/03/20 5.60 3.9 3.8 1.12 2.1 2.011/10/20 5.10 3.8 3.9 1.02 2.0 2.111/17/20 5.30 3.9 3.9 1.06 2.1 2.111/24/20 4.85 3.3 3.6 0.97 1.7 1.912/01/20 5.81 3.6 3.5 1.16 1.9 1.812/08/20 5.80 4.4 4.0 1.16 2.4 2.112/15/20 5.40 4.3 4.4 1.08 2.3 2.312/22/20 6.00 4.1 4.2 1.20 2.2 2.212/29/20 6.05 4.3 4.2 1.21 2.3 2.2
Date RW Blend* RW Blend* RW Blend* Hickory Hickorymg/L==> TOC TN TN - 2 sample avg. TOC (81% reduction) TN (27% reduction) TN - 2 sample avg.
Limit ==> 10 mg/L (DDW) 16 mg/L 5 mg/L (RWQCB)
10/06/20 4.81 3.1 3.4 0.91 2.3 2.510/13/20 5.19 3.6 3.4 0.99 2.6 2.410/20/20 5.44 3.6 3.6 1.03 2.6 2.610/27/20 4.89 3.6 3.6 0.93 2.6 2.611/03/20 5.60 3.9 3.8 1.06 2.9 2.811/10/20 5.10 3.8 3.9 0.97 2.8 2.811/17/20 5.30 3.9 3.9 1.01 2.9 2.811/24/20 4.85 3.3 3.6 0.92 2.4 2.612/01/20 5.81 3.6 3.5 1.10 2.6 2.512/08/20 5.80 4.4 4.0 1.10 3.2 2.912/15/20 5.40 4.3 4.4 1.03 3.1 3.212/22/20 6.00 4.1 4.2 1.14 3.0 3.112/29/20 6.05 4.3 4.2 1.15 3.1 3.1
Date RW Blend* RW Blend* Turner 1 & 2 Turner 3 & 4mg/L==> TOC TN - 2 sample avg. TOC (70% reduction) TOC (85% reduction) TN (87% reduction) TN - 2 sample avg.Limit ==> 10 mg/L (DDW) 16 mg/L 16 mg/L 5 mg/L (RWQCB)
10/06/20 4.81 3.4 1.44 0.72 0.4 0.510/13/20 5.19 3.4 1.56 0.78 0.4 0.410/20/20 5.44 3.6 1.63 0.82 0.5 0.510/27/20 4.89 3.6 1.47 0.73 0.5 0.511/03/20 5.60 3.8 1.68 0.84 0.5 0.511/10/20 5.10 3.9 1.53 0.77 0.5 0.511/17/20 5.30 3.9 1.59 0.80 0.5 0.511/24/20 4.85 3.6 1.46 0.73 0.5 0.512/01/20 5.81 3.5 1.74 0.87 0.4 0.512/08/20 5.80 4.0 1.74 0.87 0.5 0.512/15/20 5.40 4.4 1.62 0.81 0.6 0.512/22/20 6.00 4.2 1.80 0.90 0.5 0.612/29/20 6.05 4.2 1.82 0.91 0.5 0.5
Date RP-1 RW RP-1 RW RP-1 RW Ely 3 East Ely 3 Eastmg/L==> TOC TN TN - 2 sample avg. TOC (76% reduction) TN (52% reduction) TN - 2 sample avg.
Limit ==> 10 mg/L (DDW) 16 mg/L 5 mg/L (RWQCB)
10/05/20 5.50 4.8 4.5 1.32 2.3 2.110/12/20 5.80 5.1 4.9 1.39 2.4 2.410/19/20 5.81 4.1 4.6 1.39 2.0 2.210/26/20 5.52 4.4 4.2 1.32 2.1 2.011/02/20 5.15 3.9 4.2 1.24 1.9 2.011/09/20 5.40 3.4 3.7 1.30 1.7 1.811/16/20 6.25 4.1 3.8 1.50 2.0 1.811/23/20 6.10 4.3 4.2 1.46 2.0 2.011/30/20 5.75 5.4 4.8 1.38 2.6 2.312/07/20 7.10 4.9 5.2 1.70 2.4 2.512/14/20 6.20 5.4 5.2 1.49 2.6 2.512/21/20 6.80 4.9 5.2 1.63 2.4 2.512/28/20 7.25 5.4 5.2 1.74 2.6 2.6
*The recycled water blend of RP-1 &RP-4 effluent is sampled at the RP-4 1299 Pump Station
Note: TOC & TN compliance is based on two consecutive sample results.
Table 2-5bAlternative Monitoring Plans
Turner BasinTurner 1 & 2Turner 3 & 4
Banana BasinBanana
Hickory Basin
Ely Basin
Blue font shows an exceedance TN limit of 5 mg/L for the Regional Board (current permit). However the DDW compliance point is at the recycled water with a TN limit of 10 mg/L (CAR comment letter). WEI is currently conducting a study to demonstrate that the 10 mg/L TN limit for the recycled water will not negatively impact Chino Basin. These changes will be incorporated into the our future GWR permit.
Page 1 of 3
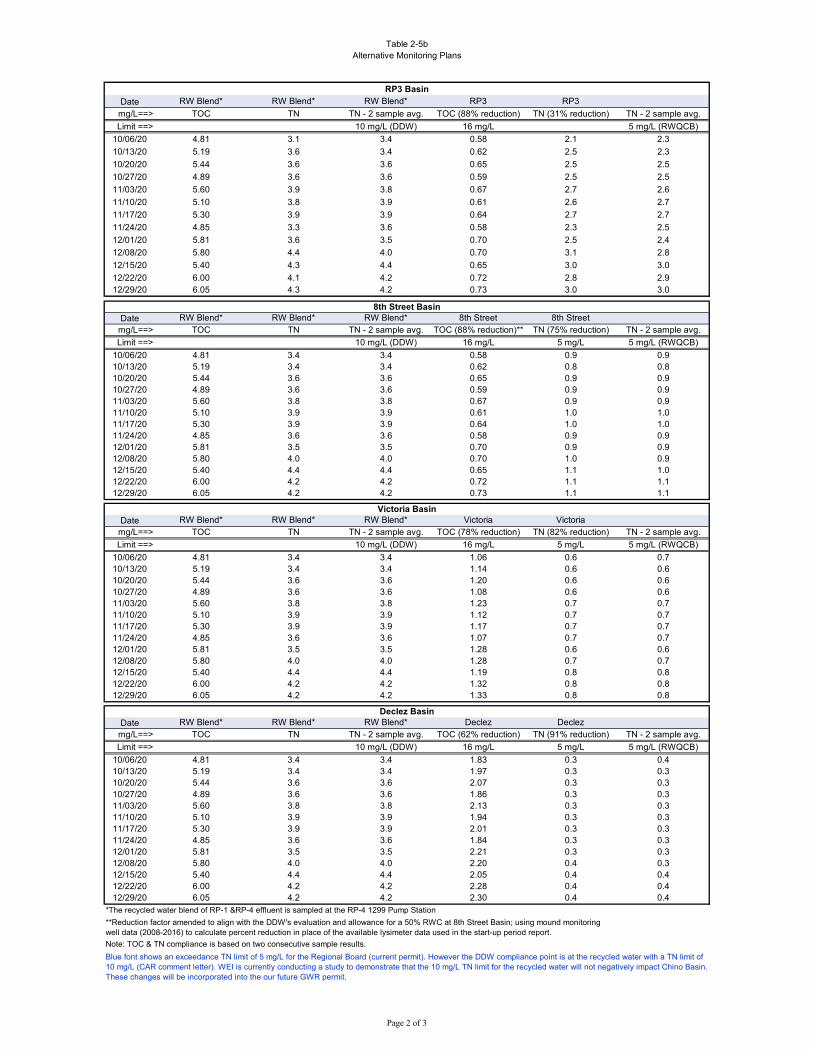
Table 2-5bAlternative Monitoring Plans
Date RW Blend* RW Blend* RW Blend* RP3 RP3
mg/L==> TOC TN TN - 2 sample avg. TOC (88% reduction) TN (31% reduction) TN - 2 sample avg.
Limit ==> 10 mg/L (DDW) 16 mg/L 5 mg/L (RWQCB)
10/06/20 4.81 3.1 3.4 0.58 2.1 2.3
10/13/20 5.19 3.6 3.4 0.62 2.5 2.3
10/20/20 5.44 3.6 3.6 0.65 2.5 2.5
10/27/20 4.89 3.6 3.6 0.59 2.5 2.5
11/03/20 5.60 3.9 3.8 0.67 2.7 2.6
11/10/20 5.10 3.8 3.9 0.61 2.6 2.7
11/17/20 5.30 3.9 3.9 0.64 2.7 2.7
11/24/20 4.85 3.3 3.6 0.58 2.3 2.5
12/01/20 5.81 3.6 3.5 0.70 2.5 2.4
12/08/20 5.80 4.4 4.0 0.70 3.1 2.8
12/15/20 5.40 4.3 4.4 0.65 3.0 3.0
12/22/20 6.00 4.1 4.2 0.72 2.8 2.912/29/20 6.05 4.3 4.2 0.73 3.0 3.0
Date RW Blend* RW Blend* RW Blend* 8th Street 8th Streetmg/L==> TOC TN TN - 2 sample avg. TOC (88% reduction)** TN (75% reduction) TN - 2 sample avg.
Limit ==> 10 mg/L (DDW) 16 mg/L 5 mg/L 5 mg/L (RWQCB)
10/06/20 4.81 3.4 3.4 0.58 0.9 0.910/13/20 5.19 3.4 3.4 0.62 0.8 0.810/20/20 5.44 3.6 3.6 0.65 0.9 0.910/27/20 4.89 3.6 3.6 0.59 0.9 0.911/03/20 5.60 3.8 3.8 0.67 0.9 0.911/10/20 5.10 3.9 3.9 0.61 1.0 1.011/17/20 5.30 3.9 3.9 0.64 1.0 1.011/24/20 4.85 3.6 3.6 0.58 0.9 0.912/01/20 5.81 3.5 3.5 0.70 0.9 0.912/08/20 5.80 4.0 4.0 0.70 1.0 0.912/15/20 5.40 4.4 4.4 0.65 1.1 1.012/22/20 6.00 4.2 4.2 0.72 1.1 1.112/29/20 6.05 4.2 4.2 0.73 1.1 1.1
Date RW Blend* RW Blend* RW Blend* Victoria Victoriamg/L==> TOC TN TN - 2 sample avg. TOC (78% reduction) TN (82% reduction) TN - 2 sample avg.
Limit ==> 10 mg/L (DDW) 16 mg/L 5 mg/L 5 mg/L (RWQCB)
10/06/20 4.81 3.4 3.4 1.06 0.6 0.710/13/20 5.19 3.4 3.4 1.14 0.6 0.610/20/20 5.44 3.6 3.6 1.20 0.6 0.610/27/20 4.89 3.6 3.6 1.08 0.6 0.611/03/20 5.60 3.8 3.8 1.23 0.7 0.711/10/20 5.10 3.9 3.9 1.12 0.7 0.711/17/20 5.30 3.9 3.9 1.17 0.7 0.711/24/20 4.85 3.6 3.6 1.07 0.7 0.712/01/20 5.81 3.5 3.5 1.28 0.6 0.612/08/20 5.80 4.0 4.0 1.28 0.7 0.712/15/20 5.40 4.4 4.4 1.19 0.8 0.812/22/20 6.00 4.2 4.2 1.32 0.8 0.812/29/20 6.05 4.2 4.2 1.33 0.8 0.8
Date RW Blend* RW Blend* RW Blend* Declez Declezmg/L==> TOC TN TN - 2 sample avg. TOC (62% reduction) TN (91% reduction) TN - 2 sample avg.
Limit ==> 10 mg/L (DDW) 16 mg/L 5 mg/L 5 mg/L (RWQCB)
10/06/20 4.81 3.4 3.4 1.83 0.3 0.410/13/20 5.19 3.4 3.4 1.97 0.3 0.310/20/20 5.44 3.6 3.6 2.07 0.3 0.310/27/20 4.89 3.6 3.6 1.86 0.3 0.311/03/20 5.60 3.8 3.8 2.13 0.3 0.311/10/20 5.10 3.9 3.9 1.94 0.3 0.311/17/20 5.30 3.9 3.9 2.01 0.3 0.311/24/20 4.85 3.6 3.6 1.84 0.3 0.312/01/20 5.81 3.5 3.5 2.21 0.3 0.312/08/20 5.80 4.0 4.0 2.20 0.4 0.312/15/20 5.40 4.4 4.4 2.05 0.4 0.412/22/20 6.00 4.2 4.2 2.28 0.4 0.412/29/20 6.05 4.2 4.2 2.30 0.4 0.4
*The recycled water blend of RP-1 &RP-4 effluent is sampled at the RP-4 1299 Pump Station
Note: TOC & TN compliance is based on two consecutive sample results.
**Reduction factor amended to align with the DDW's evaluation and allowance for a 50% RWC at 8th Street Basin; using mound monitoring well data (2008-2016) to calculate percent reduction in place of the available lysimeter data used in the start-up period report.
8th Street Basin
Victoria Basin
Blue font shows an exceedance TN limit of 5 mg/L for the Regional Board (current permit). However the DDW compliance point is at the recycled water with a TN limit of 10 mg/L (CAR comment letter). WEI is currently conducting a study to demonstrate that the 10 mg/L TN limit for the recycled water will not negatively impact Chino Basin. These changes will be incorporated into the our future GWR permit.
Declez Basin
RP3 Basin
Page 2 of 3
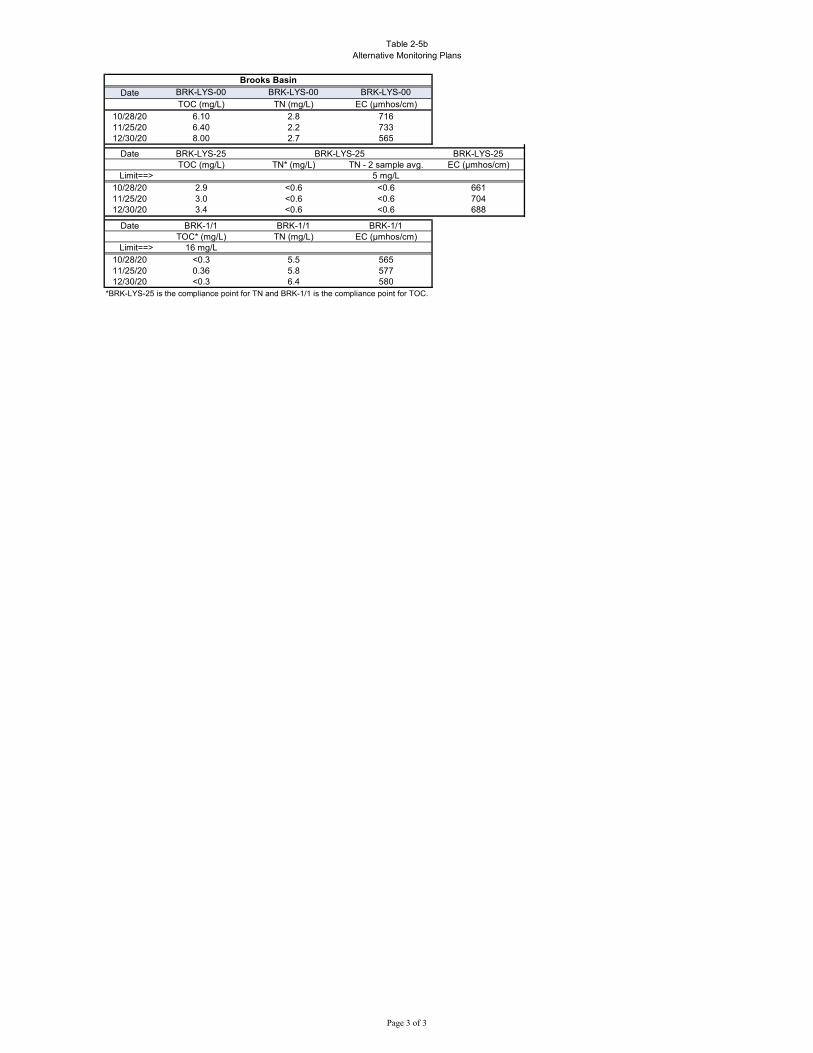
Table 2-5bAlternative Monitoring Plans
Date BRK-LYS-00 BRK-LYS-00 BRK-LYS-00TOC (mg/L) TN (mg/L) EC (µmhos/cm)
10/28/20 6.10 2.8 71611/25/20 6.40 2.2 73312/30/20 8.00 2.7 565
Date BRK-LYS-25 BRK-LYS-25TOC (mg/L) TN* (mg/L) TN - 2 sample avg. EC (µmhos/cm)
Limit==> 5 mg/L10/28/20 2.9 <0.6 <0.6 66111/25/20 3.0 <0.6 <0.6 70412/30/20 3.4 <0.6 <0.6 688
Date BRK-1/1 BRK-1/1 BRK-1/1TOC* (mg/L) TN (mg/L) EC (µmhos/cm)
Limit==> 16 mg/L10/28/20 <0.3 5.5 56511/25/20 0.36 5.8 57712/30/20 <0.3 6.4 580
*BRK-LYS-25 is the compliance point for TN and BRK-1/1 is the compliance point for TOC.
BRK-LYS-25
Brooks Basin
Page 3 of 3
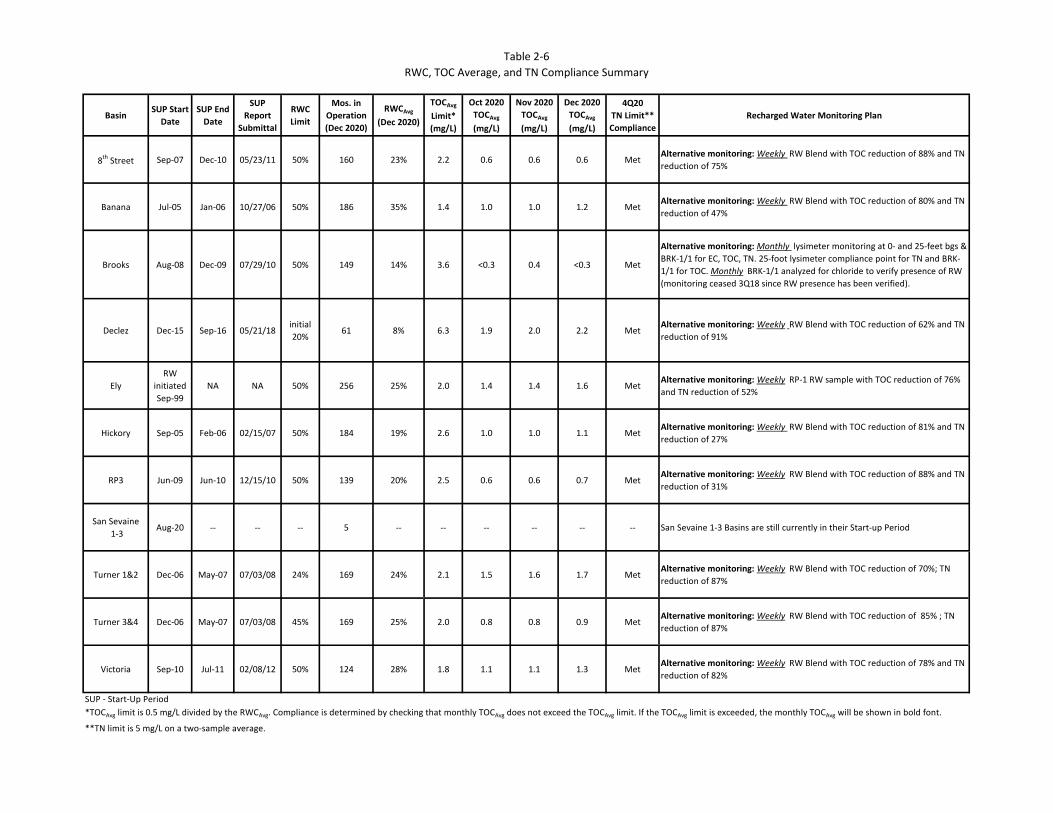
BasinSUP Start
Date
SUP End
Date
SUP
Report
Submittal
RWC
Limit
Mos. in
Operation
(Dec 2020)
RWCAvg
(Dec 2020)
TOCAvg
Limit*
(mg/L)
Oct 2020
TOCAvg
(mg/L)
Nov 2020
TOCAvg
(mg/L)
Dec 2020
TOCAvg
(mg/L)
4Q20
TN Limit**
Compliance
Recharged Water Monitoring Plan
8th Street Sep‐07 Dec‐10 05/23/11 50% 160 23% 2.2 0.6 0.6 0.6 Met
Alternative monitoring: Weekly RW Blend with TOC reduction of 88% and TN
reduction of 75%
Banana Jul‐05 Jan‐06 10/27/06 50% 186 35% 1.4 1.0 1.0 1.2 MetAlternative monitoring: Weekly RW Blend with TOC reduction of 80% and TN
reduction of 47%
Brooks Aug‐08 Dec‐09 07/29/10 50% 149 14% 3.6 <0.3 0.4 <0.3 Met
Alternative monitoring: Monthly lysimeter monitoring at 0‐ and 25‐feet bgs &
BRK‐1/1 for EC, TOC, TN. 25‐foot lysimeter compliance point for TN and BRK‐
1/1 for TOC. Monthly BRK‐1/1 analyzed for chloride to verify presence of RW
(monitoring ceased 3Q18 since RW presence has been verified).
Declez Dec‐15 Sep‐16 05/21/18initial
20%61 8% 6.3 1.9 2.0 2.2 Met
Alternative monitoring: Weekly RW Blend with TOC reduction of 62% and TN
reduction of 91%
Ely
RW
initiated
Sep‐99
NA NA 50% 256 25% 2.0 1.4 1.4 1.6 MetAlternative monitoring: Weekly RP‐1 RW sample with TOC reduction of 76%
and TN reduction of 52%
Hickory Sep‐05 Feb‐06 02/15/07 50% 184 19% 2.6 1.0 1.0 1.1 MetAlternative monitoring: Weekly RW Blend with TOC reduction of 81% and TN
reduction of 27%
RP3 Jun‐09 Jun‐10 12/15/10 50% 139 20% 2.5 0.6 0.6 0.7 MetAlternative monitoring: Weekly RW Blend with TOC reduction of 88% and TN
reduction of 31%
San Sevaine
1‐3Aug‐20 ‐‐ ‐‐ ‐‐ 5 ‐‐ ‐‐ ‐‐ ‐‐ ‐‐ ‐‐ San Sevaine 1‐3 Basins are still currently in their Start‐up Period
Turner 1&2 Dec‐06 May‐07 07/03/08 24% 169 24% 2.1 1.5 1.6 1.7 MetAlternative monitoring: Weekly RW Blend with TOC reduction of 70%; TN
reduction of 87%
Turner 3&4 Dec‐06 May‐07 07/03/08 45% 169 25% 2.0 0.8 0.8 0.9 MetAlternative monitoring: Weekly RW Blend with TOC reduction of 85% ; TN
reduction of 87%
Victoria Sep‐10 Jul‐11 02/08/12 50% 124 28% 1.8 1.1 1.1 1.3 MetAlternative monitoring: Weekly RW Blend with TOC reduction of 78% and TN
reduction of 82%
*TOCAvg limit is 0.5 mg/L divided by the RWCAvg. Compliance is determined by checking that monthly TOCAvg does not exceed the TOCAvg limit. If the TOCAvg limit is exceeded, the monthly TOCAvg will be shown in bold font.
**TN limit is 5 mg/L on a two‐sample average.
RWC, TOC Average, and TN Compliance Summary
SUP ‐ Start‐Up Period
Table 2‐6
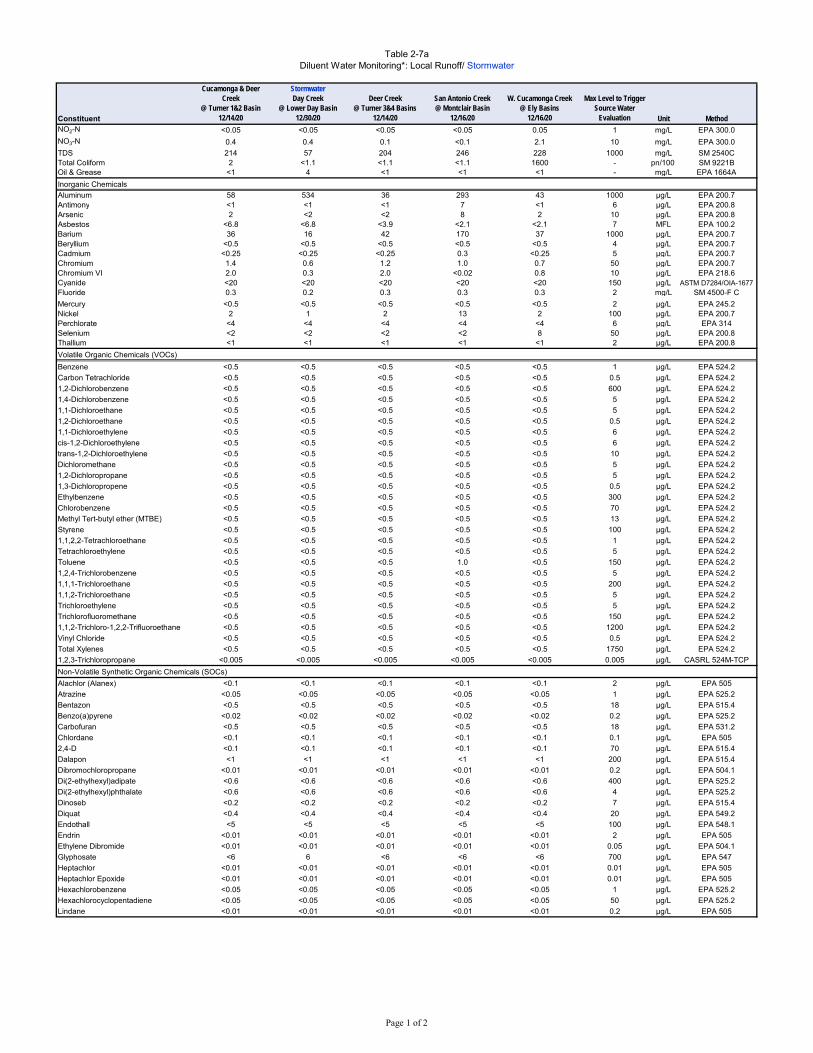
Constituent
Cucamonga & Deer Creek
@ Turner 1&2 Basin12/14/20
StormwaterDay Creek
@ Lower Day Basin12/30/20
Deer Creek@ Turner 3&4 Basins
12/14/20
San Antonio Creek@ Montclair Basin
12/16/20
W. Cucamonga Creek@ Ely Basins
12/16/20
Max Level to Trigger Source Water
Evaluation Unit MethodNO2-N <0.05 <0.05 <0.05 <0.05 0.05 1 mg/L EPA 300.0
NO3-N 0.4 0.4 0.1 <0.1 2.1 10 mg/L EPA 300.0
TDS 214 57 204 246 228 1000 mg/L SM 2540CTotal Coliform 2 <1.1 <1.1 <1.1 1600 - pn/100m SM 9221BOil & Grease <1 4 <1 <1 <1 - mg/L EPA 1664A
Inorganic Chemicals
Aluminum 58 534 36 293 43 1000 µg/L EPA 200.7Antimony <1 <1 <1 7 <1 6 µg/L EPA 200.8Arsenic 2 <2 <2 8 2 10 µg/L EPA 200.8Asbestos <6.8 <6.8 <3.9 <2.1 <2.1 7 MFL EPA 100.2Barium 36 16 42 170 37 1000 µg/L EPA 200.7Beryllium <0.5 <0.5 <0.5 <0.5 <0.5 4 µg/L EPA 200.7Cadmium <0.25 <0.25 <0.25 0.3 <0.25 5 µg/L EPA 200.7Chromium 1.4 0.6 1.2 1.0 0.7 50 µg/L EPA 200.7Chromium VI 2.0 0.3 2.0 <0.02 0.8 10 µg/L EPA 218.6Cyanide <20 <20 <20 <20 <20 150 µg/L ASTM D7284/OIA-1677Fluoride 0.3 0.2 0.3 0.3 0.3 2 mg/L SM 4500-F C
Mercury <0.5 <0.5 <0.5 <0.5 <0.5 2 µg/L EPA 245.2Nickel 2 1 2 13 2 100 µg/L EPA 200.7Perchlorate <4 <4 <4 <4 <4 6 µg/L EPA 314Selenium <2 <2 <2 <2 8 50 µg/L EPA 200.8Thallium <1 <1 <1 <1 <1 2 µg/L EPA 200.8
Volatile Organic Chemicals (VOCs)
Benzene <0.5 <0.5 <0.5 <0.5 <0.5 1 µg/L EPA 524.2
Carbon Tetrachloride <0.5 <0.5 <0.5 <0.5 <0.5 0.5 µg/L EPA 524.2
1,2-Dichlorobenzene <0.5 <0.5 <0.5 <0.5 <0.5 600 µg/L EPA 524.2
1,4-Dichlorobenzene <0.5 <0.5 <0.5 <0.5 <0.5 5 µg/L EPA 524.2
1,1-Dichloroethane <0.5 <0.5 <0.5 <0.5 <0.5 5 µg/L EPA 524.2
1,2-Dichloroethane <0.5 <0.5 <0.5 <0.5 <0.5 0.5 µg/L EPA 524.2
1,1-Dichloroethylene <0.5 <0.5 <0.5 <0.5 <0.5 6 µg/L EPA 524.2
cis-1,2-Dichloroethylene <0.5 <0.5 <0.5 <0.5 <0.5 6 µg/L EPA 524.2
trans-1,2-Dichloroethylene <0.5 <0.5 <0.5 <0.5 <0.5 10 µg/L EPA 524.2
Dichloromethane <0.5 <0.5 <0.5 <0.5 <0.5 5 µg/L EPA 524.2
1,2-Dichloropropane <0.5 <0.5 <0.5 <0.5 <0.5 5 µg/L EPA 524.2
1,3-Dichloropropene <0.5 <0.5 <0.5 <0.5 <0.5 0.5 µg/L EPA 524.2
Ethylbenzene <0.5 <0.5 <0.5 <0.5 <0.5 300 µg/L EPA 524.2
Chlorobenzene <0.5 <0.5 <0.5 <0.5 <0.5 70 µg/L EPA 524.2
Methyl Tert-butyl ether (MTBE) <0.5 <0.5 <0.5 <0.5 <0.5 13 µg/L EPA 524.2
Styrene <0.5 <0.5 <0.5 <0.5 <0.5 100 µg/L EPA 524.2
1,1,2,2-Tetrachloroethane <0.5 <0.5 <0.5 <0.5 <0.5 1 µg/L EPA 524.2
Tetrachloroethylene <0.5 <0.5 <0.5 <0.5 <0.5 5 µg/L EPA 524.2
Toluene <0.5 <0.5 <0.5 1.0 <0.5 150 µg/L EPA 524.2
1,2,4-Trichlorobenzene <0.5 <0.5 <0.5 <0.5 <0.5 5 µg/L EPA 524.2
1,1,1-Trichloroethane <0.5 <0.5 <0.5 <0.5 <0.5 200 µg/L EPA 524.2
1,1,2-Trichloroethane <0.5 <0.5 <0.5 <0.5 <0.5 5 µg/L EPA 524.2
Trichloroethylene <0.5 <0.5 <0.5 <0.5 <0.5 5 µg/L EPA 524.2
Trichlorofluoromethane <0.5 <0.5 <0.5 <0.5 <0.5 150 µg/L EPA 524.2
1,1,2-Trichloro-1,2,2-Trifluoroethane <0.5 <0.5 <0.5 <0.5 <0.5 1200 µg/L EPA 524.2
Vinyl Chloride <0.5 <0.5 <0.5 <0.5 <0.5 0.5 µg/L EPA 524.2
Total Xylenes <0.5 <0.5 <0.5 <0.5 <0.5 1750 µg/L EPA 524.2
1,2,3-Trichloropropane <0.005 <0.005 <0.005 <0.005 <0.005 0.005 µg/L CASRL 524M-TCP
Non-Volatile Synthetic Organic Chemicals (SOCs)
Alachlor (Alanex) <0.1 <0.1 <0.1 <0.1 <0.1 2 µg/L EPA 505
Atrazine <0.05 <0.05 <0.05 <0.05 <0.05 1 µg/L EPA 525.2
Bentazon <0.5 <0.5 <0.5 <0.5 <0.5 18 µg/L EPA 515.4
Benzo(a)pyrene <0.02 <0.02 <0.02 <0.02 <0.02 0.2 µg/L EPA 525.2
Carbofuran <0.5 <0.5 <0.5 <0.5 <0.5 18 µg/L EPA 531.2
Chlordane <0.1 <0.1 <0.1 <0.1 <0.1 0.1 µg/L EPA 505
2,4-D <0.1 <0.1 <0.1 <0.1 <0.1 70 µg/L EPA 515.4
Dalapon <1 <1 <1 <1 <1 200 µg/L EPA 515.4
Dibromochloropropane <0.01 <0.01 <0.01 <0.01 <0.01 0.2 µg/L EPA 504.1
Di(2-ethylhexyl)adipate <0.6 <0.6 <0.6 <0.6 <0.6 400 µg/L EPA 525.2
Di(2-ethylhexyl)phthalate <0.6 <0.6 <0.6 <0.6 <0.6 4 µg/L EPA 525.2
Dinoseb <0.2 <0.2 <0.2 <0.2 <0.2 7 µg/L EPA 515.4
Diquat <0.4 <0.4 <0.4 <0.4 <0.4 20 µg/L EPA 549.2
Endothall <5 <5 <5 <5 <5 100 µg/L EPA 548.1
Endrin <0.01 <0.01 <0.01 <0.01 <0.01 2 µg/L EPA 505
Ethylene Dibromide <0.01 <0.01 <0.01 <0.01 <0.01 0.05 µg/L EPA 504.1
Glyphosate <6 6 <6 <6 <6 700 µg/L EPA 547
Heptachlor <0.01 <0.01 <0.01 <0.01 <0.01 0.01 µg/L EPA 505
Heptachlor Epoxide <0.01 <0.01 <0.01 <0.01 <0.01 0.01 µg/L EPA 505
Hexachlorobenzene <0.05 <0.05 <0.05 <0.05 <0.05 1 µg/L EPA 525.2
Hexachlorocyclopentadiene <0.05 <0.05 <0.05 <0.05 <0.05 50 µg/L EPA 525.2
Lindane <0.01 <0.01 <0.01 <0.01 <0.01 0.2 µg/L EPA 505
Table 2-7aDiluent Water Monitoring*: Local Runoff/ Stormwater
Page 1 of 2
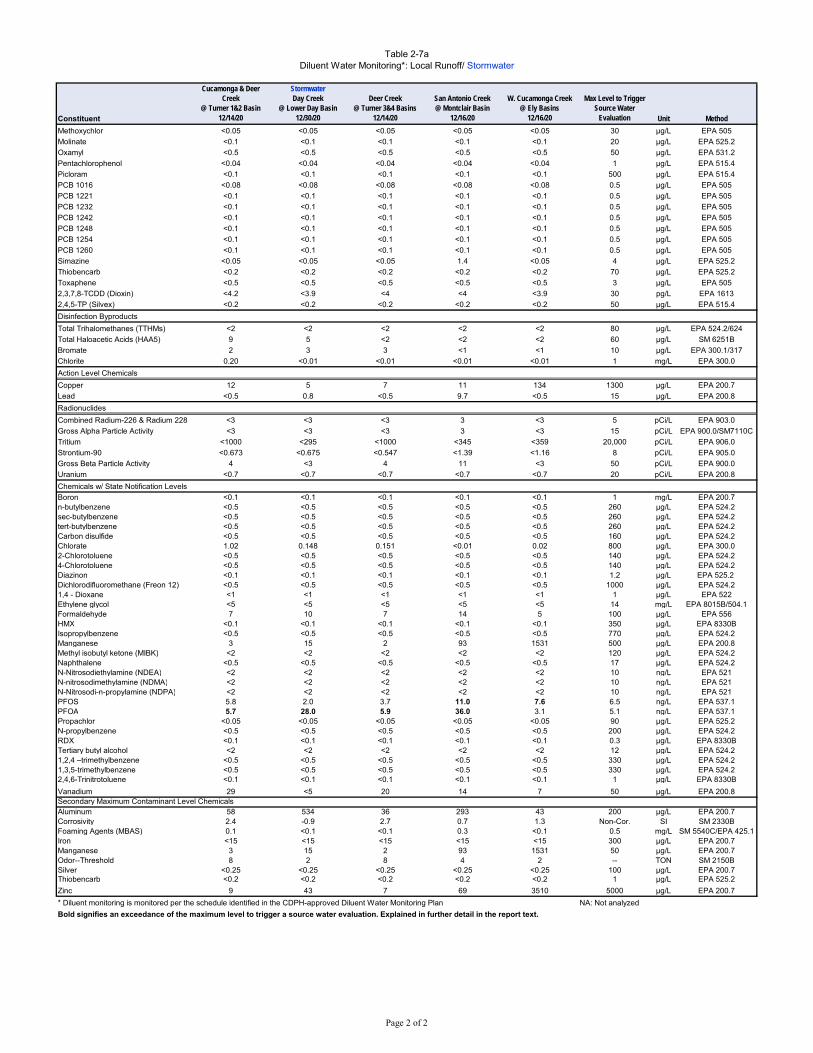
Constituent
Cucamonga & Deer Creek
@ Turner 1&2 Basin12/14/20
StormwaterDay Creek
@ Lower Day Basin12/30/20
Deer Creek@ Turner 3&4 Basins
12/14/20
San Antonio Creek@ Montclair Basin
12/16/20
W. Cucamonga Creek@ Ely Basins
12/16/20
Max Level to Trigger Source Water
Evaluation Unit Method
Table 2-7aDiluent Water Monitoring*: Local Runoff/ Stormwater
Methoxychlor <0.05 <0.05 <0.05 <0.05 <0.05 30 µg/L EPA 505
Molinate <0.1 <0.1 <0.1 <0.1 <0.1 20 µg/L EPA 525.2
Oxamyl <0.5 <0.5 <0.5 <0.5 <0.5 50 µg/L EPA 531.2
Pentachlorophenol <0.04 <0.04 <0.04 <0.04 <0.04 1 µg/L EPA 515.4
Picloram <0.1 <0.1 <0.1 <0.1 <0.1 500 µg/L EPA 515.4
PCB 1016 <0.08 <0.08 <0.08 <0.08 <0.08 0.5 µg/L EPA 505
PCB 1221 <0.1 <0.1 <0.1 <0.1 <0.1 0.5 µg/L EPA 505
PCB 1232 <0.1 <0.1 <0.1 <0.1 <0.1 0.5 µg/L EPA 505
PCB 1242 <0.1 <0.1 <0.1 <0.1 <0.1 0.5 µg/L EPA 505
PCB 1248 <0.1 <0.1 <0.1 <0.1 <0.1 0.5 µg/L EPA 505
PCB 1254 <0.1 <0.1 <0.1 <0.1 <0.1 0.5 µg/L EPA 505
PCB 1260 <0.1 <0.1 <0.1 <0.1 <0.1 0.5 µg/L EPA 505
Simazine <0.05 <0.05 <0.05 1.4 <0.05 4 µg/L EPA 525.2
Thiobencarb <0.2 <0.2 <0.2 <0.2 <0.2 70 µg/L EPA 525.2
Toxaphene <0.5 <0.5 <0.5 <0.5 <0.5 3 µg/L EPA 505
2,3,7,8-TCDD (Dioxin) <4.2 <3.9 <4 <4 <3.9 30 pg/L EPA 1613
2,4,5-TP (Silvex) <0.2 <0.2 <0.2 <0.2 <0.2 50 µg/L EPA 515.4
Disinfection Byproducts
Total Trihalomethanes (TTHMs) <2 <2 <2 <2 <2 80 µg/L EPA 524.2/624
Total Haloacetic Acids (HAA5) 9 5 <2 <2 <2 60 µg/L SM 6251B
Bromate 2 3 3 <1 <1 10 µg/L EPA 300.1/317
Chlorite 0.20 <0.01 <0.01 <0.01 <0.01 1 mg/L EPA 300.0
Action Level Chemicals
Copper 12 5 7 11 134 1300 µg/L EPA 200.7
Lead <0.5 0.8 <0.5 9.7 <0.5 15 µg/L EPA 200.8
Radionuclides
Combined Radium-226 & Radium 228 <3 <3 <3 3 <3 5 pCi/L EPA 903.0
Gross Alpha Particle Activity <3 <3 <3 3 <3 15 pCi/L EPA 900.0/SM7110C
Tritium <1000 <295 <1000 <345 <359 20,000 pCi/L EPA 906.0
Strontium-90 <0.673 <0.675 <0.547 <1.39 <1.16 8 pCi/L EPA 905.0
Gross Beta Particle Activity 4 <3 4 11 <3 50 pCi/L EPA 900.0
Uranium <0.7 <0.7 <0.7 <0.7 <0.7 20 pCi/L EPA 200.8
Chemicals w/ State Notification Levels
Boron <0.1 <0.1 <0.1 <0.1 <0.1 1 mg/L EPA 200.7n-butylbenzene <0.5 <0.5 <0.5 <0.5 <0.5 260 µg/L EPA 524.2sec-butylbenzene <0.5 <0.5 <0.5 <0.5 <0.5 260 µg/L EPA 524.2tert-butylbenzene <0.5 <0.5 <0.5 <0.5 <0.5 260 µg/L EPA 524.2Carbon disulfide <0.5 <0.5 <0.5 <0.5 <0.5 160 µg/L EPA 524.2Chlorate 1.02 0.148 0.151 <0.01 0.02 800 µg/L EPA 300.02-Chlorotoluene <0.5 <0.5 <0.5 <0.5 <0.5 140 µg/L EPA 524.24-Chlorotoluene <0.5 <0.5 <0.5 <0.5 <0.5 140 µg/L EPA 524.2Diazinon <0.1 <0.1 <0.1 <0.1 <0.1 1.2 µg/L EPA 525.2 Dichlorodifluoromethane (Freon 12) <0.5 <0.5 <0.5 <0.5 <0.5 1000 µg/L EPA 524.21,4 - Dioxane <1 <1 <1 <1 <1 1 µg/L EPA 522Ethylene glycol <5 <5 <5 <5 <5 14 mg/L EPA 8015B/504.1Formaldehyde 7 10 7 14 5 100 µg/L EPA 556HMX <0.1 <0.1 <0.1 <0.1 <0.1 350 µg/L EPA 8330BIsopropylbenzene <0.5 <0.5 <0.5 <0.5 <0.5 770 µg/L EPA 524.2Manganese 3 15 2 93 1531 500 µg/L EPA 200.8Methyl isobutyl ketone (MIBK) <2 <2 <2 <2 <2 120 µg/L EPA 524.2Naphthalene <0.5 <0.5 <0.5 <0.5 <0.5 17 µg/L EPA 524.2N-Nitrosodiethylamine (NDEA) <2 <2 <2 <2 <2 10 ng/L EPA 521N-nitrosodimethylamine (NDMA) <2 <2 <2 <2 <2 10 ng/L EPA 521N-Nitrosodi-n-propylamine (NDPA) <2 <2 <2 <2 <2 10 ng/L EPA 521PFOS 5.8 2.0 3.7 11.0 7.6 6.5 ng/L EPA 537.1PFOA 5.7 28.0 5.9 36.0 3.1 5.1 ng/L EPA 537.1Propachlor <0.05 <0.05 <0.05 <0.05 <0.05 90 µg/L EPA 525.2N-propylbenzene <0.5 <0.5 <0.5 <0.5 <0.5 200 µg/L EPA 524.2RDX <0.1 <0.1 <0.1 <0.1 <0.1 0.3 µg/L EPA 8330BTertiary butyl alcohol <2 <2 <2 <2 <2 12 µg/L EPA 524.21,2,4 –trimethylbenzene <0.5 <0.5 <0.5 <0.5 <0.5 330 µg/L EPA 524.21,3,5-trimethylbenzene <0.5 <0.5 <0.5 <0.5 <0.5 330 µg/L EPA 524.22,4,6-Trinitrotoluene <0.1 <0.1 <0.1 <0.1 <0.1 1 µg/L EPA 8330B
Vanadium 29 <5 20 14 7 50 µg/L EPA 200.8Secondary Maximum Contaminant Level ChemicalsAluminum 58 534 36 293 43 200 µg/L EPA 200.7Corrosivity 2.4 -0.9 2.7 0.7 1.3 Non-Cor. SI SM 2330BFoaming Agents (MBAS) 0.1 <0.1 <0.1 0.3 <0.1 0.5 mg/L SM 5540C/EPA 425.1Iron <15 <15 <15 <15 <15 300 µg/L EPA 200.7Manganese 3 15 2 93 1531 50 µg/L EPA 200.7Odor--Threshold 8 2 8 4 2 -- TON SM 2150BSilver <0.25 <0.25 <0.25 <0.25 <0.25 100 µg/L EPA 200.7Thiobencarb <0.2 <0.2 <0.2 <0.2 <0.2 1 µg/L EPA 525.2
Zinc 9 43 7 69 3510 5000 µg/L EPA 200.7
* Diluent monitoring is monitored per the schedule identified in the CDPH-approved Diluent Water Monitoring Plan NA: Not analyzed
Bold signifies an exceedance of the maximum level to trigger a source water evaluation. Explained in further detail in the report text.
Page 2 of 2
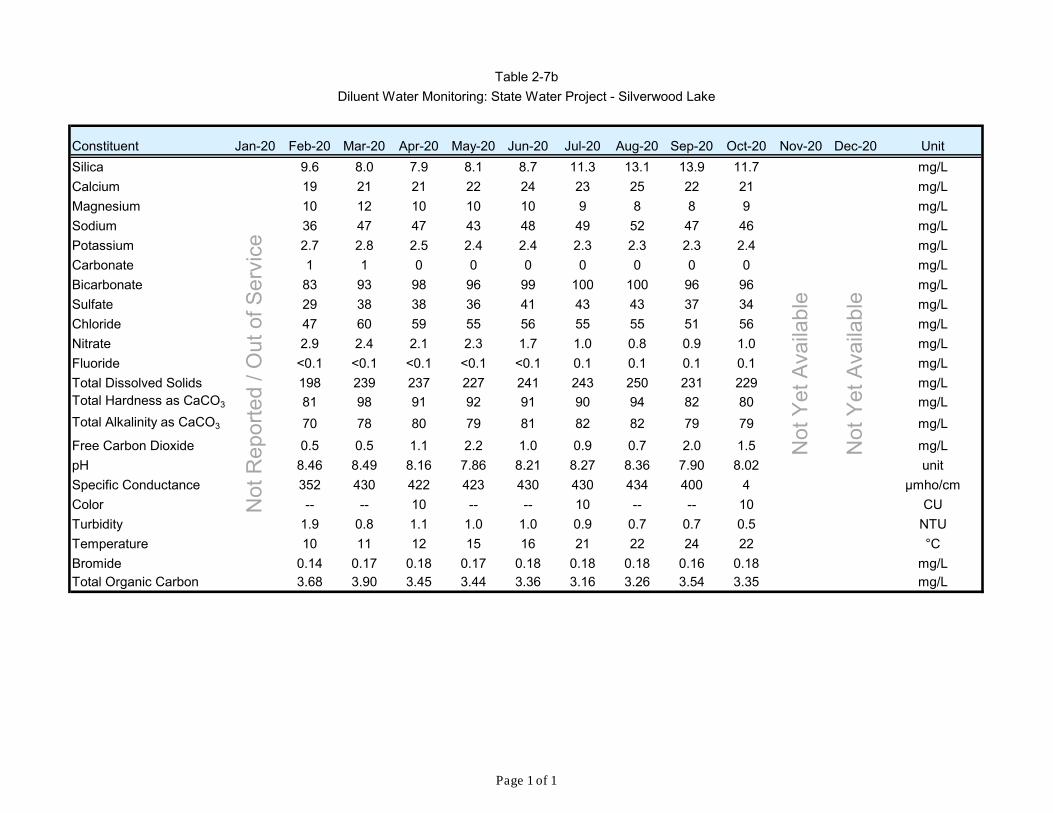
Constituent Jan-20 Feb-20 Mar-20 Apr-20 May-20 Jun-20 Jul-20 Aug-20 Sep-20 Oct-20 Nov-20 Dec-20 Unit
Silica 9.6 8.0 7.9 8.1 8.7 11.3 13.1 13.9 11.7 mg/L
Calcium 19 21 21 22 24 23 25 22 21 mg/L
Magnesium 10 12 10 10 10 9 8 8 9 mg/L
Sodium 36 47 47 43 48 49 52 47 46 mg/L
Potassium 2.7 2.8 2.5 2.4 2.4 2.3 2.3 2.3 2.4 mg/L
Carbonate 1 1 0 0 0 0 0 0 0 mg/L
Bicarbonate 83 93 98 96 99 100 100 96 96 mg/L
Sulfate 29 38 38 36 41 43 43 37 34 mg/L
Chloride 47 60 59 55 56 55 55 51 56 mg/L
Nitrate 2.9 2.4 2.1 2.3 1.7 1.0 0.8 0.9 1.0 mg/L
Fluoride <0.1 <0.1 <0.1 <0.1 <0.1 0.1 0.1 0.1 0.1 mg/L
Total Dissolved Solids 198 239 237 227 241 243 250 231 229 mg/LTotal Hardness as CaCO3 81 98 91 92 91 90 94 82 80 mg/L
Total Alkalinity as CaCO3 70 78 80 79 81 82 82 79 79 mg/L
Free Carbon Dioxide 0.5 0.5 1.1 2.2 1.0 0.9 0.7 2.0 1.5 mg/L
pH 8.46 8.49 8.16 7.86 8.21 8.27 8.36 7.90 8.02 unit
Specific Conductance 352 430 422 423 430 430 434 400 4 µmho/cm
Color -- -- 10 -- -- 10 -- -- 10 CU
Turbidity 1.9 0.8 1.1 1.0 1.0 0.9 0.7 0.7 0.5 NTU
Temperature 10 11 12 15 16 21 22 24 22 °C
Bromide 0.14 0.17 0.18 0.17 0.18 0.18 0.18 0.16 0.18 mg/LTotal Organic Carbon 3.68 3.90 3.45 3.44 3.36 3.16 3.26 3.54 3.35 mg/L
Diluent Water Monitoring: State Water Project - Silverwood Lake
Table 2-7b
Not
Rep
orte
d / O
ut o
f Ser
vice
Not
Yet
Ava
ilabl
e
Not
Yet
Ava
ilabl
e
Page 1 of 1
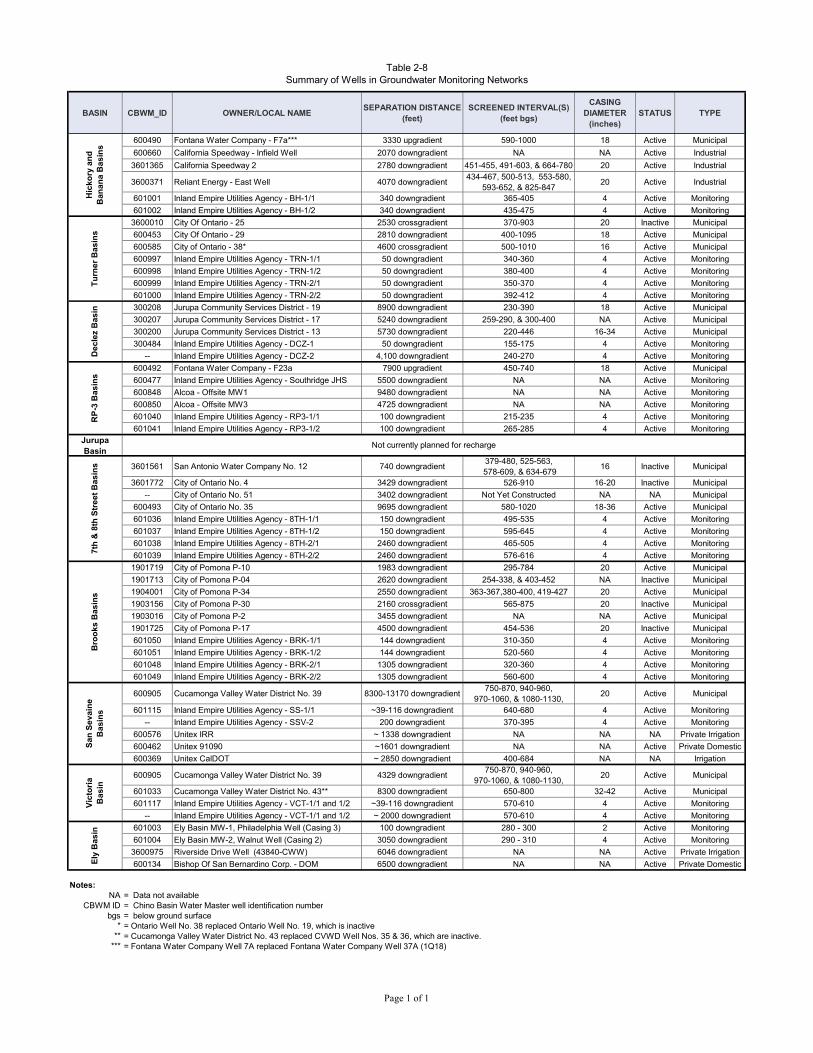
Table 2-8Summary of Wells in Groundwater Monitoring Networks
BASIN CBWM_ID OWNER/LOCAL NAMESEPARATION DISTANCE
(feet)SCREENED INTERVAL(S)
(feet bgs)
CASING DIAMETER
(inches)STATUS TYPE
600490 Fontana Water Company - F7a*** 3330 upgradient 590-1000 18 Active Municipal
600660 California Speedway - Infield Well 2070 downgradient NA NA Active Industrial
3601365 California Speedway 2 2780 downgradient 451-455, 491-603, & 664-780 20 Active Industrial
3600371 Reliant Energy - East Well 4070 downgradient434-467, 500-513, 553-580,
593-652, & 825-84720 Active Industrial
601001 Inland Empire Utilities Agency - BH-1/1 340 downgradient 365-405 4 Active Monitoring
601002 Inland Empire Utilities Agency - BH-1/2 340 downgradient 435-475 4 Active Monitoring
3600010 City Of Ontario - 25 2530 crossgradient 370-903 20 Inactive Municipal
600453 City Of Ontario - 29 2810 downgradient 400-1095 18 Active Municipal
600585 City of Ontario - 38* 4600 crossgradient 500-1010 16 Active Municipal
600997 Inland Empire Utilities Agency - TRN-1/1 50 downgradient 340-360 4 Active Monitoring
600998 Inland Empire Utilities Agency - TRN-1/2 50 downgradient 380-400 4 Active Monitoring
600999 Inland Empire Utilities Agency - TRN-2/1 50 downgradient 350-370 4 Active Monitoring
601000 Inland Empire Utilities Agency - TRN-2/2 50 downgradient 392-412 4 Active Monitoring
300208 Jurupa Community Services District - 19 8900 downgradient 230-390 18 Active Municipal
300207 Jurupa Community Services District - 17 5240 downgradient 259-290, & 300-400 NA Active Municipal
300200 Jurupa Community Services District - 13 5730 downgradient 220-446 16-34 Active Municipal
300484 Inland Empire Utilities Agency - DCZ-1 50 downgradient 155-175 4 Active Monitoring
-- Inland Empire Utilities Agency - DCZ-2 4,100 downgradient 240-270 4 Active Monitoring
600492 Fontana Water Company - F23a 7900 upgradient 450-740 18 Active Municipal
600477 Inland Empire Utilities Agency - Southridge JHS 5500 downgradient NA NA Active Monitoring
600848 Alcoa - Offsite MW1 9480 downgradient NA NA Active Monitoring
600850 Alcoa - Offsite MW3 4725 downgradient NA NA Active Monitoring
601040 Inland Empire Utilities Agency - RP3-1/1 100 downgradient 215-235 4 Active Monitoring
601041 Inland Empire Utilities Agency - RP3-1/2 100 downgradient 265-285 4 Active MonitoringJurupa Basin
3601561 San Antonio Water Company No. 12 740 downgradient379-480, 525-563,
578-609, & 634-67916 Inactive Municipal
3601772 City of Ontario No. 4 3429 downgradient 526-910 16-20 Inactive Municipal
-- City of Ontario No. 51 3402 downgradient Not Yet Constructed NA NA Municipal
600493 City of Ontario No. 35 9695 downgradient 580-1020 18-36 Active Municipal
601036 Inland Empire Utilities Agency - 8TH-1/1 150 downgradient 495-535 4 Active Monitoring
601037 Inland Empire Utilities Agency - 8TH-1/2 150 downgradient 595-645 4 Active Monitoring
601038 Inland Empire Utilities Agency - 8TH-2/1 2460 downgradient 465-505 4 Active Monitoring
601039 Inland Empire Utilities Agency - 8TH-2/2 2460 downgradient 576-616 4 Active Monitoring
1901719 City of Pomona P-10 1983 downgradient 295-784 20 Active Municipal
1901713 City of Pomona P-04 2620 downgradient 254-338, & 403-452 NA Inactive Municipal
1904001 City of Pomona P-34 2550 downgradient 363-367,380-400, 419-427 20 Active Municipal
1903156 City of Pomona P-30 2160 crossgradient 565-875 20 Inactive Municipal
1903016 City of Pomona P-2 3455 downgradient NA NA Active Municipal
1901725 City of Pomona P-17 4500 downgradient 454-536 20 Inactive Municipal
601050 Inland Empire Utilities Agency - BRK-1/1 144 downgradient 310-350 4 Active Monitoring
601051 Inland Empire Utilities Agency - BRK-1/2 144 downgradient 520-560 4 Active Monitoring
601048 Inland Empire Utilities Agency - BRK-2/1 1305 downgradient 320-360 4 Active Monitoring
601049 Inland Empire Utilities Agency - BRK-2/2 1305 downgradient 560-600 4 Active Monitoring
600905 Cucamonga Valley Water District No. 39 8300-13170 downgradient750-870, 940-960,
970-1060, & 1080-1130, 20 Active Municipal
601115 Inland Empire Utilities Agency - SS-1/1 ~39-116 downgradient 640-680 4 Active Monitoring
-- Inland Empire Utilities Agency - SSV-2 200 downgradient 370-395 4 Active Monitoring
600576 Unitex IRR ~ 1338 downgradient NA NA NA Private Irrigation
600462 Unitex 91090 ~1601 downgradient NA NA Active Private Domestic
600369 Unitex CalDOT ~ 2850 downgradient 400-684 NA NA Irrigation
600905 Cucamonga Valley Water District No. 39 4329 downgradient750-870, 940-960,
970-1060, & 1080-1130, 20 Active Municipal
601033 Cucamonga Valley Water District No. 43** 8300 downgradient 650-800 32-42 Active Municipal
601117 Inland Empire Utilities Agency - VCT-1/1 and 1/2 ~39-116 downgradient 570-610 4 Active Monitoring
-- Inland Empire Utilities Agency - VCT-1/1 and 1/2 ~ 2000 downgradient 570-610 4 Active Monitoring
601003 Ely Basin MW-1, Philadelphia Well (Casing 3) 100 downgradient 280 - 300 2 Active Monitoring
601004 Ely Basin MW-2, Walnut Well (Casing 2) 3050 downgradient 290 - 310 4 Active Monitoring
3600975 Riverside Drive Well (43840-CWW) 6046 downgradient NA NA Active Private Irrigation
600134 Bishop Of San Bernardino Corp. - DOM 6500 downgradient NA NA Active Private Domestic
Notes:NA = Data not available
CBWM ID = Chino Basin Water Master well identification numberbgs = below ground surface
***
***
Sa
n S
ev
ain
e
Ba
sin
s
= Fontana Water Company Well 7A replaced Fontana Water Company Well 37A (1Q18)
Bro
ok
s B
as
ins
Vic
tori
a B
asin
Hic
ko
ry a
nd
B
an
an
a B
as
ins
Tu
rne
r B
as
ins
Dec
lez
Bas
inR
P-3
Ba
sin
s
Not currently planned for recharge
Ely
Ba
sin
= Cucamonga Valley Water District No. 43 replaced CVWD Well Nos. 35 & 36, which are inactive.= Ontario Well No. 38 replaced Ontario Well No. 19, which is inactive
7th
& 8
th S
tre
et
Ba
sin
s
Page 1 of 1
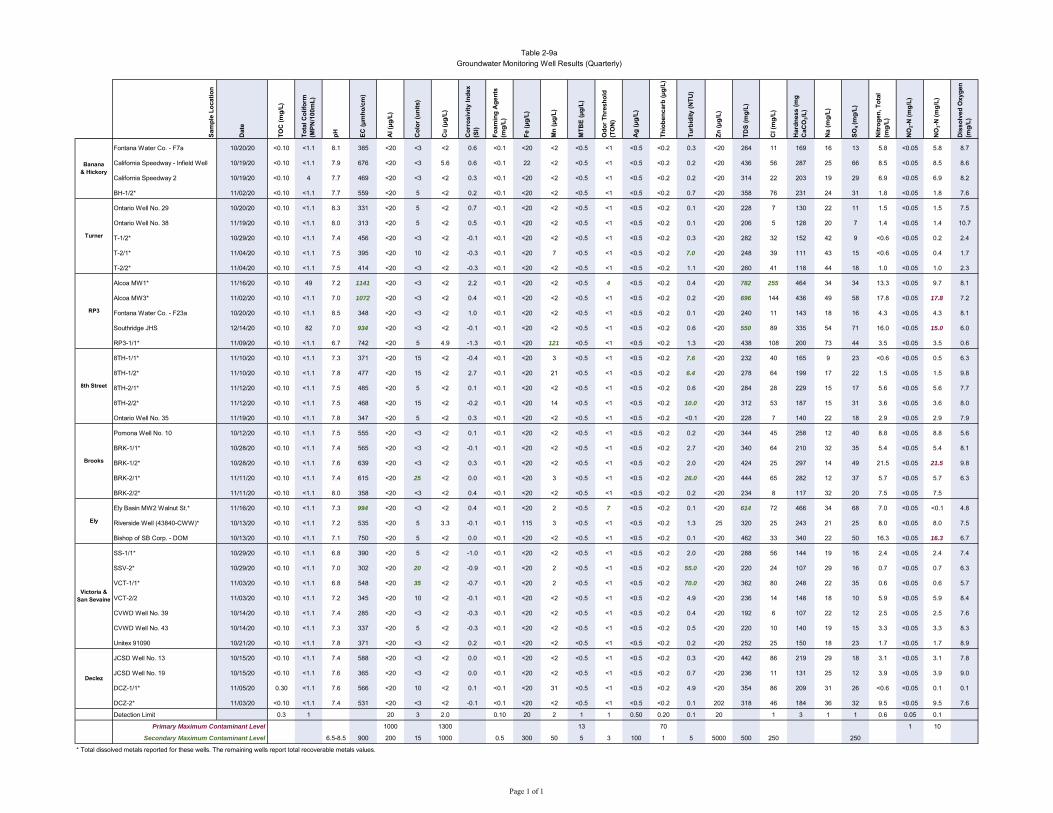
Sam
ple
Lo
cati
on
Dat
e
TO
C (
mg
/L)
To
tal C
olif
orm
(M
PN
/100
mL
)
pH
EC
(µ
mh
o/c
m)
Al (
µg
/L)
Co
lor
(un
its)
Cu
(µ
g/L
)
Co
rro
sivi
ty In
dex
(S
I)
Fo
amin
g A
gen
ts
(mg
/L)
Fe
(µg
/L)
Mn
(µ
g/L
)
MT
BE
(µ
g/L
)
Od
or
Th
resh
old
(T
ON
)
Ag
(µ
g/L
)
Th
iob
enca
rb (
µg
/L)
Tu
rbid
ity
(NT
U)
Zn
(µ
g/L
)
TD
S (
mg
/L)
Cl (
mg
/L)
Har
dn
ess
(mg
C
aCO
3/L
)
Na
(mg
/L)
SO
4 (m
g/L
)
Nit
rog
en, T
ota
l (m
g/L
)
NO
2-N
(m
g/L
)
NO
3-N
(m
g/L
)
Dis
solv
ed O
xyg
en
(mg
/L)
Fontana Water Co. - F7a 10/20/20 <0.10 <1.1 8.1 385 <20 <3 <2 0.6 <0.1 <20 <2 <0.5 <1 <0.5 <0.2 0.3 <20 264 11 169 16 13 5.8 <0.05 5.8 8.7
California Speedway - Infield Well 10/19/20 <0.10 <1.1 7.9 676 <20 <3 5.6 0.6 <0.1 22 <2 <0.5 <1 <0.5 <0.2 0.2 <20 436 56 287 25 66 8.5 <0.05 8.5 8.6
California Speedway 2 10/19/20 <0.10 4 7.7 469 <20 <3 <2 0.3 <0.1 <20 <2 <0.5 <1 <0.5 <0.2 0.2 <20 314 22 203 19 29 6.9 <0.05 6.9 8.2
BH-1/2* 11/02/20 <0.10 <1.1 7.7 559 <20 5 <2 0.2 <0.1 <20 <2 <0.5 <1 <0.5 <0.2 0.7 <20 358 76 231 24 31 1.8 <0.05 1.8 7.6
Ontario Well No. 29 10/20/20 <0.10 <1.1 8.3 331 <20 5 <2 0.7 <0.1 <20 <2 <0.5 <1 <0.5 <0.2 0.1 <20 228 7 130 22 11 1.5 <0.05 1.5 7.5
Ontario Well No. 38 11/19/20 <0.10 <1.1 8.0 313 <20 5 <2 0.5 <0.1 <20 <2 <0.5 <1 <0.5 <0.2 0.1 <20 206 5 128 20 7 1.4 <0.05 1.4 10.7
T-1/2* 10/29/20 <0.10 <1.1 7.4 456 <20 <3 <2 -0.1 <0.1 <20 <2 <0.5 <1 <0.5 <0.2 0.3 <20 282 32 152 42 9 <0.6 <0.05 0.2 2.4
T-2/1* 11/04/20 <0.10 <1.1 7.5 395 <20 10 <2 -0.3 <0.1 <20 7 <0.5 <1 <0.5 <0.2 7.0 <20 248 39 111 43 15 <0.6 <0.05 0.4 1.7
T-2/2* 11/04/20 <0.10 <1.1 7.5 414 <20 <3 <2 -0.3 <0.1 <20 <2 <0.5 <1 <0.5 <0.2 1.1 <20 260 41 118 44 18 1.0 <0.05 1.0 2.3
Alcoa MW1* 11/16/20 <0.10 49 7.2 1141 <20 <3 <2 2.2 <0.1 <20 <2 <0.5 4 <0.5 <0.2 0.4 <20 782 255 464 34 34 13.3 <0.05 9.7 8.1
Alcoa MW3* 11/02/20 <0.10 <1.1 7.0 1072 <20 <3 <2 0.4 <0.1 <20 <2 <0.5 <1 <0.5 <0.2 0.2 <20 696 144 436 49 58 17.8 <0.05 17.8 7.2
Fontana Water Co. - F23a 10/20/20 <0.10 <1.1 8.5 348 <20 <3 <2 1.0 <0.1 <20 <2 <0.5 <1 <0.5 <0.2 0.1 <20 240 11 143 18 16 4.3 <0.05 4.3 8.1
Southridge JHS 12/14/20 <0.10 82 7.0 934 <20 <3 <2 -0.1 <0.1 <20 <2 <0.5 <1 <0.5 <0.2 0.6 <20 550 89 335 54 71 16.0 <0.05 15.0 6.0
RP3-1/1* 11/09/20 <0.10 <1.1 6.7 742 <20 5 4.9 -1.3 <0.1 <20 121 <0.5 <1 <0.5 <0.2 1.3 <20 438 108 200 73 44 3.5 <0.05 3.5 0.6
8TH-1/1* 11/10/20 <0.10 <1.1 7.3 371 <20 15 <2 -0.4 <0.1 <20 3 <0.5 <1 <0.5 <0.2 7.6 <20 232 40 165 9 23 <0.6 <0.05 0.5 6.3
8TH-1/2* 11/10/20 <0.10 <1.1 7.8 477 <20 15 <2 2.7 <0.1 <20 21 <0.5 <1 <0.5 <0.2 6.4 <20 278 64 199 17 22 1.5 <0.05 1.5 9.8
8TH-2/1* 11/12/20 <0.10 <1.1 7.5 485 <20 5 <2 0.1 <0.1 <20 <2 <0.5 <1 <0.5 <0.2 0.6 <20 284 28 229 15 17 5.6 <0.05 5.6 7.7
8TH-2/2* 11/12/20 <0.10 <1.1 7.5 468 <20 15 <2 -0.2 <0.1 <20 14 <0.5 <1 <0.5 <0.2 10.0 <20 312 53 187 15 31 3.6 <0.05 3.6 8.0
Ontario Well No. 35 11/19/20 <0.10 <1.1 7.8 347 <20 5 <2 0.3 <0.1 <20 <2 <0.5 <1 <0.5 <0.2 <0.1 <20 228 7 140 22 18 2.9 <0.05 2.9 7.9
Pomona Well No. 10 10/12/20 <0.10 <1.1 7.5 555 <20 <3 <2 0.1 <0.1 <20 <2 <0.5 <1 <0.5 <0.2 0.2 <20 344 45 258 12 40 8.8 <0.05 8.8 5.6
BRK-1/1* 10/28/20 <0.10 <1.1 7.4 565 <20 <3 <2 -0.1 <0.1 <20 <2 <0.5 <1 <0.5 <0.2 2.7 <20 340 64 210 32 35 5.4 <0.05 5.4 8.1
BRK-1/2* 10/28/20 <0.10 <1.1 7.6 639 <20 <3 <2 0.3 <0.1 <20 <2 <0.5 <1 <0.5 <0.2 2.0 <20 424 25 297 14 49 21.5 <0.05 21.5 9.8
BRK-2/1* 11/11/20 <0.10 <1.1 7.4 615 <20 25 <2 0.0 <0.1 <20 3 <0.5 <1 <0.5 <0.2 26.0 <20 444 65 282 12 37 5.7 <0.05 5.7 6.3
BRK-2/2* 11/11/20 <0.10 <1.1 8.0 358 <20 <3 <2 0.4 <0.1 <20 <2 <0.5 <1 <0.5 <0.2 0.2 <20 234 8 117 32 20 7.5 <0.05 7.5
Ely Basin MW2 Walnut St.* 11/16/20 <0.10 <1.1 7.3 994 <20 <3 <2 0.4 <0.1 <20 2 <0.5 7 <0.5 <0.2 0.1 <20 614 72 466 34 68 7.0 <0.05 <0.1 4.8
Riverside Well (43840-CWW)* 10/13/20 <0.10 <1.1 7.2 535 <20 5 3.3 -0.1 <0.1 115 3 <0.5 <1 <0.5 <0.2 1.3 25 320 25 243 21 25 8.0 <0.05 8.0 7.5
Bishop of SB Corp. - DOM 10/13/20 <0.10 <1.1 7.1 750 <20 5 <2 0.0 <0.1 <20 <2 <0.5 <1 <0.5 <0.2 0.1 <20 462 33 340 22 50 16.3 <0.05 16.3 6.7
SS-1/1* 10/29/20 <0.10 <1.1 6.8 390 <20 5 <2 -1.0 <0.1 <20 <2 <0.5 <1 <0.5 <0.2 2.0 <20 288 56 144 19 16 2.4 <0.05 2.4 7.4
SSV-2* 10/29/20 <0.10 <1.1 7.0 302 <20 20 <2 -0.9 <0.1 <20 2 <0.5 <1 <0.5 <0.2 55.0 <20 220 24 107 29 16 0.7 <0.05 0.7 6.3
VCT-1/1* 11/03/20 <0.10 <1.1 6.8 548 <20 35 <2 -0.7 <0.1 <20 2 <0.5 <1 <0.5 <0.2 70.0 <20 362 80 248 22 35 0.6 <0.05 0.6 5.7
VCT-2/2 11/03/20 <0.10 <1.1 7.2 345 <20 10 <2 -0.1 <0.1 <20 <2 <0.5 <1 <0.5 <0.2 4.9 <20 236 14 148 18 10 5.9 <0.05 5.9 8.4
CVWD Well No. 39 10/14/20 <0.10 <1.1 7.4 285 <20 <3 <2 -0.3 <0.1 <20 <2 <0.5 <1 <0.5 <0.2 0.4 <20 192 6 107 22 12 2.5 <0.05 2.5 7.6
CVWD Well No. 43 10/14/20 <0.10 <1.1 7.3 337 <20 5 <2 -0.3 <0.1 <20 <2 <0.5 <1 <0.5 <0.2 0.5 <20 220 10 140 19 15 3.3 <0.05 3.3 8.3
Unitex 91090 10/21/20 <0.10 <1.1 7.8 371 <20 <3 <2 0.2 <0.1 <20 <2 <0.5 <1 <0.5 <0.2 0.2 <20 252 25 150 18 23 1.7 <0.05 1.7 8.9
JCSD Well No. 13 10/15/20 <0.10 <1.1 7.4 588 <20 <3 <2 0.0 <0.1 <20 <2 <0.5 <1 <0.5 <0.2 0.3 <20 442 86 219 29 18 3.1 <0.05 3.1 7.8
JCSD Well No. 19 10/15/20 <0.10 <1.1 7.6 365 <20 <3 <2 0.0 <0.1 <20 <2 <0.5 <1 <0.5 <0.2 0.7 <20 236 11 131 25 12 3.9 <0.05 3.9 9.0
DCZ-1/1* 11/05/20 0.30 <1.1 7.6 566 <20 10 <2 0.1 <0.1 <20 31 <0.5 <1 <0.5 <0.2 4.9 <20 354 86 209 31 26 <0.6 <0.05 0.1 0.1
DCZ-2* 11/03/20 <0.10 <1.1 7.4 531 <20 <3 <2 -0.1 <0.1 <20 <2 <0.5 <1 <0.5 <0.2 0.1 202 318 46 184 36 32 9.5 <0.05 9.5 7.6
Detection Limit 0.3 1 20 3 2.0 0.10 20 2 1 1 0.50 0.20 0.1 20 1 3 1 1 0.6 0.05 0.1
1000 1300 13 70 1 10
6.5-8.5 900 200 15 1000 0.5 300 50 5 3 100 1 5 5000 500 250 250
* Total dissolved metals reported for these wells. The remaining wells report total recoverable metals values.
Table 2-9a
Groundwater Monitoring Well Results (Quarterly)
RP3
Brooks
8th Street
Primary Maximum Contaminant Level
Secondary Maximum Contaminant Level
Banana & Hickory
Turner
Declez
Ely
Victoria & San Sevaine
Page 1 of 1

Constituent 8TH-1/1 8TH-1/2 8TH-2/1 8TH-2/2 Unit Method
EPA Priority Pollutants - Metals
Antimony <1 <1 <1 <1 µg/L EPA 200.8
Arsenic <1 <1 <1 <1 µg/L EPA 200.8
Beryllium <1 <1 <1 <1 µg/L EPA 200.8
Cadmium <0.5 <0.5 <0.5 <0.5 µg/L EPA 200.8
Chromium 0.7 2.6 1.8 2.9 µg/L EPA 200.8
Copper <0.5 0.6 0.5 <0.5 µg/L EPA 200.8
Lead <0.5 <0.5 <0.5 <0.5 µg/L EPA 200.8
Mercury <0.5 <0.5 <0.5 <0.5 µg/L EPA 245.2
Nickel 42 521 31 245 µg/L EPA 200.8
Selenium <2 <2 <2 <2 µg/L EPA 200.8
Thallium <1 <1 <1 <1 µg/L EPA 200.8
Zinc <1 <1 <1 <1 µg/L EPA 200.8
EPA Priority Pollutants - Volatile Organics
1,1,1-Trichloroethane <0.5 <0.5 <0.5 <0.5 µg/L EPA 524.2/EPA 624
1,1,2,2-Tetrachloroethane <0.5 <0.5 <0.5 <0.5 µg/L EPA 524.2/EPA 624
1,1,2-Trichloroethane <0.5 <0.5 <0.5 <0.5 µg/L EPA 524.2/EPA 624
1,1-Dichloroethane <0.5 <0.5 <0.5 <0.5 µg/L EPA 524.2/EPA 624
1,1-Dichloroethene <0.5 <0.5 <0.5 <0.5 µg/L EPA 524.2/EPA 624
1,2-Dichlorobenzene <0.5 <0.5 <0.5 <0.5 µg/L EPA 524.2/EPA 624
1,2-Dichloroethane <0.5 <0.5 <0.5 <0.5 µg/L EPA 524.2/EPA 624
1,2-Dichloropropane <0.5 <0.5 <0.5 <0.5 µg/L EPA 524.2/EPA 624
1,3-Dichlorobenzene <0.5 <0.5 <0.5 <0.5 µg/L EPA 524.2/EPA 624
1,4-Dichlorobenzene <0.5 <0.5 <0.5 <0.5 µg/L EPA 524.2/EPA 624
2-Chloroethyl vinyl ether <1 <1 <1 <1 µg/L EPA 524.2/EPA 624
Benzene <0.5 <0.5 <0.5 <0.5 µg/L EPA 524.2/EPA 624
Bromodichloromethane <0.5 1.5 <0.5 1.7 µg/L EPA 524.2/EPA 624
Bromoform <0.5 <0.5 <0.5 <0.5 µg/L EPA 524.2/EPA 624
Bromomethane <0.5 <0.5 <0.5 <0.5 µg/L EPA 524.2/EPA 624
Carbon tetrachloride <0.5 <0.5 <0.5 <0.5 µg/L EPA 524.2/EPA 624
Chlorobenzene <0.5 <0.5 <0.5 <0.5 µg/L EPA 524.2/EPA 624
Chloroethane <0.5 <0.5 <0.5 <0.5 µg/L EPA 524.2/EPA 624
Chloroform 4.4 9.1 <0.5 9.3 µg/L EPA 524.2/EPA 624
Chloromethane <0.5 <0.5 <0.5 <0.5 µg/L EPA 524.2/EPA 624
cis-1,3-Dichloropropene <0.5 <0.5 <0.5 <0.5 µg/L EPA 524.2/EPA 624
Dibromochloromethane <0.5 <0.5 <0.5 <0.5 µg/L EPA 524.2/EPA 624
Ethylbenzene <0.5 <0.5 <0.5 <0.5 µg/L EPA 524.2/EPA 624
Methylene chloride <0.5 <0.5 <0.5 <0.5 µg/L EPA 524.2/EPA 624
Tetrachloroethene <0.5 <0.5 <0.5 <0.5 µg/L EPA 524.2/EPA 624
Toluene <0.5 <0.5 <0.5 <0.5 µg/L EPA 524.2/EPA 624
trans-1,2-Dichloroethene <0.5 <0.5 <0.5 <0.5 µg/L EPA 524.2/EPA 624
trans-1,3-Dichloropropene <0.5 <0.5 <0.5 <0.5 µg/L EPA 524.2/EPA 624
Trichloroethene <0.5 <0.5 <0.5 <0.5 µg/L EPA 524.2/EPA 624
Trichlorofluoromethane <0.5 <0.5 <0.5 <0.5 µg/L EPA 524.2/EPA 624
Vinyl chloride <0.5 <0.5 <0.5 <0.5 µg/L EPA 524.2/EPA 624
Acrolein <2 <2 <2 <2 µg/L EPA 624
Acrylonitrile <0.25 <0.25 <0.25 <0.25 µg/L EPA 624
Table 2-9bGroundwater Monitoring Well Results - Priority Toxic Pollutants (Quarterly)
Page 1 of 15
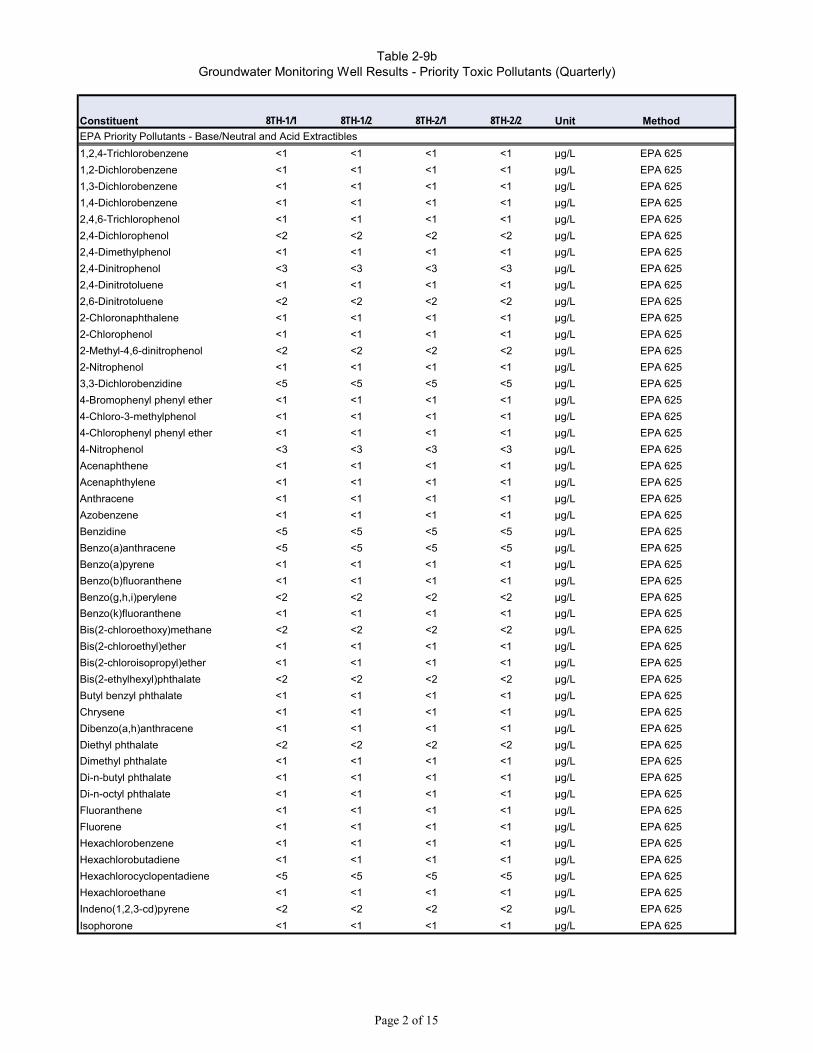
Constituent 8TH-1/1 8TH-1/2 8TH-2/1 8TH-2/2 Unit Method
Table 2-9bGroundwater Monitoring Well Results - Priority Toxic Pollutants (Quarterly)
EPA Priority Pollutants - Base/Neutral and Acid Extractibles
1,2,4-Trichlorobenzene <1 <1 <1 <1 µg/L EPA 625
1,2-Dichlorobenzene <1 <1 <1 <1 µg/L EPA 625
1,3-Dichlorobenzene <1 <1 <1 <1 µg/L EPA 625
1,4-Dichlorobenzene <1 <1 <1 <1 µg/L EPA 625
2,4,6-Trichlorophenol <1 <1 <1 <1 µg/L EPA 625
2,4-Dichlorophenol <2 <2 <2 <2 µg/L EPA 625
2,4-Dimethylphenol <1 <1 <1 <1 µg/L EPA 625
2,4-Dinitrophenol <3 <3 <3 <3 µg/L EPA 625
2,4-Dinitrotoluene <1 <1 <1 <1 µg/L EPA 625
2,6-Dinitrotoluene <2 <2 <2 <2 µg/L EPA 625
2-Chloronaphthalene <1 <1 <1 <1 µg/L EPA 625
2-Chlorophenol <1 <1 <1 <1 µg/L EPA 625
2-Methyl-4,6-dinitrophenol <2 <2 <2 <2 µg/L EPA 625
2-Nitrophenol <1 <1 <1 <1 µg/L EPA 625
3,3-Dichlorobenzidine <5 <5 <5 <5 µg/L EPA 625
4-Bromophenyl phenyl ether <1 <1 <1 <1 µg/L EPA 625
4-Chloro-3-methylphenol <1 <1 <1 <1 µg/L EPA 625
4-Chlorophenyl phenyl ether <1 <1 <1 <1 µg/L EPA 625
4-Nitrophenol <3 <3 <3 <3 µg/L EPA 625
Acenaphthene <1 <1 <1 <1 µg/L EPA 625
Acenaphthylene <1 <1 <1 <1 µg/L EPA 625
Anthracene <1 <1 <1 <1 µg/L EPA 625
Azobenzene <1 <1 <1 <1 µg/L EPA 625
Benzidine <5 <5 <5 <5 µg/L EPA 625
Benzo(a)anthracene <5 <5 <5 <5 µg/L EPA 625
Benzo(a)pyrene <1 <1 <1 <1 µg/L EPA 625
Benzo(b)fluoranthene <1 <1 <1 <1 µg/L EPA 625
Benzo(g,h,i)perylene <2 <2 <2 <2 µg/L EPA 625
Benzo(k)fluoranthene <1 <1 <1 <1 µg/L EPA 625
Bis(2-chloroethoxy)methane <2 <2 <2 <2 µg/L EPA 625
Bis(2-chloroethyl)ether <1 <1 <1 <1 µg/L EPA 625
Bis(2-chloroisopropyl)ether <1 <1 <1 <1 µg/L EPA 625
Bis(2-ethylhexyl)phthalate <2 <2 <2 <2 µg/L EPA 625
Butyl benzyl phthalate <1 <1 <1 <1 µg/L EPA 625
Chrysene <1 <1 <1 <1 µg/L EPA 625
Dibenzo(a,h)anthracene <1 <1 <1 <1 µg/L EPA 625
Diethyl phthalate <2 <2 <2 <2 µg/L EPA 625
Dimethyl phthalate <1 <1 <1 <1 µg/L EPA 625
Di-n-butyl phthalate <1 <1 <1 <1 µg/L EPA 625
Di-n-octyl phthalate <1 <1 <1 <1 µg/L EPA 625
Fluoranthene <1 <1 <1 <1 µg/L EPA 625
Fluorene <1 <1 <1 <1 µg/L EPA 625
Hexachlorobenzene <1 <1 <1 <1 µg/L EPA 625
Hexachlorobutadiene <1 <1 <1 <1 µg/L EPA 625
Hexachlorocyclopentadiene <5 <5 <5 <5 µg/L EPA 625
Hexachloroethane <1 <1 <1 <1 µg/L EPA 625
Indeno(1,2,3-cd)pyrene <2 <2 <2 <2 µg/L EPA 625
Isophorone <1 <1 <1 <1 µg/L EPA 625
Page 2 of 15
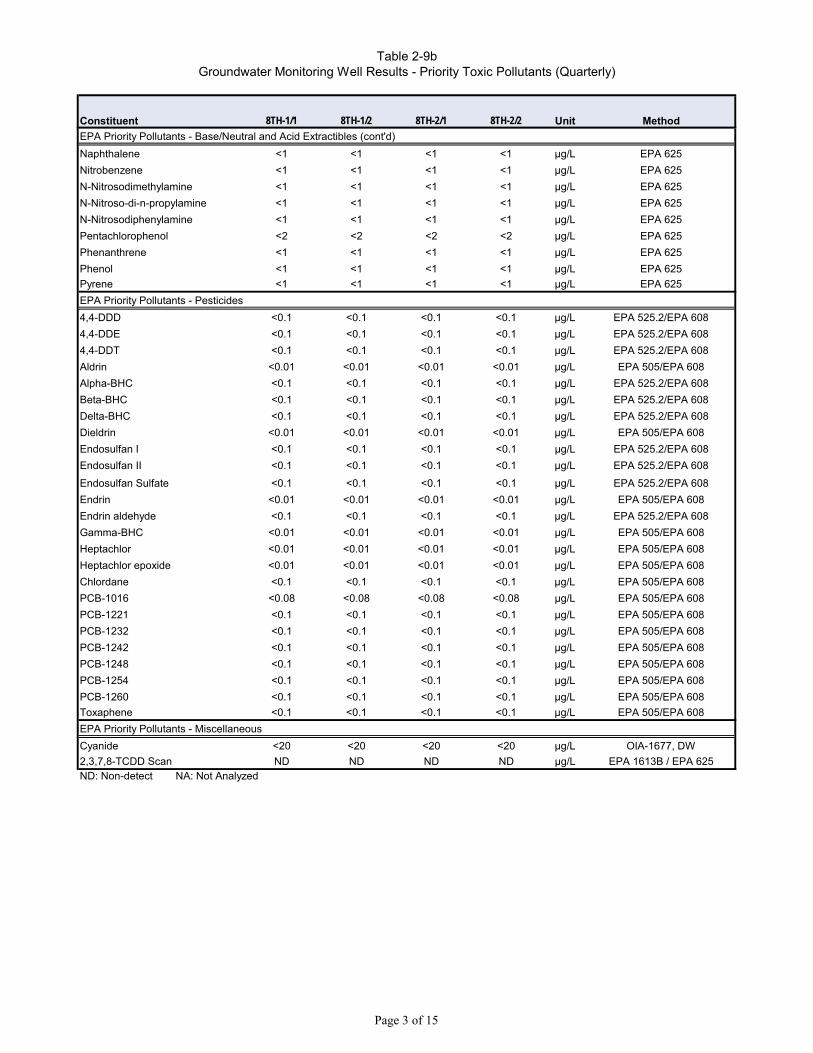
Constituent 8TH-1/1 8TH-1/2 8TH-2/1 8TH-2/2 Unit Method
Table 2-9bGroundwater Monitoring Well Results - Priority Toxic Pollutants (Quarterly)
EPA Priority Pollutants - Base/Neutral and Acid Extractibles (cont'd)
Naphthalene <1 <1 <1 <1 µg/L EPA 625
Nitrobenzene <1 <1 <1 <1 µg/L EPA 625
N-Nitrosodimethylamine <1 <1 <1 <1 µg/L EPA 625
N-Nitroso-di-n-propylamine <1 <1 <1 <1 µg/L EPA 625
N-Nitrosodiphenylamine <1 <1 <1 <1 µg/L EPA 625
Pentachlorophenol <2 <2 <2 <2 µg/L EPA 625
Phenanthrene <1 <1 <1 <1 µg/L EPA 625
Phenol <1 <1 <1 <1 µg/L EPA 625
Pyrene <1 <1 <1 <1 µg/L EPA 625
EPA Priority Pollutants - Pesticides
4,4-DDD <0.1 <0.1 <0.1 <0.1 µg/L EPA 525.2/EPA 608
4,4-DDE <0.1 <0.1 <0.1 <0.1 µg/L EPA 525.2/EPA 608
4,4-DDT <0.1 <0.1 <0.1 <0.1 µg/L EPA 525.2/EPA 608
Aldrin <0.01 <0.01 <0.01 <0.01 µg/L EPA 505/EPA 608
Alpha-BHC <0.1 <0.1 <0.1 <0.1 µg/L EPA 525.2/EPA 608
Beta-BHC <0.1 <0.1 <0.1 <0.1 µg/L EPA 525.2/EPA 608
Delta-BHC <0.1 <0.1 <0.1 <0.1 µg/L EPA 525.2/EPA 608
Dieldrin <0.01 <0.01 <0.01 <0.01 µg/L EPA 505/EPA 608
Endosulfan I <0.1 <0.1 <0.1 <0.1 µg/L EPA 525.2/EPA 608
Endosulfan II <0.1 <0.1 <0.1 <0.1 µg/L EPA 525.2/EPA 608
Endosulfan Sulfate <0.1 <0.1 <0.1 <0.1 µg/L EPA 525.2/EPA 608
Endrin <0.01 <0.01 <0.01 <0.01 µg/L EPA 505/EPA 608
Endrin aldehyde <0.1 <0.1 <0.1 <0.1 µg/L EPA 525.2/EPA 608
Gamma-BHC <0.01 <0.01 <0.01 <0.01 µg/L EPA 505/EPA 608
Heptachlor <0.01 <0.01 <0.01 <0.01 µg/L EPA 505/EPA 608
Heptachlor epoxide <0.01 <0.01 <0.01 <0.01 µg/L EPA 505/EPA 608
Chlordane <0.1 <0.1 <0.1 <0.1 µg/L EPA 505/EPA 608
PCB-1016 <0.08 <0.08 <0.08 <0.08 µg/L EPA 505/EPA 608
PCB-1221 <0.1 <0.1 <0.1 <0.1 µg/L EPA 505/EPA 608
PCB-1232 <0.1 <0.1 <0.1 <0.1 µg/L EPA 505/EPA 608
PCB-1242 <0.1 <0.1 <0.1 <0.1 µg/L EPA 505/EPA 608
PCB-1248 <0.1 <0.1 <0.1 <0.1 µg/L EPA 505/EPA 608
PCB-1254 <0.1 <0.1 <0.1 <0.1 µg/L EPA 505/EPA 608
PCB-1260 <0.1 <0.1 <0.1 <0.1 µg/L EPA 505/EPA 608
Toxaphene <0.1 <0.1 <0.1 <0.1 µg/L EPA 505/EPA 608
EPA Priority Pollutants - Miscellaneous
Cyanide <20 <20 <20 <20 µg/L OIA-1677, DW
2,3,7,8-TCDD Scan ND ND ND ND µg/L EPA 1613B / EPA 625ND: Non-detect NA: Not Analyzed
Page 3 of 15
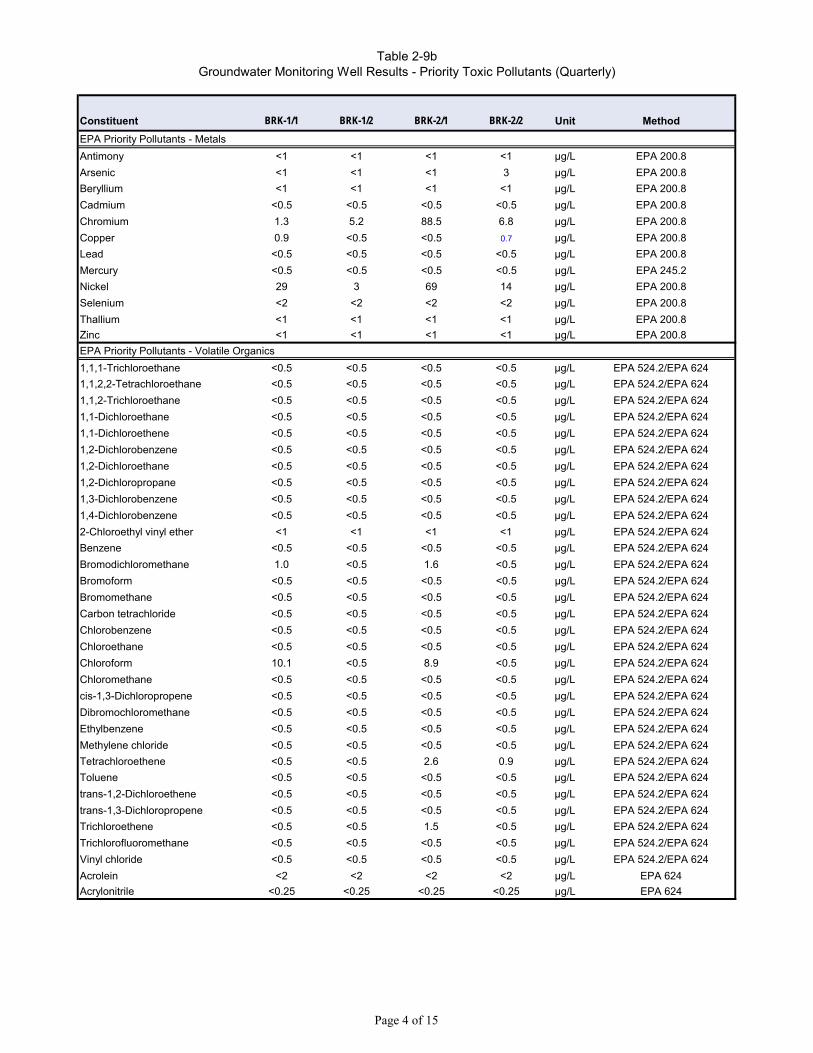
Constituent BRK-1/1 BRK-1/2 BRK-2/1 BRK-2/2 Unit Method
EPA Priority Pollutants - Metals
Antimony <1 <1 <1 <1 µg/L EPA 200.8
Arsenic <1 <1 <1 3 µg/L EPA 200.8
Beryllium <1 <1 <1 <1 µg/L EPA 200.8
Cadmium <0.5 <0.5 <0.5 <0.5 µg/L EPA 200.8
Chromium 1.3 5.2 88.5 6.8 µg/L EPA 200.8
Copper 0.9 <0.5 <0.5 0.7 µg/L EPA 200.8
Lead <0.5 <0.5 <0.5 <0.5 µg/L EPA 200.8
Mercury <0.5 <0.5 <0.5 <0.5 µg/L EPA 245.2
Nickel 29 3 69 14 µg/L EPA 200.8
Selenium <2 <2 <2 <2 µg/L EPA 200.8
Thallium <1 <1 <1 <1 µg/L EPA 200.8
Zinc <1 <1 <1 <1 µg/L EPA 200.8
EPA Priority Pollutants - Volatile Organics
1,1,1-Trichloroethane <0.5 <0.5 <0.5 <0.5 µg/L EPA 524.2/EPA 624
1,1,2,2-Tetrachloroethane <0.5 <0.5 <0.5 <0.5 µg/L EPA 524.2/EPA 624
1,1,2-Trichloroethane <0.5 <0.5 <0.5 <0.5 µg/L EPA 524.2/EPA 624
1,1-Dichloroethane <0.5 <0.5 <0.5 <0.5 µg/L EPA 524.2/EPA 624
1,1-Dichloroethene <0.5 <0.5 <0.5 <0.5 µg/L EPA 524.2/EPA 624
1,2-Dichlorobenzene <0.5 <0.5 <0.5 <0.5 µg/L EPA 524.2/EPA 624
1,2-Dichloroethane <0.5 <0.5 <0.5 <0.5 µg/L EPA 524.2/EPA 624
1,2-Dichloropropane <0.5 <0.5 <0.5 <0.5 µg/L EPA 524.2/EPA 624
1,3-Dichlorobenzene <0.5 <0.5 <0.5 <0.5 µg/L EPA 524.2/EPA 624
1,4-Dichlorobenzene <0.5 <0.5 <0.5 <0.5 µg/L EPA 524.2/EPA 624
2-Chloroethyl vinyl ether <1 <1 <1 <1 µg/L EPA 524.2/EPA 624
Benzene <0.5 <0.5 <0.5 <0.5 µg/L EPA 524.2/EPA 624
Bromodichloromethane 1.0 <0.5 1.6 <0.5 µg/L EPA 524.2/EPA 624
Bromoform <0.5 <0.5 <0.5 <0.5 µg/L EPA 524.2/EPA 624
Bromomethane <0.5 <0.5 <0.5 <0.5 µg/L EPA 524.2/EPA 624
Carbon tetrachloride <0.5 <0.5 <0.5 <0.5 µg/L EPA 524.2/EPA 624
Chlorobenzene <0.5 <0.5 <0.5 <0.5 µg/L EPA 524.2/EPA 624
Chloroethane <0.5 <0.5 <0.5 <0.5 µg/L EPA 524.2/EPA 624
Chloroform 10.1 <0.5 8.9 <0.5 µg/L EPA 524.2/EPA 624
Chloromethane <0.5 <0.5 <0.5 <0.5 µg/L EPA 524.2/EPA 624
cis-1,3-Dichloropropene <0.5 <0.5 <0.5 <0.5 µg/L EPA 524.2/EPA 624
Dibromochloromethane <0.5 <0.5 <0.5 <0.5 µg/L EPA 524.2/EPA 624
Ethylbenzene <0.5 <0.5 <0.5 <0.5 µg/L EPA 524.2/EPA 624
Methylene chloride <0.5 <0.5 <0.5 <0.5 µg/L EPA 524.2/EPA 624
Tetrachloroethene <0.5 <0.5 2.6 0.9 µg/L EPA 524.2/EPA 624
Toluene <0.5 <0.5 <0.5 <0.5 µg/L EPA 524.2/EPA 624
trans-1,2-Dichloroethene <0.5 <0.5 <0.5 <0.5 µg/L EPA 524.2/EPA 624
trans-1,3-Dichloropropene <0.5 <0.5 <0.5 <0.5 µg/L EPA 524.2/EPA 624
Trichloroethene <0.5 <0.5 1.5 <0.5 µg/L EPA 524.2/EPA 624
Trichlorofluoromethane <0.5 <0.5 <0.5 <0.5 µg/L EPA 524.2/EPA 624
Vinyl chloride <0.5 <0.5 <0.5 <0.5 µg/L EPA 524.2/EPA 624
Acrolein <2 <2 <2 <2 µg/L EPA 624
Acrylonitrile <0.25 <0.25 <0.25 <0.25 µg/L EPA 624
Table 2-9bGroundwater Monitoring Well Results - Priority Toxic Pollutants (Quarterly)
Page 4 of 15
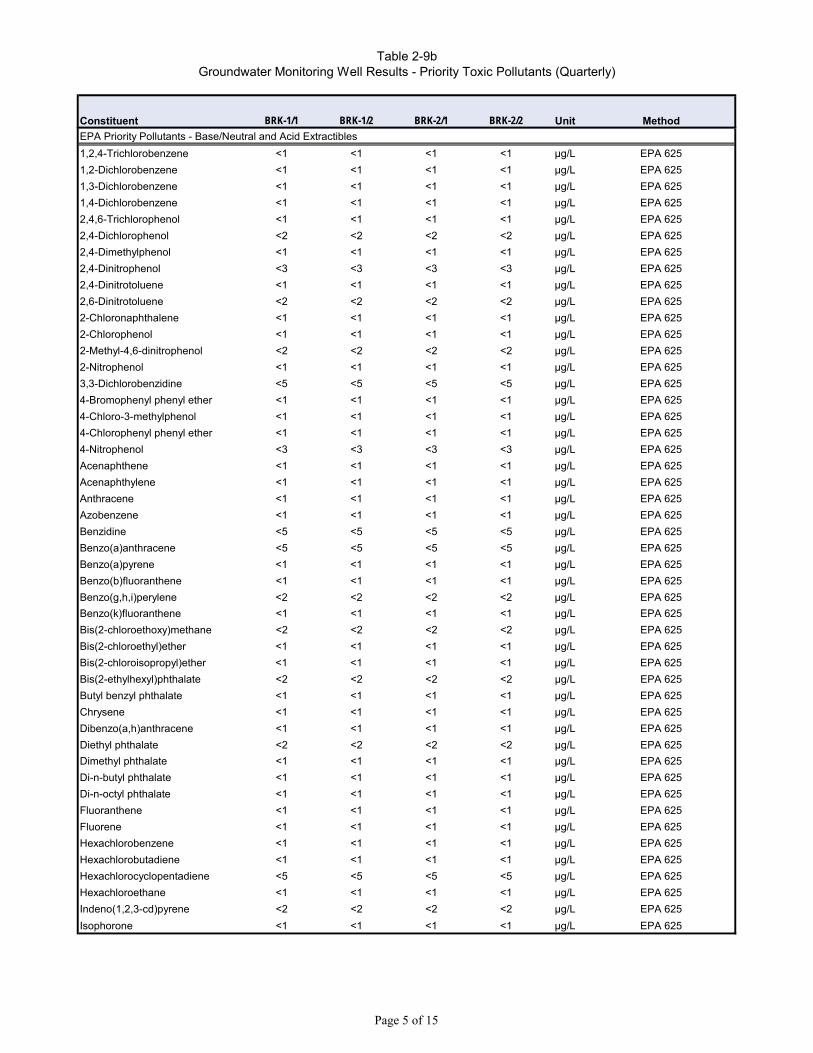
Constituent BRK-1/1 BRK-1/2 BRK-2/1 BRK-2/2 Unit Method
Table 2-9bGroundwater Monitoring Well Results - Priority Toxic Pollutants (Quarterly)
EPA Priority Pollutants - Base/Neutral and Acid Extractibles
1,2,4-Trichlorobenzene <1 <1 <1 <1 µg/L EPA 625
1,2-Dichlorobenzene <1 <1 <1 <1 µg/L EPA 625
1,3-Dichlorobenzene <1 <1 <1 <1 µg/L EPA 625
1,4-Dichlorobenzene <1 <1 <1 <1 µg/L EPA 625
2,4,6-Trichlorophenol <1 <1 <1 <1 µg/L EPA 625
2,4-Dichlorophenol <2 <2 <2 <2 µg/L EPA 625
2,4-Dimethylphenol <1 <1 <1 <1 µg/L EPA 625
2,4-Dinitrophenol <3 <3 <3 <3 µg/L EPA 625
2,4-Dinitrotoluene <1 <1 <1 <1 µg/L EPA 625
2,6-Dinitrotoluene <2 <2 <2 <2 µg/L EPA 625
2-Chloronaphthalene <1 <1 <1 <1 µg/L EPA 625
2-Chlorophenol <1 <1 <1 <1 µg/L EPA 625
2-Methyl-4,6-dinitrophenol <2 <2 <2 <2 µg/L EPA 625
2-Nitrophenol <1 <1 <1 <1 µg/L EPA 625
3,3-Dichlorobenzidine <5 <5 <5 <5 µg/L EPA 625
4-Bromophenyl phenyl ether <1 <1 <1 <1 µg/L EPA 625
4-Chloro-3-methylphenol <1 <1 <1 <1 µg/L EPA 625
4-Chlorophenyl phenyl ether <1 <1 <1 <1 µg/L EPA 625
4-Nitrophenol <3 <3 <3 <3 µg/L EPA 625
Acenaphthene <1 <1 <1 <1 µg/L EPA 625
Acenaphthylene <1 <1 <1 <1 µg/L EPA 625
Anthracene <1 <1 <1 <1 µg/L EPA 625
Azobenzene <1 <1 <1 <1 µg/L EPA 625
Benzidine <5 <5 <5 <5 µg/L EPA 625
Benzo(a)anthracene <5 <5 <5 <5 µg/L EPA 625
Benzo(a)pyrene <1 <1 <1 <1 µg/L EPA 625
Benzo(b)fluoranthene <1 <1 <1 <1 µg/L EPA 625
Benzo(g,h,i)perylene <2 <2 <2 <2 µg/L EPA 625
Benzo(k)fluoranthene <1 <1 <1 <1 µg/L EPA 625
Bis(2-chloroethoxy)methane <2 <2 <2 <2 µg/L EPA 625
Bis(2-chloroethyl)ether <1 <1 <1 <1 µg/L EPA 625
Bis(2-chloroisopropyl)ether <1 <1 <1 <1 µg/L EPA 625
Bis(2-ethylhexyl)phthalate <2 <2 <2 <2 µg/L EPA 625
Butyl benzyl phthalate <1 <1 <1 <1 µg/L EPA 625
Chrysene <1 <1 <1 <1 µg/L EPA 625
Dibenzo(a,h)anthracene <1 <1 <1 <1 µg/L EPA 625
Diethyl phthalate <2 <2 <2 <2 µg/L EPA 625
Dimethyl phthalate <1 <1 <1 <1 µg/L EPA 625
Di-n-butyl phthalate <1 <1 <1 <1 µg/L EPA 625
Di-n-octyl phthalate <1 <1 <1 <1 µg/L EPA 625
Fluoranthene <1 <1 <1 <1 µg/L EPA 625
Fluorene <1 <1 <1 <1 µg/L EPA 625
Hexachlorobenzene <1 <1 <1 <1 µg/L EPA 625
Hexachlorobutadiene <1 <1 <1 <1 µg/L EPA 625
Hexachlorocyclopentadiene <5 <5 <5 <5 µg/L EPA 625
Hexachloroethane <1 <1 <1 <1 µg/L EPA 625
Indeno(1,2,3-cd)pyrene <2 <2 <2 <2 µg/L EPA 625
Isophorone <1 <1 <1 <1 µg/L EPA 625
Page 5 of 15
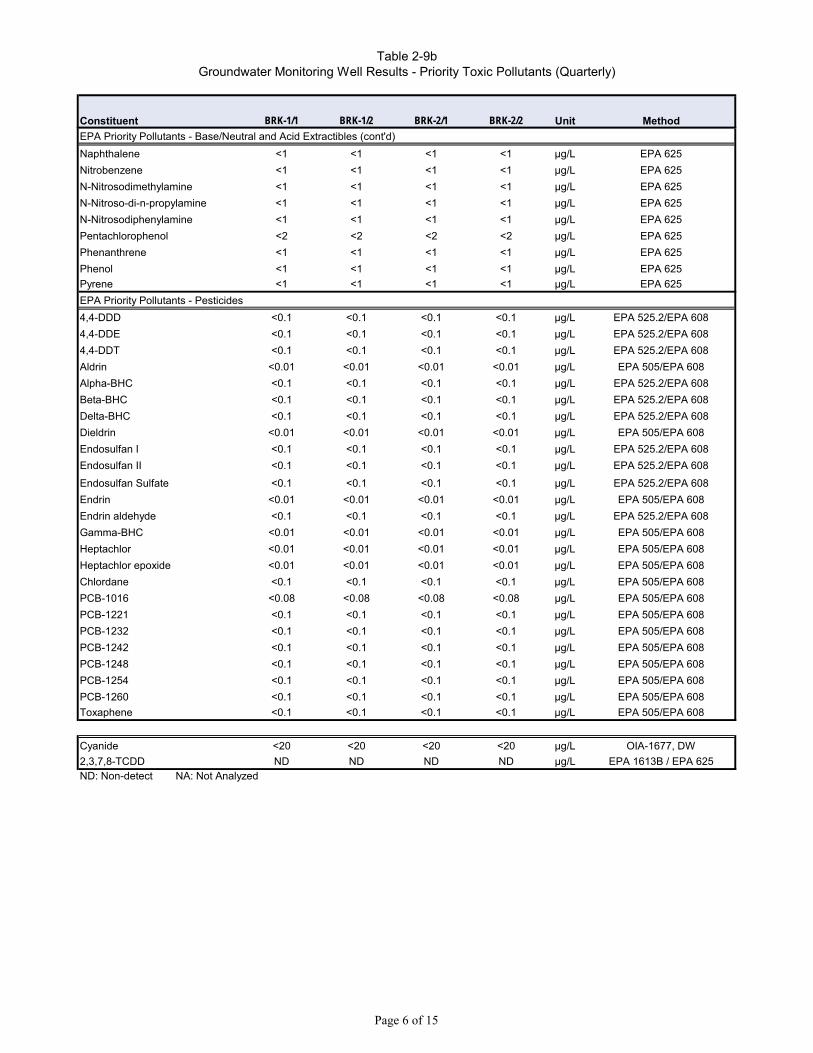
Constituent BRK-1/1 BRK-1/2 BRK-2/1 BRK-2/2 Unit Method
Table 2-9bGroundwater Monitoring Well Results - Priority Toxic Pollutants (Quarterly)
EPA Priority Pollutants - Base/Neutral and Acid Extractibles (cont'd)
Naphthalene <1 <1 <1 <1 µg/L EPA 625
Nitrobenzene <1 <1 <1 <1 µg/L EPA 625
N-Nitrosodimethylamine <1 <1 <1 <1 µg/L EPA 625
N-Nitroso-di-n-propylamine <1 <1 <1 <1 µg/L EPA 625
N-Nitrosodiphenylamine <1 <1 <1 <1 µg/L EPA 625
Pentachlorophenol <2 <2 <2 <2 µg/L EPA 625
Phenanthrene <1 <1 <1 <1 µg/L EPA 625
Phenol <1 <1 <1 <1 µg/L EPA 625
Pyrene <1 <1 <1 <1 µg/L EPA 625
EPA Priority Pollutants - Pesticides
4,4-DDD <0.1 <0.1 <0.1 <0.1 µg/L EPA 525.2/EPA 608
4,4-DDE <0.1 <0.1 <0.1 <0.1 µg/L EPA 525.2/EPA 608
4,4-DDT <0.1 <0.1 <0.1 <0.1 µg/L EPA 525.2/EPA 608
Aldrin <0.01 <0.01 <0.01 <0.01 µg/L EPA 505/EPA 608
Alpha-BHC <0.1 <0.1 <0.1 <0.1 µg/L EPA 525.2/EPA 608
Beta-BHC <0.1 <0.1 <0.1 <0.1 µg/L EPA 525.2/EPA 608
Delta-BHC <0.1 <0.1 <0.1 <0.1 µg/L EPA 525.2/EPA 608
Dieldrin <0.01 <0.01 <0.01 <0.01 µg/L EPA 505/EPA 608
Endosulfan I <0.1 <0.1 <0.1 <0.1 µg/L EPA 525.2/EPA 608
Endosulfan II <0.1 <0.1 <0.1 <0.1 µg/L EPA 525.2/EPA 608
Endosulfan Sulfate <0.1 <0.1 <0.1 <0.1 µg/L EPA 525.2/EPA 608
Endrin <0.01 <0.01 <0.01 <0.01 µg/L EPA 505/EPA 608
Endrin aldehyde <0.1 <0.1 <0.1 <0.1 µg/L EPA 525.2/EPA 608
Gamma-BHC <0.01 <0.01 <0.01 <0.01 µg/L EPA 505/EPA 608
Heptachlor <0.01 <0.01 <0.01 <0.01 µg/L EPA 505/EPA 608
Heptachlor epoxide <0.01 <0.01 <0.01 <0.01 µg/L EPA 505/EPA 608
Chlordane <0.1 <0.1 <0.1 <0.1 µg/L EPA 505/EPA 608
PCB-1016 <0.08 <0.08 <0.08 <0.08 µg/L EPA 505/EPA 608
PCB-1221 <0.1 <0.1 <0.1 <0.1 µg/L EPA 505/EPA 608
PCB-1232 <0.1 <0.1 <0.1 <0.1 µg/L EPA 505/EPA 608
PCB-1242 <0.1 <0.1 <0.1 <0.1 µg/L EPA 505/EPA 608
PCB-1248 <0.1 <0.1 <0.1 <0.1 µg/L EPA 505/EPA 608
PCB-1254 <0.1 <0.1 <0.1 <0.1 µg/L EPA 505/EPA 608
PCB-1260 <0.1 <0.1 <0.1 <0.1 µg/L EPA 505/EPA 608
Toxaphene <0.1 <0.1 <0.1 <0.1 µg/L EPA 505/EPA 608
Cyanide <20 <20 <20 <20 µg/L OIA-1677, DW
2,3,7,8-TCDD ND ND ND ND µg/L EPA 1613B / EPA 625ND: Non-detect NA: Not Analyzed
Page 6 of 15

Constituent BH-1/2 Ely MW2 DCZ-1/1 DCZ-2 Unit Method
EPA Priority Pollutants - Metals
Antimony <1 <1 <1 <1 µg/L EPA 200.8
Arsenic <1 <1 <1 <1 µg/L EPA 200.8
Beryllium <1 <1 <1 <1 µg/L EPA 200.8
Cadmium <0.5 <0.5 <0.5 <0.5 µg/L EPA 200.8
Chromium 1.0 3.9 0.6 3.0 µg/L EPA 200.8
Copper 0.6 0.9 1.0 1.0 µg/L EPA 200.8
Lead <0.5 <0.5 <0.5 <0.5 µg/L EPA 200.8
Mercury <0.5 <0.5 <0.5 <0.5 µg/L EPA 245.2
Nickel 24 8 143 7 µg/L EPA 200.8
Selenium <2 <2 <2 <2 µg/L EPA 200.8
Thallium <1 <1 <1 <1 µg/L EPA 200.8
Zinc <1 <1 <1 202 µg/L EPA 200.8
EPA Priority Pollutants - Volatile Organics
1,1,1-Trichloroethane <0.5 <0.5 <0.5 <0.5 µg/L EPA 524.2/EPA 624
1,1,2,2-Tetrachloroethane <0.5 <0.5 <0.5 <0.5 µg/L EPA 524.2/EPA 624
1,1,2-Trichloroethane <0.5 <0.5 <0.5 <0.5 µg/L EPA 524.2/EPA 624
1,1-Dichloroethane <0.5 <0.5 <0.5 <0.5 µg/L EPA 524.2/EPA 624
1,1-Dichloroethene <0.5 <0.5 <0.5 <0.5 µg/L EPA 524.2/EPA 624
1,2-Dichlorobenzene <0.5 <0.5 <0.5 <0.5 µg/L EPA 524.2/EPA 624
1,2-Dichloroethane <0.5 <0.5 <0.5 <0.5 µg/L EPA 524.2/EPA 624
1,2-Dichloropropane <0.5 <0.5 <0.5 <0.5 µg/L EPA 524.2/EPA 624
1,3-Dichlorobenzene <0.5 <0.5 <0.5 <0.5 µg/L EPA 524.2/EPA 624
1,4-Dichlorobenzene <0.5 <0.5 <0.5 <0.5 µg/L EPA 524.2/EPA 624
2-Chloroethyl vinyl ether <1 <1 <1 <1 µg/L EPA 524.2/EPA 624
Benzene <0.5 <0.5 <0.5 <0.5 µg/L EPA 524.2/EPA 624
Bromodichloromethane <0.5 <0.5 <0.5 <0.5 µg/L EPA 524.2/EPA 624
Bromoform <0.5 <0.5 <0.5 <0.5 µg/L EPA 524.2/EPA 624
Bromomethane <0.5 <0.5 <0.5 <0.5 µg/L EPA 524.2/EPA 624
Carbon tetrachloride <0.5 <0.5 <0.5 <0.5 µg/L EPA 524.2/EPA 624
Chlorobenzene <0.5 <0.5 <0.5 <0.5 µg/L EPA 524.2/EPA 624
Chloroethane <0.5 <0.5 <0.5 <0.5 µg/L EPA 524.2/EPA 624
Chloroform 29.5 4.8 <0.5 <0.5 µg/L EPA 524.2/EPA 624
Chloromethane <0.5 <0.5 <0.5 <0.5 µg/L EPA 524.2/EPA 624
cis-1,3-Dichloropropene <0.5 <0.5 <0.5 <0.5 µg/L EPA 524.2/EPA 624
Dibromochloromethane <0.5 <0.5 <0.5 <0.5 µg/L EPA 524.2/EPA 624
Ethylbenzene <0.5 <0.5 <0.5 <0.5 µg/L EPA 524.2/EPA 624
Methylene chloride <0.5 <0.5 <0.5 <0.5 µg/L EPA 524.2/EPA 624
Tetrachloroethene <0.5 <0.5 <0.5 <0.5 µg/L EPA 524.2/EPA 624
Toluene <0.5 <0.5 <0.5 <0.5 µg/L EPA 524.2/EPA 624
trans-1,2-Dichloroethene <0.5 <0.5 <0.5 <0.5 µg/L EPA 524.2/EPA 624
trans-1,3-Dichloropropene <0.5 <0.5 <0.5 <0.5 µg/L EPA 524.2/EPA 624
Trichloroethene <0.5 <0.5 <0.5 <0.5 µg/L EPA 524.2/EPA 624
Trichlorofluoromethane <0.5 <0.5 <0.5 <0.5 µg/L EPA 524.2/EPA 624
Vinyl chloride <0.5 <0.5 <0.5 <0.5 µg/L EPA 524.2/EPA 624
Acrolein <2 <2 <2 <2 µg/L EPA 624
Acrylonitrile <0.25 <0.25 <0.25 <0.25 µg/L EPA 624
Table 2-9bGroundwater Monitoring Well Results - Priority Toxic Pollutants (Quarterly)
Page 7 of 15
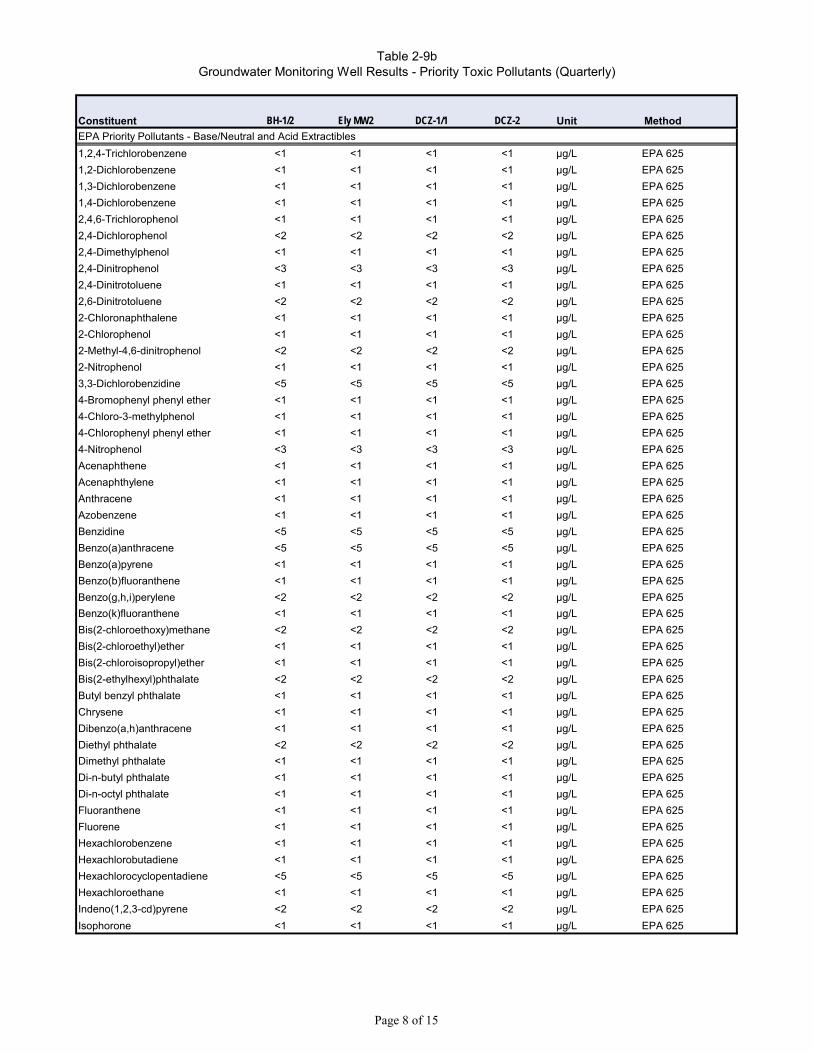
Constituent BH-1/2 Ely MW2 DCZ-1/1 DCZ-2 Unit Method
Table 2-9bGroundwater Monitoring Well Results - Priority Toxic Pollutants (Quarterly)
EPA Priority Pollutants - Base/Neutral and Acid Extractibles
1,2,4-Trichlorobenzene <1 <1 <1 <1 µg/L EPA 625
1,2-Dichlorobenzene <1 <1 <1 <1 µg/L EPA 625
1,3-Dichlorobenzene <1 <1 <1 <1 µg/L EPA 625
1,4-Dichlorobenzene <1 <1 <1 <1 µg/L EPA 625
2,4,6-Trichlorophenol <1 <1 <1 <1 µg/L EPA 625
2,4-Dichlorophenol <2 <2 <2 <2 µg/L EPA 625
2,4-Dimethylphenol <1 <1 <1 <1 µg/L EPA 625
2,4-Dinitrophenol <3 <3 <3 <3 µg/L EPA 625
2,4-Dinitrotoluene <1 <1 <1 <1 µg/L EPA 625
2,6-Dinitrotoluene <2 <2 <2 <2 µg/L EPA 625
2-Chloronaphthalene <1 <1 <1 <1 µg/L EPA 625
2-Chlorophenol <1 <1 <1 <1 µg/L EPA 625
2-Methyl-4,6-dinitrophenol <2 <2 <2 <2 µg/L EPA 625
2-Nitrophenol <1 <1 <1 <1 µg/L EPA 625
3,3-Dichlorobenzidine <5 <5 <5 <5 µg/L EPA 625
4-Bromophenyl phenyl ether <1 <1 <1 <1 µg/L EPA 625
4-Chloro-3-methylphenol <1 <1 <1 <1 µg/L EPA 625
4-Chlorophenyl phenyl ether <1 <1 <1 <1 µg/L EPA 625
4-Nitrophenol <3 <3 <3 <3 µg/L EPA 625
Acenaphthene <1 <1 <1 <1 µg/L EPA 625
Acenaphthylene <1 <1 <1 <1 µg/L EPA 625
Anthracene <1 <1 <1 <1 µg/L EPA 625
Azobenzene <1 <1 <1 <1 µg/L EPA 625
Benzidine <5 <5 <5 <5 µg/L EPA 625
Benzo(a)anthracene <5 <5 <5 <5 µg/L EPA 625
Benzo(a)pyrene <1 <1 <1 <1 µg/L EPA 625
Benzo(b)fluoranthene <1 <1 <1 <1 µg/L EPA 625
Benzo(g,h,i)perylene <2 <2 <2 <2 µg/L EPA 625
Benzo(k)fluoranthene <1 <1 <1 <1 µg/L EPA 625
Bis(2-chloroethoxy)methane <2 <2 <2 <2 µg/L EPA 625
Bis(2-chloroethyl)ether <1 <1 <1 <1 µg/L EPA 625
Bis(2-chloroisopropyl)ether <1 <1 <1 <1 µg/L EPA 625
Bis(2-ethylhexyl)phthalate <2 <2 <2 <2 µg/L EPA 625
Butyl benzyl phthalate <1 <1 <1 <1 µg/L EPA 625
Chrysene <1 <1 <1 <1 µg/L EPA 625
Dibenzo(a,h)anthracene <1 <1 <1 <1 µg/L EPA 625
Diethyl phthalate <2 <2 <2 <2 µg/L EPA 625
Dimethyl phthalate <1 <1 <1 <1 µg/L EPA 625
Di-n-butyl phthalate <1 <1 <1 <1 µg/L EPA 625
Di-n-octyl phthalate <1 <1 <1 <1 µg/L EPA 625
Fluoranthene <1 <1 <1 <1 µg/L EPA 625
Fluorene <1 <1 <1 <1 µg/L EPA 625
Hexachlorobenzene <1 <1 <1 <1 µg/L EPA 625
Hexachlorobutadiene <1 <1 <1 <1 µg/L EPA 625
Hexachlorocyclopentadiene <5 <5 <5 <5 µg/L EPA 625
Hexachloroethane <1 <1 <1 <1 µg/L EPA 625
Indeno(1,2,3-cd)pyrene <2 <2 <2 <2 µg/L EPA 625
Isophorone <1 <1 <1 <1 µg/L EPA 625
Page 8 of 15
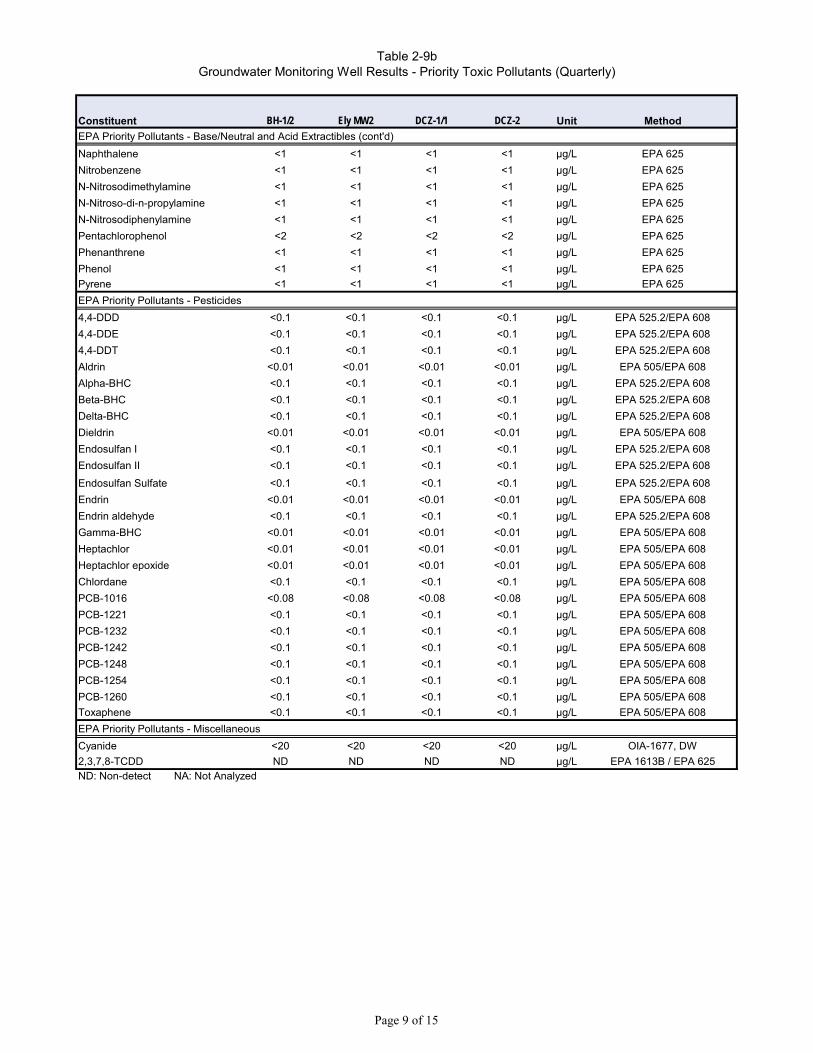
Constituent BH-1/2 Ely MW2 DCZ-1/1 DCZ-2 Unit Method
Table 2-9bGroundwater Monitoring Well Results - Priority Toxic Pollutants (Quarterly)
EPA Priority Pollutants - Base/Neutral and Acid Extractibles (cont'd)
Naphthalene <1 <1 <1 <1 µg/L EPA 625
Nitrobenzene <1 <1 <1 <1 µg/L EPA 625
N-Nitrosodimethylamine <1 <1 <1 <1 µg/L EPA 625
N-Nitroso-di-n-propylamine <1 <1 <1 <1 µg/L EPA 625
N-Nitrosodiphenylamine <1 <1 <1 <1 µg/L EPA 625
Pentachlorophenol <2 <2 <2 <2 µg/L EPA 625
Phenanthrene <1 <1 <1 <1 µg/L EPA 625
Phenol <1 <1 <1 <1 µg/L EPA 625
Pyrene <1 <1 <1 <1 µg/L EPA 625
EPA Priority Pollutants - Pesticides
4,4-DDD <0.1 <0.1 <0.1 <0.1 µg/L EPA 525.2/EPA 608
4,4-DDE <0.1 <0.1 <0.1 <0.1 µg/L EPA 525.2/EPA 608
4,4-DDT <0.1 <0.1 <0.1 <0.1 µg/L EPA 525.2/EPA 608
Aldrin <0.01 <0.01 <0.01 <0.01 µg/L EPA 505/EPA 608
Alpha-BHC <0.1 <0.1 <0.1 <0.1 µg/L EPA 525.2/EPA 608
Beta-BHC <0.1 <0.1 <0.1 <0.1 µg/L EPA 525.2/EPA 608
Delta-BHC <0.1 <0.1 <0.1 <0.1 µg/L EPA 525.2/EPA 608
Dieldrin <0.01 <0.01 <0.01 <0.01 µg/L EPA 505/EPA 608
Endosulfan I <0.1 <0.1 <0.1 <0.1 µg/L EPA 525.2/EPA 608
Endosulfan II <0.1 <0.1 <0.1 <0.1 µg/L EPA 525.2/EPA 608
Endosulfan Sulfate <0.1 <0.1 <0.1 <0.1 µg/L EPA 525.2/EPA 608
Endrin <0.01 <0.01 <0.01 <0.01 µg/L EPA 505/EPA 608
Endrin aldehyde <0.1 <0.1 <0.1 <0.1 µg/L EPA 525.2/EPA 608
Gamma-BHC <0.01 <0.01 <0.01 <0.01 µg/L EPA 505/EPA 608
Heptachlor <0.01 <0.01 <0.01 <0.01 µg/L EPA 505/EPA 608
Heptachlor epoxide <0.01 <0.01 <0.01 <0.01 µg/L EPA 505/EPA 608
Chlordane <0.1 <0.1 <0.1 <0.1 µg/L EPA 505/EPA 608
PCB-1016 <0.08 <0.08 <0.08 <0.08 µg/L EPA 505/EPA 608
PCB-1221 <0.1 <0.1 <0.1 <0.1 µg/L EPA 505/EPA 608
PCB-1232 <0.1 <0.1 <0.1 <0.1 µg/L EPA 505/EPA 608
PCB-1242 <0.1 <0.1 <0.1 <0.1 µg/L EPA 505/EPA 608
PCB-1248 <0.1 <0.1 <0.1 <0.1 µg/L EPA 505/EPA 608
PCB-1254 <0.1 <0.1 <0.1 <0.1 µg/L EPA 505/EPA 608
PCB-1260 <0.1 <0.1 <0.1 <0.1 µg/L EPA 505/EPA 608
Toxaphene <0.1 <0.1 <0.1 <0.1 µg/L EPA 505/EPA 608
EPA Priority Pollutants - Miscellaneous
Cyanide <20 <20 <20 <20 µg/L OIA-1677, DW
2,3,7,8-TCDD ND ND ND ND µg/L EPA 1613B / EPA 625ND: Non-detect NA: Not Analyzed
Page 9 of 15
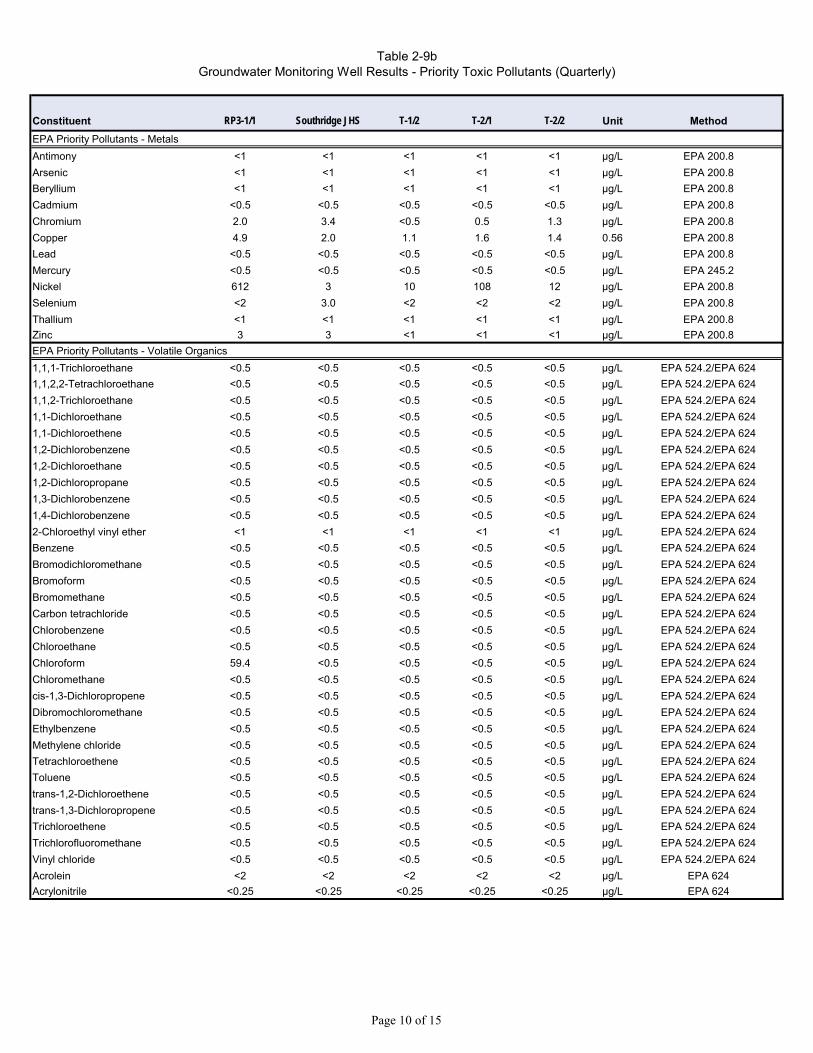
Constituent RP3-1/1 Southridge JHS T-1/2 T-2/1 T-2/2 Unit Method
EPA Priority Pollutants - Metals
Antimony <1 <1 <1 <1 <1 µg/L EPA 200.8
Arsenic <1 <1 <1 <1 <1 µg/L EPA 200.8
Beryllium <1 <1 <1 <1 <1 µg/L EPA 200.8
Cadmium <0.5 <0.5 <0.5 <0.5 <0.5 µg/L EPA 200.8
Chromium 2.0 3.4 <0.5 0.5 1.3 µg/L EPA 200.8
Copper 4.9 2.0 1.1 1.6 1.4 0.56 EPA 200.8
Lead <0.5 <0.5 <0.5 <0.5 <0.5 µg/L EPA 200.8
Mercury <0.5 <0.5 <0.5 <0.5 <0.5 µg/L EPA 245.2
Nickel 612 3 10 108 12 µg/L EPA 200.8
Selenium <2 3.0 <2 <2 <2 µg/L EPA 200.8
Thallium <1 <1 <1 <1 <1 µg/L EPA 200.8
Zinc 3 3 <1 <1 <1 µg/L EPA 200.8
EPA Priority Pollutants - Volatile Organics
1,1,1-Trichloroethane <0.5 <0.5 <0.5 <0.5 <0.5 µg/L EPA 524.2/EPA 624
1,1,2,2-Tetrachloroethane <0.5 <0.5 <0.5 <0.5 <0.5 µg/L EPA 524.2/EPA 624
1,1,2-Trichloroethane <0.5 <0.5 <0.5 <0.5 <0.5 µg/L EPA 524.2/EPA 624
1,1-Dichloroethane <0.5 <0.5 <0.5 <0.5 <0.5 µg/L EPA 524.2/EPA 624
1,1-Dichloroethene <0.5 <0.5 <0.5 <0.5 <0.5 µg/L EPA 524.2/EPA 624
1,2-Dichlorobenzene <0.5 <0.5 <0.5 <0.5 <0.5 µg/L EPA 524.2/EPA 624
1,2-Dichloroethane <0.5 <0.5 <0.5 <0.5 <0.5 µg/L EPA 524.2/EPA 624
1,2-Dichloropropane <0.5 <0.5 <0.5 <0.5 <0.5 µg/L EPA 524.2/EPA 624
1,3-Dichlorobenzene <0.5 <0.5 <0.5 <0.5 <0.5 µg/L EPA 524.2/EPA 624
1,4-Dichlorobenzene <0.5 <0.5 <0.5 <0.5 <0.5 µg/L EPA 524.2/EPA 624
2-Chloroethyl vinyl ether <1 <1 <1 <1 <1 µg/L EPA 524.2/EPA 624
Benzene <0.5 <0.5 <0.5 <0.5 <0.5 µg/L EPA 524.2/EPA 624
Bromodichloromethane <0.5 <0.5 <0.5 <0.5 <0.5 µg/L EPA 524.2/EPA 624
Bromoform <0.5 <0.5 <0.5 <0.5 <0.5 µg/L EPA 524.2/EPA 624
Bromomethane <0.5 <0.5 <0.5 <0.5 <0.5 µg/L EPA 524.2/EPA 624
Carbon tetrachloride <0.5 <0.5 <0.5 <0.5 <0.5 µg/L EPA 524.2/EPA 624
Chlorobenzene <0.5 <0.5 <0.5 <0.5 <0.5 µg/L EPA 524.2/EPA 624
Chloroethane <0.5 <0.5 <0.5 <0.5 <0.5 µg/L EPA 524.2/EPA 624
Chloroform 59.4 <0.5 <0.5 <0.5 <0.5 µg/L EPA 524.2/EPA 624
Chloromethane <0.5 <0.5 <0.5 <0.5 <0.5 µg/L EPA 524.2/EPA 624
cis-1,3-Dichloropropene <0.5 <0.5 <0.5 <0.5 <0.5 µg/L EPA 524.2/EPA 624
Dibromochloromethane <0.5 <0.5 <0.5 <0.5 <0.5 µg/L EPA 524.2/EPA 624
Ethylbenzene <0.5 <0.5 <0.5 <0.5 <0.5 µg/L EPA 524.2/EPA 624
Methylene chloride <0.5 <0.5 <0.5 <0.5 <0.5 µg/L EPA 524.2/EPA 624
Tetrachloroethene <0.5 <0.5 <0.5 <0.5 <0.5 µg/L EPA 524.2/EPA 624
Toluene <0.5 <0.5 <0.5 <0.5 <0.5 µg/L EPA 524.2/EPA 624
trans-1,2-Dichloroethene <0.5 <0.5 <0.5 <0.5 <0.5 µg/L EPA 524.2/EPA 624
trans-1,3-Dichloropropene <0.5 <0.5 <0.5 <0.5 <0.5 µg/L EPA 524.2/EPA 624
Trichloroethene <0.5 <0.5 <0.5 <0.5 <0.5 µg/L EPA 524.2/EPA 624
Trichlorofluoromethane <0.5 <0.5 <0.5 <0.5 <0.5 µg/L EPA 524.2/EPA 624
Vinyl chloride <0.5 <0.5 <0.5 <0.5 <0.5 µg/L EPA 524.2/EPA 624
Acrolein <2 <2 <2 <2 <2 µg/L EPA 624
Acrylonitrile <0.25 <0.25 <0.25 <0.25 <0.25 µg/L EPA 624
Table 2-9bGroundwater Monitoring Well Results - Priority Toxic Pollutants (Quarterly)
Page 10 of 15
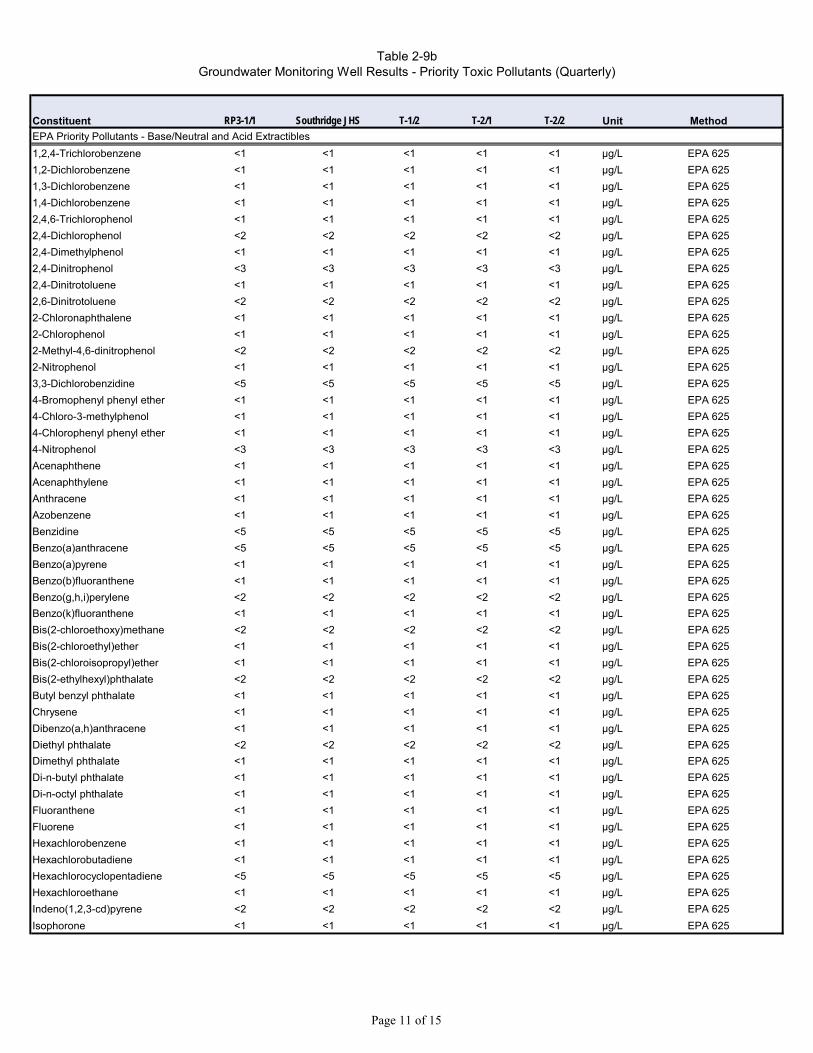
Constituent RP3-1/1 Southridge JHS T-1/2 T-2/1 T-2/2 Unit Method
Table 2-9bGroundwater Monitoring Well Results - Priority Toxic Pollutants (Quarterly)
EPA Priority Pollutants - Base/Neutral and Acid Extractibles
1,2,4-Trichlorobenzene <1 <1 <1 <1 <1 µg/L EPA 625
1,2-Dichlorobenzene <1 <1 <1 <1 <1 µg/L EPA 625
1,3-Dichlorobenzene <1 <1 <1 <1 <1 µg/L EPA 625
1,4-Dichlorobenzene <1 <1 <1 <1 <1 µg/L EPA 625
2,4,6-Trichlorophenol <1 <1 <1 <1 <1 µg/L EPA 625
2,4-Dichlorophenol <2 <2 <2 <2 <2 µg/L EPA 625
2,4-Dimethylphenol <1 <1 <1 <1 <1 µg/L EPA 625
2,4-Dinitrophenol <3 <3 <3 <3 <3 µg/L EPA 625
2,4-Dinitrotoluene <1 <1 <1 <1 <1 µg/L EPA 625
2,6-Dinitrotoluene <2 <2 <2 <2 <2 µg/L EPA 625
2-Chloronaphthalene <1 <1 <1 <1 <1 µg/L EPA 625
2-Chlorophenol <1 <1 <1 <1 <1 µg/L EPA 625
2-Methyl-4,6-dinitrophenol <2 <2 <2 <2 <2 µg/L EPA 625
2-Nitrophenol <1 <1 <1 <1 <1 µg/L EPA 625
3,3-Dichlorobenzidine <5 <5 <5 <5 <5 µg/L EPA 625
4-Bromophenyl phenyl ether <1 <1 <1 <1 <1 µg/L EPA 625
4-Chloro-3-methylphenol <1 <1 <1 <1 <1 µg/L EPA 625
4-Chlorophenyl phenyl ether <1 <1 <1 <1 <1 µg/L EPA 625
4-Nitrophenol <3 <3 <3 <3 <3 µg/L EPA 625
Acenaphthene <1 <1 <1 <1 <1 µg/L EPA 625
Acenaphthylene <1 <1 <1 <1 <1 µg/L EPA 625
Anthracene <1 <1 <1 <1 <1 µg/L EPA 625
Azobenzene <1 <1 <1 <1 <1 µg/L EPA 625
Benzidine <5 <5 <5 <5 <5 µg/L EPA 625
Benzo(a)anthracene <5 <5 <5 <5 <5 µg/L EPA 625
Benzo(a)pyrene <1 <1 <1 <1 <1 µg/L EPA 625
Benzo(b)fluoranthene <1 <1 <1 <1 <1 µg/L EPA 625
Benzo(g,h,i)perylene <2 <2 <2 <2 <2 µg/L EPA 625
Benzo(k)fluoranthene <1 <1 <1 <1 <1 µg/L EPA 625
Bis(2-chloroethoxy)methane <2 <2 <2 <2 <2 µg/L EPA 625
Bis(2-chloroethyl)ether <1 <1 <1 <1 <1 µg/L EPA 625
Bis(2-chloroisopropyl)ether <1 <1 <1 <1 <1 µg/L EPA 625
Bis(2-ethylhexyl)phthalate <2 <2 <2 <2 <2 µg/L EPA 625
Butyl benzyl phthalate <1 <1 <1 <1 <1 µg/L EPA 625
Chrysene <1 <1 <1 <1 <1 µg/L EPA 625
Dibenzo(a,h)anthracene <1 <1 <1 <1 <1 µg/L EPA 625
Diethyl phthalate <2 <2 <2 <2 <2 µg/L EPA 625
Dimethyl phthalate <1 <1 <1 <1 <1 µg/L EPA 625
Di-n-butyl phthalate <1 <1 <1 <1 <1 µg/L EPA 625
Di-n-octyl phthalate <1 <1 <1 <1 <1 µg/L EPA 625
Fluoranthene <1 <1 <1 <1 <1 µg/L EPA 625
Fluorene <1 <1 <1 <1 <1 µg/L EPA 625
Hexachlorobenzene <1 <1 <1 <1 <1 µg/L EPA 625
Hexachlorobutadiene <1 <1 <1 <1 <1 µg/L EPA 625
Hexachlorocyclopentadiene <5 <5 <5 <5 <5 µg/L EPA 625
Hexachloroethane <1 <1 <1 <1 <1 µg/L EPA 625
Indeno(1,2,3-cd)pyrene <2 <2 <2 <2 <2 µg/L EPA 625
Isophorone <1 <1 <1 <1 <1 µg/L EPA 625
Page 11 of 15
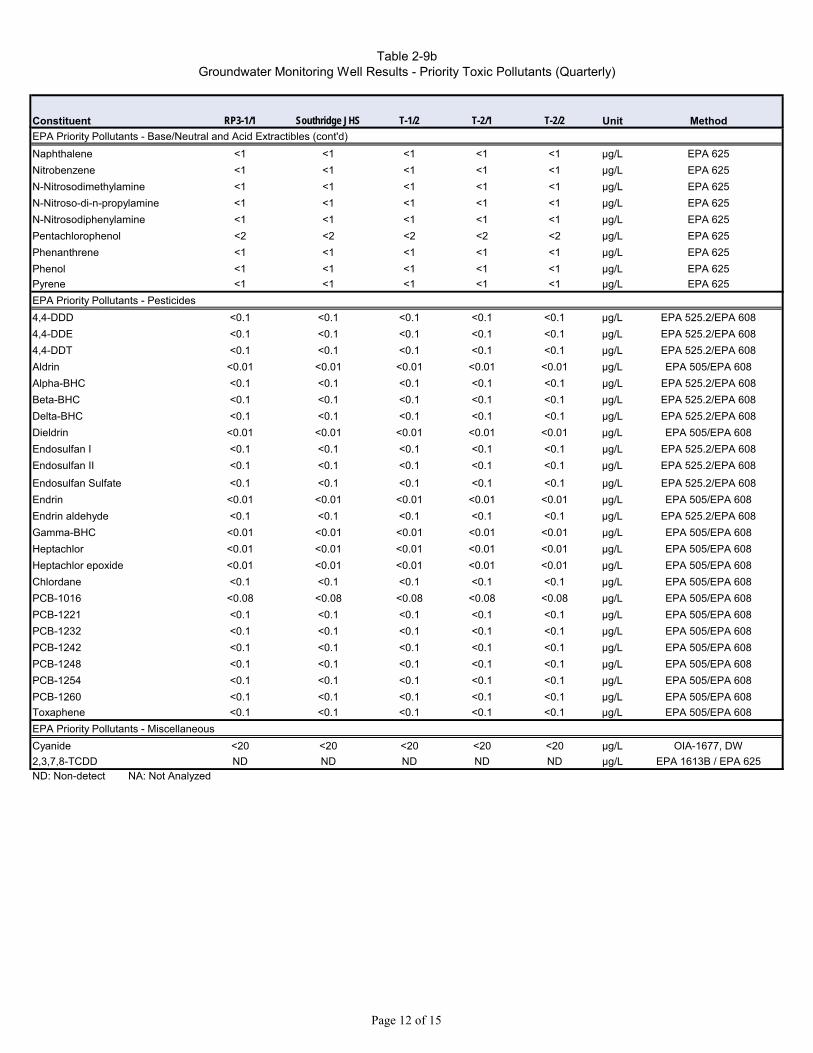
Constituent RP3-1/1 Southridge JHS T-1/2 T-2/1 T-2/2 Unit Method
Table 2-9bGroundwater Monitoring Well Results - Priority Toxic Pollutants (Quarterly)
EPA Priority Pollutants - Base/Neutral and Acid Extractibles (cont'd)
Naphthalene <1 <1 <1 <1 <1 µg/L EPA 625
Nitrobenzene <1 <1 <1 <1 <1 µg/L EPA 625
N-Nitrosodimethylamine <1 <1 <1 <1 <1 µg/L EPA 625
N-Nitroso-di-n-propylamine <1 <1 <1 <1 <1 µg/L EPA 625
N-Nitrosodiphenylamine <1 <1 <1 <1 <1 µg/L EPA 625
Pentachlorophenol <2 <2 <2 <2 <2 µg/L EPA 625
Phenanthrene <1 <1 <1 <1 <1 µg/L EPA 625
Phenol <1 <1 <1 <1 <1 µg/L EPA 625
Pyrene <1 <1 <1 <1 <1 µg/L EPA 625
EPA Priority Pollutants - Pesticides
4,4-DDD <0.1 <0.1 <0.1 <0.1 <0.1 µg/L EPA 525.2/EPA 608
4,4-DDE <0.1 <0.1 <0.1 <0.1 <0.1 µg/L EPA 525.2/EPA 608
4,4-DDT <0.1 <0.1 <0.1 <0.1 <0.1 µg/L EPA 525.2/EPA 608
Aldrin <0.01 <0.01 <0.01 <0.01 <0.01 µg/L EPA 505/EPA 608
Alpha-BHC <0.1 <0.1 <0.1 <0.1 <0.1 µg/L EPA 525.2/EPA 608
Beta-BHC <0.1 <0.1 <0.1 <0.1 <0.1 µg/L EPA 525.2/EPA 608
Delta-BHC <0.1 <0.1 <0.1 <0.1 <0.1 µg/L EPA 525.2/EPA 608
Dieldrin <0.01 <0.01 <0.01 <0.01 <0.01 µg/L EPA 505/EPA 608
Endosulfan I <0.1 <0.1 <0.1 <0.1 <0.1 µg/L EPA 525.2/EPA 608
Endosulfan II <0.1 <0.1 <0.1 <0.1 <0.1 µg/L EPA 525.2/EPA 608
Endosulfan Sulfate <0.1 <0.1 <0.1 <0.1 <0.1 µg/L EPA 525.2/EPA 608
Endrin <0.01 <0.01 <0.01 <0.01 <0.01 µg/L EPA 505/EPA 608
Endrin aldehyde <0.1 <0.1 <0.1 <0.1 <0.1 µg/L EPA 525.2/EPA 608
Gamma-BHC <0.01 <0.01 <0.01 <0.01 <0.01 µg/L EPA 505/EPA 608
Heptachlor <0.01 <0.01 <0.01 <0.01 <0.01 µg/L EPA 505/EPA 608
Heptachlor epoxide <0.01 <0.01 <0.01 <0.01 <0.01 µg/L EPA 505/EPA 608
Chlordane <0.1 <0.1 <0.1 <0.1 <0.1 µg/L EPA 505/EPA 608
PCB-1016 <0.08 <0.08 <0.08 <0.08 <0.08 µg/L EPA 505/EPA 608
PCB-1221 <0.1 <0.1 <0.1 <0.1 <0.1 µg/L EPA 505/EPA 608
PCB-1232 <0.1 <0.1 <0.1 <0.1 <0.1 µg/L EPA 505/EPA 608
PCB-1242 <0.1 <0.1 <0.1 <0.1 <0.1 µg/L EPA 505/EPA 608
PCB-1248 <0.1 <0.1 <0.1 <0.1 <0.1 µg/L EPA 505/EPA 608
PCB-1254 <0.1 <0.1 <0.1 <0.1 <0.1 µg/L EPA 505/EPA 608
PCB-1260 <0.1 <0.1 <0.1 <0.1 <0.1 µg/L EPA 505/EPA 608
Toxaphene <0.1 <0.1 <0.1 <0.1 <0.1 µg/L EPA 505/EPA 608
EPA Priority Pollutants - Miscellaneous
Cyanide <20 <20 <20 <20 <20 µg/L OIA-1677, DW
2,3,7,8-TCDD ND ND ND ND ND µg/L EPA 1613B / EPA 625ND: Non-detect NA: Not Analyzed
Page 12 of 15
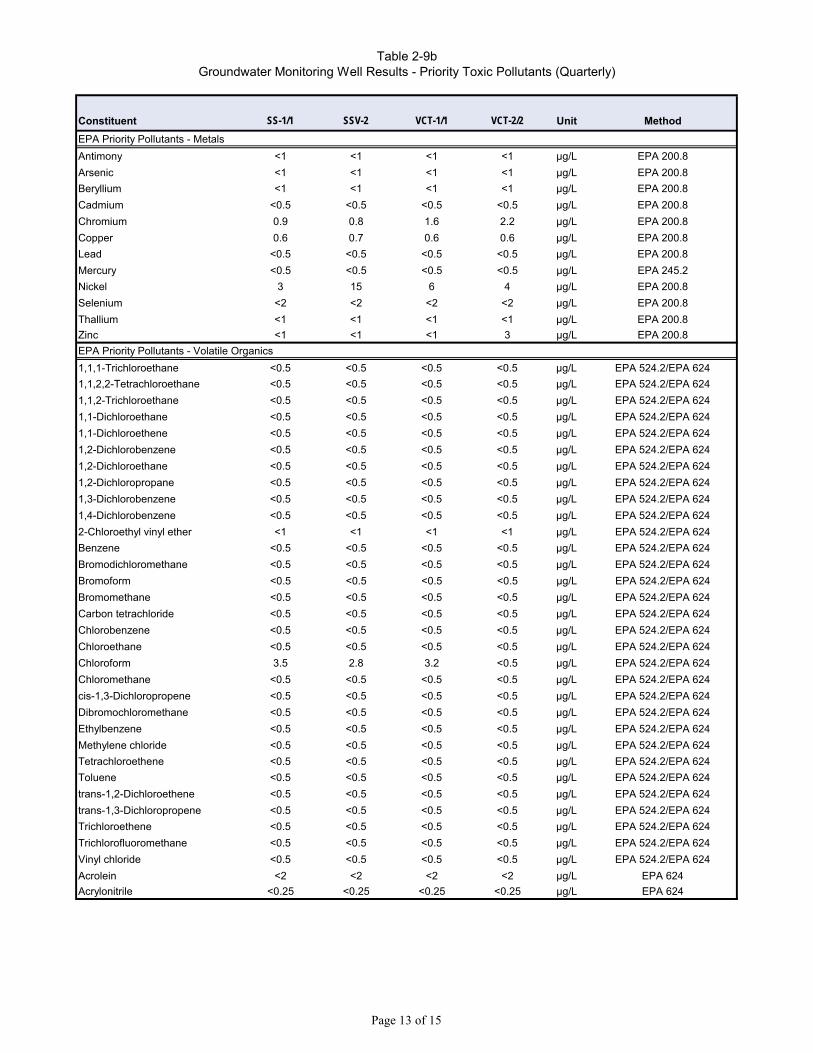
Constituent SS-1/1 SSV-2 VCT-1/1 VCT-2/2 Unit Method
EPA Priority Pollutants - Metals
Antimony <1 <1 <1 <1 µg/L EPA 200.8
Arsenic <1 <1 <1 <1 µg/L EPA 200.8
Beryllium <1 <1 <1 <1 µg/L EPA 200.8
Cadmium <0.5 <0.5 <0.5 <0.5 µg/L EPA 200.8
Chromium 0.9 0.8 1.6 2.2 µg/L EPA 200.8
Copper 0.6 0.7 0.6 0.6 µg/L EPA 200.8
Lead <0.5 <0.5 <0.5 <0.5 µg/L EPA 200.8
Mercury <0.5 <0.5 <0.5 <0.5 µg/L EPA 245.2
Nickel 3 15 6 4 µg/L EPA 200.8
Selenium <2 <2 <2 <2 µg/L EPA 200.8
Thallium <1 <1 <1 <1 µg/L EPA 200.8
Zinc <1 <1 <1 3 µg/L EPA 200.8
EPA Priority Pollutants - Volatile Organics
1,1,1-Trichloroethane <0.5 <0.5 <0.5 <0.5 µg/L EPA 524.2/EPA 624
1,1,2,2-Tetrachloroethane <0.5 <0.5 <0.5 <0.5 µg/L EPA 524.2/EPA 624
1,1,2-Trichloroethane <0.5 <0.5 <0.5 <0.5 µg/L EPA 524.2/EPA 624
1,1-Dichloroethane <0.5 <0.5 <0.5 <0.5 µg/L EPA 524.2/EPA 624
1,1-Dichloroethene <0.5 <0.5 <0.5 <0.5 µg/L EPA 524.2/EPA 624
1,2-Dichlorobenzene <0.5 <0.5 <0.5 <0.5 µg/L EPA 524.2/EPA 624
1,2-Dichloroethane <0.5 <0.5 <0.5 <0.5 µg/L EPA 524.2/EPA 624
1,2-Dichloropropane <0.5 <0.5 <0.5 <0.5 µg/L EPA 524.2/EPA 624
1,3-Dichlorobenzene <0.5 <0.5 <0.5 <0.5 µg/L EPA 524.2/EPA 624
1,4-Dichlorobenzene <0.5 <0.5 <0.5 <0.5 µg/L EPA 524.2/EPA 624
2-Chloroethyl vinyl ether <1 <1 <1 <1 µg/L EPA 524.2/EPA 624
Benzene <0.5 <0.5 <0.5 <0.5 µg/L EPA 524.2/EPA 624
Bromodichloromethane <0.5 <0.5 <0.5 <0.5 µg/L EPA 524.2/EPA 624
Bromoform <0.5 <0.5 <0.5 <0.5 µg/L EPA 524.2/EPA 624
Bromomethane <0.5 <0.5 <0.5 <0.5 µg/L EPA 524.2/EPA 624
Carbon tetrachloride <0.5 <0.5 <0.5 <0.5 µg/L EPA 524.2/EPA 624
Chlorobenzene <0.5 <0.5 <0.5 <0.5 µg/L EPA 524.2/EPA 624
Chloroethane <0.5 <0.5 <0.5 <0.5 µg/L EPA 524.2/EPA 624
Chloroform 3.5 2.8 3.2 <0.5 µg/L EPA 524.2/EPA 624
Chloromethane <0.5 <0.5 <0.5 <0.5 µg/L EPA 524.2/EPA 624
cis-1,3-Dichloropropene <0.5 <0.5 <0.5 <0.5 µg/L EPA 524.2/EPA 624
Dibromochloromethane <0.5 <0.5 <0.5 <0.5 µg/L EPA 524.2/EPA 624
Ethylbenzene <0.5 <0.5 <0.5 <0.5 µg/L EPA 524.2/EPA 624
Methylene chloride <0.5 <0.5 <0.5 <0.5 µg/L EPA 524.2/EPA 624
Tetrachloroethene <0.5 <0.5 <0.5 <0.5 µg/L EPA 524.2/EPA 624
Toluene <0.5 <0.5 <0.5 <0.5 µg/L EPA 524.2/EPA 624
trans-1,2-Dichloroethene <0.5 <0.5 <0.5 <0.5 µg/L EPA 524.2/EPA 624
trans-1,3-Dichloropropene <0.5 <0.5 <0.5 <0.5 µg/L EPA 524.2/EPA 624
Trichloroethene <0.5 <0.5 <0.5 <0.5 µg/L EPA 524.2/EPA 624
Trichlorofluoromethane <0.5 <0.5 <0.5 <0.5 µg/L EPA 524.2/EPA 624
Vinyl chloride <0.5 <0.5 <0.5 <0.5 µg/L EPA 524.2/EPA 624
Acrolein <2 <2 <2 <2 µg/L EPA 624
Acrylonitrile <0.25 <0.25 <0.25 <0.25 µg/L EPA 624
Table 2-9bGroundwater Monitoring Well Results - Priority Toxic Pollutants (Quarterly)
Page 13 of 15
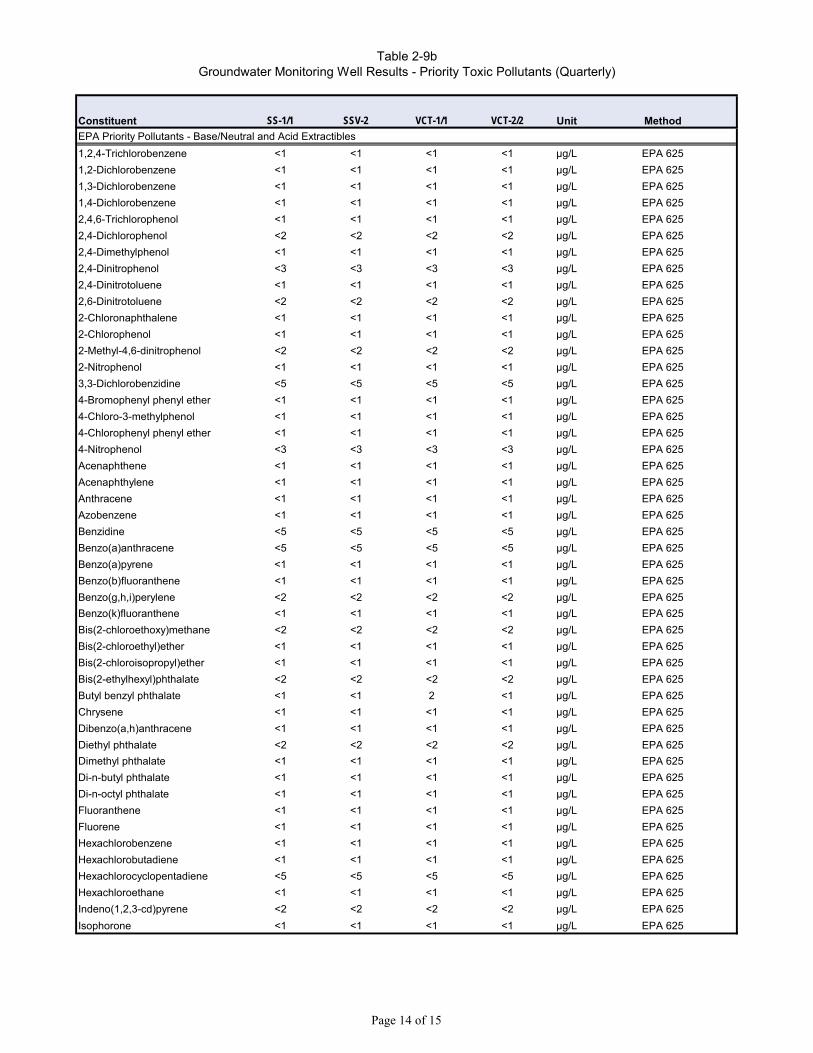
Constituent SS-1/1 SSV-2 VCT-1/1 VCT-2/2 Unit Method
Table 2-9bGroundwater Monitoring Well Results - Priority Toxic Pollutants (Quarterly)
EPA Priority Pollutants - Base/Neutral and Acid Extractibles
1,2,4-Trichlorobenzene <1 <1 <1 <1 µg/L EPA 625
1,2-Dichlorobenzene <1 <1 <1 <1 µg/L EPA 625
1,3-Dichlorobenzene <1 <1 <1 <1 µg/L EPA 625
1,4-Dichlorobenzene <1 <1 <1 <1 µg/L EPA 625
2,4,6-Trichlorophenol <1 <1 <1 <1 µg/L EPA 625
2,4-Dichlorophenol <2 <2 <2 <2 µg/L EPA 625
2,4-Dimethylphenol <1 <1 <1 <1 µg/L EPA 625
2,4-Dinitrophenol <3 <3 <3 <3 µg/L EPA 625
2,4-Dinitrotoluene <1 <1 <1 <1 µg/L EPA 625
2,6-Dinitrotoluene <2 <2 <2 <2 µg/L EPA 625
2-Chloronaphthalene <1 <1 <1 <1 µg/L EPA 625
2-Chlorophenol <1 <1 <1 <1 µg/L EPA 625
2-Methyl-4,6-dinitrophenol <2 <2 <2 <2 µg/L EPA 625
2-Nitrophenol <1 <1 <1 <1 µg/L EPA 625
3,3-Dichlorobenzidine <5 <5 <5 <5 µg/L EPA 625
4-Bromophenyl phenyl ether <1 <1 <1 <1 µg/L EPA 625
4-Chloro-3-methylphenol <1 <1 <1 <1 µg/L EPA 625
4-Chlorophenyl phenyl ether <1 <1 <1 <1 µg/L EPA 625
4-Nitrophenol <3 <3 <3 <3 µg/L EPA 625
Acenaphthene <1 <1 <1 <1 µg/L EPA 625
Acenaphthylene <1 <1 <1 <1 µg/L EPA 625
Anthracene <1 <1 <1 <1 µg/L EPA 625
Azobenzene <1 <1 <1 <1 µg/L EPA 625
Benzidine <5 <5 <5 <5 µg/L EPA 625
Benzo(a)anthracene <5 <5 <5 <5 µg/L EPA 625
Benzo(a)pyrene <1 <1 <1 <1 µg/L EPA 625
Benzo(b)fluoranthene <1 <1 <1 <1 µg/L EPA 625
Benzo(g,h,i)perylene <2 <2 <2 <2 µg/L EPA 625
Benzo(k)fluoranthene <1 <1 <1 <1 µg/L EPA 625
Bis(2-chloroethoxy)methane <2 <2 <2 <2 µg/L EPA 625
Bis(2-chloroethyl)ether <1 <1 <1 <1 µg/L EPA 625
Bis(2-chloroisopropyl)ether <1 <1 <1 <1 µg/L EPA 625
Bis(2-ethylhexyl)phthalate <2 <2 <2 <2 µg/L EPA 625
Butyl benzyl phthalate <1 <1 2 <1 µg/L EPA 625
Chrysene <1 <1 <1 <1 µg/L EPA 625
Dibenzo(a,h)anthracene <1 <1 <1 <1 µg/L EPA 625
Diethyl phthalate <2 <2 <2 <2 µg/L EPA 625
Dimethyl phthalate <1 <1 <1 <1 µg/L EPA 625
Di-n-butyl phthalate <1 <1 <1 <1 µg/L EPA 625
Di-n-octyl phthalate <1 <1 <1 <1 µg/L EPA 625
Fluoranthene <1 <1 <1 <1 µg/L EPA 625
Fluorene <1 <1 <1 <1 µg/L EPA 625
Hexachlorobenzene <1 <1 <1 <1 µg/L EPA 625
Hexachlorobutadiene <1 <1 <1 <1 µg/L EPA 625
Hexachlorocyclopentadiene <5 <5 <5 <5 µg/L EPA 625
Hexachloroethane <1 <1 <1 <1 µg/L EPA 625
Indeno(1,2,3-cd)pyrene <2 <2 <2 <2 µg/L EPA 625
Isophorone <1 <1 <1 <1 µg/L EPA 625
Page 14 of 15

Constituent SS-1/1 SSV-2 VCT-1/1 VCT-2/2 Unit Method
Table 2-9bGroundwater Monitoring Well Results - Priority Toxic Pollutants (Quarterly)
EPA Priority Pollutants - Base/Neutral and Acid Extractibles (cont'd)
Naphthalene <1 <1 <1 <1 µg/L EPA 625
Nitrobenzene <1 <1 <1 <1 µg/L EPA 625
N-Nitrosodimethylamine <1 <1 <1 <1 µg/L EPA 625
N-Nitroso-di-n-propylamine <1 <1 <1 <1 µg/L EPA 625
N-Nitrosodiphenylamine <1 <1 <1 <1 µg/L EPA 625
Pentachlorophenol <2 <2 <2 <2 µg/L EPA 625
Phenanthrene <1 <1 <1 <1 µg/L EPA 625
Phenol <1 <1 <1 <1 µg/L EPA 625
Pyrene <1 <1 <1 <1 µg/L EPA 625
EPA Priority Pollutants - Pesticides
4,4-DDD <0.1 <0.1 <0.1 <0.1 µg/L EPA 525.2/EPA 608
4,4-DDE <0.1 <0.1 <0.1 <0.1 µg/L EPA 525.2/EPA 608
4,4-DDT <0.1 <0.1 <0.1 <0.1 µg/L EPA 525.2/EPA 608
Aldrin <0.01 <0.01 <0.01 <0.01 µg/L EPA 505/EPA 608
Alpha-BHC <0.1 <0.1 <0.1 <0.1 µg/L EPA 525.2/EPA 608
Beta-BHC <0.1 <0.1 <0.1 <0.1 µg/L EPA 525.2/EPA 608
Delta-BHC <0.1 <0.1 <0.1 <0.1 µg/L EPA 525.2/EPA 608
Dieldrin <0.01 <0.01 <0.01 <0.01 µg/L EPA 505/EPA 608
Endosulfan I <0.1 <0.1 <0.1 <0.1 µg/L EPA 525.2/EPA 608
Endosulfan II <0.1 <0.1 <0.1 <0.1 µg/L EPA 525.2/EPA 608
Endosulfan Sulfate <0.1 <0.1 <0.1 <0.1 µg/L EPA 525.2/EPA 608
Endrin <0.01 <0.01 <0.01 <0.01 µg/L EPA 505/EPA 608
Endrin aldehyde <0.1 <0.1 <0.1 <0.1 µg/L EPA 525.2/EPA 608
Gamma-BHC <0.01 <0.01 <0.01 <0.01 µg/L EPA 505/EPA 608
Heptachlor <0.01 <0.01 <0.01 <0.01 µg/L EPA 505/EPA 608
Heptachlor epoxide <0.01 <0.01 <0.01 <0.01 µg/L EPA 505/EPA 608
Chlordane <0.1 <0.1 <0.1 <0.1 µg/L EPA 505/EPA 608
PCB-1016 <0.08 <0.08 <0.08 <0.08 µg/L EPA 505/EPA 608
PCB-1221 <0.1 <0.1 <0.1 <0.1 µg/L EPA 505/EPA 608
PCB-1232 <0.1 <0.1 <0.1 <0.1 µg/L EPA 505/EPA 608
PCB-1242 <0.1 <0.1 <0.1 <0.1 µg/L EPA 505/EPA 608
PCB-1248 <0.1 <0.1 <0.1 <0.1 µg/L EPA 505/EPA 608
PCB-1254 <0.1 <0.1 <0.1 <0.1 µg/L EPA 505/EPA 608
PCB-1260 <0.1 <0.1 <0.1 <0.1 µg/L EPA 505/EPA 608
Toxaphene <0.1 <0.1 <0.1 <0.1 µg/L EPA 505/EPA 608
EPA Priority Pollutants - Miscellaneous
Cyanide <20 <20 <20 <20 µg/L OIA-1677, DW
2,3,7,8-TCDD ND ND ND ND µg/L EPA 1613B / EPA 625ND: Non-detect NA: Not Analyzed
Page 15 of 15
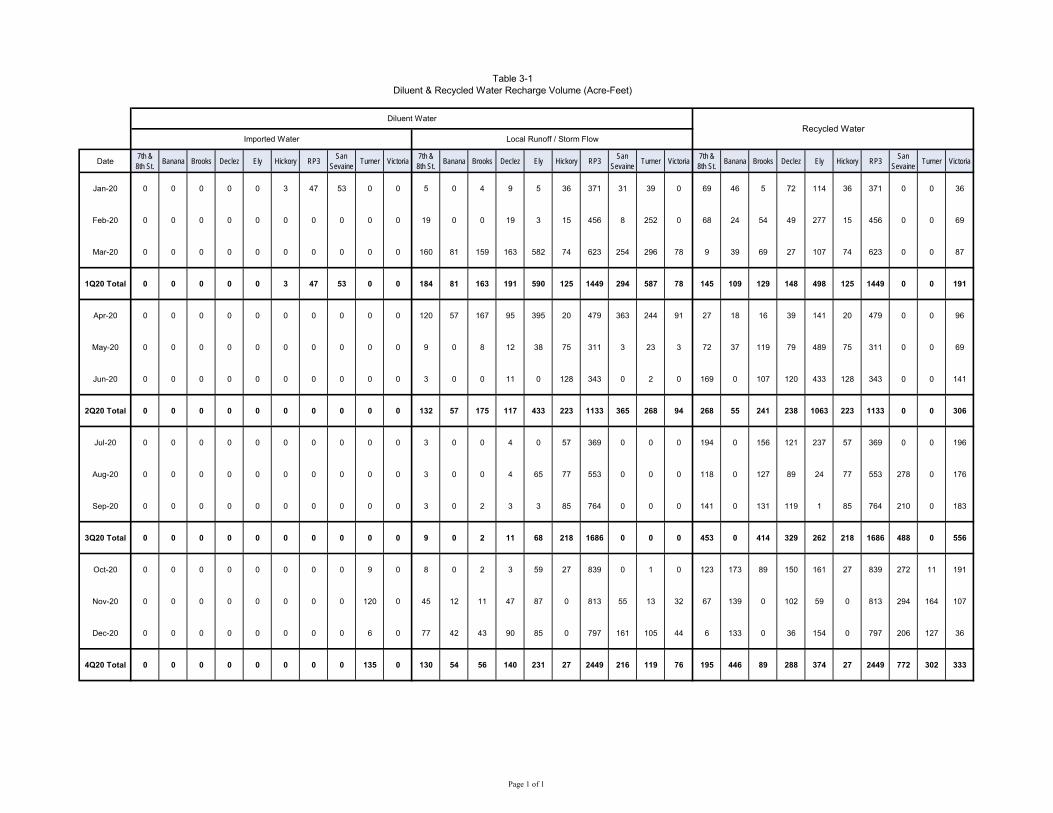
Date7th & 8th St. Banana Brooks Declez Ely Hickory RP3 San
Sevaine Turner Victoria 7th & 8th St. Banana Brooks Declez Ely Hickory RP3 San
Sevaine Turner Victoria 7th & 8th St. Banana Brooks Declez Ely Hickory RP3 San
Sevaine Turner Victoria
Jan-20 0 0 0 0 0 3 47 53 0 0 5 0 4 9 5 36 371 31 39 0 69 46 5 72 114 36 371 0 0 36
Feb-20 0 0 0 0 0 0 0 0 0 0 19 0 0 19 3 15 456 8 252 0 68 24 54 49 277 15 456 0 0 69
Mar-20 0 0 0 0 0 0 0 0 0 0 160 81 159 163 582 74 623 254 296 78 9 39 69 27 107 74 623 0 0 87
1Q20 Total 0 0 0 0 0 3 47 53 0 0 184 81 163 191 590 125 1449 294 587 78 145 109 129 148 498 125 1449 0 0 191
Apr-20 0 0 0 0 0 0 0 0 0 0 120 57 167 95 395 20 479 363 244 91 27 18 16 39 141 20 479 0 0 96
May-20 0 0 0 0 0 0 0 0 0 0 9 0 8 12 38 75 311 3 23 3 72 37 119 79 489 75 311 0 0 69
Jun-20 0 0 0 0 0 0 0 0 0 0 3 0 0 11 0 128 343 0 2 0 169 0 107 120 433 128 343 0 0 141
2Q20 Total 0 0 0 0 0 0 0 0 0 0 132 57 175 117 433 223 1133 365 268 94 268 55 241 238 1063 223 1133 0 0 306
Jul-20 0 0 0 0 0 0 0 0 0 0 3 0 0 4 0 57 369 0 0 0 194 0 156 121 237 57 369 0 0 196
Aug-20 0 0 0 0 0 0 0 0 0 0 3 0 0 4 65 77 553 0 0 0 118 0 127 89 24 77 553 278 0 176
Sep-20 0 0 0 0 0 0 0 0 0 0 3 0 2 3 3 85 764 0 0 0 141 0 131 119 1 85 764 210 0 183
3Q20 Total 0 0 0 0 0 0 0 0 0 0 9 0 2 11 68 218 1686 0 0 0 453 0 414 329 262 218 1686 488 0 556
Oct-20 0 0 0 0 0 0 0 0 9 0 8 0 2 3 59 27 839 0 1 0 123 173 89 150 161 27 839 272 11 191
Nov-20 0 0 0 0 0 0 0 0 120 0 45 12 11 47 87 0 813 55 13 32 67 139 0 102 59 0 813 294 164 107
Dec-20 0 0 0 0 0 0 0 0 6 0 77 42 43 90 85 0 797 161 105 44 6 133 0 36 154 0 797 206 127 36
4Q20 Total 0 0 0 0 0 0 0 0 135 0 130 54 56 140 231 27 2449 216 119 76 195 446 89 288 374 27 2449 772 302 333
Table 3-1Diluent & Recycled Water Recharge Volume (Acre-Feet)
Imported Water Local Runoff / Storm Flow
Diluent WaterRecycled Water
Page 1 of 1
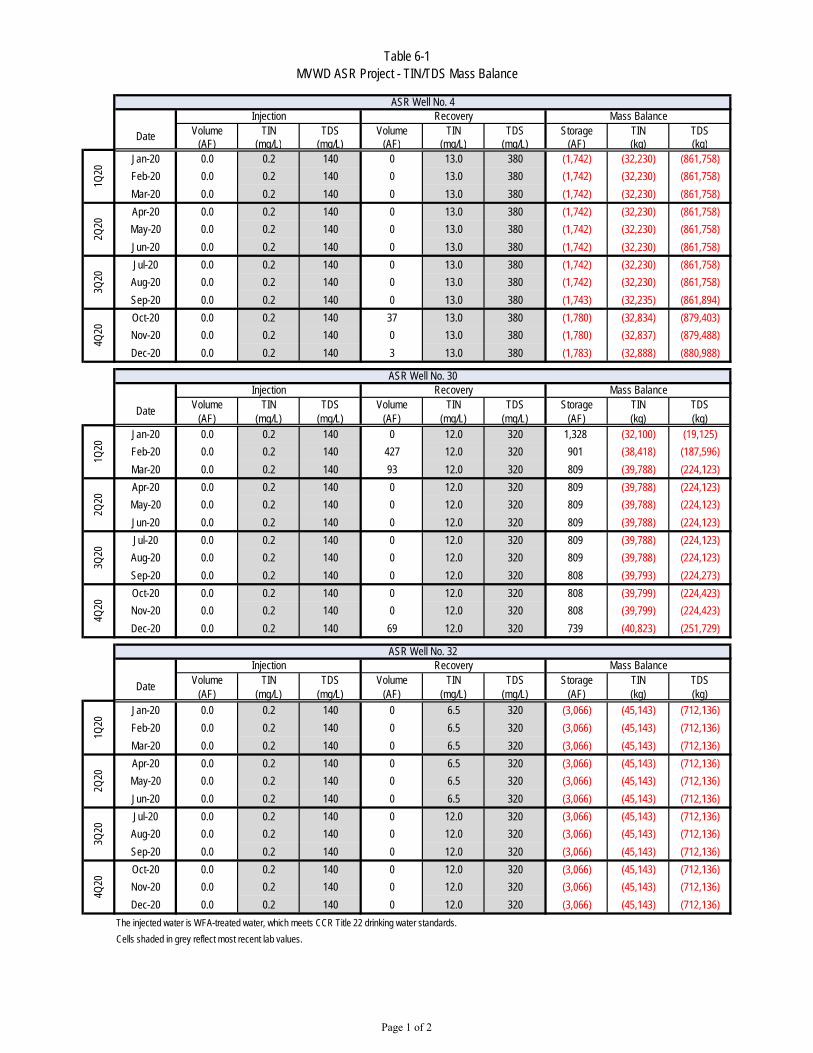
Volume TIN TDS Volume TIN TDS Storage TIN TDS(AF) (mg/L) (mg/L) (AF) (mg/L) (mg/L) (AF) (kg) (kg)
Jan-20 0.0 0.2 140 0 13.0 380 (1,742) (32,230) (861,758)Feb-20 0.0 0.2 140 0 13.0 380 (1,742) (32,230) (861,758)Mar-20 0.0 0.2 140 0 13.0 380 (1,742) (32,230) (861,758)Apr-20 0.0 0.2 140 0 13.0 380 (1,742) (32,230) (861,758)May-20 0.0 0.2 140 0 13.0 380 (1,742) (32,230) (861,758)Jun-20 0.0 0.2 140 0 13.0 380 (1,742) (32,230) (861,758)Jul-20 0.0 0.2 140 0 13.0 380 (1,742) (32,230) (861,758)Aug-20 0.0 0.2 140 0 13.0 380 (1,742) (32,230) (861,758)Sep-20 0.0 0.2 140 0 13.0 380 (1,743) (32,235) (861,894)Oct-20 0.0 0.2 140 37 13.0 380 (1,780) (32,834) (879,403)Nov-20 0.0 0.2 140 0 13.0 380 (1,780) (32,837) (879,488)Dec-20 0.0 0.2 140 3 13.0 380 (1,783) (32,888) (880,988)
Volume TIN TDS Volume TIN TDS Storage TIN TDS(AF) (mg/L) (mg/L) (AF) (mg/L) (mg/L) (AF) (kg) (kg)
Jan-20 0.0 0.2 140 0 12.0 320 1,328 (32,100) (19,125)Feb-20 0.0 0.2 140 427 12.0 320 901 (38,418) (187,596)Mar-20 0.0 0.2 140 93 12.0 320 809 (39,788) (224,123)Apr-20 0.0 0.2 140 0 12.0 320 809 (39,788) (224,123)May-20 0.0 0.2 140 0 12.0 320 809 (39,788) (224,123)Jun-20 0.0 0.2 140 0 12.0 320 809 (39,788) (224,123)Jul-20 0.0 0.2 140 0 12.0 320 809 (39,788) (224,123)Aug-20 0.0 0.2 140 0 12.0 320 809 (39,788) (224,123)Sep-20 0.0 0.2 140 0 12.0 320 808 (39,793) (224,273)Oct-20 0.0 0.2 140 0 12.0 320 808 (39,799) (224,423)Nov-20 0.0 0.2 140 0 12.0 320 808 (39,799) (224,423)Dec-20 0.0 0.2 140 69 12.0 320 739 (40,823) (251,729)
Volume TIN TDS Volume TIN TDS Storage TIN TDS(AF) (mg/L) (mg/L) (AF) (mg/L) (mg/L) (AF) (kg) (kg)
Jan-20 0.0 0.2 140 0 6.5 320 (3,066) (45,143) (712,136)Feb-20 0.0 0.2 140 0 6.5 320 (3,066) (45,143) (712,136)Mar-20 0.0 0.2 140 0 6.5 320 (3,066) (45,143) (712,136)Apr-20 0.0 0.2 140 0 6.5 320 (3,066) (45,143) (712,136)May-20 0.0 0.2 140 0 6.5 320 (3,066) (45,143) (712,136)Jun-20 0.0 0.2 140 0 6.5 320 (3,066) (45,143) (712,136)Jul-20 0.0 0.2 140 0 12.0 320 (3,066) (45,143) (712,136)Aug-20 0.0 0.2 140 0 12.0 320 (3,066) (45,143) (712,136)Sep-20 0.0 0.2 140 0 12.0 320 (3,066) (45,143) (712,136)Oct-20 0.0 0.2 140 0 12.0 320 (3,066) (45,143) (712,136)Nov-20 0.0 0.2 140 0 12.0 320 (3,066) (45,143) (712,136)Dec-20 0.0 0.2 140 0 12.0 320 (3,066) (45,143) (712,136)
The injected water is WFA-treated water, which meets CCR Title 22 drinking water standards. Data pending update from MVWDCells shaded in grey reflect most recent lab values.
3Q20
3Q20
3Q20
1Q20
1Q20
1Q20
2Q20
2Q20
2Q20
Table 6-1MVWD ASR Project - TIN/TDS Mass Balance
ASR Well No. 30Recovery
ASR Well No. 4Injection
Injection
Date
Recovery Mass Balance
Date
Mass Balance
RecoveryASR Well No. 32
Injection
Date
Mass Balance
4Q20
4Q20
4Q20
Page 1 of 2
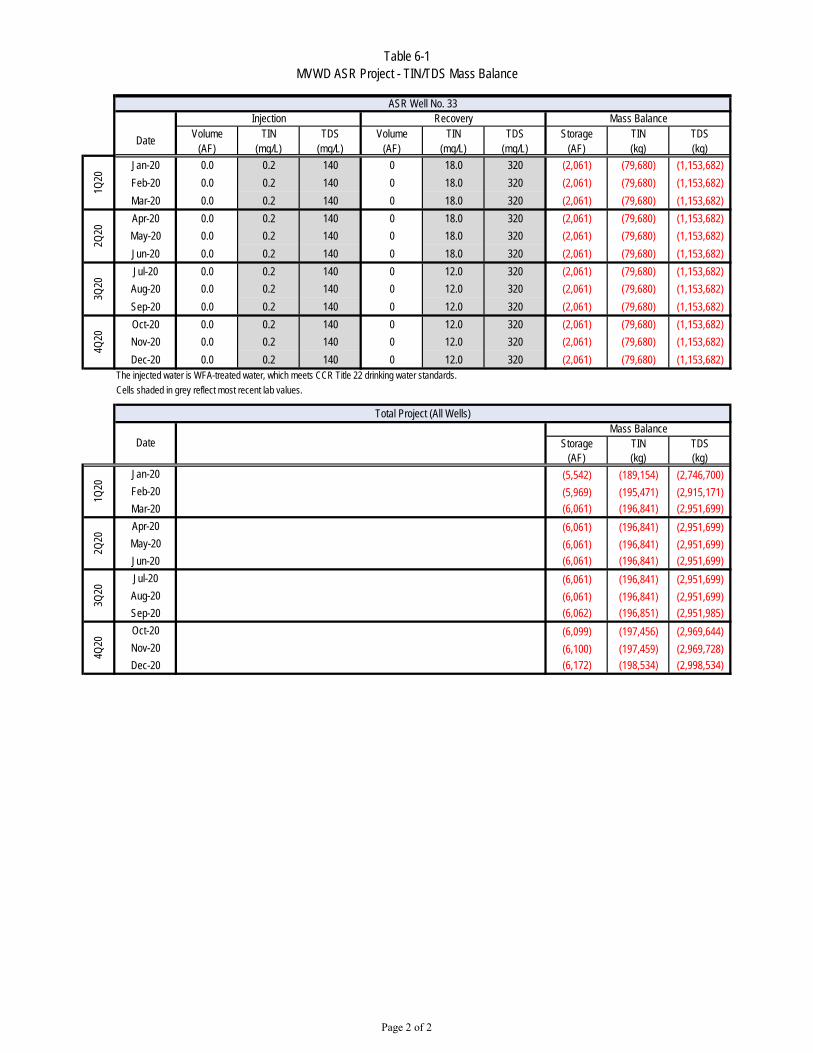
Table 6-1MVWD ASR Project - TIN/TDS Mass Balance
Volume TIN TDS Volume TIN TDS Storage TIN TDS(AF) (mg/L) (mg/L) (AF) (mg/L) (mg/L) (AF) (kg) (kg)
Jan-20 0.0 0.2 140 0 18.0 320 (2,061) (79,680) (1,153,682)Feb-20 0.0 0.2 140 0 18.0 320 (2,061) (79,680) (1,153,682)Mar-20 0.0 0.2 140 0 18.0 320 (2,061) (79,680) (1,153,682)Apr-20 0.0 0.2 140 0 18.0 320 (2,061) (79,680) (1,153,682)May-20 0.0 0.2 140 0 18.0 320 (2,061) (79,680) (1,153,682)Jun-20 0.0 0.2 140 0 18.0 320 (2,061) (79,680) (1,153,682)Jul-20 0.0 0.2 140 0 12.0 320 (2,061) (79,680) (1,153,682)Aug-20 0.0 0.2 140 0 12.0 320 (2,061) (79,680) (1,153,682)Sep-20 0.0 0.2 140 0 12.0 320 (2,061) (79,680) (1,153,682)Oct-20 0.0 0.2 140 0 12.0 320 (2,061) (79,680) (1,153,682)Nov-20 0.0 0.2 140 0 12.0 320 (2,061) (79,680) (1,153,682)Dec-20 0.0 0.2 140 0 12.0 320 (2,061) (79,680) (1,153,682)
The injected water is WFA-treated water, which meets CCR Title 22 drinking water standards. Data pending update from MVWDCells shaded in grey reflect most recent lab values.
Mass BalanceDate Storage TIN TDS
(AF) (kg) (kg)Jan-20 (5,542) (189,154) (2,746,700)Feb-20 (5,969) (195,471) (2,915,171)Mar-20 (6,061) (196,841) (2,951,699)Apr-20 (6,061) (196,841) (2,951,699)May-20 (6,061) (196,841) (2,951,699)Jun-20 (6,061) (196,841) (2,951,699)Jul-20 (6,061) (196,841) (2,951,699)Aug-20 (6,061) (196,841) (2,951,699)Sep-20 (6,062) (196,851) (2,951,985)Oct-20 (6,099) (197,456) (2,969,644)Nov-20 (6,100) (197,459) (2,969,728)Dec-20 (6,172) (198,534) (2,998,534)
2Q20
3Q20
3Q20
2Q20
1Q20
1Q20
Date
Mass BalanceASR Well No. 33
Injection Recovery
Total Project (All Wells)
4Q20
4Q20
Page 2 of 2
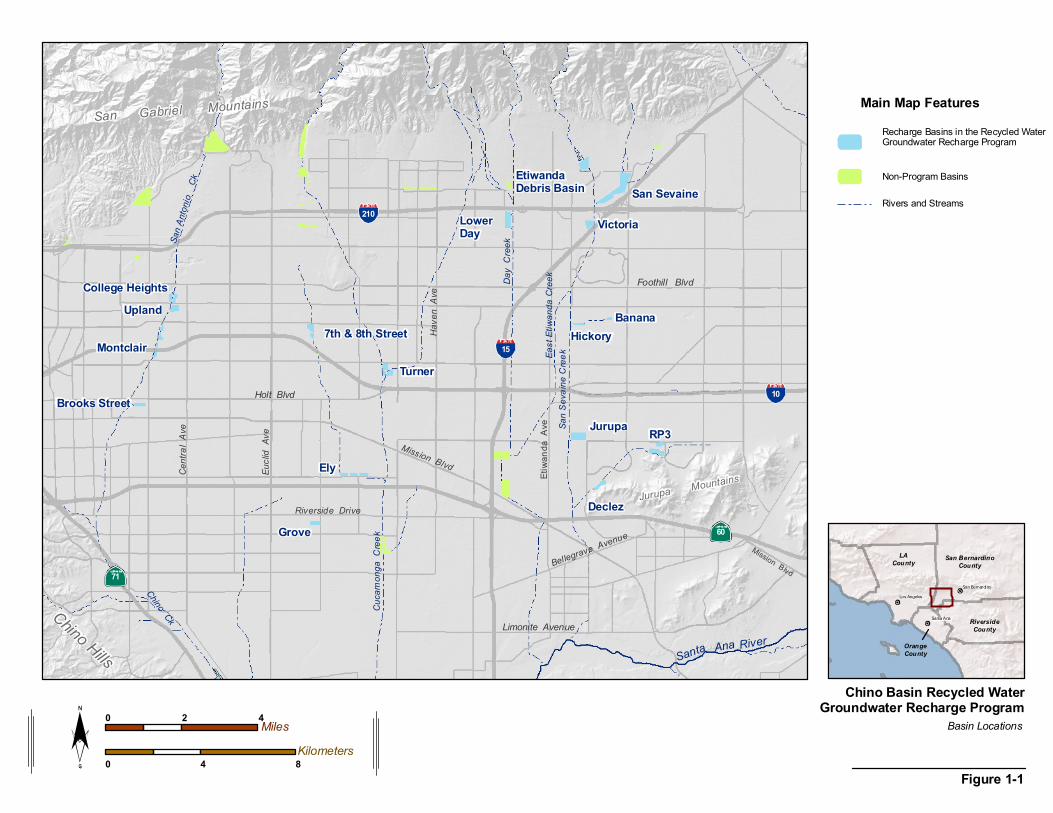
LACounty San Bernardino
County
RiversideCounty
OrangeCounty
Santa Ana
Los AngelesSan Bernardino
Chino Hills
Jurupa Mountains
San Gabriel Mountains
EtiwandaDebris Basin
San S
evain
e Cree
kEast
Etiwa
nda C
reek
60
10
15
210
71
Ely
Turner
Grove
River
Riverside Drive
Holt Blvd
Centr
al A
ve
Eucli
d Av
e
Mission Blvd
Bellegrave Avenue
Limonite Avenue
Etiwa
nda
Ave
Have
n Av
e Foothill Blvd
Mission Blvd
San A
ntonio
Ck
Chino Ck
Day
Cree
k
Santa Ana
Cuca
mong
a Cr
eek
Jurupa RP3
LowerDay
Declez
Victoria
Brooks Street
San Sevaine
HickoryUpland Banana
College Heights
7th & 8th StreetMontclair
Figure 1-1
Chino Basin Recycled WaterGroundwater Recharge Program
Main Map Features
Non-Program Basins
Rivers and Streams
0 2 4Miles
0 4 8Kilometers
Basin Locations
Recharge Basins in the Recycled WaterGroundwater Recharge Program
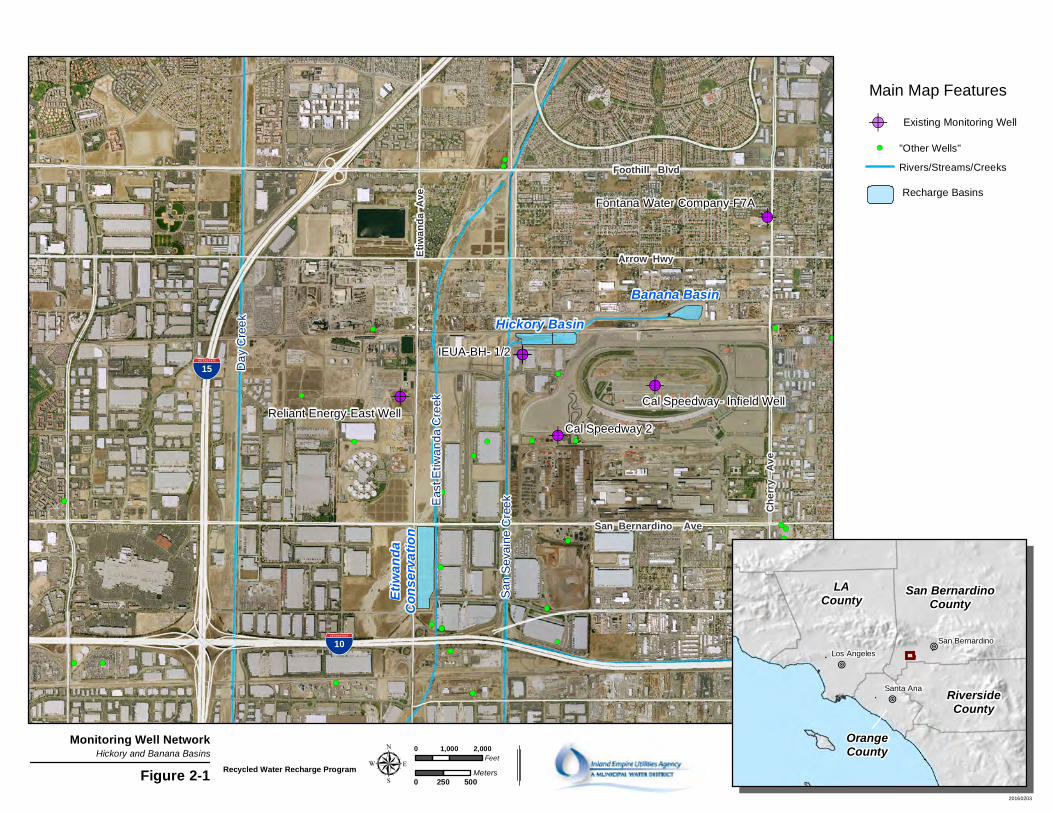
!(
!(
!(
!(
!(!(
!(
!(
!(
!(
!(
!(
!(
!(!(!(
!(
!(
!(
!(
!(
!(
!(!(
!(
!(
!(
!(
!(
!(
!(
!(
!(
!(
!(
!(!(
!(
!(
!(
!(
!(
!(
!(
!(
!(!(
!(
!(
!(!(
!(
!(
!(
!(
!(
!(
!(
!(
!(
!(
!(
!(
!(
!(
!(
!(
!(
!(
!(
!(
!(!(
!(
!(
!(
!(
!(
!(
!(
!(!(!(!(
!(
!(
!(!(
!(
!(
!(
!(
!(
!(
!(!(
!(
!(
!(
!(
!(
!(
!(!(
!(
!( !(
!(
!(
!( !(
!(
!(!(!( !( !(
!(
!(
!(
!(!(
!(!(
!(
!(!(
!(!(
!(!(
!(
!(
!(!(
!(
!(!(
!(!(!(!(!(!(
!(
!(
!(
!(
!(
!(
!(
!(
!(
!(
!(
!(
!(
!(
!(
!(
!(
!(!(
!(
!(!(!(!(
!(!(!(!(!(
!(!(!(!(!(!(!(
!(!(!(
!(
!(!(!(!(!(!(!( !(!(!(!(!(
!(!(!(!(!(!(!(!(
!(!(!(!(!(
!(!(!(!(!(!(!(!(!(
!(!(
!(!(
!(
!(
!(!(!(
!(
!(
!(!(
!(
!(!(
!(!(
!A
!A
!A
!A!A
!A
Cal Speedway 2
%&'(15
%&'(10
Reliant Energy-East WellCal Speedway- Infield Well
Fontana Water Company-F7A
IEUA-BH- 1/2
Foothill Blvd
San Bernardino Ave
Foothill Blvd
Cher
ry A
ve
Arrow HwyEtiw
anda
Ave
Hickory Basin
Etiw
anda
Cons
ervati
on
Banana Basin
Da
y C
ree
k
San
Se
vain
e C
ree
kEas
t E
tiwa
nd
a C
reek
Figure 2-1
Monitoring Well NetworkHickory and Banana Basins 0 1,000 2,000
Feet
0 250 500Meters
LACounty San Bernardino
County
RiversideCounty
OrangeCounty
Santa Ana
Los Angeles
San Bernardino
Recycled Water Recharge Program
!A Existing Monitoring Well
µ
!O
!O
!O
Main Map Features
20160203
!( "Other Wells"
Rivers/Streams/Creeks
Recharge Basins

!(
!(
!(
!(
!(
!(
!(
!(
!(
!(
!(
!(
!(
!(!(
!(
!(
!(
!(
!(
!(
!(
!(
!(!( !(
!(
!(
!(
!(
!(!(
!(
!(
!(
!(
!(!(
!(
!(
!(!(!( !(
!(
!(
!(
!(
!(
!(
!(
!(
!(
!( !(
!(
!(
!(
!( !(!(
!(
!(
!(
!(
!(
!(
!(
!(
!(
!(
!(
!( !(
!(
!(
!(
!(
!(
!(
!(!(
!(
!(
!(
!(
!(
!(
!(
!(
!(
!(!( !(!(!(
!(
!(!(!( !(
!(
!(
!(
!(
!(
!(
!(
!(
!(
!(
!(
!(
!(!(!(!(
!(
!(
!(
!(
!(
!(
!(
!(
!(
!( !(
!(
!(
!(
!(
!(
!(
!(
!(
!(
!(
!(
!(!(
!(
!(
!(
!(
!(
!( !(
!(
!(
!(
!(
!(
!(!(!(
!(
!(
!(
!(
!(
!(
!(!(
!(
!(
!(
!(!(
!(
!(
!(
!(!(
!( !(
!(
!(
!(
!(
!(
!(
!( !(
!(
!(
!(
!(
!(
!( !(
!(
!(!( !(!(
!(!(
!(
!(
!( !(
!(!(!(
!(
!(
!(
!(
!(
!(
!(
!(
!(
!(
!(!(
!(
!(
!(
!(
!(
!(
!(
!(
!( !(
!(
!(
!(!(!(!(
!(
!(
!(!( !( !(
!(
!(
!(!(
!(
!( !(
!(
!(
!(
!(
!(
!(
!(
!(
!(
!(!(
!(!(
!(
!(
!(
!(
!(
!(!(
!(
!(
!(
!(!(
!(
!( !(
!(
!(
!(
!(!(!(
!(
!(!(!(!(
!(
!(!(!(!(
!(
!(
!(
!(!(
!(
!(
!(
!(
!(
!(
!(
!( !(
!( !(!(
!(
!(
!(
!(
!(!(
!(
!(
!(
!(
!(!(
!(
!(
!(!(
!(
!(!(
!(!(
!(
!(!( !(!(
!(
!(
!(!(!( !(
!(
!(
!(
!(
!(
!(
!(
!(
!(!(
!(
!( !(
!(
!(
!(!(
!(
!(
!(
!(
!(
!(!(
!(
!(
!(
!(
!(!(
!(
!(
!(
!(!( !( !(!(!(
!(
!(
!(!(!(
!( !(
!(
!(!(
!( !(
!(
!( !(
!(
!(
!(
!(!(
!(!(!(!(
!(
!(!(
!(
!(
!(
!(!(
!(
!(
!(
!( !(!( !( !(
!(!(
!(
!(
!(
!(
!(
!(!(!(
!(!(
!(!(
!(
!(
!(
!(
!(
!(
!(!(
!(
!(
!(
!(
!(
!(
!(
!(
!(
!(
!(!(!(
!(
!(!(
!(
!(!(!(
!(
!(!(
!(
!(
!(
!(!(
!(
!( !(
!(
!( !(
!(
!(
!(
!(
!(
!(
!(
!(
!(
!(
!(!(!(
!( !(
!(
!(
!(
!(
!(!(!(
!(
!(
!(!(
!(
!(
!(!(
!( !(!(
!(!(!( !(
!(
!(!(!(!(
!(
!(!(
!(!(
!(!(!(
!(!(
!(!(
!(
!( !(!(
!(!(!(!(!(!(
!(
!(
!(!(
!( !(!( !(!(!( !(!(
!(!(
!(
!(
!(
!(
!(
!(
!(
!(
!(
!(!(
!(!(
!(
!(!(
!(!(
!(!(
!(
!(
!(!(
!(
!(!(
!(!(!(!(!(!(
!(
!(
!(
!(
!(
!(
!(
!(
!(!(
!(
!(
!(
!(
!(
!(
!(
!(
!(
!(
!(
!(
!(
!(
!(
!(
!(
!(
!(
!(
!(
!(
!(
!( !(
!(
!(!(
!(
!(
!(
!(
!(!(
!(
!(
!(
!(
!(
!(
!(
!(
!( !(!(
!(
!(
!(
!(
!(
!(
!(
!(
!(
!(
!(!(!(
!(
!(
!(
!(!(
!(
!(
!(
!(
!(
!(
!(
!(
!(
!(
!(!(
!(!(!(!(!(!(!(
!(
!(!(!(!(
!(
!(!(
!(
!(
!A!A!A!A
!A
!A
!A
!A!A
!A
Turner Basins
HOLT BLVD
4TH ST
HA
VE
N A
VE
HE
RM
OS
A A
VE
AR
CH
IBA
LD
AV
E
VIN
EY
AR
D A
VE
%&'(10
Cucam
onga Creek
Dee
r C
ree
k
Figure 2-2
Monitoring Well NetworkTurner Basins 0 1,000 2,000
Feet
0 250 500Meters
LACounty San Bernardino
County
RiversideCounty
OrangeCounty
Santa Ana
Los Angeles
San Bernardino
Recharge Basins
Recycled Water Recharge Program
!A Existing Monitoring Well
TRN-1/1 & 1/2
Ontario 29
Ontario 25
µ
!( "Other Wells"
Rivers/Streams/Creeks
!O
!O
!O
Main Map Features
TRN-2/1 & 2/2
Ontario 38
Ontario 20
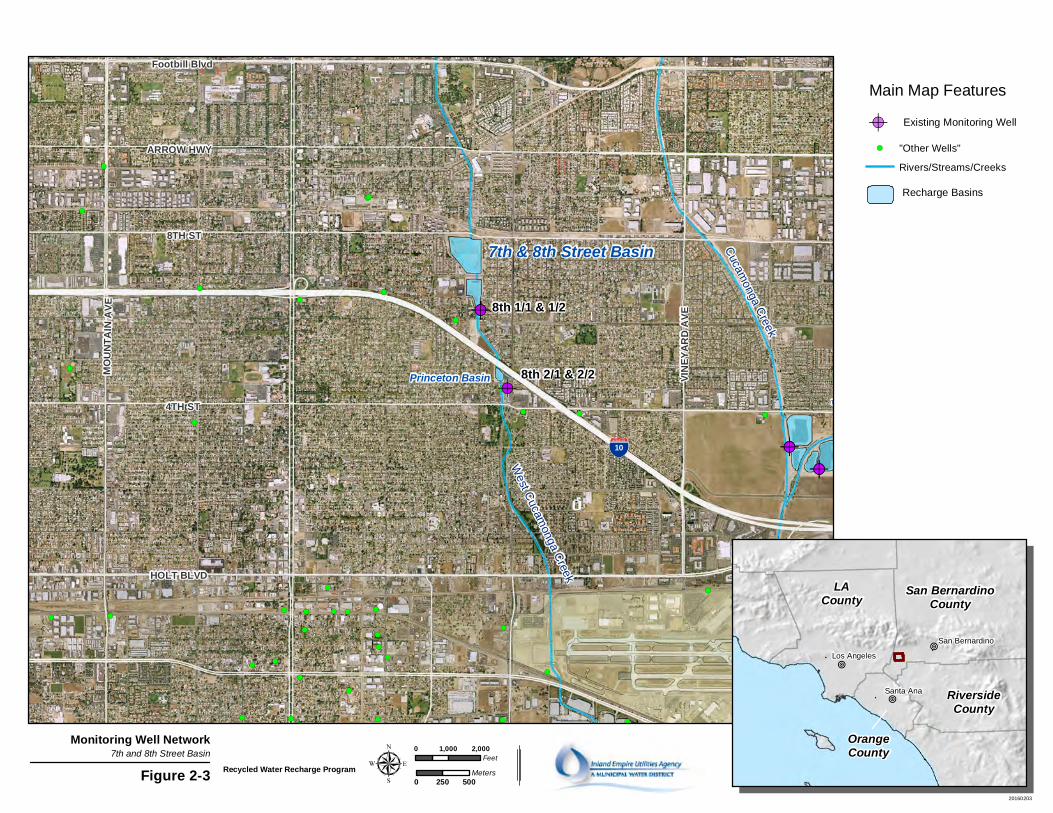
!(
!(
!(
!(
!(
!(!(
!(
!(
!(
!(
!(
!(
!(
!(
!(!( !(
!(
!(
!(
!(
!(!(
!(
!(
!(
!(
!(!(
!(
!(
!(!( !(
!(
!(
!(
!(
!(
!(
!(
!(!(
!(
!(
!(
!(
!(
!(!(
!(
!(
!(
!(
!(!(
!(
!(
!(
!(
!(
!(
!(
!(
!(
!(
!(
!(
!(
!(
!(
!(
!(
!(
!(
!(
!(
!(
!( !(
!(
!(
!(
!(
!(
!(
!(
!(
!(
!(
!(
!(
!(
!( !(
!(
!(
!(
!(
!(
!( !(
!(
!(!( !(!(
!(!(
!(
!(
!( !(
!(!(!(
!(
!(
!(
!(
!(
!(
!(
!(
!(!(
!(
!(
!(
!(
!(
!(
!(
!(
!( !(
!(
!(
!(!(!(!(
!(
!(
!(!( !(
!(
!(
!(!(
!(!(
!(
!(
!(
!(
!(
!(!(
!(
!(
!(
!( !(!(
!(
!(
!(
!(!(
!(
!(
!(
!(
!(
!(
!(!(
!(
!(
!(!(
!(
!(!(!( !(
!( !(
!(
!(
!(
!(
!(
!(
!(!(
!(!(
!(!(
!(!(
!(
!(
!(!(!(!(
!(!(
!(
!(
!(
!(
!(!(!(
!(
!(
!(
!(
!(
!(
!(
!(
!(
!(
!(
!( !(!(
!(
!(
!(
!(
!(
!(
!(
!(
!(
!(
!(!(!(
!(
!(
!(
!(!(
!(
!(
!(
!(
!(
!(
!(
!(
!(
!(
!(!(
!(!(!(
!(!(!(!(
!(
!(!(!(
!(
!(
!(!(
!(
!A!A
!A!A
!A
!A
!A!A
ARROW HWY
8TH ST
4TH ST
HOLT BLVD
VINEY
ARD
AVE
MOUN
TAIN
AVE
!"#$10
Footbill Blvd
Cucam
onga Creek
West C
ucamonga C
reek
Turner
Figure 2-3
Monitoring Well Network7th and 8th Street Basin 0 1,000 2,000
Feet
0 250 500Meters
LACounty San Bernardino
County
RiversideCounty
OrangeCounty
Santa Ana
Los Angeles
San Bernardino
Recycled Water Recharge Program
!A Existing Monitoring Well
µ
!O
!O
!O
Main Map Features
20160203
!( "Other Wells"
Rivers/Streams/Creeks
Recharge Basins
8th 1/1 & 1/2
8th 2/1 & 2/2
7th & 8th Street Basin
Princeton Basin
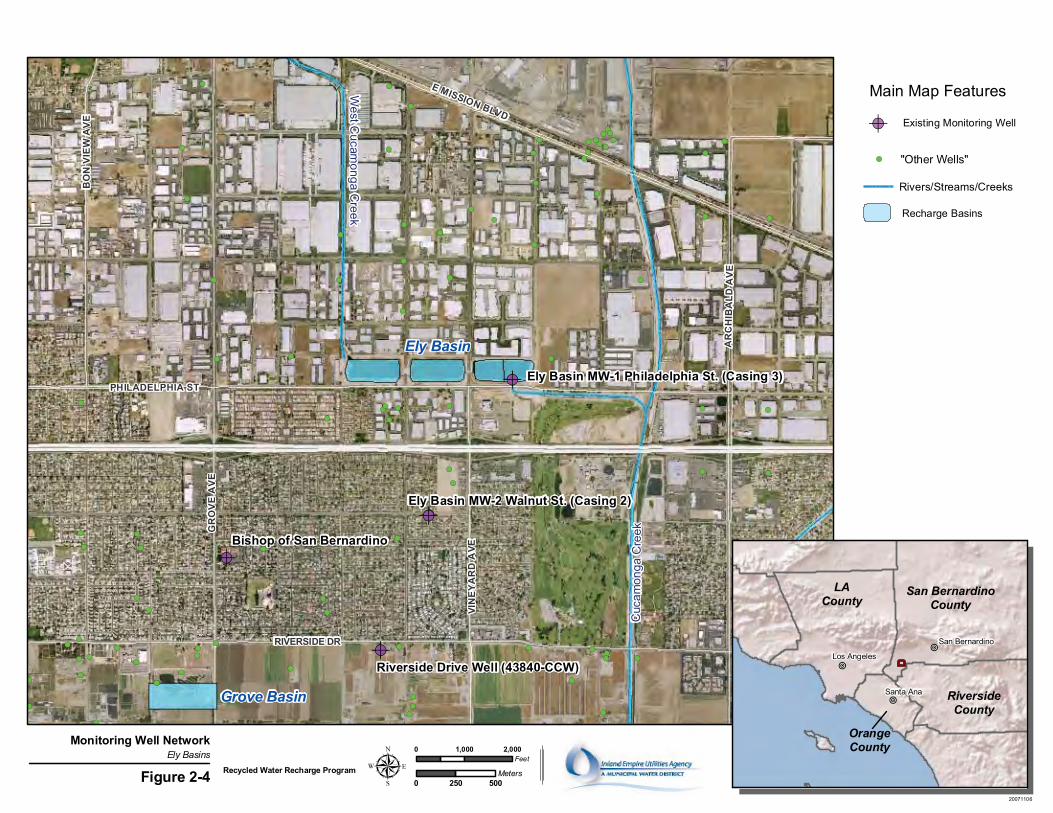
!A
!A
!A
!(
!(!( !(
!(
!(
!(
!(
!(
!(
!(!(
!(
!(
!(
!(
!(
!(
!(
!(
!(!(
!(!( !(!(
!(!(
!(
!(
!( !(
!(
!(
!(
!(
!(
!(
!(
!(
!(
!(
!(
!(
!(
!(
!(!(
!(!(
!(
!(!(
!(
!(!(
!(
!(
!(!(
!(
!(
!( !(
!(
!(!(
!(!(
!(!(
!(
!(
!(
!(
!(
!(
!(
!(
!(
!(
!(
!(
!(
!(
!(
!(!(
!(!(!(
!(!(!(!(
!(
!(!(!(
!(
!(
!A
!A
!A
!A
Ely Basin MW-1 Philadelphia St. (Casing 3)
Ely Basin MW-2 Walnut St. (Casing 2)
Riverside Drive Well (43840-CCW)
BO
N V
IEW
AV
E
PHILADELPHIA ST
GR
OV
E A
VE
VIN
EY
AR
D A
VE
AR
CH
IBA
LD A
VE
E MISSION BLVD
RIVERSIDE DR
West C
ucamonga C
reek
Cuc
amon
ga C
reek
Grove Basin
Ely Basin
Bishop of San Bernardino
Figure 2-4
Monitoring Well NetworkEly Basins 0 1,000 2,000
Feet
0 250 500Meters
LACounty
San BernardinoCounty
RiversideCounty
OrangeCounty
Santa Ana
Los Angeles
San Bernardino
Recycled Water Recharge Program
!A Existing Monitoring Well
μ
!O
!O
!O
Rivers/Streams/Creeks
Recharge Basins
Main Map Features
20071106
!( "Other Wells"
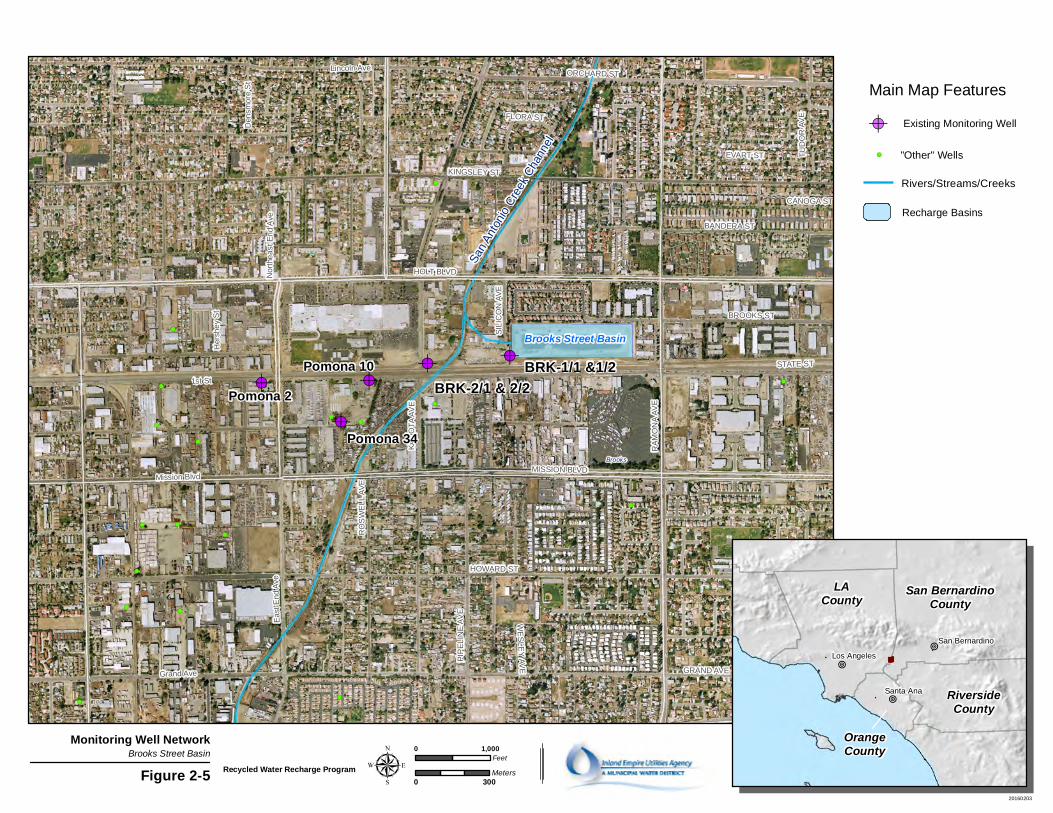
!(
!(
!(!(
!(
!(
!(
!(
!(
!(
!(
!(
!(!(!(
!(
!(
!(
!(!(
!(
!(
!(
!(
!(
!(
!(
!(
!(!(
!(
!(
!(
!(
!( !(
!(
!(!(
!(
!(
!(
!(
!(
!(
!(
!(
!(
!(
!(
!(
!(
!(
!(
!(
!(
!(
!(
!(
!(
!(
!(
!(
!(
!(
!(
!(
!(
!(
!(
!(
!(
!(
!(
!(
!(
!(
!(
!(
!(
!(
!(
!(
!(
!(
!(
!(
!(
!(
!(
!(
!(
!(
!(
!(
!(
!(
!(
!(
!(
!(
!(
!(
!A !A
!A!A
!A
Pomona 2Pomona 10
WE
SL
EY
AV
E
FLORA ST
SIL
ICO
N A
VE
CLAIR ST
EVART ST TU
DO
R A
VE
RO
SW
EL
L A
VE
CANOGA ST
BANDERA ST
PIP
EL
INE
AV
E
KA
DO
TA
AV
E
ORCHARD ST
BROOKS ST
KINGSLEY ST
HOWARD ST
MISSION BLVD
HOLT BLVD
GRAND AVE
RA
MO
NA
AV
E
STATE ST
Her
she
y S
t
Den
smo
re S
t
Nor
the
ast
En
d A
ve
Grand Ave
Mission Blvd
Ea
st E
nd
Ave
Lincoln Ave
1st St
Brooks Street Basin
BRK-1/1 &1/2BRK-2/1 & 2/2
San
Ant
onio
Cre
ek C
hann
el
Pomona 34Brooks
Figure 2-5
Monitoring Well NetworkBrooks Street Basin 0 1,000
Feet
0 300Meters
LACounty San Bernardino
County
RiversideCounty
OrangeCounty
Santa Ana
Los Angeles
San Bernardino
Recycled Water Recharge Program µ
!O
!O
!O
Recharge Basins
Main Map Features
20160203
!( "Other" Wells
Rivers/Streams/Creeks
!A Existing Monitoring Well
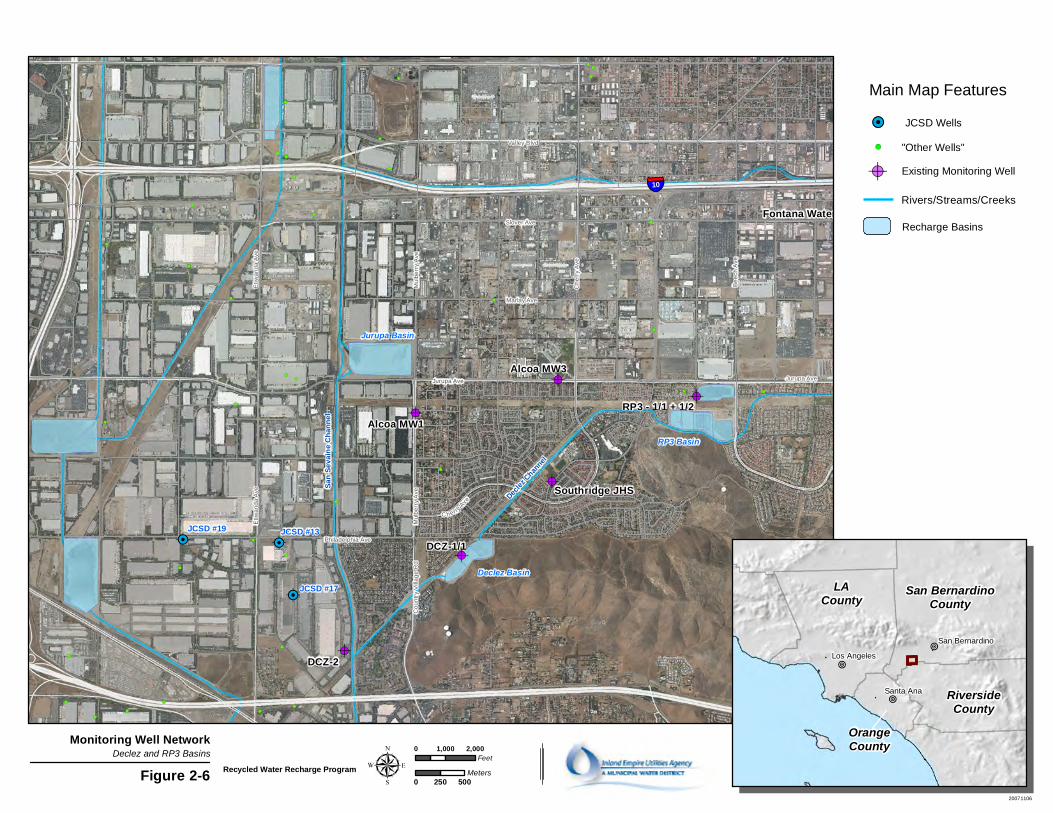
!(
!(
!(!(
!(!( !(
!(
!(
!(
!(
!(
!(
!(
!(
!(
!(
!(!(!(
!(
!(
!(
!(
!(
!(
!(!(
!(
!(
!(
!(
!(
!(
!(
!(
!(
!(
!(
!(
!(
!(
!(
!(
!(
!(
!(
!(
!(
!(!(
!(
!(
!(
!(!(
!(!(
!(
!(
!(
!(
!(
!(
!(
!(
!(
!(
!(
!(
!(
!(
!(
!(
!(
!(
!(
!(
!(
!(!(
!(
!(
!(
!(
!( !(!(
!(
!(
!(
!(
!(
!(
!(!(
!(
!(
!(
!(
!(
!(
!(
!(
!(
!(
!(
!(!(
!(
!(
!(
!(
!(
!(
!(
!(!(!(!(
!(
!(
!(!(
!(
!(
!(
!(
!(
!(
!(
!(!(
!(
!(
!(
!(
!(
!( !(
!(
!(
!(
!(
!(
!(
!( !(
!(
!(
!(
!(
!(!(
!(
!(
!(
!(
!(
!(
!(!(
!(
!(
!(
!(
!(
!(
!(
!(
!(!(
!(!(
!(
!(
!(
!( !(
!(
!(
!(
!(
!( !(
!(
!(
!( !(
!(
!(!(!( !(
!(
!(
!(
!(
!(
!(
!(
!(
!(
!(
!( !(
!(
!(
!(!(
!(
!(
!(
!(
!(
!(!(
!(
!(
!(
!(
!(
!(
!(
!(
!(!( !( !(!(
!(
!(
!(
!(
!( !(!(
!(!(!(
!(
!(
!(
!( !(!(
!(
!(!( !(
!(
!(!(
!(
!(!(
!(
!(!(
!(!(
!(
!(!(
!(!(
!(!(
!(
!(
!(!(
!(
!(!(
!(!(!(!(!(!(
!(
!(
!(
!(
!(
!(
!(!(
!(
!(
!(
!( !(
!(
!(!(
!(
!(
!(
!(
!(
!(
!(
!(
!(!(
!(
!(
!(
!(!(
!(
!(
!(
!(
!(
!(
!(
!( !(
!(!(
!(
!(!(
!(
!(
!(
!(!(!(!(!(!(!(!(
!(!(
!(!( !(
!(!(!(
!( !(!(!( !(
!(
!(!(!( !(!(
!(
!(
!(!(!(
!(
!(!(!(
!(!(!(!(!(!(
!(
!(
!(
!(!(
!(!(
!(
!(
!( !(!(
!(!(
!(
!(!(
!(
!(
!(!(!(!(
!(!(!( !(!(!(!(!(
!(!(!(!(
!(
!(!(!(
!(!(!(!(!(
!(!(!(!(!(!(!(!(!(
!(
!(
!(
!(
!(
!(
!(
!(!(
!(
!(
!(
!(
!(
!(
!(
!(
!(
!(
!(
!(
!(
!(!(
!(
!(
!(
!(
!(
!(
!(
!(
!(
!(
!(
!(
!A
!A
!A
!A
!A
!A
!A
!A
!A
!H
!H
!H
Jurupa Basin
Declez Basin
RP3 Basin
San S
evain
e Cha
nnel
Declez
Channel
DCZ-1/1
Fontana Water Co. F23A
Southridge JHS
RP3 - 1/1 + 1/2Alcoa MW1
Alcoa MW3
Mu
lbe
rry
Ave
Jurupa Ave
Marlay Ave
Be
ech
Ave
Ch
err
y A
ve
Valley Blvd
Slover Ave
C herry
Ave
Mu
lbe
rry
Ave
Co
un
try
Vill
ag
e R
d
Jurupa Ave
Philadelphia Ave
§̈¦10
JCSD #17
JCSD #19 JCSD #13
Etiw
an
da
Ave
Etiw
an
da
Ave
DCZ-2
Figure 2-6
Monitoring Well NetworkDeclez and RP3 Basins 0 1,000 2,000
Feet
0 250 500Meters
LACounty San Bernardino
County
RiversideCounty
OrangeCounty
Santa Ana
Los Angeles
San Bernardino
Recycled Water Recharge Program µ
!O
!O
!O
Recharge Basins
Main Map Features
20071106
Rivers/Streams/Creeks
!A Existing Monitoring Well
!H JCSD Wells
!( "Other Wells"
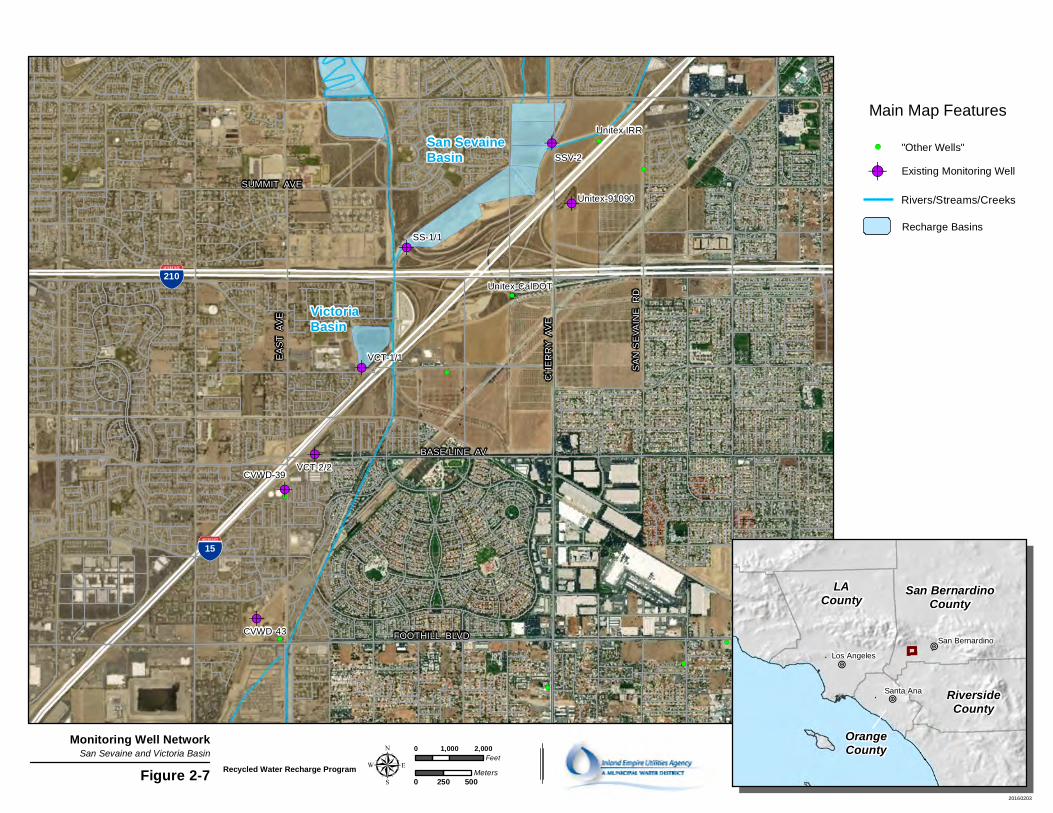
!(
!(
!(
!(
!(!(
!(!( !(
!(!(
!(
!(
!(
!(
!(
!(
!(
!(!(!(
!(
!(
!(
!(!(
!(
!(
!(
!(
!(
!(
!(
!(
!(
!(
!(
!(
!(
!(
!(
!(!(
!(
!(
!(
!(
!(
!(
!(
!(
!(!(!(
!(
!(
!.
!.
!.
!.
!.
!.
!.
!.
!.
!.
!A
!A
!A
!A
!A
!A
!A
BASE LINE AV
FOOTHILL BLVD
CH
ER
RY
AV
E
SUMMIT AVE
EA
ST
AV
E
SA
N S
EV
AIN
E
RD
!"#$15
!"#$210
SSV-2
SS-1/1
CVWD-43
CVWD-39VCT-2/2
VCT-1/1
Unitex IRR
Unitex-91090
Unitex-CalDOT
Figure 2-7
Monitoring Well NetworkSan Sevaine and Victoria Basin 0 1,000 2,000
Feet
0 250 500Meters
LACounty San Bernardino
County
RiversideCounty
OrangeCounty
Santa Ana
Los Angeles
San Bernardino
Recycled Water Recharge Program µ
!O
!O
!O
Recharge Basins
Main Map Features
20160203
Rivers/Streams/Creeks
!A Existing Monitoring Well
San SevaineBasin
VictoriaBasin
!( "Other Wells"