lendingclub 4q20 presentation
TRANSCRIPT

Fourth Quarter & Full Year 2020 Results
March 10, 2021

4Q 2020 Results & Financial Metrics
3
DisclaimerSome of the statements in this presentation, including statements regarding anticipated future financial results, are “forward-looking statements.” The words “anticipate,” “believe,”
“estimate,” “expect,” “intend,” “may,” “outlook,” “plan,” “predict,” “project,” “will,” “would” and similar expressions may identify forward-looking statements, although not all forward-
looking statements contain these identifying words. Factors that could cause actual results to differ materially from those contemplated by these forward-looking statements include:
the outcomes of pending governmental investigations and pending or threatened litigation, which are inherently uncertain; the impact of management changes and the ability to
continue to retain key personnel; our ability to achieve cost savings from restructurings; our ability to continue to attract and retain new and existing borrowers and investors; our ability
to obtain or add bank functionality and a bank charter; competition; overall economic conditions; demand for the types of loans facilitated by us; default rates and those factors set
forth in the section titled “Risk Factors” in our most recent Quarterly Report on Form 10-Q and Annual Report on Form 10-K, each as filed with the Securities and Exchange
Commission, as well as our subsequent reports on Form 10-Q and 10-K each as filed with the Securities and Exchange Commission. We may not actually achieve the plans,
intentions or expectations disclosed in forward-looking statements, and you should not place undue reliance on forward-looking statements. Actual results or events could differ
materially from the plans, intentions and expectations disclosed in forward-looking statements. We do not assume any obligation to update any forward-looking statements, whether
as a result of new information, future events or otherwise, except as required by law.
This presentation contains non-GAAP measures relating to our performance. We have included certain pro forma adjustments in our presentation of non-GAAP Operating Expenses,
non-GAAP Sales and Marketing expense, non-GAAP Origination and Servicing expense, non-GAAP Engineering and Product Development expense, non-GAAP Other General
and Administrative expense, non-GAAP Adjusted Net Income (Loss), non-GAAP Adjusted Earnings Per Diluted Share, non-GAAP Contribution, non-GAAP Contribution Margin, non-
GAAP Adjusted EBITDA, non-GAAP Adjusted EBITDA Margin, and non-GAAP Net cash and other financial assets, and non-GAAP Adjusted Investor Fee Revenue. We believe
these non-GAAP measures provide management and investors with useful supplemental information about the financial performance of our business, enable comparison of financial
results between periods where certain items may vary independent of business performance, and enable comparison of our financial results with other public companies, many of
which present similar non-GAAP financial measures.
These measures may be different from non-GAAP financial measures used by other companies. The presentation of this financial information, which is not prepared under any
comprehensive set of accounting rules or principles, is not intended to be considered in isolation of, or as a substitute for, the financial information prepared and presented in
accordance with generally accepted accounting principles. You can find the reconciliation of these non-GAAP financial measures to the most directly comparable GAAP measures in
the Appendix at the end of this presentation.
23% 20%
5% 2% 1%
3% 4%
17% 13%
8%
17% 16%
10%
44% 51%
32% 43% 68%
41% 33%
25% 17%
7%
4Q19 1Q20 2Q20 3Q20 4Q20
Other Institutional
Investors
Banks
Managed Accounts
Self-directed Investors
LendingClub Inventory2
4
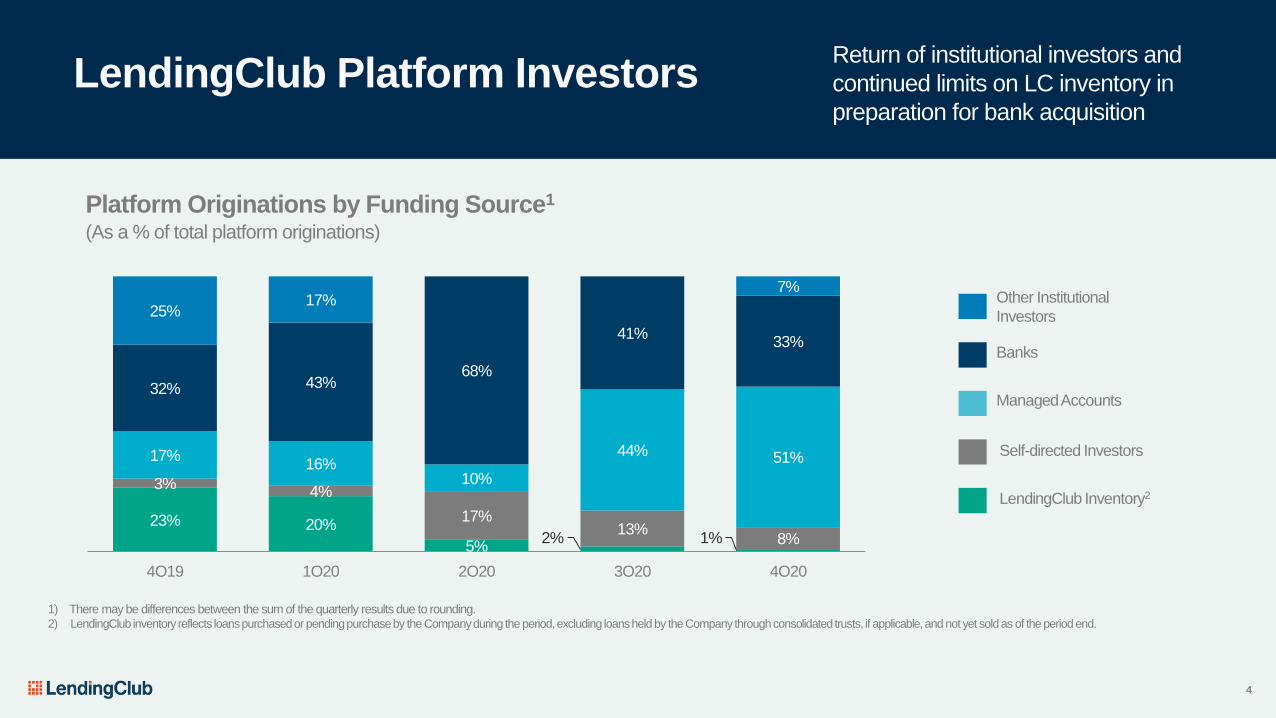
LendingClub Platform Investors
(As a % of total platform originations)
Platform Originations by Funding Source1
1) There may be differences between the sum of the quarterly results due to rounding. 2) LendingClub inventory reflects loans purchased or pending purchase by the Company during the period, excluding loans held by the Company through consolidated trusts, if applicable, and not yet sold as of the period end.
Return of institutional investors and
continued limits on LC inventory in
preparation for bank acquisition
179 178 95
142 139
816 572
9 44 157
2,088
1,771
222 398
617
3,083
2,521
326
584
912
4Q19 1Q20 2Q20 3Q20 4Q20
Personal loans - standard
Personal loans - custom
Other
150.0 136.2
3.9 24.4
43.2
5.0
4.5
2.5
3.1
3.3
33.5
(20.5)
37.5
47.2 29.5
188.5
120.2
43.9
74.7 75.9
4Q19 1Q20 2Q20 3Q20 4Q20
Net Investor Revenue
Other Revenue
Transaction Fee Revenue
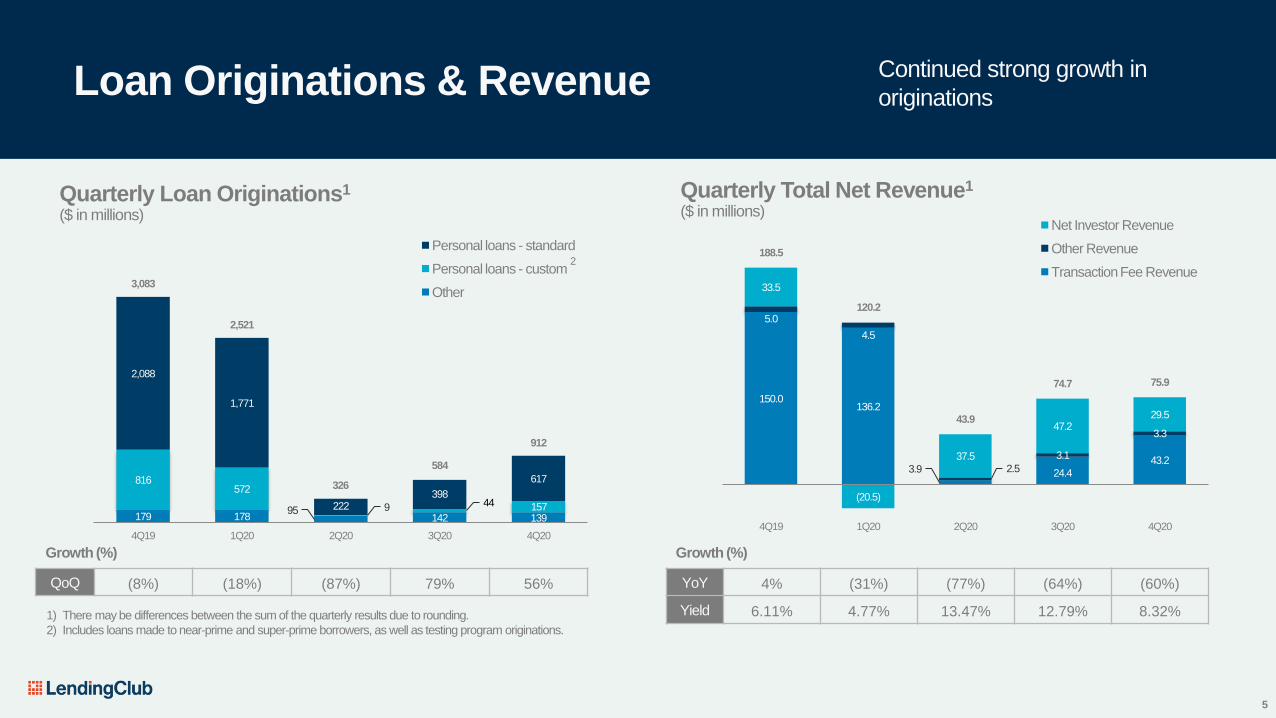
Loan Originations & Revenue
Growth (%)
QoQ (8%) (18%) (87%) 79% 56%
1) There may be differences between the sum of the quarterly results due to rounding.
2) Includes loans made to near-prime and super-prime borrowers, as well as testing program originations.
Quarterly Loan Originations1
($ in millions)
Growth (%)
YoY 4% (31%) (77%) (64%) (60%)
Yield 6.11% 4.77% 13.47% 12.79% 8.32%
Quarterly Total Net Revenue1
($ in millions)
2
5
Continued strong growth in
originations
101.3
51.9
21.4
53.4
47.2
4Q19 1Q20 2Q20 3Q20 4Q20
65.7
48.1
6.5 6.4 12.5
21.5
20.2
15.9 14.9 16.2
87.2
68.3
22.5 21.3
28.7
4Q19 1Q20 2Q20 3Q20 4Q20
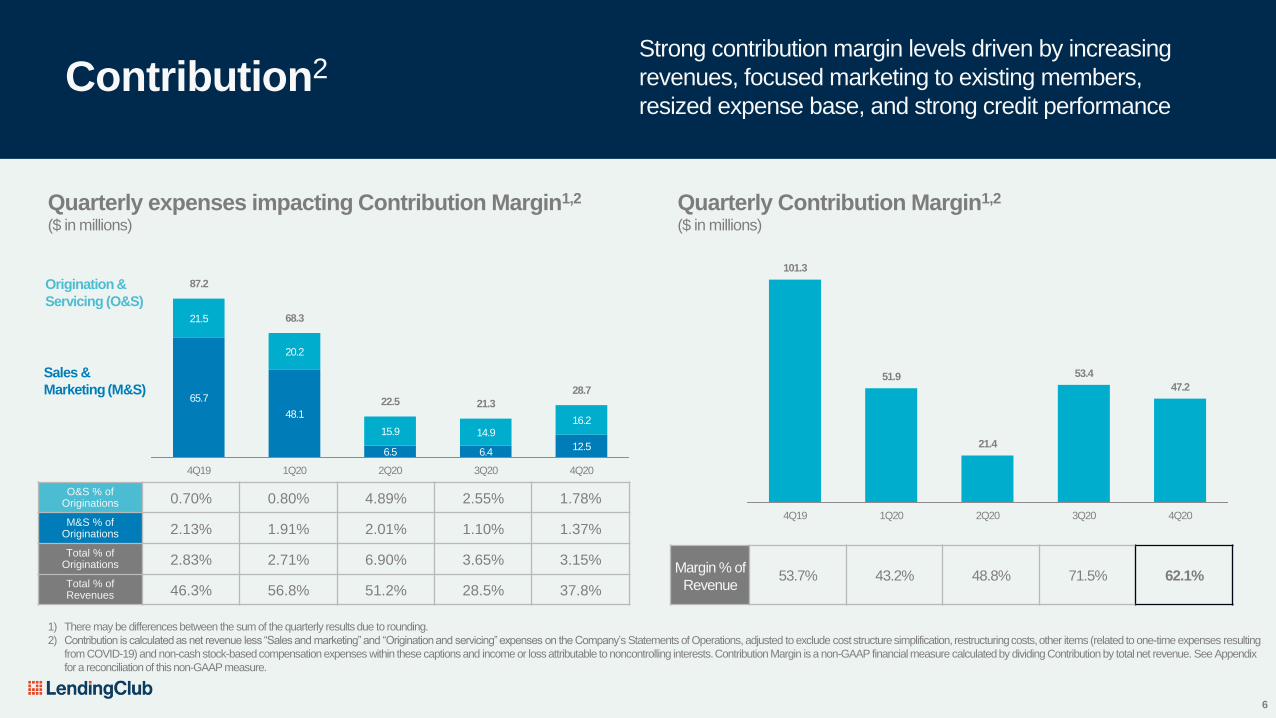
Contribution2
Margin % of
Revenue53.7% 43.2% 48.8% 71.5% 62.1%
1) There may be differences between the sum of the quarterly results due to rounding.
2) Contribution is calculated as net revenue less “Sales and marketing” and “Origination and servicing” expenses on the Company’s Statements of Operations, adjusted to exclude cost structure simplification, restructuring costs, other items (related to one-time expenses resulting
from COVID-19) and non-cash stock-based compensation expenses within these captions and income or loss attributable to noncontrolling interests. Contribution Margin is a non-GAAP financial measure calculated by dividing Contribution by total net revenue. See Appendix
for a reconciliation of this non-GAAP measure.
Quarterly Contribution Margin1,2
($ in millions)
Quarterly expenses impacting Contribution Margin1,2
($ in millions)
O&S % of Originations 0.70% 0.80% 4.89% 2.55% 1.78%
M&S % of Originations 2.13% 1.91% 2.01% 1.10% 1.37%
Total % of Originations 2.83% 2.71% 6.90% 3.65% 3.15%
Total % of Revenues 46.3% 56.8% 51.2% 28.5% 37.8%
Origination &
Servicing (O&S)
Sales &
Marketing (M&S)
6
Strong contribution margin levels driven by increasing
revenues, focused marketing to existing members,
resized expense base, and strong credit performance
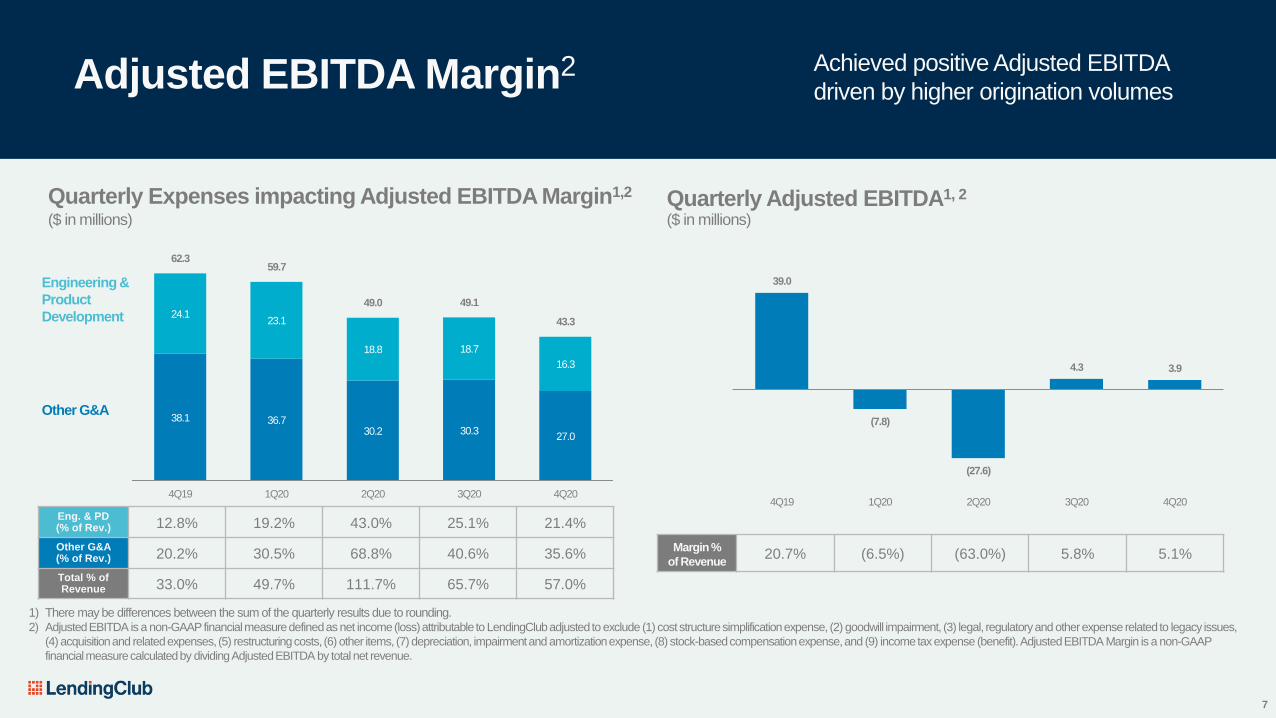
38.1 36.7 30.2 30.3
27.0
24.1 23.1
18.8 18.7
16.3
62.3 59.7
49.0 49.1
43.3
4Q19 1Q20 2Q20 3Q20 4Q20
39.0
(7.8)
(27.6)
4.3 3.9
4Q19 1Q20 2Q20 3Q20 4Q20
Adjusted EBITDA Margin2
1) There may be differences between the sum of the quarterly results due to rounding. 2) Adjusted EBITDA is a non-GAAP financial measure defined as net income (loss) attributable to LendingClub adjusted to exclude (1) cost structure simplification expense, (2) goodwill impairment, (3) legal, regulatory and other expense related to legacy issues,
(4) acquisition and related expenses, (5) restructuring costs, (6) other items, (7) depreciation, impairment and amortizationexpense, (8) stock-based compensation expense, and (9) income tax expense (benefit). Adjusted EBITDA Margin is a non-GAAP
financial measure calculated by dividing Adjusted EBITDA by total net revenue.
Margin %
of Revenue20.7% (6.5%) (63.0%) 5.8% 5.1%
Quarterly Adjusted EBITDA1, 2
($ in millions)
Eng. & PD(% of Rev.) 12.8% 19.2% 43.0% 25.1% 21.4%
Other G&A(% of Rev.) 20.2% 30.5% 68.8% 40.6% 35.6%
Total % of Revenue 33.0% 49.7% 111.7% 65.7% 57.0%
Quarterly Expenses impacting Adjusted EBITDA Margin1,2
($ in millions)
Other G&A
Engineering &
Product
Development
7
Achieved positive Adjusted EBITDA
driven by higher origination volumes
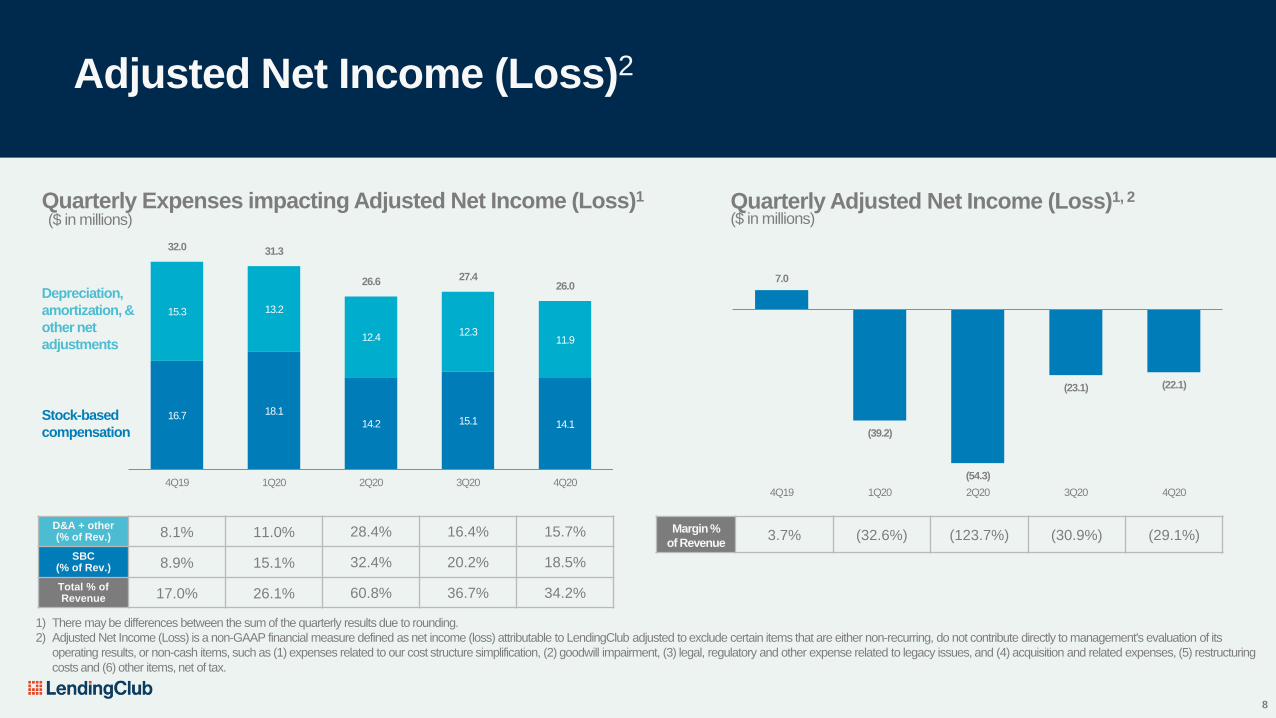
7.0
(39.2)
(54.3)
(23.1) (22.1)
4Q19 1Q20 2Q20 3Q20 4Q20
16.7 18.1
14.2 15.1 14.1
15.3 13.2
12.4 12.3
11.9
32.0 31.3
26.6 27.4 26.0
4Q19 1Q20 2Q20 3Q20 4Q20
Margin %
of Revenue3.7% (32.6%) (123.7%) (30.9%) (29.1%)
Adjusted Net Income (Loss)2
1) There may be differences between the sum of the quarterly results due to rounding.
2) Adjusted Net Income (Loss) is a non-GAAP financial measure defined as net income (loss) attributable to LendingClub adjusted to exclude certain items that are either non-recurring, do not contribute directly to management's evaluation of its
operating results, or non-cash items, such as (1) expenses related to our cost structure simplification, (2) goodwill impairment, (3) legal, regulatory and other expense related to legacy issues, and (4) acquisition and related expenses, (5) restructuring
costs and (6) other items, net of tax.
Quarterly Adjusted Net Income (Loss)1, 2
($ in millions)
D&A + other(% of Rev.) 8.1% 11.0% 28.4% 16.4% 15.7%
SBC(% of Rev.) 8.9% 15.1% 32.4% 20.2% 18.5%
Total % of Revenue 17.0% 26.1% 60.8% 36.7% 34.2%
Quarterly Expenses impacting Adjusted Net Income (Loss)1
($ in millions)
Stock-based
compensation
Depreciation,
amortization, &
other net
adjustments
8
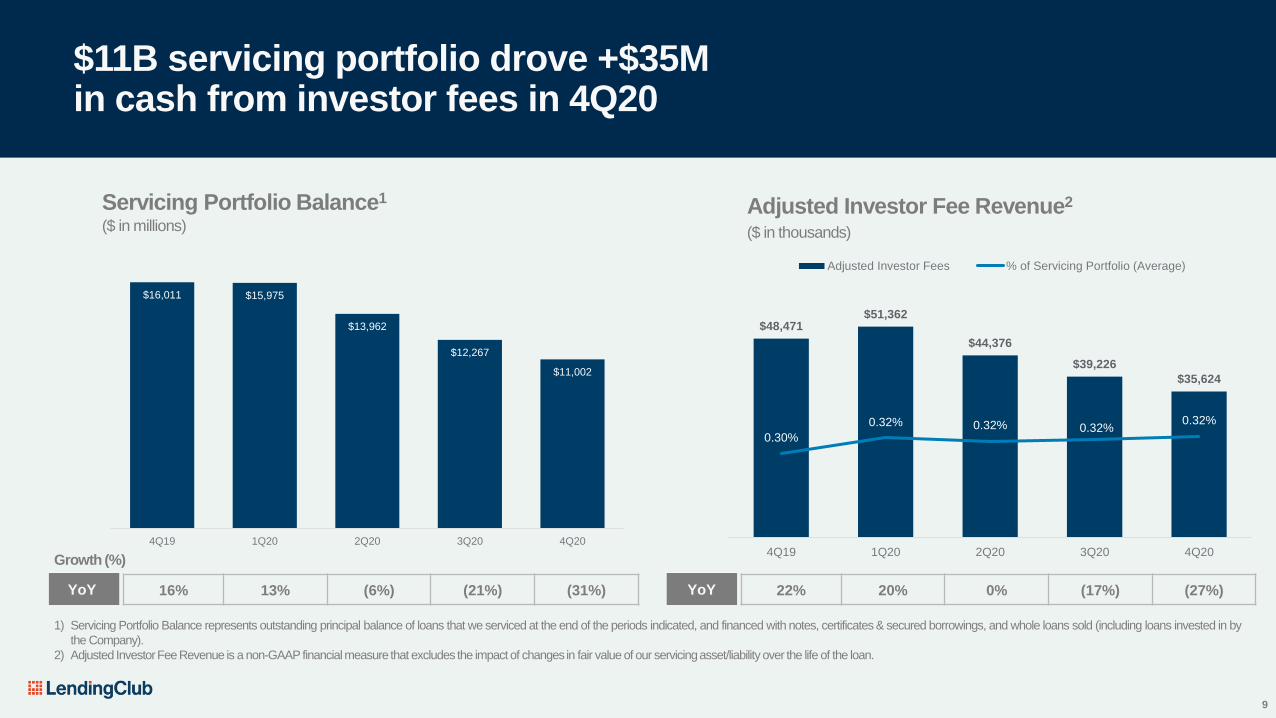
$48,471 $51,362
$44,376
$39,226
$35,624
0.30%
0.32% 0.32% 0.32%0.32%
0.20%
0.25%
0.30%
0.35%
0.40%
0.45%
0.50%
$0
$10,000
$20,000
$30,000
$40,000
$50,000
$60,000
4Q19 1Q20 2Q20 3Q20 4Q20
Adjusted Investor Fees % of Servicing Portfolio (Average)
$16,011 $15,975
$13,962
$12,267
$11,002
4Q19 1Q20 2Q20 3Q20 4Q20
$11B servicing portfolio drove +$35M in cash from investor fees in 4Q20
1) Servicing Portfolio Balance represents outstanding principal balance of loans that we serviced at the end of the periods indicated, and financed with notes, certificates & secured borrowings, and whole loans sold (including loans invested in by
the Company).
2) Adjusted Investor Fee Revenue is a non-GAAP financial measure that excludes the impact of changes in fair value of our servicingasset/liability over the life of the loan.
YoY 16% 13% (6%) (21%) (31%)
Servicing Portfolio Balance1
($ in millions)
Growth (%)
9
YoY 22% 20% 0% (17%) (27%)
Adjusted Investor Fee Revenue2
($ in thousands)
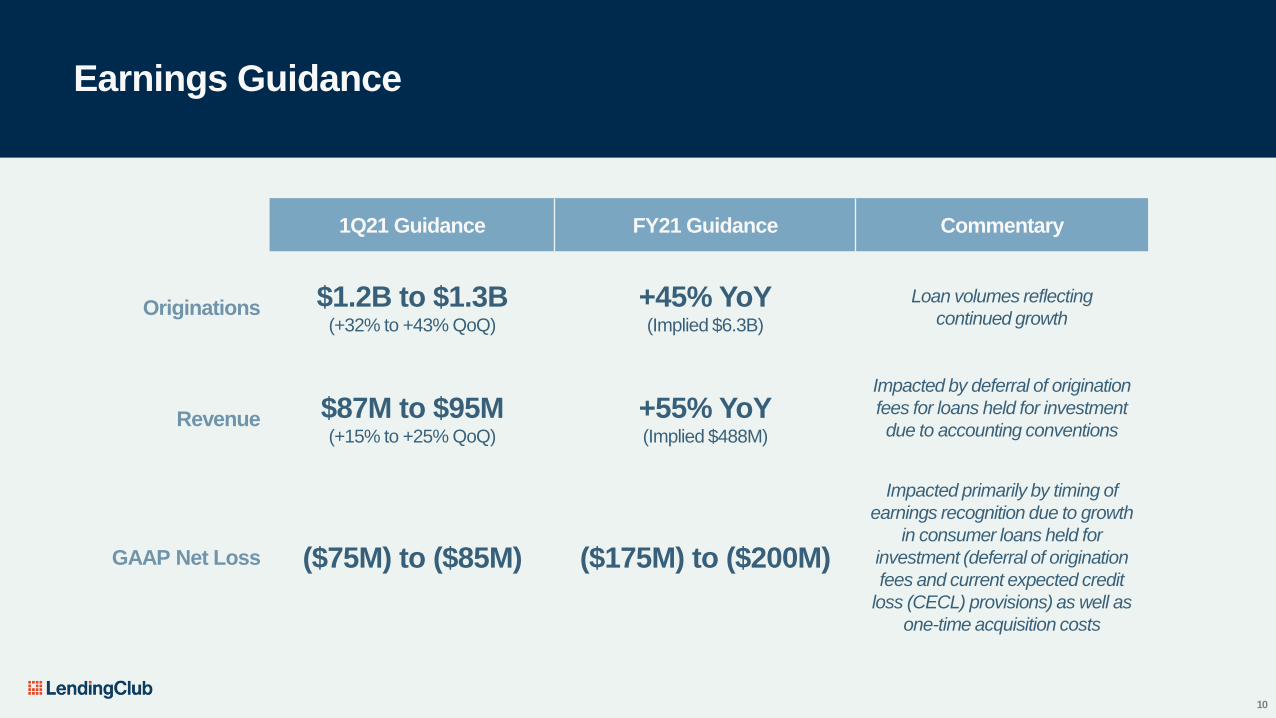
Earnings Guidance
10
1Q21 Guidance FY21 Guidance Commentary
Originations $1.2B to $1.3B(+32% to +43% QoQ)
+45% YoY(Implied $6.3B)
Loan volumes reflecting
continued growth
Impacted by deferral of origination
fees for loans held for investment
due to accounting conventionsRevenue $87M to $95M
(+15% to +25% QoQ)
+55% YoY(Implied $488M)
GAAP Net Loss ($75M) to ($85M) ($175M) to ($200M)
Impacted primarily by timing of
earnings recognition due to growth
in consumer loans held for
investment (deferral of origination
fees and current expected credit
loss (CECL) provisions) as well as
one-time acquisition costs

Appendix:
Financial Reconciliations
21
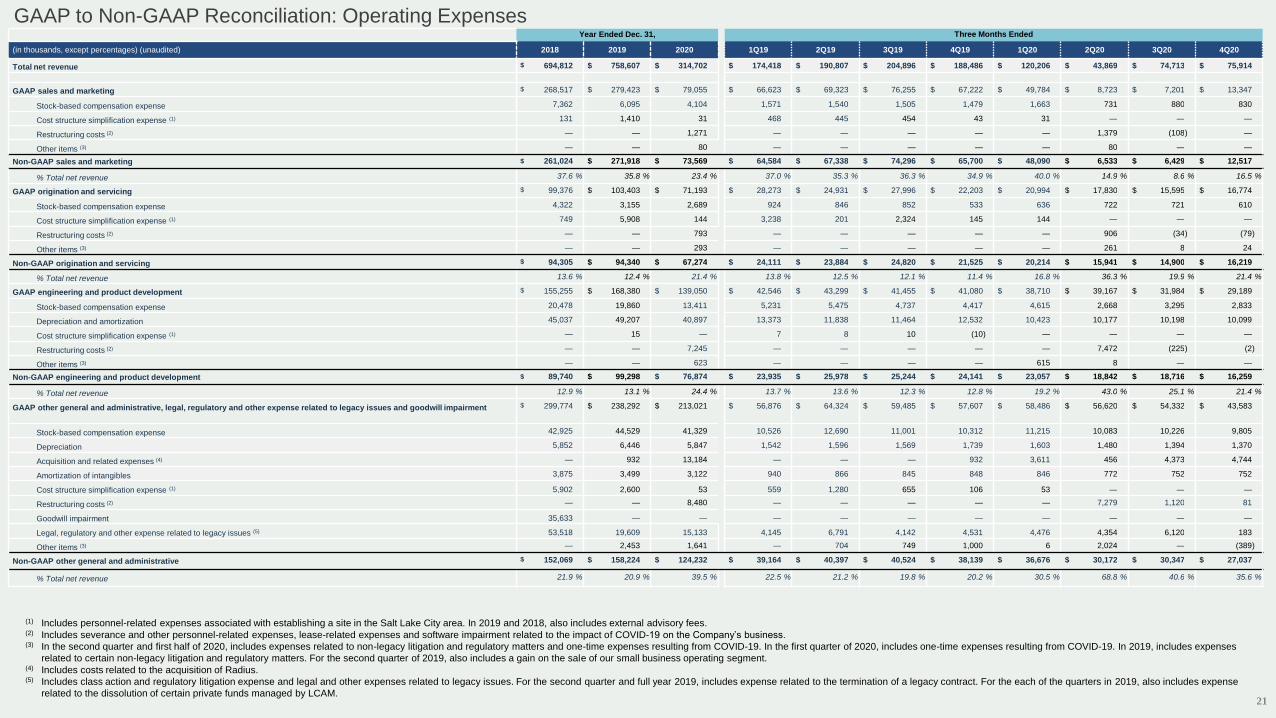
(1) Includes personnel-related expenses associated with establishing a site in the Salt Lake City area. In 2019 and 2018, also includes external advisory fees.(2) Includes severance and other personnel-related expenses, lease-related expenses and software impairment related to the impact of COVID-19 on the Company’s business.(3) In the second quarter and first half of 2020, includes expenses related to non-legacy litigation and regulatory matters and one-time expenses resulting from COVID-19. In the first quarter of 2020, includes one-time expenses resulting from COVID-19. In 2019, includes expenses
related to certain non-legacy litigation and regulatory matters. For the second quarter of 2019, also includes a gain on the sale of our small business operating segment.(4) Includes costs related to the acquisition of Radius.(5) Includes class action and regulatory litigation expense and legal and other expenses related to legacy issues. For the second quarter and full year 2019, includes expense related to the termination of a legacy contract. For the each of the quarters in 2019, also includes expense
related to the dissolution of certain private funds managed by LCAM.
GAAP to Non-GAAP Reconciliation: Operating ExpensesYear Ended Dec. 31, Three Months Ended
(in thousands, except percentages) (unaudited) 2018 2019 2020 1Q19 2Q19 3Q19 4Q19 1Q20 2Q20 3Q20 4Q20
Total net revenue $ 694,812 $ 758,607 $ 314,702 $ 174,418 $ 190,807 $ 204,896 $ 188,486 $ 120,206 $ 43,869 $ 74,713 $ 75,914
GAAP sales and marketing $ 268,517 $ 279,423 $ 79,055 $ 66,623 $ 69,323 $ 76,255 $ 67,222 $ 49,784 $ 8,723 $ 7,201 $ 13,347
Stock-based compensation expense 7,362 6,095 4,104 1,571 1,540 1,505 1,479 1,663 731 880 830
Cost structure simplification expense (1) 131 1,410 31 468 445 454 43 31 — — —
Restructuring costs (2) — — 1,271 — — — — — 1,379 (108) —
Other items (3) — — 80 — — — — — 80 — —
Non-GAAP sales and marketing $ 261,024 $ 271,918 $ 73,569 $ 64,584 $ 67,338 $ 74,296 $ 65,700 $ 48,090 $ 6,533 $ 6,429 $ 12,517
% Total net revenue 37.6 % 35.8 % 23.4 % 37.0 % 35.3 % 36.3 % 34.9 % 40.0 % 14.9 % 8.6 % 16.5 %
GAAP origination and servicing $ 99,376 $ 103,403 $ 71,193 $ 28,273 $ 24,931 $ 27,996 $ 22,203 $ 20,994 $ 17,830 $ 15,595 $ 16,774
Stock-based compensation expense 4,322 3,155 2,689 924 846 852 533 636 722 721 610
Cost structure simplification expense (1) 749 5,908 144 3,238 201 2,324 145 144 — — —
Restructuring costs (2) — — 793 — — — — — 906 (34) (79)
Other items (3) — — 293 — — — — — 261 8 24
Non-GAAP origination and servicing $ 94,305 $ 94,340 $ 67,274 $ 24,111 $ 23,884 $ 24,820 $ 21,525 $ 20,214 $ 15,941 $ 14,900 $ 16,219
% Total net revenue 13.6 % 12.4 % 21.4 % 13.8 % 12.5 % 12.1 % 11.4 % 16.8 % 36.3 % 19.9 % 21.4 %
GAAP engineering and product development $ 155,255 $ 168,380 $ 139,050 $ 42,546 $ 43,299 $ 41,455 $ 41,080 $ 38,710 $ 39,167 $ 31,984 $ 29,189
Stock-based compensation expense 20,478 19,860 13,411 5,231 5,475 4,737 4,417 4,615 2,668 3,295 2,833
Depreciation and amortization 45,037 49,207 40,897 13,373 11,838 11,464 12,532 10,423 10,177 10,198 10,099
Cost structure simplification expense (1) — 15 — 7 8 10 (10) — — — —
Restructuring costs (2) — — 7,245 — — — — — 7,472 (225) (2)
Other items (3) — — 623 — — — — 615 8 — —
Non-GAAP engineering and product development $ 89,740 $ 99,298 $ 76,874 $ 23,935 $ 25,978 $ 25,244 $ 24,141 $ 23,057 $ 18,842 $ 18,716 $ 16,259
% Total net revenue 12.9 % 13.1 % 24.4 % 13.7 % 13.6 % 12.3 % 12.8 % 19.2 % 43.0 % 25.1 % 21.4 %
GAAP other general and administrative, legal, regulatory and other expense related to legacy issues and goodwill impairment $ 299,774 $ 238,292 $ 213,021 $ 56,876 $ 64,324 $ 59,485 $ 57,607 $ 58,486 $ 56,620 $ 54,332 $ 43,583
Stock-based compensation expense 42,925 44,529 41,329 10,526 12,690 11,001 10,312 11,215 10,083 10,226 9,805
Depreciation 5,852 6,446 5,847 1,542 1,596 1,569 1,739 1,603 1,480 1,394 1,370
Acquisition and related expenses (4) — 932 13,184 — — — 932 3,611 456 4,373 4,744
Amortization of intangibles 3,875 3,499 3,122 940 866 845 848 846 772 752 752
Cost structure simplification expense (1) 5,902 2,600 53 559 1,280 655 106 53 — — —
Restructuring costs (2) — — 8,480 — — — — — 7,279 1,120 81
Goodwill impairment 35,633 — — — — — — — — — —
Legal, regulatory and other expense related to legacy issues (5) 53,518 19,609 15,133 4,145 6,791 4,142 4,531 4,476 4,354 6,120 183
Other items (3) — 2,453 1,641 — 704 749 1,000 6 2,024 — (389)
Non-GAAP other general and administrative $ 152,069 $ 158,224 $ 124,232 $ 39,164 $ 40,397 $ 40,524 $ 38,139 $ 36,676 $ 30,172 $ 30,347 $ 27,037
% Total net revenue 21.9 % 20.9 % 39.5 % 22.5 % 21.2 % 19.8 % 20.2 % 30.5 % 68.8 % 40.6 % 35.6 %
(1) Excludes the portion of personnel-related expense associated with establishing a site in the Salt Lake City area that are included in the “Sales and marketing” and “Origination and servicing” expense categories.(2) Excludes the portion of expenses included in the “Sales and marketing” and “Origination and servicing” expense categories.
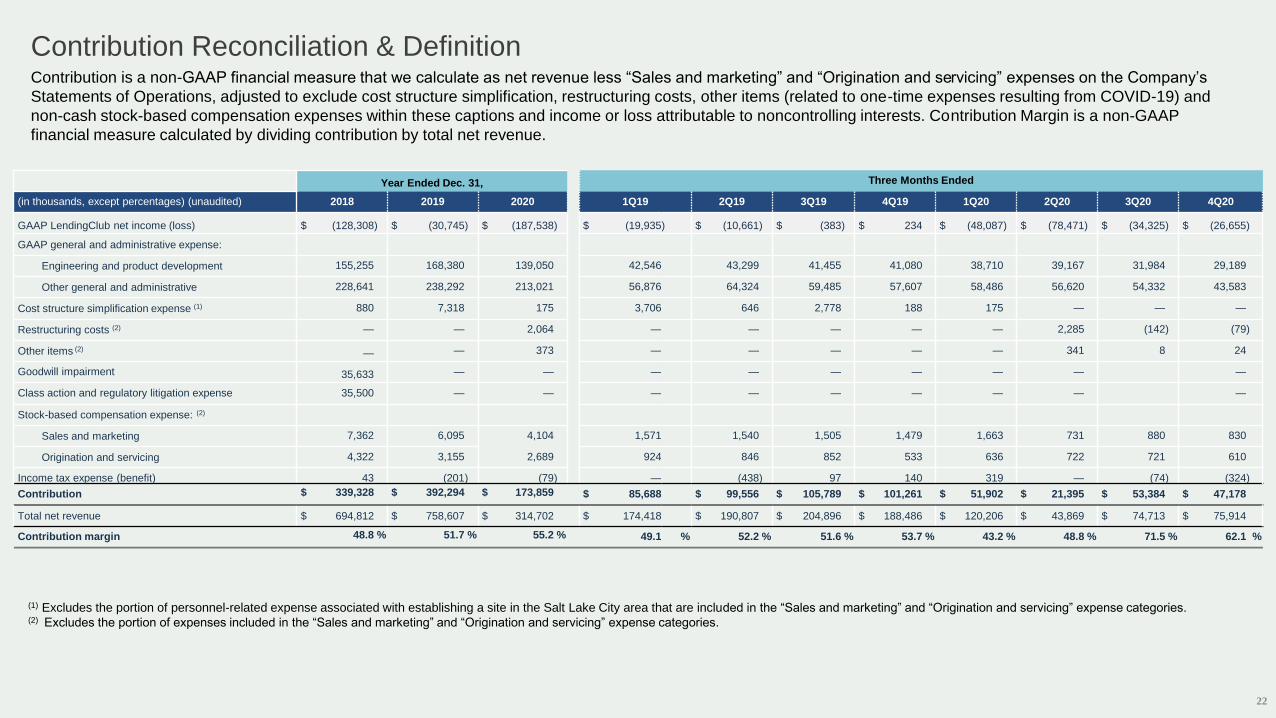
Contribution Reconciliation & DefinitionContribution is a non-GAAP financial measure that we calculate as net revenue less “Sales and marketing” and “Origination and servicing” expenses on the Company’s
Statements of Operations, adjusted to exclude cost structure simplification, restructuring costs, other items (related to one-time expenses resulting from COVID-19) and
non-cash stock-based compensation expenses within these captions and income or loss attributable to noncontrolling interests. Contribution Margin is a non-GAAP
financial measure calculated by dividing contribution by total net revenue.
Year Ended Dec. 31, Three Months Ended
(in thousands, except percentages) (unaudited) 2018 2019 2020 1Q19 2Q19 3Q19 4Q19 1Q20 2Q20 3Q20 4Q20
GAAP LendingClub net income (loss) $ (128,308) $ (30,745) $ (187,538) $ (19,935) $ (10,661) $ (383) $ 234 $ (48,087) $ (78,471) $ (34,325) $ (26,655)
GAAP general and administrative expense:
Engineering and product development 155,255 168,380 139,050 42,546 43,299 41,455 41,080 38,710 39,167 31,984 29,189
Other general and administrative 228,641 238,292 213,021 56,876 64,324 59,485 57,607 58,486 56,620 54,332 43,583
Cost structure simplification expense (1) 880 7,318 175 3,706 646 2,778 188 175 — — —
Restructuring costs (2) — — 2,064 — — — — — 2,285 (142) (79)
Other items (2)— — 373 — — — — — 341 8 24
Goodwill impairment 35,633 — — — — — — — — —
Class action and regulatory litigation expense 35,500 — — — — — — — — —
Stock-based compensation expense: (2)
Sales and marketing 7,362 6,095 4,104 1,571 1,540 1,505 1,479 1,663 731 880 830
Origination and servicing 4,322 3,155 2,689 924 846 852 533 636 722 721 610
Income tax expense (benefit) 43 (201) (79) — (438) 97 140 319 — (74) (324)
Contribution $ 339,328 $ 392,294 $ 173,859 $ 85,688 $ 99,556 $ 105,789 $ 101,261 $ 51,902 $ 21,395 $ 53,384 $ 47,178
Total net revenue $ 694,812 $ 758,607 $ 314,702 $ 174,418 $ 190,807 $ 204,896 $ 188,486 $ 120,206 $ 43,869 $ 74,713 $ 75,914
Contribution margin 48.8 % 51.7 % 55.2 % 49.1 % 52.2 % 51.6 % 53.7 % 43.2 % 48.8 % 71.5 % 62.1 %
22
23
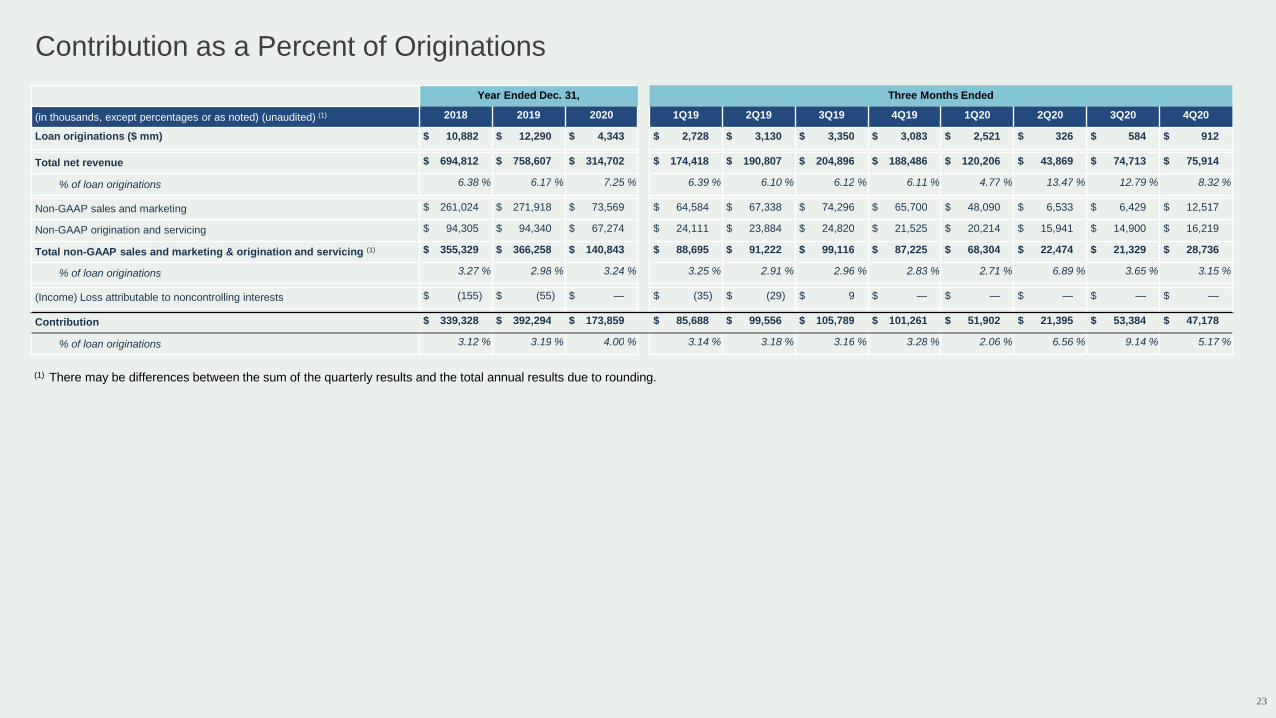
Contribution as a Percent of Originations
(1) There may be differences between the sum of the quarterly results and the total annual results due to rounding.
Year Ended Dec. 31, Three Months Ended
(in thousands, except percentages or as noted) (unaudited) (1) 2018 2019 2020 1Q19 2Q19 3Q19 4Q19 1Q20 2Q20 3Q20 4Q20
Loan originations ($ mm) $ 10,882 $ 12,290 $ 4,343 $ 2,728 $ 3,130 $ 3,350 $ 3,083 $ 2,521 $ 326 $ 584 $ 912
Total net revenue $ 694,812 $ 758,607 $ 314,702 $ 174,418 $ 190,807 $ 204,896 $ 188,486 $ 120,206 $ 43,869 $ 74,713 $ 75,914
% of loan originations 6.38 % 6.17 % 7.25 % 6.39 % 6.10 % 6.12 % 6.11 % 4.77 % 13.47 % 12.79 % 8.32 %
Non-GAAP sales and marketing $ 261,024 $ 271,918 $ 73,569 $ 64,584 $ 67,338 $ 74,296 $ 65,700 $ 48,090 $ 6,533 $ 6,429 $ 12,517
Non-GAAP origination and servicing $ 94,305 $ 94,340 $ 67,274 $ 24,111 $ 23,884 $ 24,820 $ 21,525 $ 20,214 $ 15,941 $ 14,900 $ 16,219
Total non-GAAP sales and marketing & origination and servicing (1) $ 355,329 $ 366,258 $ 140,843 $ 88,695 $ 91,222 $ 99,116 $ 87,225 $ 68,304 $ 22,474 $ 21,329 $ 28,736
% of loan originations 3.27 % 2.98 % 3.24 % 3.25 % 2.91 % 2.96 % 2.83 % 2.71 % 6.89 % 3.65 % 3.15 %
(Income) Loss attributable to noncontrolling interests $ (155) $ (55) $ — $ (35) $ (29) $ 9 $ — $ — $ — $ — $ —
Contribution $ 339,328 $ 392,294 $ 173,859 $ 85,688 $ 99,556 $ 105,789 $ 101,261 $ 51,902 $ 21,395 $ 53,384 $ 47,178
% of loan originations 3.12 % 3.19 % 4.00 % 3.14 % 3.18 % 3.16 % 3.28 % 2.06 % 6.56 % 9.14 % 5.17 %
24
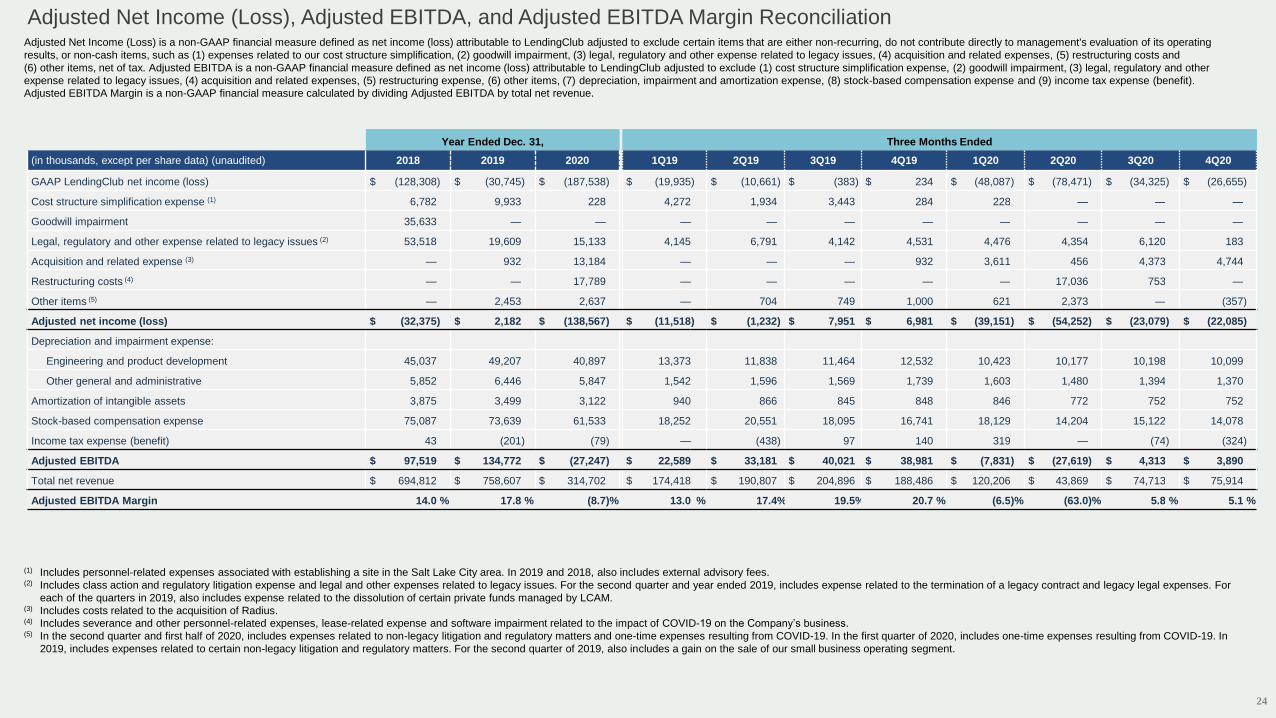
Adjusted Net Income (Loss), Adjusted EBITDA, and Adjusted EBITDA Margin Reconciliation
(1) Includes personnel-related expenses associated with establishing a site in the Salt Lake City area. In 2019 and 2018, also includes external advisory fees.(2) Includes class action and regulatory litigation expense and legal and other expenses related to legacy issues. For the second quarter and year ended 2019, includes expense related to the termination of a legacy contract and legacy legal expenses. For
each of the quarters in 2019, also includes expense related to the dissolution of certain private funds managed by LCAM.(3) Includes costs related to the acquisition of Radius.(4) Includes severance and other personnel-related expenses, lease-related expense and software impairment related to the impact of COVID-19 on the Company’s business.(5) In the second quarter and first half of 2020, includes expenses related to non-legacy litigation and regulatory matters and one-time expenses resulting from COVID-19. In the first quarter of 2020, includes one-time expenses resulting from COVID-19. In
2019, includes expenses related to certain non-legacy litigation and regulatory matters. For the second quarter of 2019, also includes a gain on the sale of our small business operating segment.
Adjusted Net Income (Loss) is a non-GAAP financial measure defined as net income (loss) attributable to LendingClub adjusted to exclude certain items that are either non-recurring, do not contribute directly to management's evaluation of its operating
results, or non-cash items, such as (1) expenses related to our cost structure simplification, (2) goodwill impairment, (3) legal, regulatory and other expense related to legacy issues, (4) acquisition and related expenses, (5) restructuring costs and
(6) other items, net of tax. Adjusted EBITDA is a non-GAAP financial measure defined as net income (loss) attributable to LendingClub adjusted to exclude (1) cost structure simplification expense, (2) goodwill impairment, (3) legal, regulatory and other
expense related to legacy issues, (4) acquisition and related expenses, (5) restructuring expense, (6) other items, (7) depreciation, impairment and amortization expense, (8) stock-based compensation expense and (9) income tax expense (benefit).
Adjusted EBITDA Margin is a non-GAAP financial measure calculated by dividing Adjusted EBITDA by total net revenue.
Year Ended Dec. 31, Three Months Ended
(in thousands, except per share data) (unaudited) 2018 2019 2020 1Q19 2Q19 3Q19 4Q19 1Q20 2Q20 3Q20 4Q20
GAAP LendingClub net income (loss) $ (128,308) $ (30,745) $ (187,538) $ (19,935) $ (10,661) $ (383) $ 234 $ (48,087) $ (78,471) $ (34,325) $ (26,655)
Cost structure simplification expense (1) 6,782 9,933 228 4,272 1,934 3,443 284 228 — — —
Goodwill impairment 35,633 — — — — — — — — — —
Legal, regulatory and other expense related to legacy issues (2) 53,518 19,609 15,133 4,145 6,791 4,142 4,531 4,476 4,354 6,120 183
Acquisition and related expense (3) — 932 13,184 — — — 932 3,611 456 4,373 4,744
Restructuring costs (4) — — 17,789 — — — — — 17,036 753 —
Other items (5) — 2,453 2,637 — 704 749 1,000 621 2,373 — (357)
Adjusted net income (loss) $ (32,375) $ 2,182 $ (138,567) $ (11,518) $ (1,232) $ 7,951 $ 6,981 $ (39,151) $ (54,252) $ (23,079) $ (22,085)
Depreciation and impairment expense:
Engineering and product development 45,037 49,207 40,897 13,373 11,838 11,464 12,532 10,423 10,177 10,198 10,099
Other general and administrative 5,852 6,446 5,847 1,542 1,596 1,569 1,739 1,603 1,480 1,394 1,370
Amortization of intangible assets 3,875 3,499 3,122 940 866 845 848 846 772 752 752
Stock-based compensation expense 75,087 73,639 61,533 18,252 20,551 18,095 16,741 18,129 14,204 15,122 14,078
Income tax expense (benefit) 43 (201) (79) — (438) 97 140 319 — (74) (324)
Adjusted EBITDA $ 97,519 $ 134,772 $ (27,247) $ 22,589 $ 33,181 $ 40,021 $ 38,981 $ (7,831) $ (27,619) $ 4,313 $ 3,890
Total net revenue $ 694,812 $ 758,607 $ 314,702 $ 174,418 $ 190,807 $ 204,896 $ 188,486 $ 120,206 $ 43,869 $ 74,713 $ 75,914
Adjusted EBITDA Margin 14.0 % 17.8 % (8.7)% 13.0 % 17.4% 19.5% 20.7 % (6.5)% (63.0)% 5.8 % 5.1 %
25
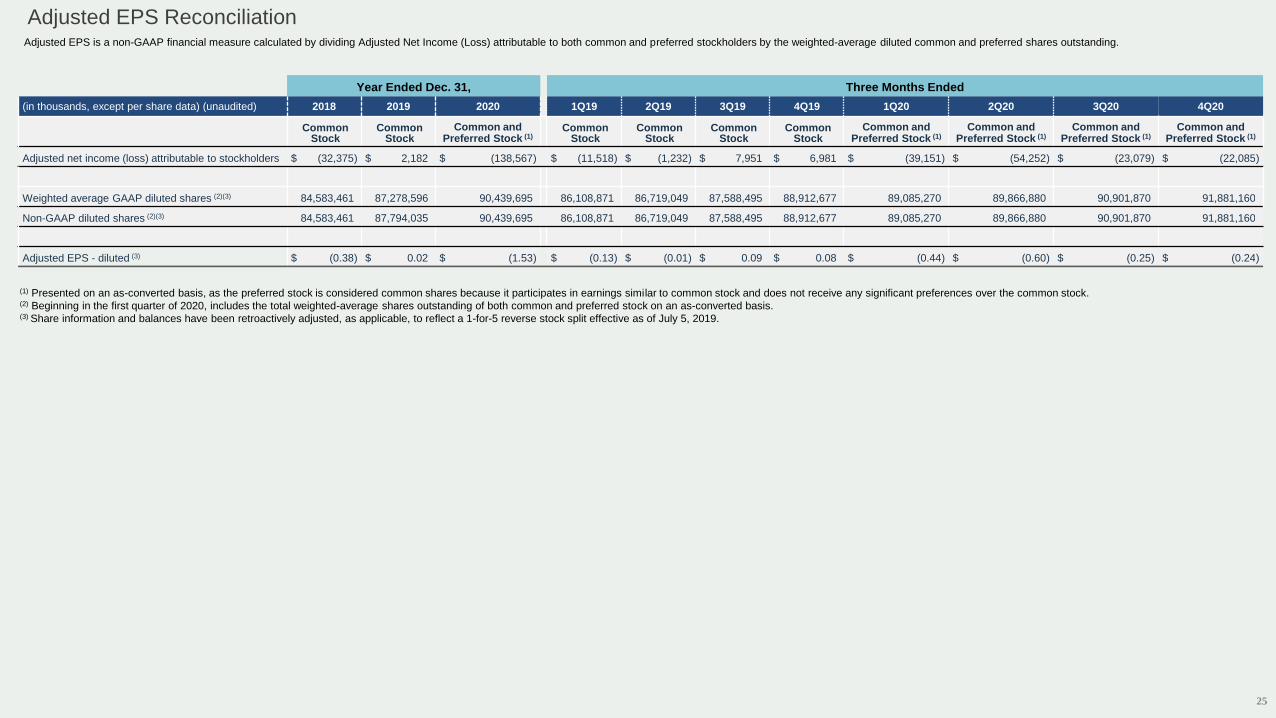
(1) Presented on an as-converted basis, as the preferred stock is considered common shares because it participates in earnings similar to common stock and does not receive any significant preferences over the common stock. (2) Beginning in the first quarter of 2020, includes the total weighted-average shares outstanding of both common and preferred stock on an as-converted basis. (3) Share information and balances have been retroactively adjusted, as applicable, to reflect a 1-for-5 reverse stock split effective as of July 5, 2019.
Adjusted EPS ReconciliationAdjusted EPS is a non-GAAP financial measure calculated by dividing Adjusted Net Income (Loss) attributable to both common and preferred stockholders by the weighted-average diluted common and preferred shares outstanding.
Year Ended Dec. 31, Three Months Ended
(in thousands, except per share data) (unaudited) 2018 2019 2020 1Q19 2Q19 3Q19 4Q19 1Q20 2Q20 3Q20 4Q20
Common Stock
Common Stock
Common and Preferred Stock (1)
Common Stock
Common Stock
Common Stock
Common Stock
Common and Preferred Stock (1)
Common and Preferred Stock (1)
Common and Preferred Stock (1)
Common and Preferred Stock (1)
Adjusted net income (loss) attributable to stockholders $ (32,375) $ 2,182 $ (138,567) $ (11,518) $ (1,232) $ 7,951 $ 6,981 $ (39,151) $ (54,252) $ (23,079) $ (22,085)
Weighted average GAAP diluted shares (2)(3) 84,583,461 87,278,596 90,439,695 86,108,871 86,719,049 87,588,495 88,912,677 89,085,270 89,866,880 90,901,870 91,881,160
Non-GAAP diluted shares (2)(3) 84,583,461 87,794,035 90,439,695 86,108,871 86,719,049 87,588,495 88,912,677 89,085,270 89,866,880 90,901,870 91,881,160
Adjusted EPS - diluted (3) $ (0.38) $ 0.02 $ (1.53) $ (0.13) $ (0.01) $ 0.09 $ 0.08 $ (0.44) $ (0.60) $ (0.25) $ (0.24)
26
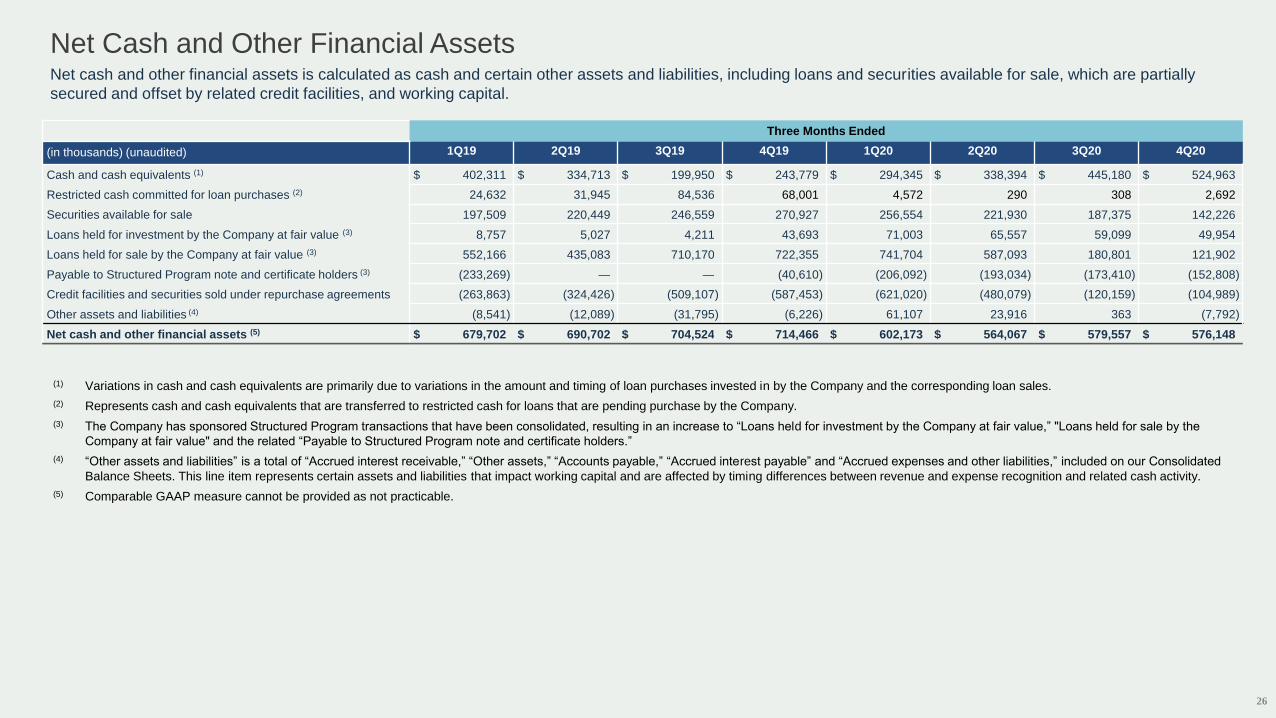
Net Cash and Other Financial AssetsNet cash and other financial assets is calculated as cash and certain other assets and liabilities, including loans and securities available for sale, which are partially
secured and offset by related credit facilities, and working capital.
Three Months Ended
(in thousands) (unaudited) 1Q19 2Q19 3Q19 4Q19 1Q20 2Q20 3Q20 4Q20
Cash and cash equivalents (1) $ 402,311 $ 334,713 $ 199,950 $ 243,779 $ 294,345 $ 338,394 $ 445,180 $ 524,963
Restricted cash committed for loan purchases (2) 24,632 31,945 84,536 68,001 4,572 290 308 2,692
Securities available for sale 197,509 220,449 246,559 270,927 256,554 221,930 187,375 142,226
Loans held for investment by the Company at fair value (3) 8,757 5,027 4,211 43,693 71,003 65,557 59,099 49,954
Loans held for sale by the Company at fair value (3) 552,166 435,083 710,170 722,355 741,704 587,093 180,801 121,902
Payable to Structured Program note and certificate holders (3) (233,269) — — (40,610) (206,092) (193,034) (173,410) (152,808)
Credit facilities and securities sold under repurchase agreements (263,863) (324,426) (509,107) (587,453) (621,020) (480,079) (120,159) (104,989)
Other assets and liabilities (4) (8,541) (12,089) (31,795) (6,226) 61,107 23,916 363 (7,792)
Net cash and other financial assets (5) $ 679,702 $ 690,702 $ 704,524 $ 714,466 $ 602,173 $ 564,067 $ 579,557 $ 576,148
(1) Variations in cash and cash equivalents are primarily due to variations in the amount and timing of loan purchases invested in by the Company and the corresponding loan sales.
(2) Represents cash and cash equivalents that are transferred to restricted cash for loans that are pending purchase by the Company.
(3) The Company has sponsored Structured Program transactions that have been consolidated, resulting in an increase to “Loans held for investment by the Company at fair value,” "Loans held for sale by the
Company at fair value" and the related “Payable to Structured Program note and certificate holders.”
(4) “Other assets and liabilities” is a total of “Accrued interest receivable,” “Other assets,” “Accounts payable,” “Accrued interest payable” and “Accrued expenses and other liabilities,” included on our Consolidated
Balance Sheets. This line item represents certain assets and liabilities that impact working capital and are affected by timing differences between revenue and expense recognition and related cash activity.
(5) Comparable GAAP measure cannot be provided as not practicable.