8-1 quality improvement and statistics definitions of quality quality means fitness for use -...
Post on 21-Dec-2015
219 views
TRANSCRIPT


8-1 Quality Improvement and Statistics
• Definitions of Quality Quality means fitness for use
- quality of design
- quality of conformance
Quality is inversely proportional to variability.

8-1 Quality Improvement and Statistics
• Quality Improvement
Quality improvement is the reduction of variability in processes and products.
Alternatively, quality improvement is also seen as “waste reduction”.

8-1 Quality Improvement and Statistics
• Statistical process control is a collection of tools that when used together can result in process stability and variance reduction.
8-2 Statistical Process Control
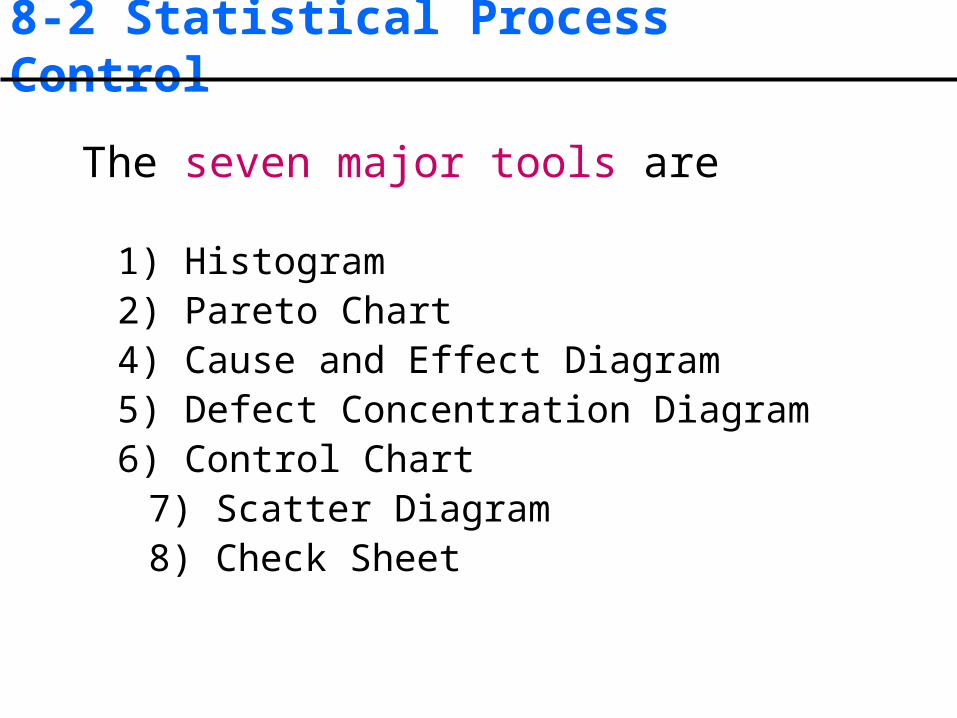
The seven major tools are
1) Histogram2) Pareto Chart4) Cause and Effect Diagram5) Defect Concentration Diagram6) Control Chart
7) Scatter Diagram 8) Check Sheet

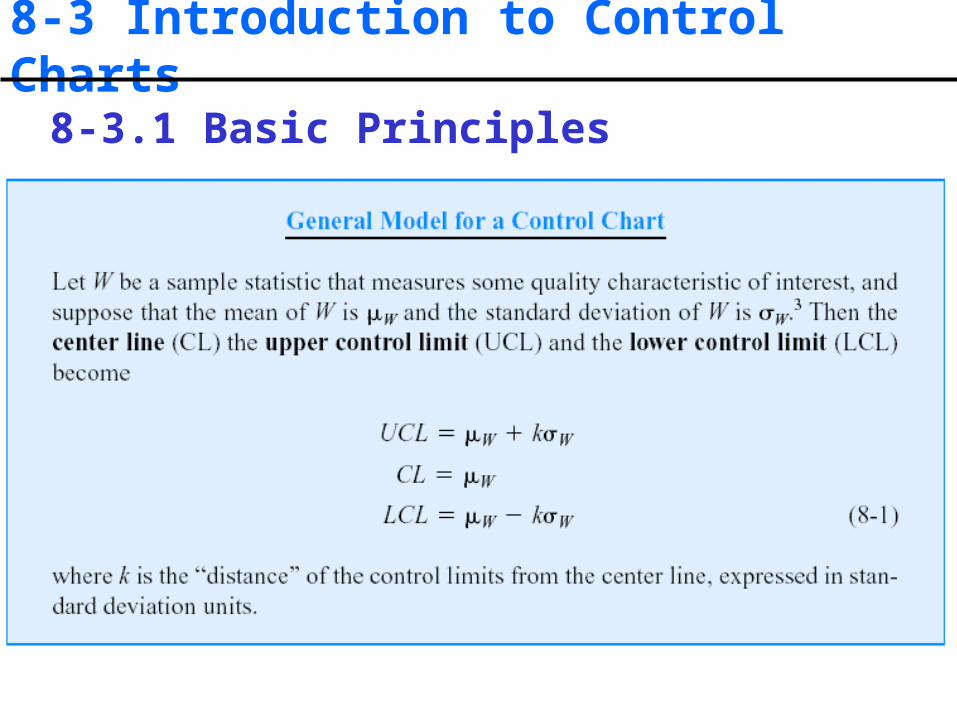
8-3 Introduction to Control Charts
8-3.1 Basic Principles
• A process that is operating with only chance causes of variation present is said to be in statistical control.
• A process that is operating in the presence of assignable causes is said to be out of control.
• The eventual goal of SPC is the elimination of variability in the process.

8-3 Introduction to Control Charts
8-3.1 Basic PrinciplesA typical control chart has control limits set at values such that if the process is in control, nearly all points will lie within the upper control limit (UCL) and the lower control limit (LCL).

8-3 Introduction to Control Charts
8-3.1 Basic Principles
8-3 Introduction to Control Charts
8-3.1 Basic Principles
8-3 Introduction to Control Charts
8-3.1 Basic Principles
Important uses of the control chart
1. Most processes do not operate in a state of statistical control
2. Consequently, the routine and attentive use of control charts will identify assignable causes. If these causes can be eliminated from the process, variability will be reduced and the process will be improved
3. The control chart only detects assignable causes. Management, operator, and engineering action will be necessary to eliminate the assignable causes.
8-3 Introduction to Control Charts
8-3.1 Basic Principles
Types the control chart
• Variables Control Charts– These charts are applied to data that follow a
continuous distribution.
• Attributes Control Charts– These charts are applied to data that follow a
discrete distribution.
8-3 Introduction to Control Charts
8-3.1 Basic Principles
Popularity of control charts
1) Control charts are a proven technique for improving productivity.
2) Control charts are effective in defect prevention.
3) Control charts prevent unnecessary process adjustment.
4) Control charts provide diagnostic information.
5) Control charts provide information about process capability.
8-3 Introduction to Control Charts
8-3.2 Design of a Control Chart
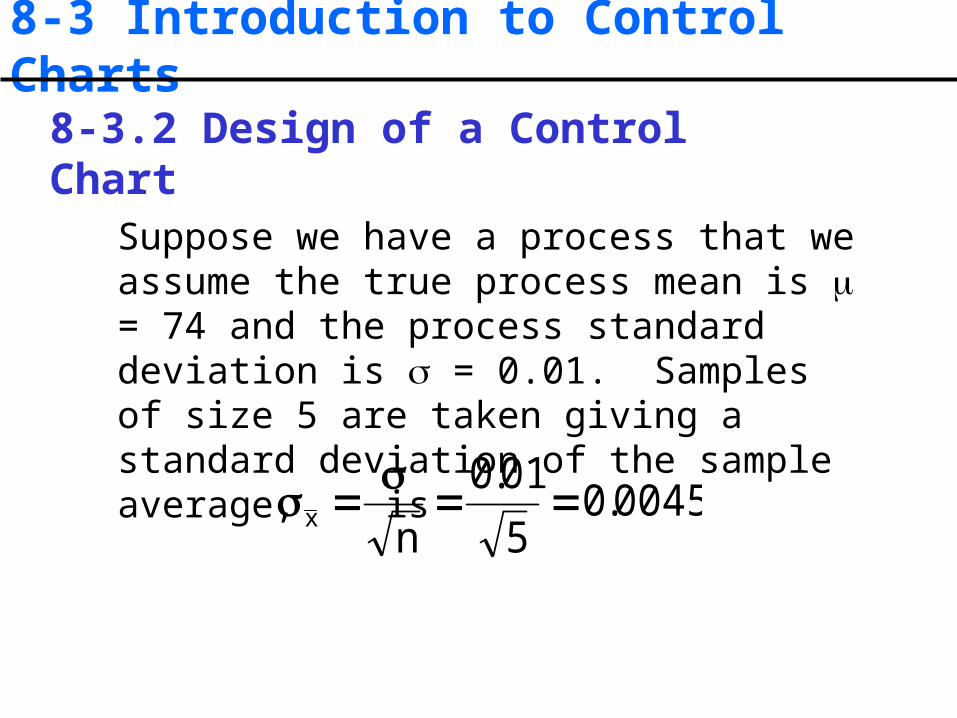
Suppose we have a process that we assume the true process mean is = 74 and the process standard deviation is = 0.01. Samples of size 5 are taken giving a standard deviation of the sample average, is
0045.0
5
01.0
nx

8-3 Introduction to Control Charts
8-3.2 Design of a Control Chart
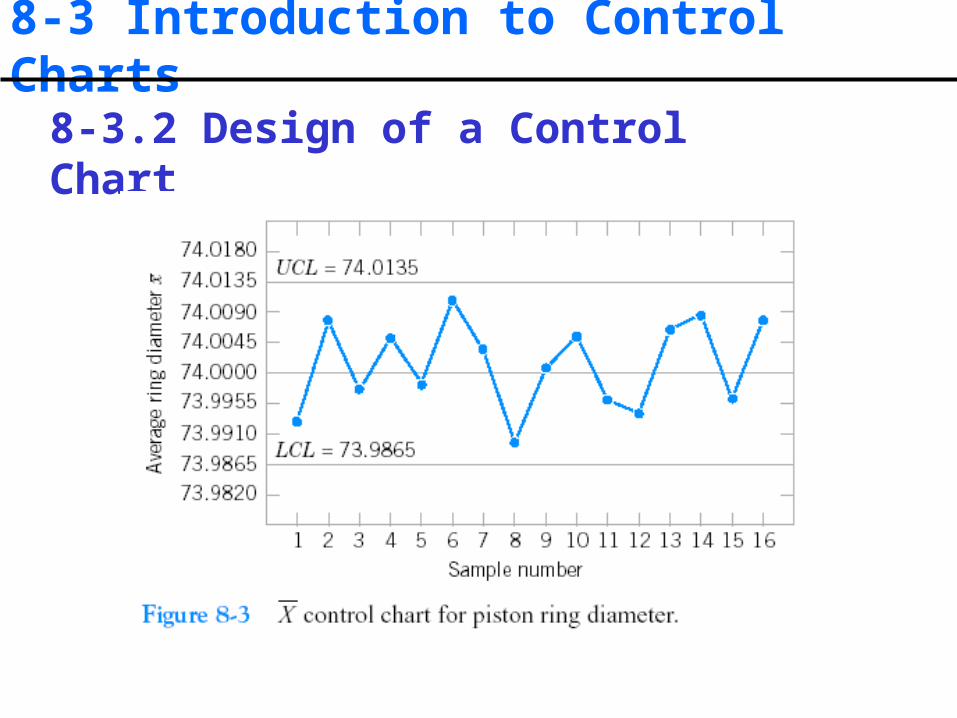
• Control limits can be set at 3 standard deviations from the mean in both directions.
• “3-Sigma Control Limits” UCL = 74 + 3(0.0045) = 74.0135 CL= 74 LCL = 74 - 3(0.0045) = 73.9865
8-3 Introduction to Control Charts
8-3.2 Design of a Control Chart
8-3 Introduction to Control Charts
8-3.2 Design of a Control Chart
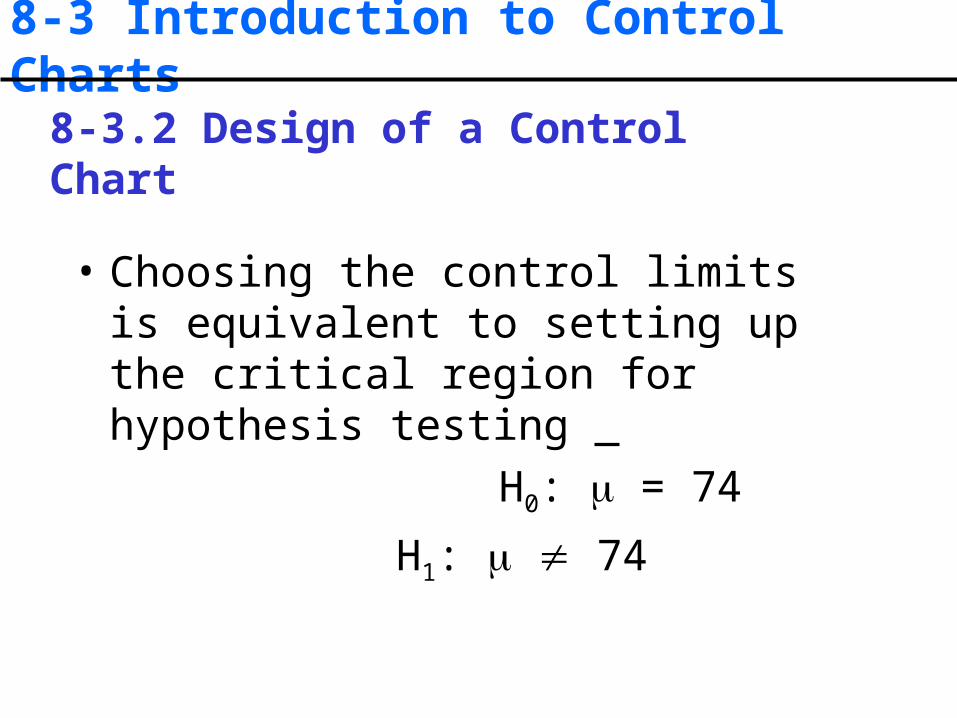
• Choosing the control limits is equivalent to setting up the critical region for hypothesis testing
H0: = 74
H1: 74
8-3 Introduction to Control Charts
8-3.3 Rational Subgroups
• Subgroups or samples should be selected so that if assignable causes are present, the chance for differences between subgroups will be maximized, while the chance for differences due to these assignable causes within a subgroup will be minimized.

8-3 Introduction to Control Charts
8-3.3 Rational Subgroups
Constructing Rational Subgroups• Select consecutive units of production.
– Provides a “snapshot” of the process.– Good at detecting process shifts.
• Select a random sample over the entire sampling interval.– Good at detecting if a mean has shifted – out-of-control and then back in-control.
8-3 Introduction to Control Charts
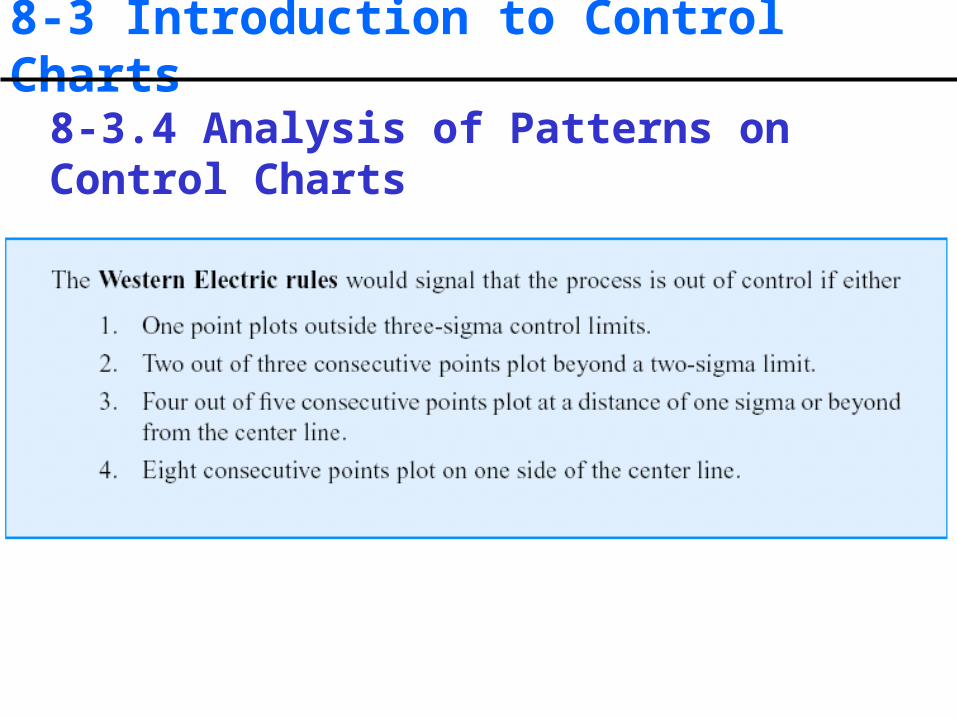
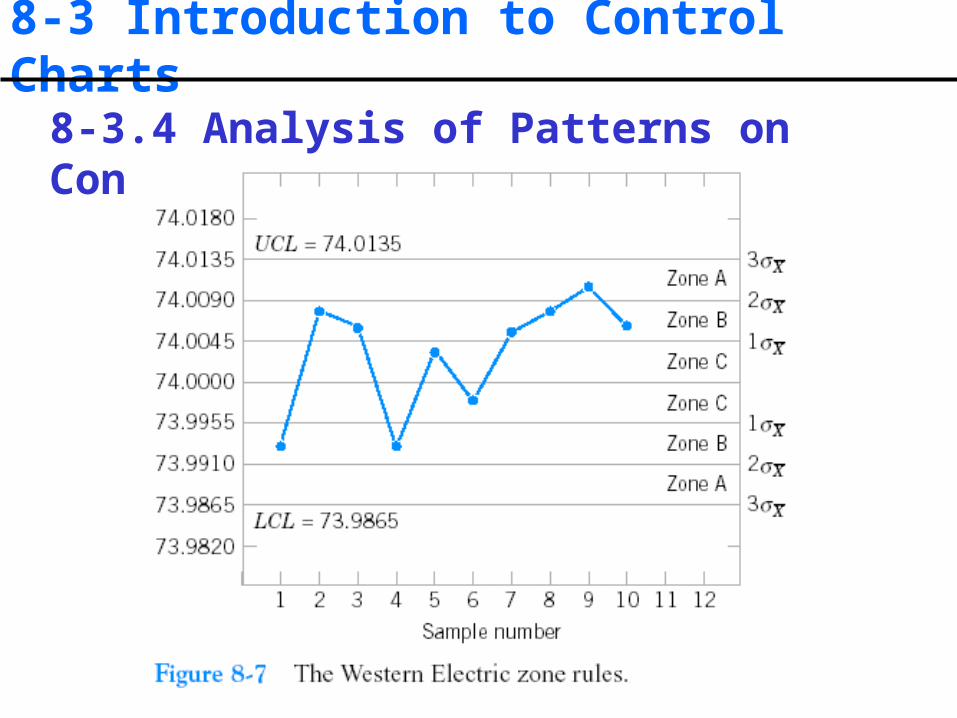
8-3.4 Analysis of Patterns on Control Charts
• Look for “runs” - this is a sequence of observations of the same type (all above the center line, or all below the center line)
• Runs of say 8 observations or more could indicate an out-of-control situation.
– Run up: a series of observations are increasing
– Run down: a series of observations are decreasing

8-3 Introduction to Control Charts
8-3.4 Analysis of Patterns on Control Charts

8-3 Introduction to Control Charts
8-3.4 Analysis of Patterns on Control Charts
8-3 Introduction to Control Charts
8-3.4 Analysis of Patterns on Control Charts
8-3 Introduction to Control Charts
8-3.4 Analysis of Patterns on Control Charts
8-3 Introduction to Control Charts
8-3.4 Analysis of Patterns on Control Charts

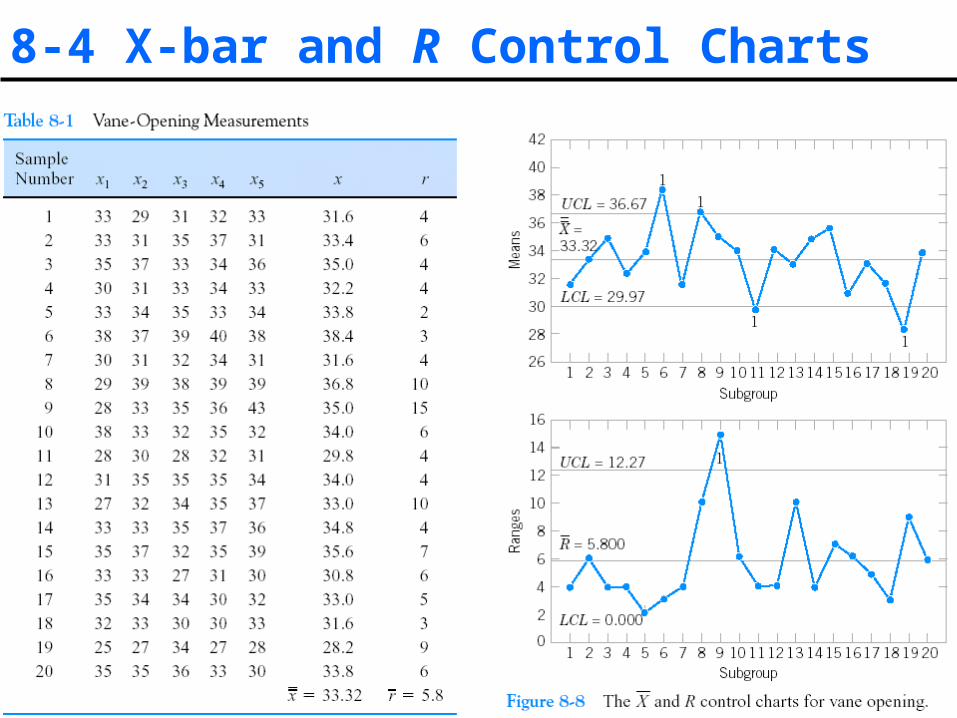
8-4 X-bar and R Control Charts
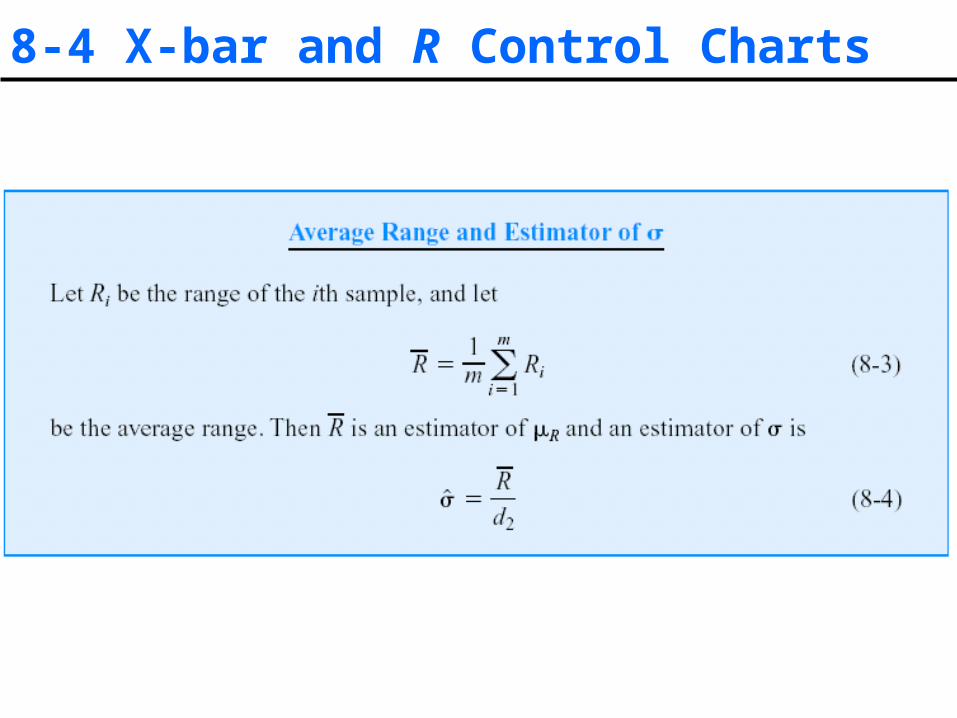
8-4 X-bar and R Control Charts

8-4 X-bar and R Control Charts

8-4 X-bar and R Control Charts
8-4 X-bar and R Control Charts

8-4 X-bar and R Control Charts
8-4 X-bar and R Control Charts
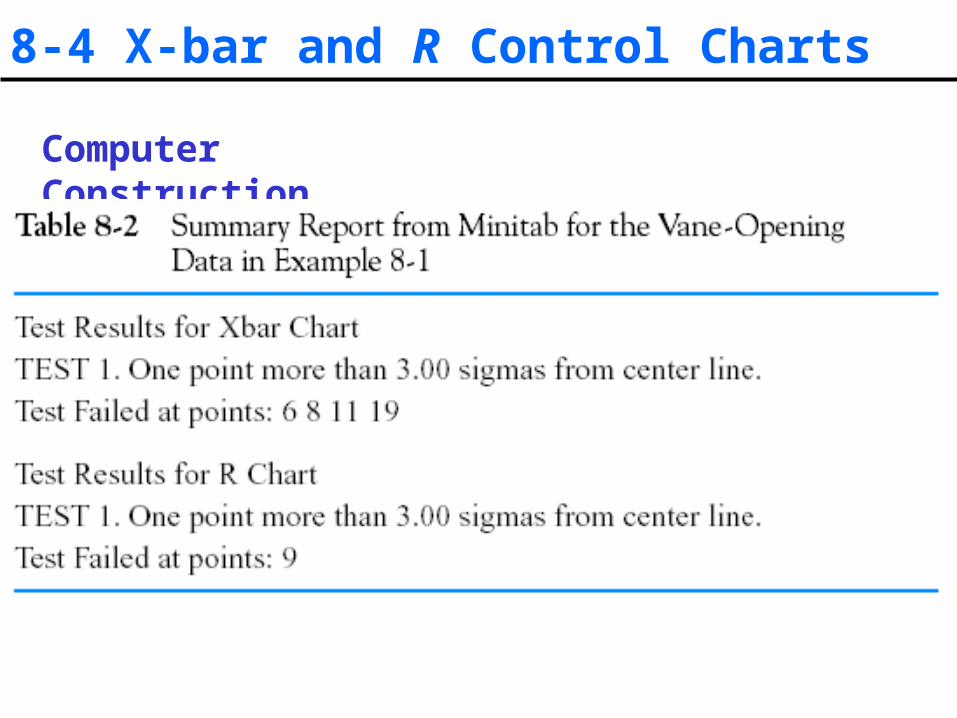
Computer Construction
8-5 Control Charts for Individual Measurements
• What if you could not get a sample size greater than 1 (n =1)? Examples include– Automated inspection and measurement technology
is used, and every unit manufactured is analyzed.– The production rate is very slow, and it is
inconvenient to allow samples sizes of N > 1 to accumulate before analysis
– Repeat measurements on the process differ only because of laboratory or analysis error, as in many chemical processes.
• The individual control charts are useful for samples of sizes n = 1.
8-5 Control Charts for Individual Measurements
• The moving range (MR) is defined as the absolute difference between two successive observations:
MRi = |xi - xi-1| which will indicate possible shifts or
changes in the process from one observation to the next.

8-5 Control Charts for Individual Measurements

8-5 Control Charts for Individual Measurements
8-5 Control Charts for Individual Measurements
• X Charts can be interpreted similar to charts. MR charts cannot be interpreted the same as or R charts.
• Since the MR chart plots data that are “correlated” with one another, then looking for patterns on the chart does not make sense.
• MR chart cannot really supply useful information about process variability.
• More emphasis should be placed on interpretation of the X chart.
Interpretation of the Charts
xx

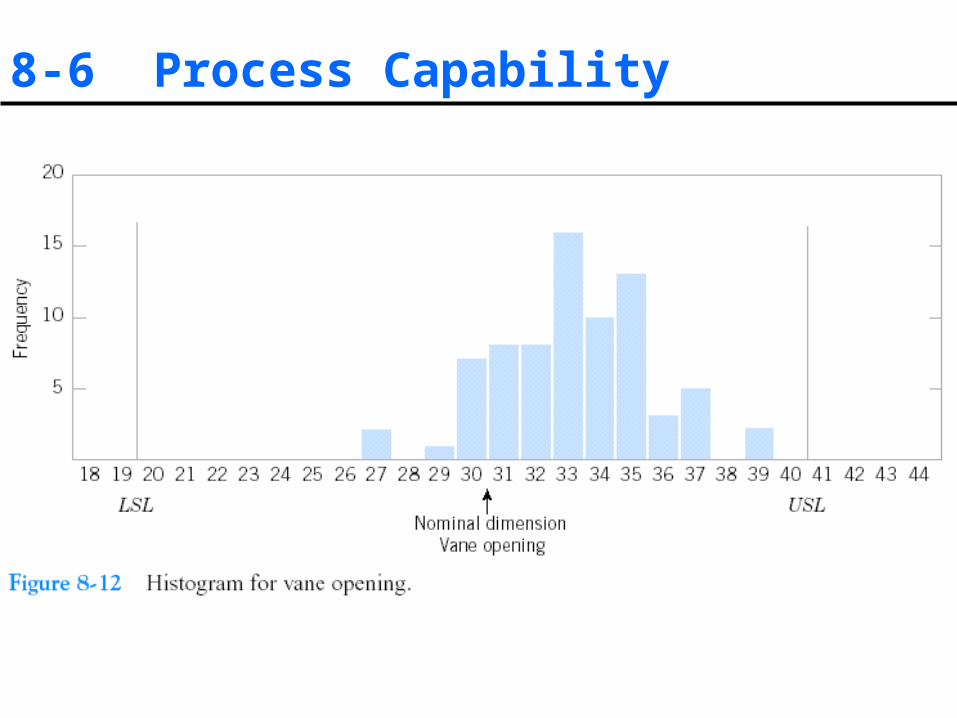
8-6 Process Capability
• Process capability refers to the performance of the process when it is operating in control.
• Two graphical tools are helpful in assessing process capability:• Tolerance chart (or tier chart)• Histogram

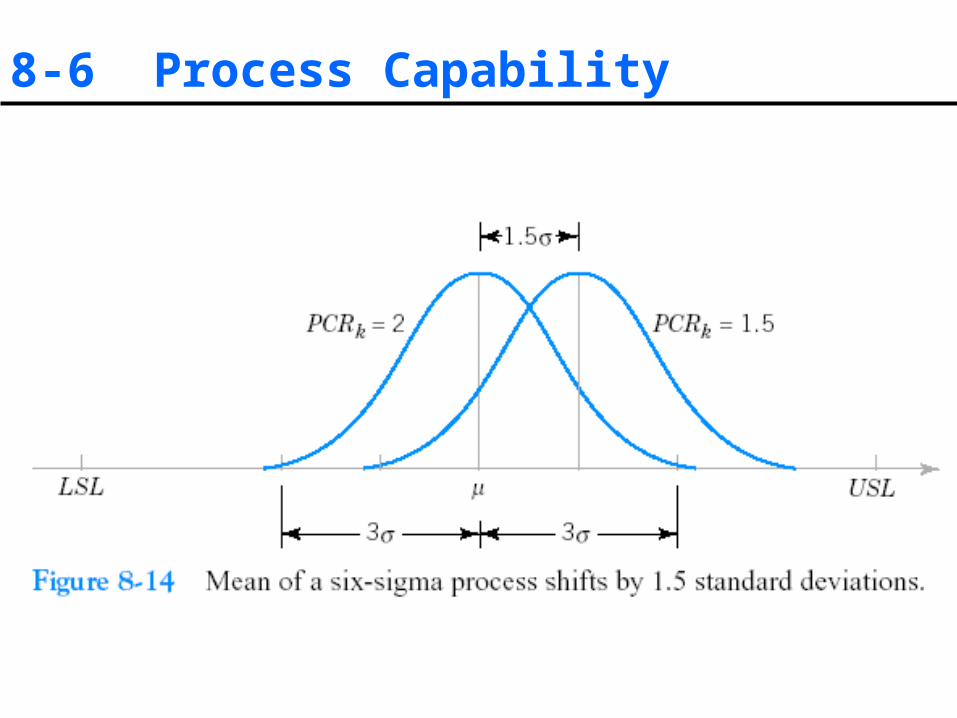
8-6 Process Capability
8-6 Process Capability

8-6 Process Capability

8-6 Process Capability
8-6 Process Capability

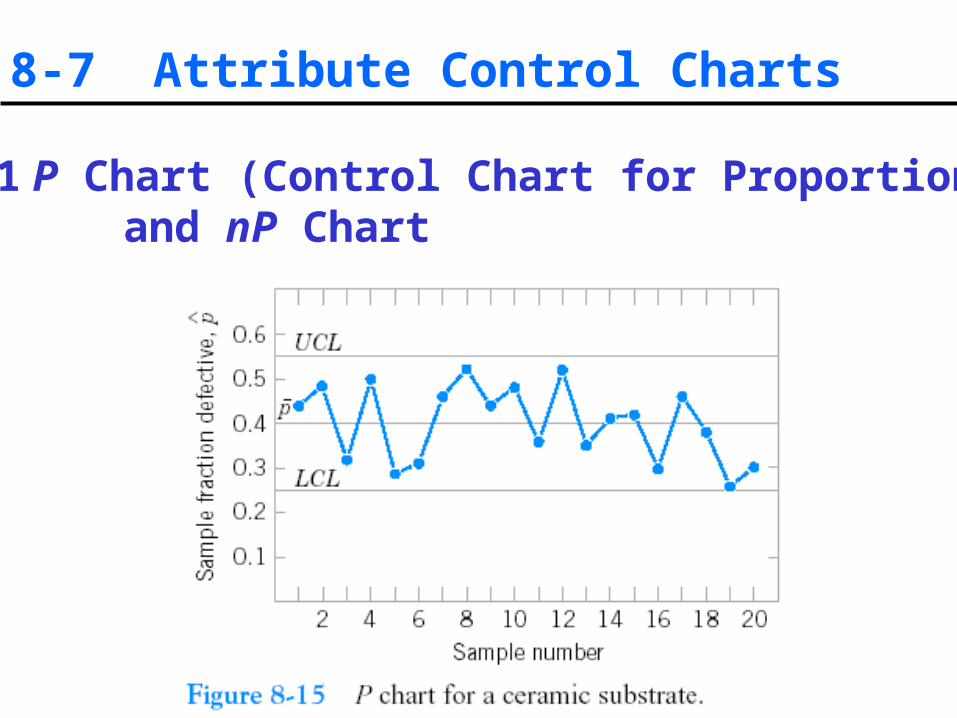
8-7 Attribute Control Charts
8-7.1 P Chart (Control Chart for Proportions) and nP Chart

8-7 Attribute Control Charts
8-7.1 P Chart (Control Chart for Proportions) and nP Chart
8-7 Attribute Control Charts
8-7.1 P Chart (Control Chart for Proportions) and nP Chart

8-7 Attribute Control Charts
8-7.1 P Chart (Control Chart for Proportions) and nP Chart
8-7 Attribute Control Charts
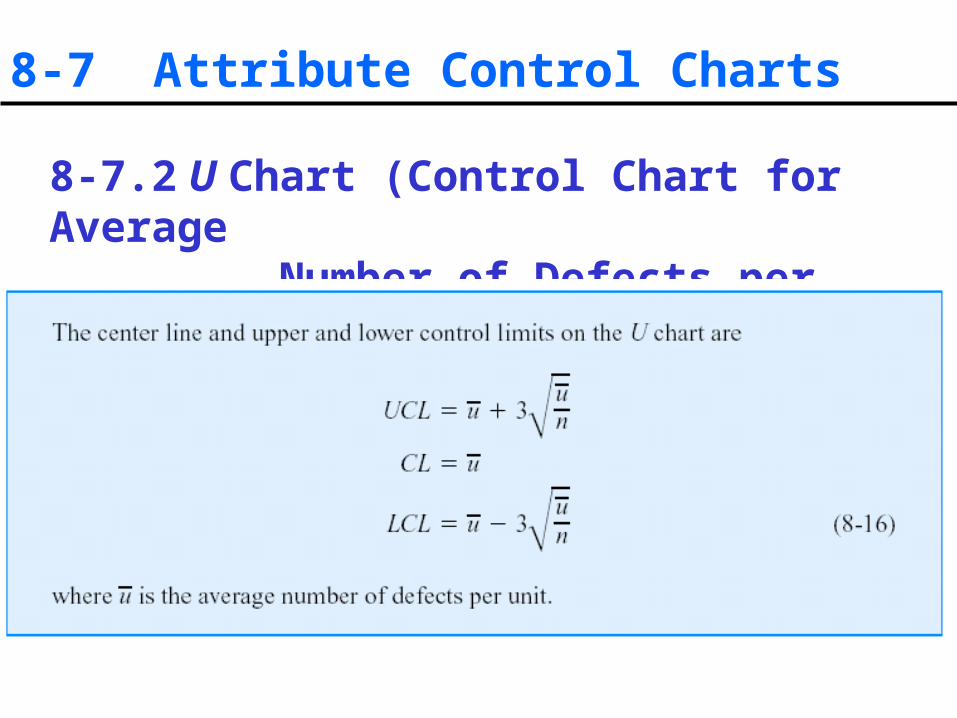
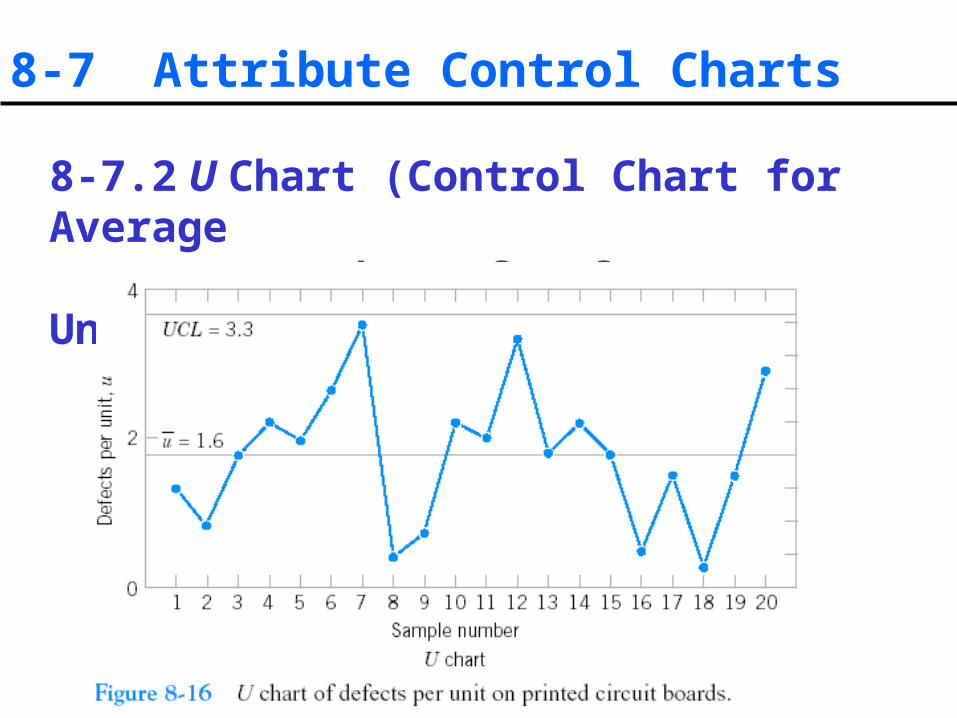
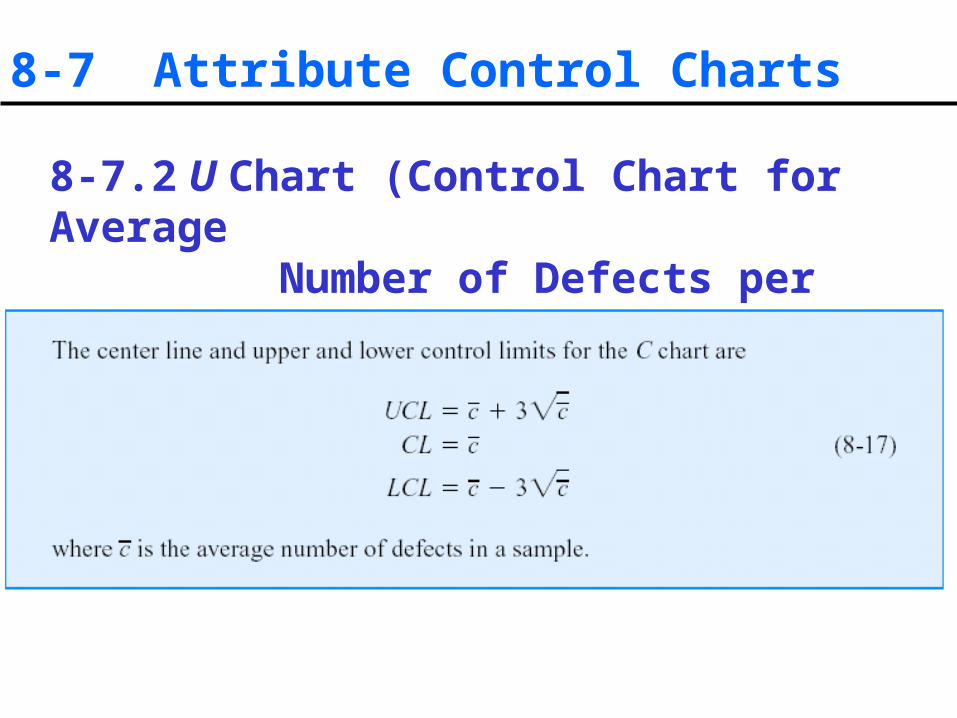
8-7.2 U Chart (Control Chart for Average Number of Defects per Unit) and C Chart

8-7 Attribute Control Charts
8-7.2 U Chart (Control Chart for Average Number of Defects per Unit) and C Chart
8-7 Attribute Control Charts
8-7.2 U Chart (Control Chart for Average Number of Defects per Unit) and C Chart
8-7 Attribute Control Charts
8-7.2 U Chart (Control Chart for Average Number of Defects per Unit) and C Chart

8-8 Control Chart Performance
Average Run Length• The average run length (ARL) is a very
important way of determining the appropriate sample size and sampling frequency.
• Let p = probability that any point exceeds the control limits. Then,

8-8 Control Chart Performance

8-8 Control Chart Performance

8-8 Control Chart Performance
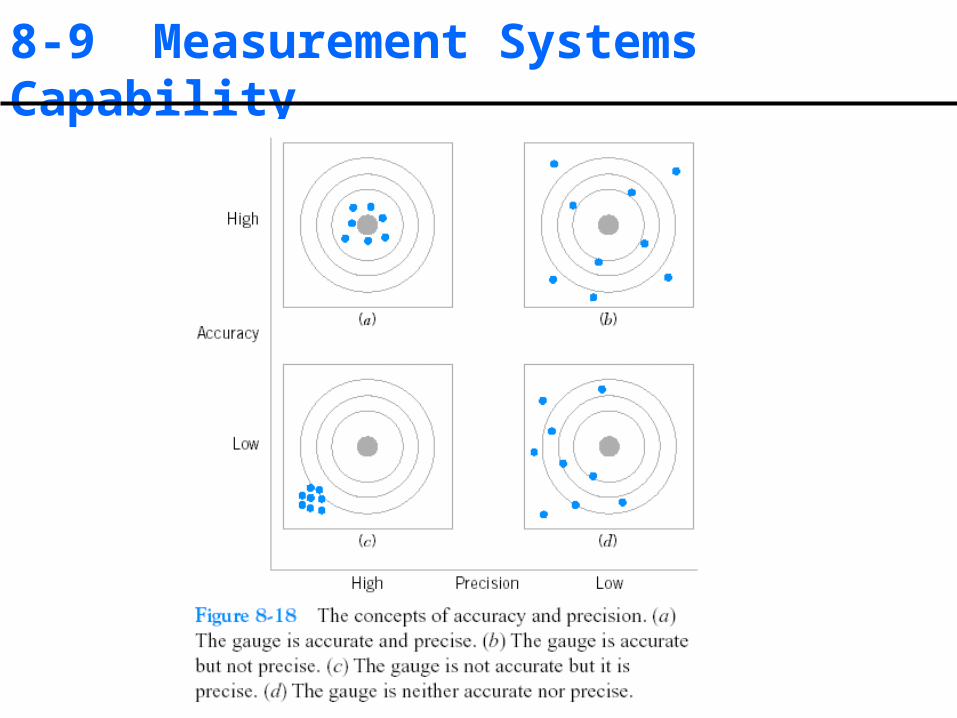
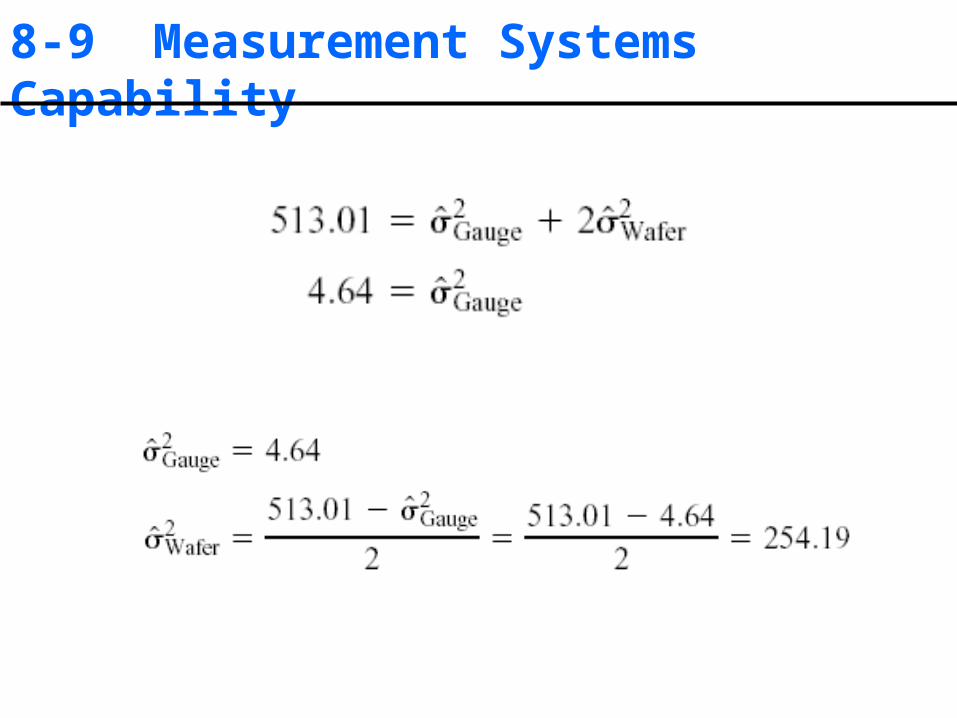
8-9 Measurement Systems Capability

8-9 Measurement Systems Capability

8-9 Measurement Systems Capability

8-9 Measurement Systems Capability

8-9 Measurement Systems Capability
8-9 Measurement Systems Capability
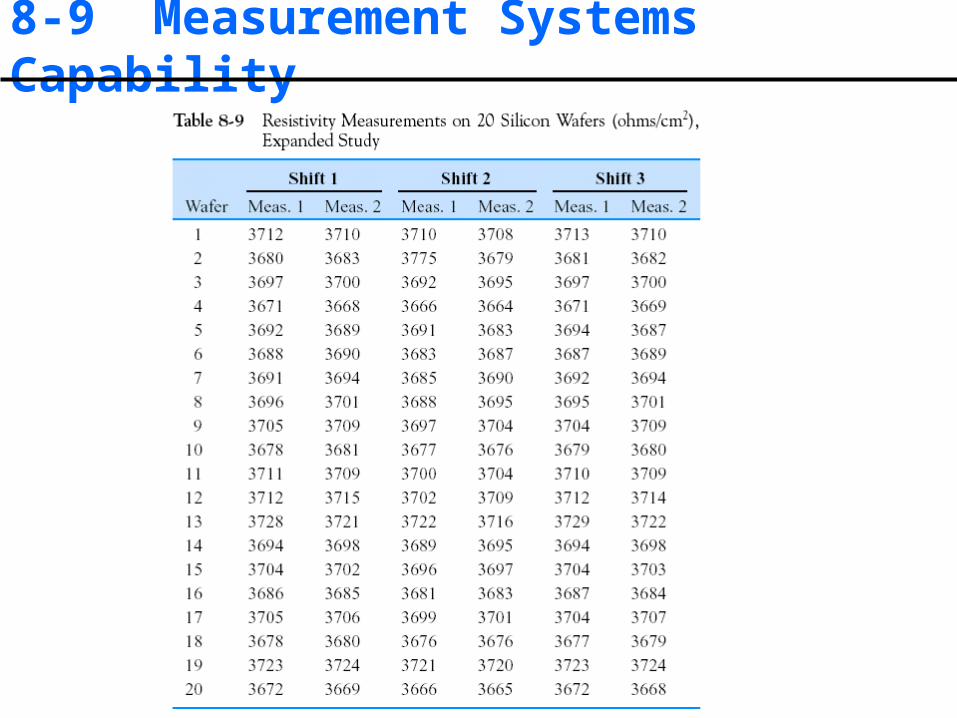
8-9 Measurement Systems Capability
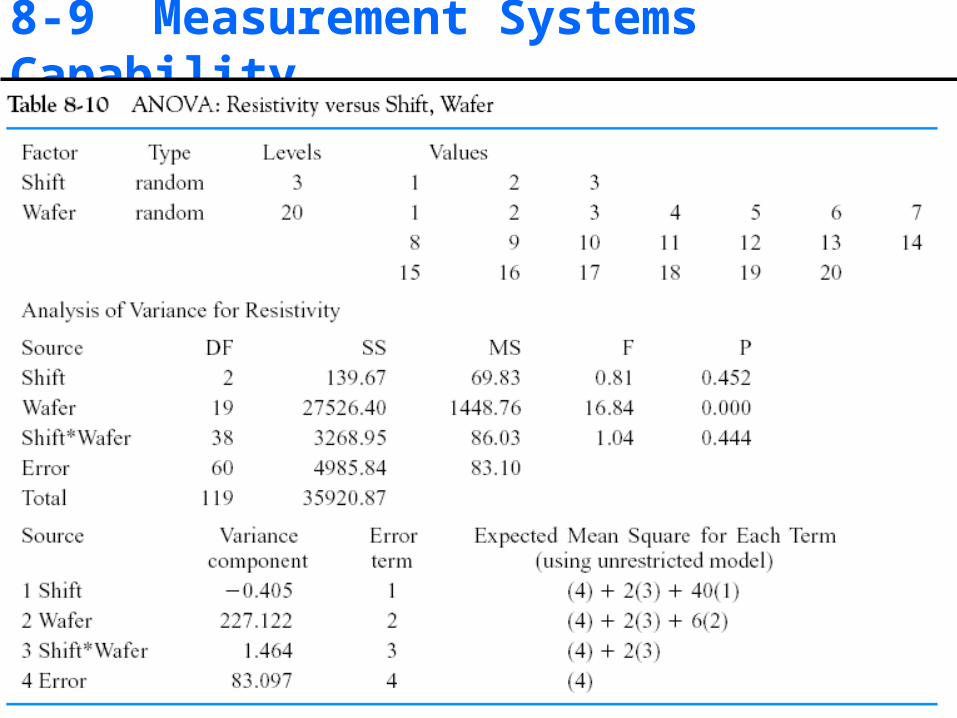
8-9 Measurement Systems Capability
