a full-wave equation based seismic illumination …acti/milabweb/wtopi/...70 th eage conference...
TRANSCRIPT
70th EAGE Conference & Exhibition — Rome, Italy, 9 - 12 June 2008
P284A Full-wave Equation Based Seismic IlluminationAnalysis MethodX.-B. Xie* (University of California) & H. Yang (University of California)
SUMMARYWe propose a full-wave equation based method for seismic illumination analysis. The full-wave finite-difference method is used to calculate the waves from the source and receiver to the subsurface target. Atime domain local slowness analysis technique is used to decompose the wavefield into angle domainbeams. Based on the angle domain information, we formulate the illumination matrix from which differentillumination measurements can be derived. Unlike the one-way wave equation based method, the currentapproach does not have the angle limitation and the reflection/transmission energy can be accuratelycalculated. The new illumination method can handle turning waves which are crucial for imaging steepstructures. Thus, this method is particularly useful for providing illumination analysis in reverse-timemigration. A group of numerical examples are calculated to demonstrate the time-domain wavefielddecomposition and the creation of different illumination measurements. The illumination in the 2D BPmodel is investigated. Our special attention is focused on the illumination of vertical and overhungstructures.

70th EAGE Conference & Exhibition — Rome, Italy, 9 - 12 June 2008
Introduction The illumination of a subsurface target is affected by many factors, e.g., the limited
acquisition aperture, the complex overburden structure and the reflector dipping angle. The seismic illumination analysis answers the question that, given a velocity model and the acquisition geometry, how a target can be imaged. The illumination calculation based on ray tracing technique (Schneider and Winbow, 1999; Muerdter and Ratcliff, 2001; Gelius, et al., 2002) has no angle limitation but the high-frequency asymptotic approximation in ray theory may severely limit its accuracy in complex regions. The one-way wave equation based method (Xie and Wu 2002; Xie et al. 2003, 2005b, 2006; Wu and Chen 2002, 2006; Wu et al. 2003; Jin et al. 2003, 2006) is efficient and consistent with most one-way wave equation based migration methods. However, this method does not handle the wide-angle waves accurately. In particular, it lacks of the ability handling turning waves. In recent years, the reverse time migration gains attention quickly because it does not have the angle limitation and can properly image the steeply dipping structures with turning waves. In this study, we present a new illumination analysis approach which is based on the full-wave propagator. The new method does not have angle limitation usually encountered by a one-way approach. In addition, it accurately solves the energy transmission in a complex velocity model. This method is particularly useful in providing illumination analysis for reverse time migration. Methodology
A target usually can only be illuminated by waves coming/leaving at specific directions. Figure 1 is a sketch showing a target illuminated by a pair of source-receiver beams which form a basic observation to the target. Collecting source-receiver pairs from all possible directions can compose the illumination measurement at the target location. In one-way wave equation based illumination analysis, the source and receiver side waves are calculated using one-way propagator. To overcome the angle limitation of the one-way approach, here we use the full-wave finite-difference (FD) method to propagate the source and receiver waves.
Since the FD method is a time domain approach, we use a time-domain local slowness analysis technique (Xie and Lay 1994; Xie et al. 2005a) to decompose the wavefield into local angle domain and use them to create the illumination measurement.
Similar to the derivation in frequency domain (Xie et al. 2003, 2006), we can formulate the local illumination matrix from time domain calculations. For a source-receiver pair, the local illumination matrix at the target location can be expressed as
( ) ( ) ( ) ( )2, , ; , 2 , ; , ;s g s g s s g gA v I Iθ θ θ θ=r r r r r r r , (1)
where r is the target location, sr and gr are source and receiver locations, sθ and gθ are incidence and scattering angles of source and receiver beams, v is the local velocity,
( ) ( ) 2, ; , ; ,s s s stI G t dtθ θ∂
∂⎡ ⎤= ⎣ ⎦∫r r r r , ( ) ( )2 , ; , ; ,g g g gI G t dtθ θ= ∫r r r r , and ( ), ; ,s sG tθ r r and
( ) , ; ,g gG tθ r r are angle-domain Green’s functions which can be calculated using a local slowness analysis method (Xie et al. 2005a)
( ) ( ) ( ),, , ,
ˆ, , , ; , s g
s g s g s gCG t W G tv v
θ′
′⋅ −⎡ ⎤′ ′= − −⎢ ⎥
⎢ ⎥⎣ ⎦∑r
e r rr r r r r r , (2)
where ( ),, ,s gG tr r is the source or receiver side Green’s function from the FD calculations, ˆ se and ˆ ge are unit vectors toward the directions sθ and gθ , r′ is the location where the wavefield
Figure 1. Cartoon illustrating the geometry of the illumination analysis.

70th EAGE Conference & Exhibition — Rome, Italy, 9 - 12 June 2008
is sampled for calculation, ( )W ′ −r r is a space window centered at r , and C is a normalization factor. The illumination matrix from the entire acquisition system can be obtained by summing up contributions from individual source-receiver pairs based on the acquisition geometry,
( ) ( ), , , , ; ,s g
s g s g s gA Aθ θ θ θ= ∑∑r r
r r r r . (3)
From the illumination matrix, different illumination measurements can be derived (Xie et al. 2005b, 2006) and we will give them in the next section. Numerical Examples
We use numerical examples to demonstrate the calculations of different illumination measurements.
Time domain local slowness analysis. Figure 2 shows a simple salt dome model overlapped with the wavefield snapshot from the FD calculation. The velocity model is composed of a depth-dependent background and a salt dome with steep flanks. The propagation directions of different waves are calculated using equation (2) and shown in 2D slowness maps inserted in the figure.
Local illumination matrix. The illumination matrix ( ), ,s gA θ θr is defined in the acquisition coordinate ( ),s gθ θ . Using coordinate
transforms ( ) 2d g sθ θ θ= + and ( ) 2r g sθ θ θ= − , we can obtain the illumination matrix
( ), ,d rA θ θr in target coordinate system, where dθ and rθ are dipping and reflection angles, respectively (refer to Figure 1). Figure 3 is a sketch illustrating the structure of a 2D illumination matrix. The horizontal and vertical coordinates are incidence and scattering angles while the two diagonals are dipping and reflection angles, respectively. Note that the
area covered by a full-wave approach (large square) is much larger than that covered by a one-way propagator (small square). The full-wave method can cover structures with dipping angles larger than 90 degrees (e.g., overhung structures).
The acquisition dip response. The acquisition dip response (ADR) can be obtained by substituting the dipping angle dθ with the target dipping angle and integrate the illumination matrix with respect to reflection angle rθ (Xie, et al., 2006)
( ) ( )( , ) , ,n d r d n d rD A d dθ θ θ δ θ θ θ θ= −∫ ∫r r (4)
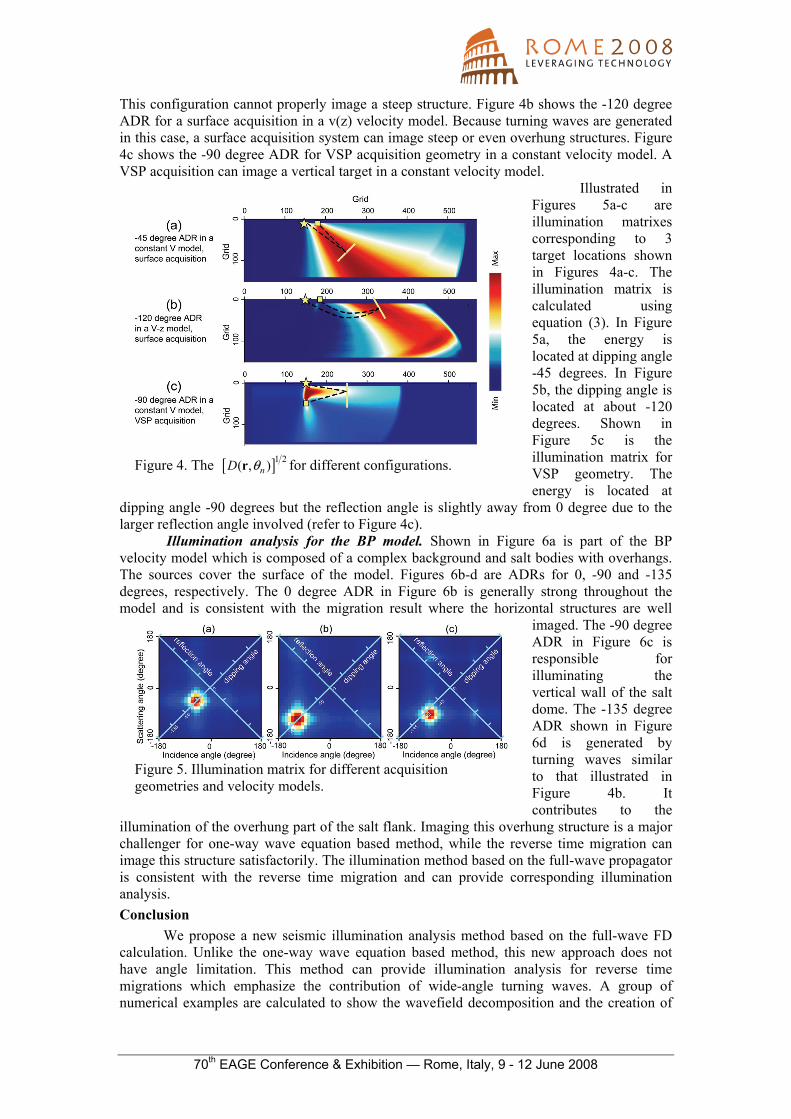
where ( , )nD θr is the ADR at target location r and for structure with a dipping angle nθ . Figure 4 shows the ADR map in different velocity models and for source-receiver pairs with different acquisition geometries. The locations of sources and receivers and the sketch of ray paths are illustrated to demonstrate how these factors affecting the illumination. Figure 4a shows the -45 degree ADR from a surface acquisition system in a constant velocity model.
Figure 2. Wave propagation directions calculatedusing equation (2). The angles of these energy peaks in the polar coordinates give propagation directionsand the radiuses of the circles give their localslowness.
Figure 3. Sketch showing the structure of an illumination matrix.
70th EAGE Conference & Exhibition — Rome, Italy, 9 - 12 June 2008
This configuration cannot properly image a steep structure. Figure 4b shows the -120 degree ADR for a surface acquisition in a v(z) velocity model. Because turning waves are generated in this case, a surface acquisition system can image steep or even overhung structures. Figure 4c shows the -90 degree ADR for VSP acquisition geometry in a constant velocity model. A VSP acquisition can image a vertical target in a constant velocity model.
Illustrated in Figures 5a-c are illumination matrixes corresponding to 3 target locations shown in Figures 4a-c. The illumination matrix is calculated using equation (3). In Figure 5a, the energy is located at dipping angle -45 degrees. In Figure 5b, the dipping angle is located at about -120 degrees. Shown in Figure 5c is the illumination matrix for VSP geometry. The energy is located at
dipping angle -90 degrees but the reflection angle is slightly away from 0 degree due to the larger reflection angle involved (refer to Figure 4c).
Illumination analysis for the BP model. Shown in Figure 6a is part of the BP velocity model which is composed of a complex background and salt bodies with overhangs. The sources cover the surface of the model. Figures 6b-d are ADRs for 0, -90 and -135 degrees, respectively. The 0 degree ADR in Figure 6b is generally strong throughout the model and is consistent with the migration result where the horizontal structures are well
imaged. The -90 degree ADR in Figure 6c is responsible for illuminating the vertical wall of the salt dome. The -135 degree ADR shown in Figure 6d is generated by turning waves similar to that illustrated in Figure 4b. It contributes to the
illumination of the overhung part of the salt flank. Imaging this overhung structure is a major challenger for one-way wave equation based method, while the reverse time migration can image this structure satisfactorily. The illumination method based on the full-wave propagator is consistent with the reverse time migration and can provide corresponding illumination analysis. Conclusion
We propose a new seismic illumination analysis method based on the full-wave FD calculation. Unlike the one-way wave equation based method, this new approach does not have angle limitation. This method can provide illumination analysis for reverse time migrations which emphasize the contribution of wide-angle turning waves. A group of numerical examples are calculated to show the wavefield decomposition and the creation of
Figure 4. The [ ]1 2( , )nD θr for different configurations.
Figure 5. Illumination matrix for different acquisition geometries and velocity models.

70th EAGE Conference & Exhibition — Rome, Italy, 9 - 12 June 2008
different illumination measurements. We calculate ADRs in the 2D BP model and investigate their relations with the vertical and overhung salt flanks. The results presented in this paper are for 2D models but there is no major obstacle to expand these results to 3D cases. References Gelius, L.J., Lecomte, I., and Tabti, H., 2002, Analysis of the resolution function in seismic
prestack depth imaging: Geophysical Prospecting, 50, 505-515. Jin, S., and Walraven, D., 2003, Wave equation GSP prestack depth migration and
illumination: The Leading Edge, 22, 606-610. Jin, S., Luo, M., Xu, S., and Walraven, D., 2006, Illumination amplitude correction with
beamlet migration, The Leading Edge, 25, 1046-1050. Muerdter, D., and Ratcliff, D., 2001, Understanding subsalt illumination through ray-trace
modeling, Part 1: Simple 2-D salt models: The Leading Edge, 20, 578-594. Schneider, W.A., and Winbow, G.A., 1999, Efficient and accurate modeling of 3-D seismic
illumination: 69th Annual International Meeting, SEG, Expanded Abstracts, 633-636. Wu, R.S., and Chen, L., 2002, Mapping directional illumination and acquisition-aperture
efficacy by beamlet propagators: 72nd Annual International Meeting, SEG, Expanded Abstracts, 1352-1355.
Wu, R.S., and Chen, L., 2006, Directional illumination analysis using beamlet decomposition and propagation, Geophysics, 71, S147-S159.
Wu, R.S., Chen, L., and Xie, X.B., 2003, Directional illumination and acquisition dip-response, 65th Conference and Technical Exhibition, EAGE, Expanded abstracts, P147.
Xie, X. B., Ge Z., and Lay, T., 2005a, Investigating explosion source energy partitioning and Lg-wave excitation using a finite-Difference plus slowness analysis method, Bull. Seism. Soc. Am. 95, 2412-2427.
Xie, X.B., Jin, S., and Wu, R.S., 2003, Three-dimensional illumination analysis using wave-equation based propagator: 73rd Annual International Meeting, SEG, Expanded Abstracts, 989-992.
Xie, X.B., Jin, S.W., and Wu, R.S., 2006, Wave equation based seismic illumination analysis, Geophysics, 71, S169-177.
Xie, X. B. and Lay, T., 1994, The excitation of Lg waves by explosions: A finite-difference investigation, Bull. Seism. Soc. Am. 84, 324-342.
Xie, X.B., and Wu, R.S., 2002, Extracting angle domain information from migrated wavefield: 72nd Annual International Meeting, SEG, Expanded Abstracts, 1360-1363.
Xie, X.B., Wu, R.S., Fehler, M., and Huang, L., 2005b, Seismic resolution and illumination: A wave-equation-based analysis, 75th Annual International Meeting, SEG, Expanded Abstracts, 1862-1865.
Figure 6. Illumination in the 2D BP model.