a proposed global climate policy architecture: comprehensive emission targets from specific formulas...
Post on 19-Dec-2015
225 views
TRANSCRIPT
A Proposed Global Climate Policy A Proposed Global Climate Policy Architecture: Comprehensive Emission Architecture: Comprehensive Emission Targets from Specific FormulasTargets from Specific Formulas
Jeffrey FrankelJeffrey Frankel Harpel Professor, Harvard Kennedy SchoolHarpel Professor, Harvard Kennedy School
Academic Seminar SeriesAcademic Seminar Series
Resources for the Future,Resources for the Future, April 23, 2009April 23, 2009
J. Frankel, HarvardJ. Frankel, Harvard 22
What successor to the 2008-12 regime?What successor to the 2008-12 regime?ideally in Copenhagenideally in Copenhagen
in Decemberin December • Features of Kyoto worth building on --
– Politics: Quantitative limits maximize national sovereignty– Economics: Market mechanisms– Thus (2001) “You’re Getting Warmer: The Most Feasible Path
for Addressing Global Climate Change Does Run Through Kyoto.”
• What is missing:– Participation by US, China, & other developing countries– A mechanism for setting targets far into the future– Any reason to expect compliance.
J. Frankel, HarvardJ. Frankel, Harvard 33
Desiderata for the next stage, Desiderata for the next stage, requirements for the next multilateral treaty requirements for the next multilateral treaty
• Comprehensive participation – getting US, China, India, et al, to join
• Efficiency -- esp. trading
• Dynamic consistency – a credible century path
• Equity -- re poor countries
• Compliance -- No country will join if the plan implies, ex ante, big economic sacrifice overall.
• Robustness -- No country will stay in if compliance implies, ex post, huge economic cost in any given period.
J. Frankel, HarvardJ. Frankel, Harvard 44
ProposedProposed Architecture for Architecture for Quantitative Emissions TargetsQuantitative Emissions Targets
• Unlike Kyoto, my proposal seeks to bring all countries in & to look far into the future.
• But we can’t pretend to see with a fine degree of resolution at a century-long horizon.
• How to set a century of quantitative targets? – A decade at a time, in a sequence of negotiations; – but within an overall flexible framework of formulas,– building confidence as it goes along.
J. Frankel, HarvardJ. Frankel, Harvard 55
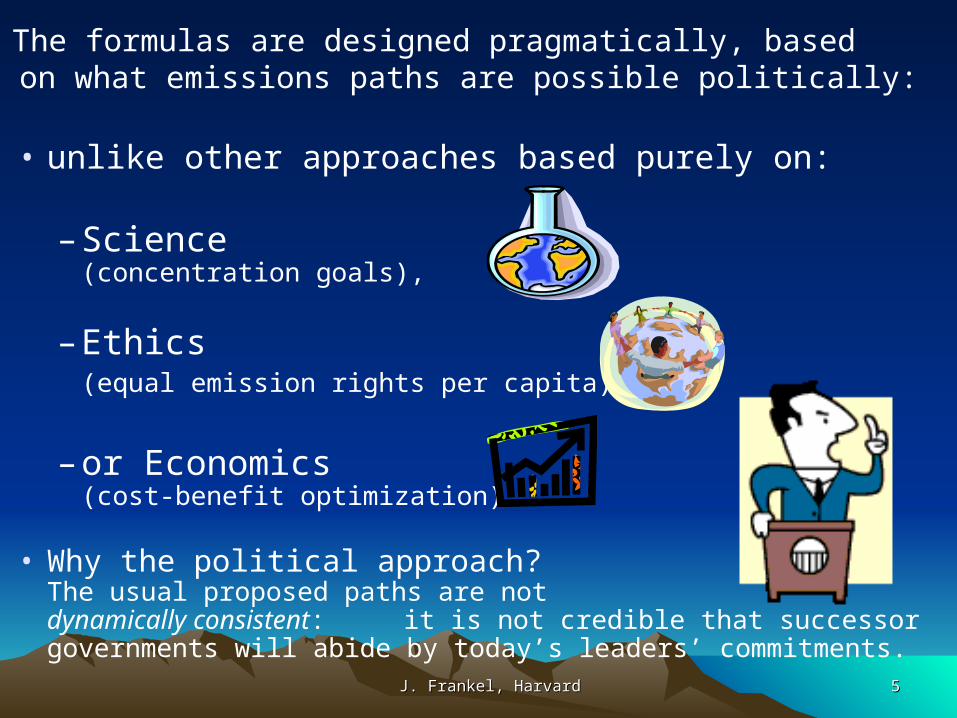
• unlike other approaches based purely on:
– Science (concentration goals),
– Ethics (equal emission rights per capita),
– or Economics (cost-benefit optimization).
• Why the political approach? The usual proposed paths are not dynamically consistent: it is not credible that successor governments will abide by today’s leaders’ commitments.
The formulas are designed pragmatically, basedon what emissions paths are possible politically:
J. Frankel, HarvardJ. Frankel, Harvard 66
““An Elaborated Proposal For Global Climate Policy An Elaborated Proposal For Global Climate Policy Architecture: Specific Formulas and Emission Architecture: Specific Formulas and Emission
Targets for All Countries in All Decades,” Targets for All Countries in All Decades,” March 2009March 2009
Suggests a framework of formulas that produce precise numerical targets for CO2 emissions in all regions in all decades.

J. Frankel, HarvardJ. Frankel, Harvard 77
The formulas are driven by 6 axioms:The formulas are driven by 6 axioms:1. The US will not commit to quantitative targets if China &
major developing countries do not commit to quantitative targets at the same time, due to concerns about economic “competitiveness” & carbon leakage.
2. China & other developing countries will not make sacrifices different in character from those made by richer countries who have gone before them.
3. In the longer run, no country can be rewarded for having “ramped up” its emissions high above the levels of 1990.
4. No country will agree to join if it costs more than, say, 1% of GDP throughout the century.
5. No country will abide by targets that cost it more than, say, 5% of GDP in any one period.
6. If one major country drops out, others will become discouraged and the system may unravel.

J. Frankel, HarvardJ. Frankel, Harvard 88
Building on existing commitmentsBuilding on existing commitments
• Between now and 2050, the EU follows the path laid out in the 2008 EC Directive (50% below 1990),
• US follows the path in the Lieberman bills (67% below 1990) ,
• and Japan, Australia & Korea follow statements that their own leaders have recently made.
• China, India & others agree immediately to quantitative targets which at first merely copy their BAU paths, thereby precluding leakage.
J. Frankel, HarvardJ. Frankel, Harvard 99
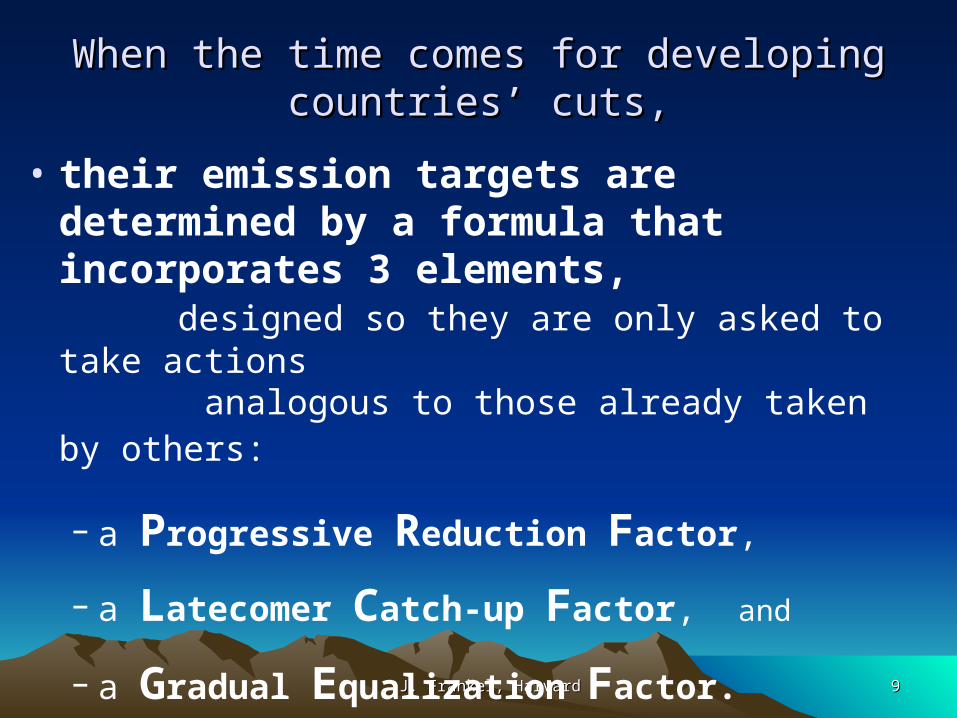
When the time comes for developing countries’ cuts,When the time comes for developing countries’ cuts,
• their emission targets are determined by a formula that incorporates 3 elements, designed so they are only asked to take actions analogous to those already taken by others:
– a Progressive Reduction Factor,
– a Latecomer Catch-up Factor, and
– a Gradual Equalization Factor.
J. Frankel, HarvardJ. Frankel, Harvard 1010
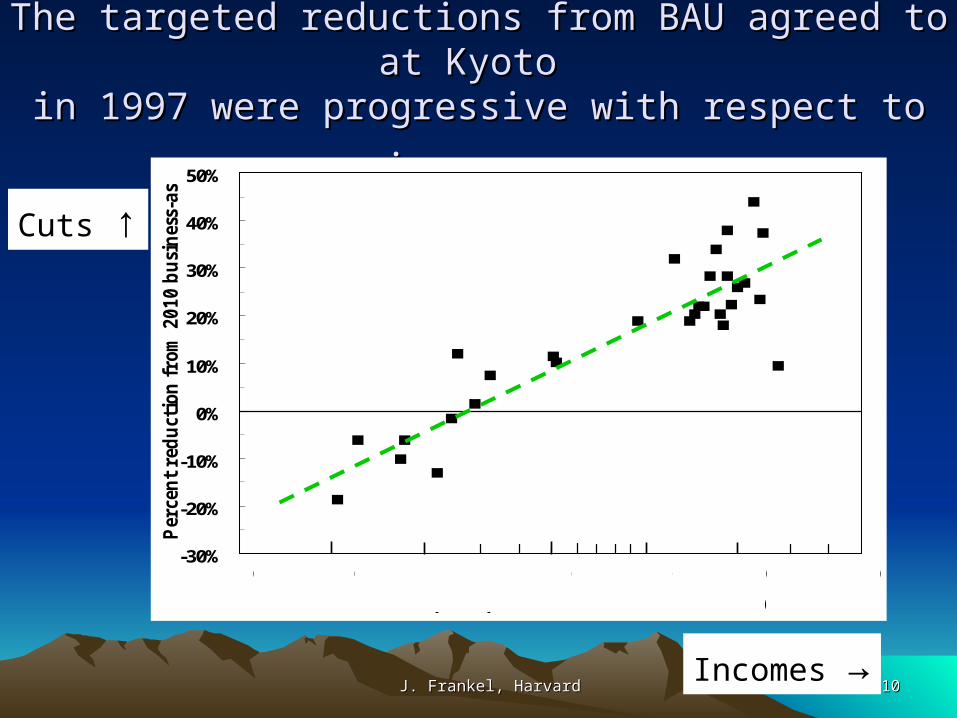
The targeted reductions from BAU agreed to at Kyoto The targeted reductions from BAU agreed to at Kyoto
in 1997 were progressive with respect to income.in 1997 were progressive with respect to income.
-30%
-20%
-10%
0%
10%
20%
30%
40%
50%
2.699 3.699 4.699
Per
cen
t re
du
ctio
n f
rom
2010 b
usi
nes
s-as-
usu
al
.
500 1,000 2,000 5,000 10,000 20,000 50,000
1996 GDP per capita (1987 US dollars, ratio scale)
Cuts ↑
Incomes →
J. Frankel, HarvardJ. Frankel, Harvard 1111
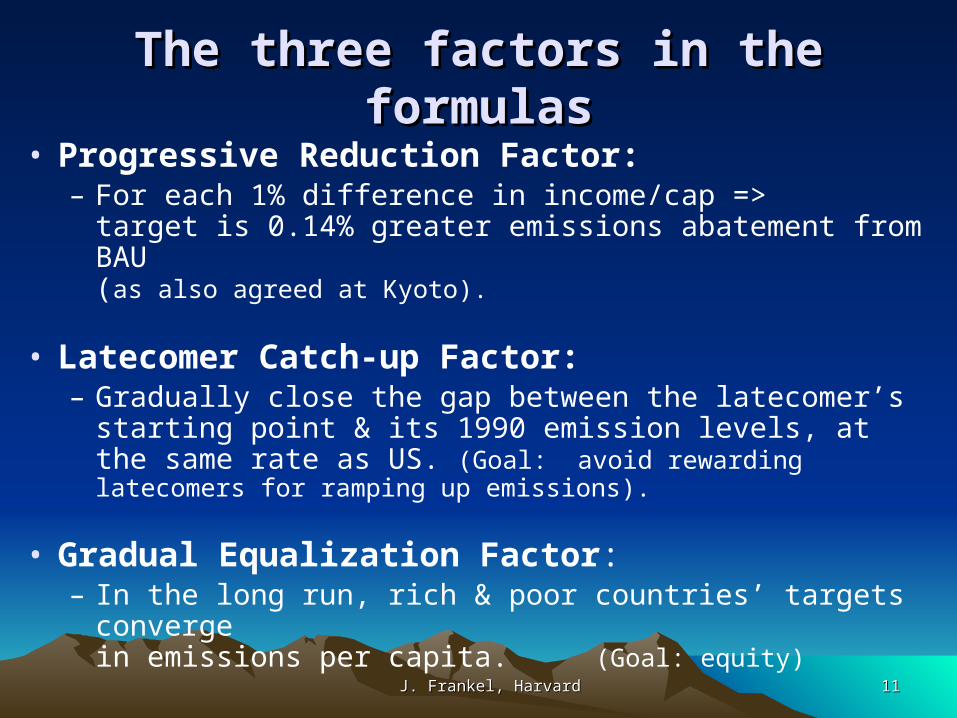
The three factors in the formulasThe three factors in the formulas
• Progressive Reduction Factor: – For each 1% difference in income/cap =>
target is 0.14% greater emissions abatement from BAU (as also agreed at Kyoto).
• Latecomer Catch-up Factor: – Gradually close the gap between the latecomer’s starting
point & its 1990 emission levels, at the same rate as US. (Goal: avoid rewarding latecomers for ramping up emissions).
• Gradual Equalization Factor: – In the long run, rich & poor countries’ targets converge
in emissions per capita. (Goal: equity)
J. Frankel, HarvardJ. Frankel, Harvard 1212
The resultant paths for emissions targets, The resultant paths for emissions targets, permit trading, the price of carbon, permit trading, the price of carbon, GDP costs, & environmental effectsGDP costs, & environmental effects
• estimated by means of the WITCH model of FEEM, Milan, co-authored & applied by Valentina Bosetti.
J. Frankel, HarvardJ. Frankel, Harvard 1313
Bottom line:
• Concentrations level off at 500 ppm in the latter part of the century.
• No country in any one period suffers a loss
as large as 5% of GDP by participating.
• Present Discounted Value of loss < 5% GDP.

J. Frankel, HarvardJ. Frankel, Harvard 1414
The 11 regions: The 11 regions:
• EUROPE = – Old Europe +– New Europe
• US = The United States• KOSAU = Korea + S. Africa
+ Australia (3 coal-users)
• CAJAZ = Canada, Japan & New Zealand
• TE = Russia & other Transition Economies
• MENA = Middle East + North Africa
• SSA = Sub-Saharan Africa• SASIA= India &
the rest of South Asia• CHINA = PRC• EASIA = Smaller countries
of East Asia• LACA = Latin America &
the Caribbean

J. Frankel, HarvardJ. Frankel, Harvard 1515
Two versionsTwo versions
• (I) Cut developing country emissions only after thresholds. 1a:– China’s target is not cut below BAU until 2040
• => permit sales > 1 gigaton of Carbon in 2040. – SEAsia does not have to cut below BAU
• => permit sales > 1 gigaton in 2080-2100; • and it registers big economic gains toward the century end. [1]
– Africa similarly.
• I judge such huge international transfers unsustainable politically.
• (II) Instead, assign developing countries earlier targets. 1b:– Southeast Asia & Africa get targets below BAU after 2050; – move forward by 10 years the date China takes on cuts (to 2030),
– and by 5 years the date MENA is asked to do so (to 2040). • An additional reason was to reduce the slackening in global targets—observable as a carbon price dip —that would otherwise occur around 2035.
– Version (II) is presented here. Version (I) in Appendix.
– [1] Figs. 2a-6a & Table 3a; or Fig.s 2-8 and Tables 1 & 2 – especially Fig. 7 -- in HPICA DP 08-08.
J. Frankel, HarvardJ. Frankel, Harvard 1616
OECD Emissions
0
1
2
3
4
5
6
7
GtC
BAU
Simulated Emissions
CAP
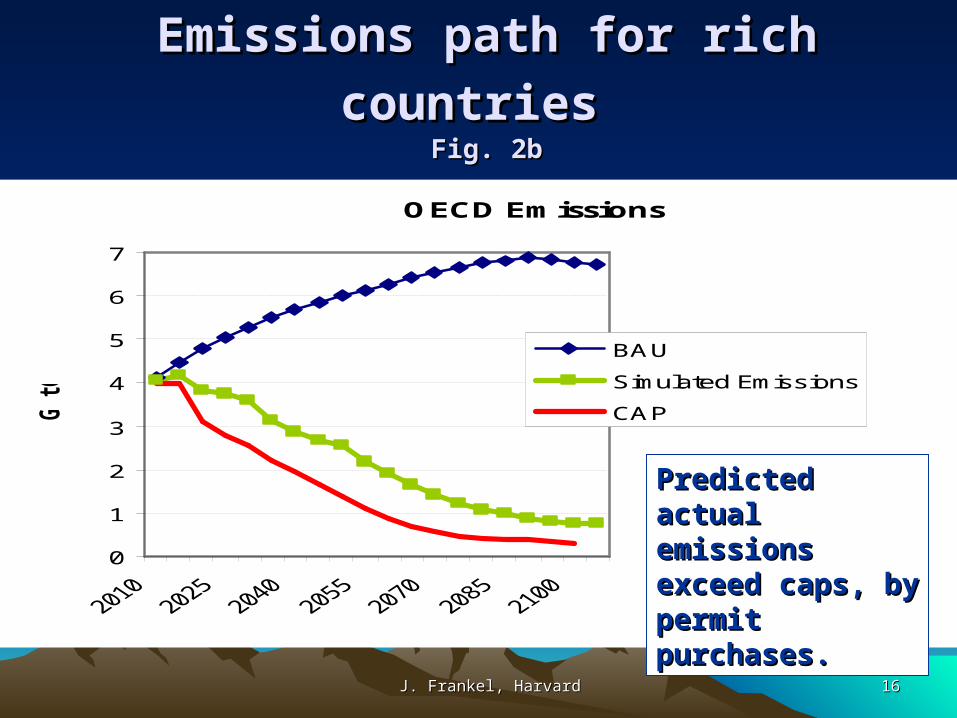
Emissions path for rich countriesEmissions path for rich countries Fig. 2bFig. 2b
Predicted actual Predicted actual emissions exceed emissions exceed caps, by permit caps, by permit purchases.purchases.
J. Frankel, HarvardJ. Frankel, Harvard 1717
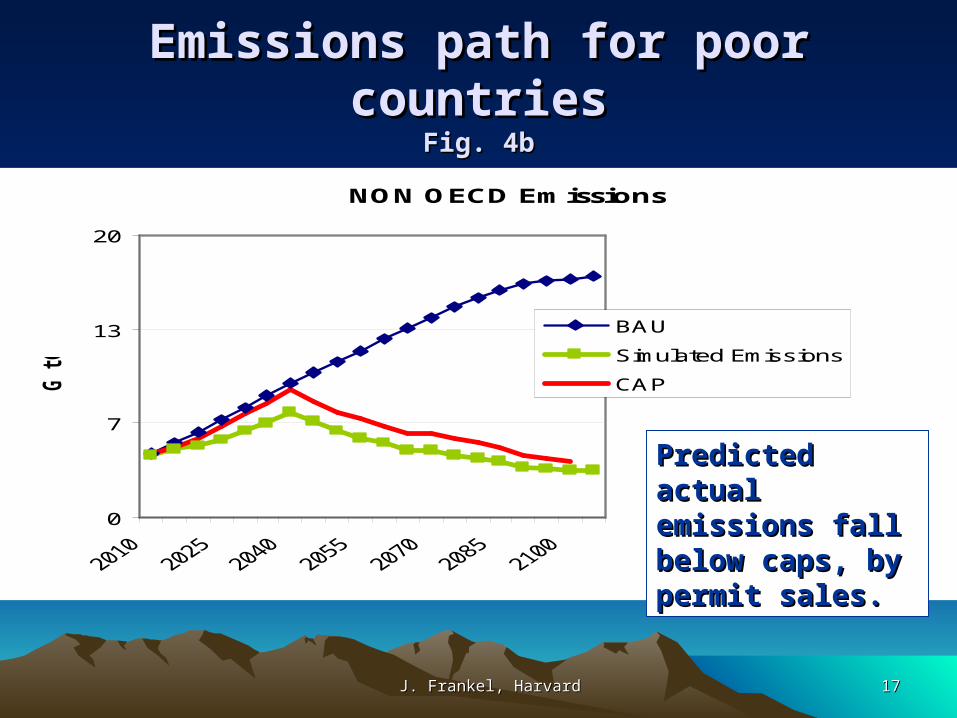
NON OECD Emissions
0
7
13
20
GtC
BAU
Simulated Emissions
CAP
Emissions path for poor countriesEmissions path for poor countriesFig. 4bFig. 4b
Predicted actual Predicted actual emissions fall emissions fall below caps, by below caps, by permit sales.permit sales.
J. Frankel, HarvardJ. Frankel, Harvard 1818
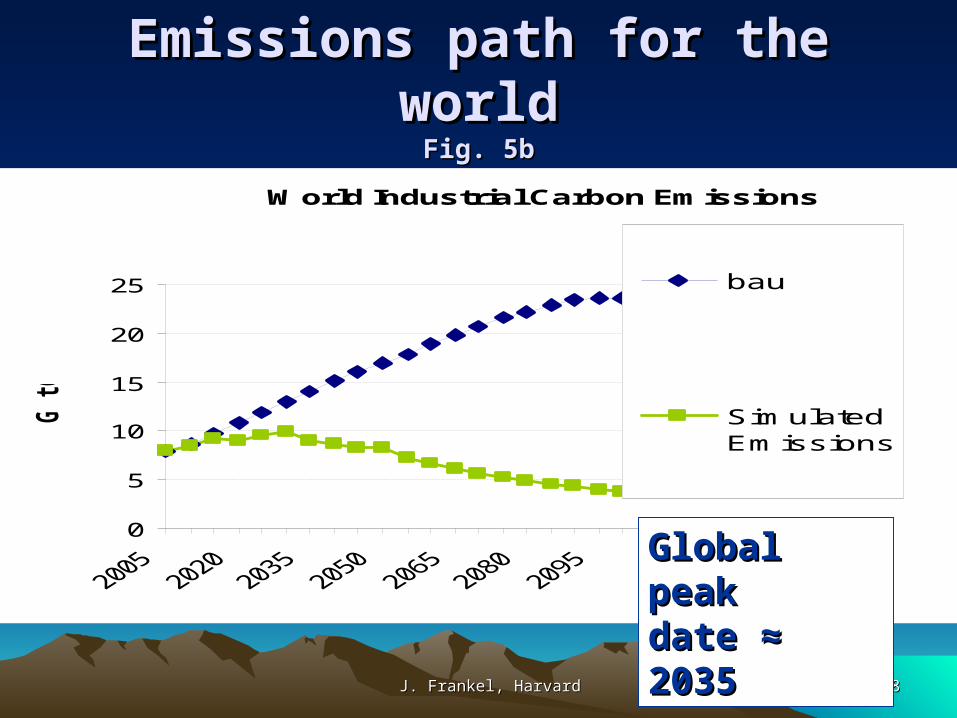
World Industrial Carbon Emissions
0
5
10
15
20
25
GtC
bau
SimulatedEmissions
Emissions path for the worldEmissions path for the worldFig. 5bFig. 5b
Global peak Global peak date ≈ 2035date ≈ 2035
J. Frankel, HarvardJ. Frankel, Harvard 1919
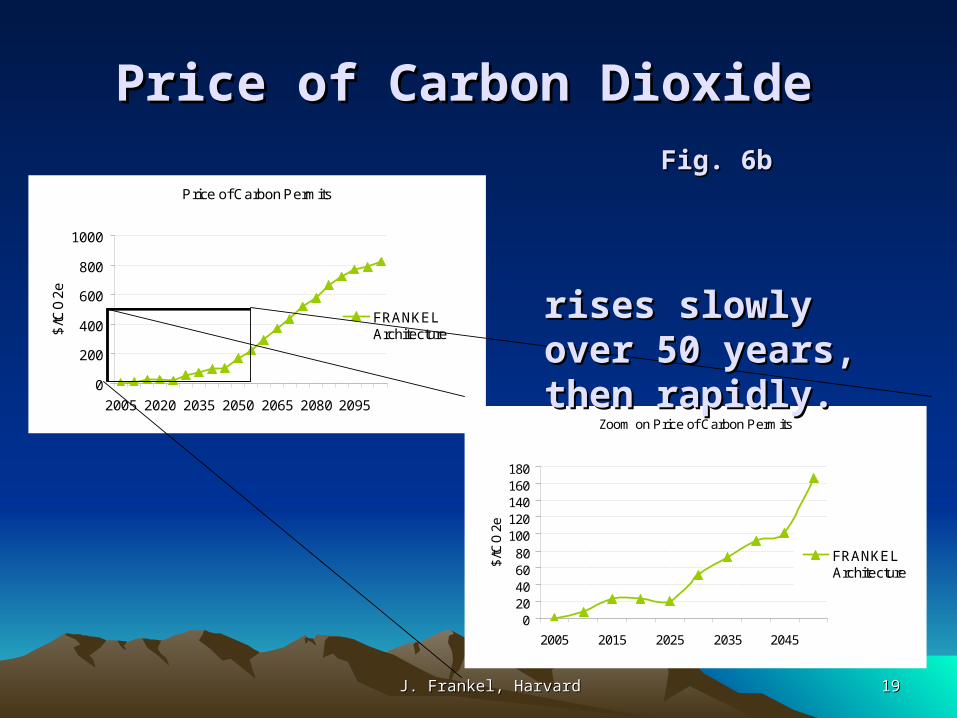
Price of Carbon Dioxide Price of Carbon Dioxide
Fig. 6bFig. 6b Price of Carbon Permits
0
200
400
600
800
1000
2005 2020 2035 2050 2065 2080 2095
$/tC
O2
e
FRANKELArchitecture
Zoom on Price of Carbon Permits
020406080
100120140160180
2005 2015 2025 2035 2045
$/tC
O2e
FRANKELArchitecture
rises slowly over 50 rises slowly over 50 years, then rapidly.years, then rapidly.

J. Frankel, HarvardJ. Frankel, Harvard 2020
Concentrations stay below 500 ppm goalConcentrations stay below 500 ppm goalFig. 7bFig. 7b
Carbon Concentrations (CO2 only)
300
350
400
450
500
550
600
650
700
750
800
pp
mv
bau
FRANKELArchitecture
J. Frankel, HarvardJ. Frankel, Harvard 2121
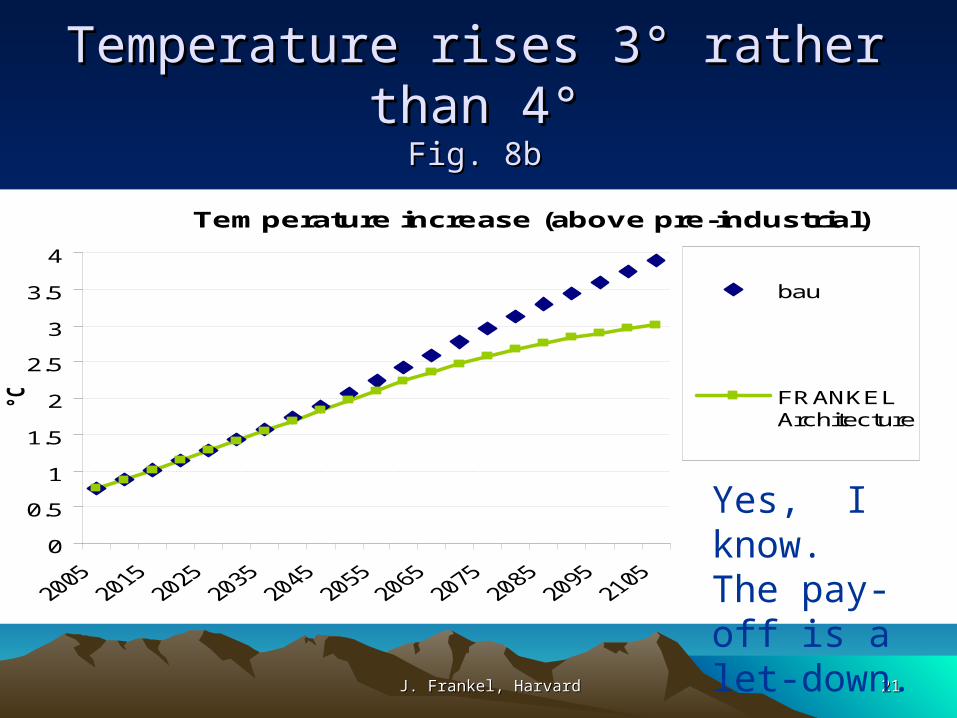
Temperature rises 3° rather than 4°Temperature rises 3° rather than 4°Fig. 8bFig. 8b
Temperature increase (above pre-industrial)
0
0.5
1
1.5
2
2.5
3
3.5
4
°C
bau
FRANKELArchitecture
Yes, I know. The pay-off is a let-down.
J. Frankel, HarvardJ. Frankel, Harvard 2222
The next paper The next paper (co-authored with Valentina Bosetti)…(co-authored with Valentina Bosetti)…
• (1) See if we can hit concentrations = 450 ppm– Answer, so far: yes, but not within the constraints.
• (2) See if the emission target trajectories suggested by others violate our constraints (e.g., 5% of GDP in some periods), and how badly.
Of the eventual extensions I hope to do,• the most important will be to introduce uncertainty,
especially in the form of stochastic growth processes. – Robustness will require:
• Possible decadal updates of BAU & formula parameters;• within-decade indexation of targets to GDP.
J. Frankel, HarvardJ. Frankel, Harvard 2323
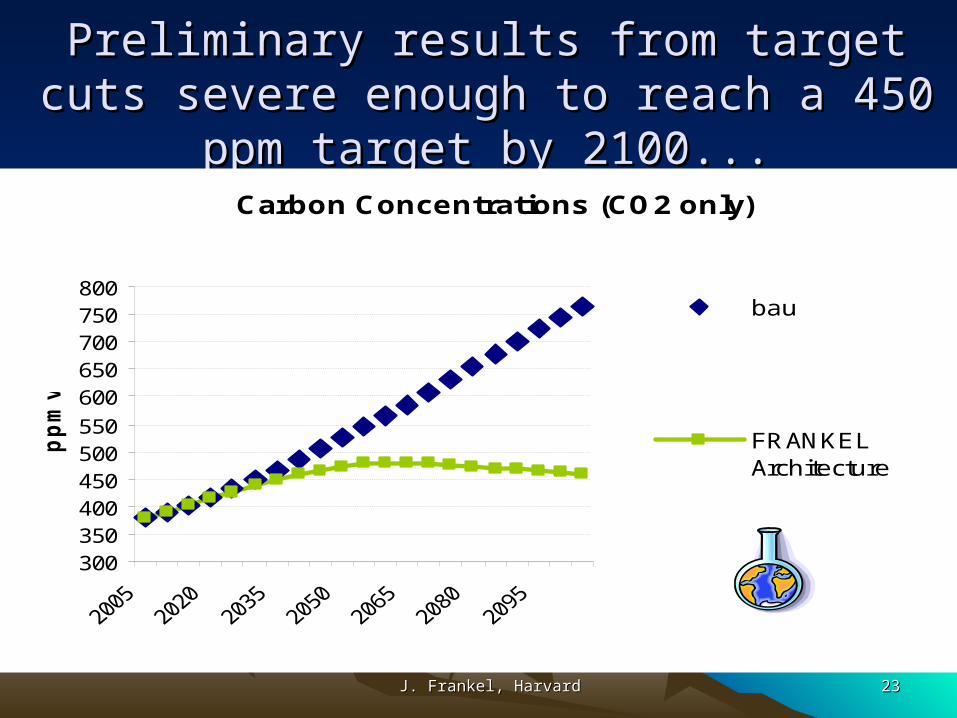
Preliminary results from target cuts severe Preliminary results from target cuts severe enough to reach a 450 ppm target by 2100...enough to reach a 450 ppm target by 2100...
Carbon Concentrations (CO2 only)
300350400450500550
600650700750800
pp
mv
bau
FRANKELArchitecture
J. Frankel, HarvardJ. Frankel, Harvard 2424
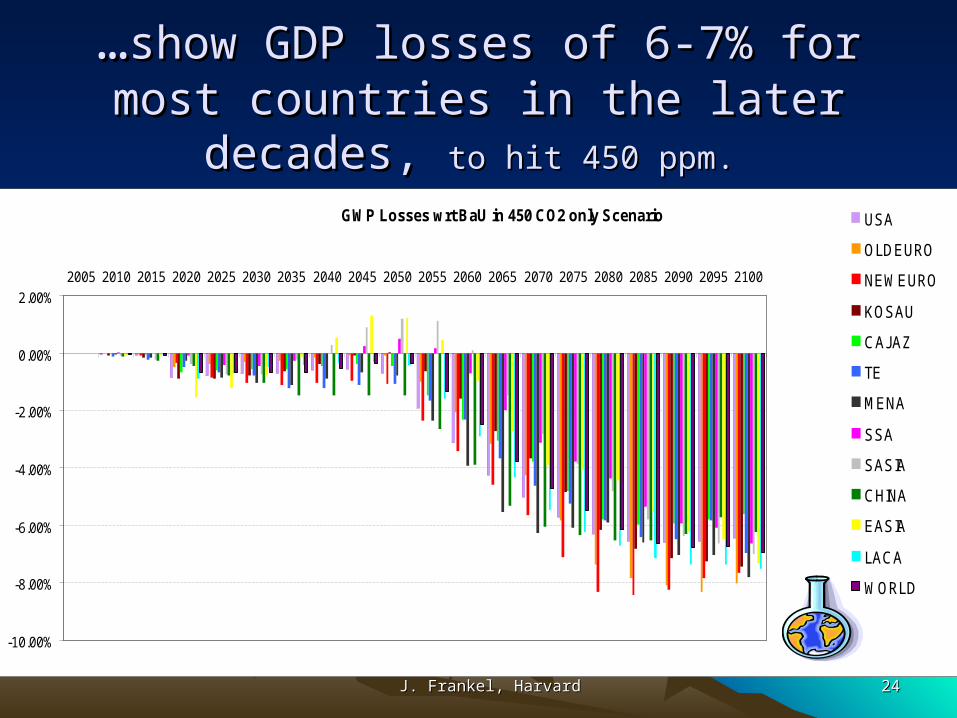
……show GDP losses ofshow GDP losses of 6-7% for most 6-7% for most countries in the later decades, countries in the later decades, to hit 450 ppm. to hit 450 ppm.
GWP Losses wrt BaU in 450 CO2 only Scenario
-10.00%
-8.00%
-6.00%
-4.00%
-2.00%
0.00%
2.00%
2005 2010 2015 2020 2025 2030 2035 2040 2045 2050 2055 2060 2065 2070 2075 2080 2085 2090 2095 2100
USA
OLDEURO
NEWEURO
KOSAU
CAJAZ
TE
MENA
SSA
SASIA
CHINA
EASIA
LACA
WORLD
J. Frankel, HarvardJ. Frankel, Harvard 2525
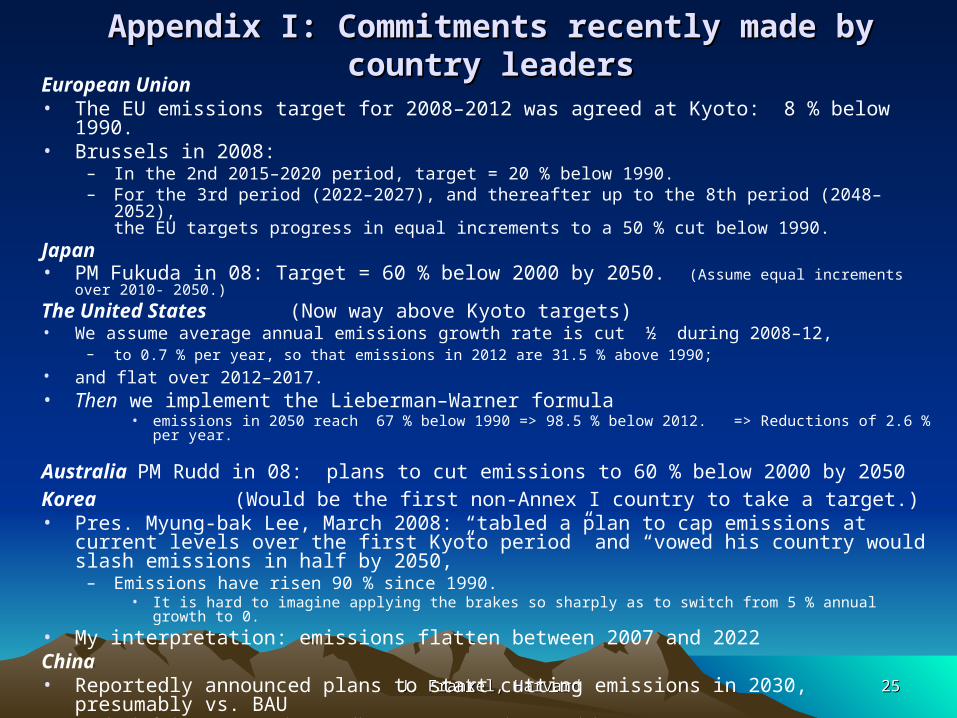
Appendix I: Commitments recently made by country leadersAppendix I: Commitments recently made by country leadersEuropean Union • The EU emissions target for 2008–2012 was agreed at Kyoto: 8 % below 1990. • Brussels in 2008:
– In the 2nd 2015–2020 period, target = 20 % below 1990. – For the 3rd period (2022–2027), and thereafter up to the 8th period (2048–2052),
the EU targets progress in equal increments to a 50 % cut below 1990.Japan• PM Fukuda in 08: Target = 60 % below 2000 by 2050. (Assume equal increments over 2010- 2050.)
The United States (Now way above Kyoto targets)• We assume average annual emissions growth rate is cut ½ during 2008–12,
– to 0.7 % per year, so that emissions in 2012 are 31.5 % above 1990; • and flat over 2012–2017. • Then we implement the Lieberman–Warner formula
• emissions in 2050 reach 67 % below 1990 => 98.5 % below 2012. => Reductions of 2.6 % per year.
Australia PM Rudd in 08: plans to cut emissions to 60 % below 2000 by 2050
Korea (Would be the first non-Annex I country to take a target.)• Pres. Myung-bak Lee, March 2008: “tabled a plan to cap emissions at current levels over
the first Kyoto period” and “vowed his country would slash emissions in half by 2050,”– Emissions have risen 90 % since 1990.
• It is hard to imagine applying the brakes so sharply as to switch from 5 % annual growth to 0.
• My interpretation: emissions flatten between 2007 and 2022China• Reportedly announced plans to start cutting emissions in 2030, presumably vs. BAU (ahead of the 2007 G8 summit, according to Germany’s environment minister -- FT 3/12/07.)
J. Frankel, HarvardJ. Frankel, Harvard 2626
Appendix II: More on hitting 450 ppmAppendix II: More on hitting 450 ppm
• Our 1st pass at attaining 450 ppm concentrations entailed:– negative emissions allocated to W. Europe by
2065 !– Very big purchases of permits from developing
countries. Seems unlikely.– And even then does not quite hit 450 ppm.
• At a 2nd pass, we tightened parameters & moved up further the dates at which developing countries start cutting below BAU.
J. Frankel, HarvardJ. Frankel, Harvard 2727
Next stepNext step• EU:
– in 2015-2020, EU target is 30 % below 1990 levels, rather than 20 %.
• Developing countries start cutting below BAU still earlier than before:– MENA starts making cuts in 2020 – LACA starts in 2020– China starts in 2020 – South Asia in 2030. – East Asia in 2035
J. Frankel, HarvardJ. Frankel, Harvard 2828
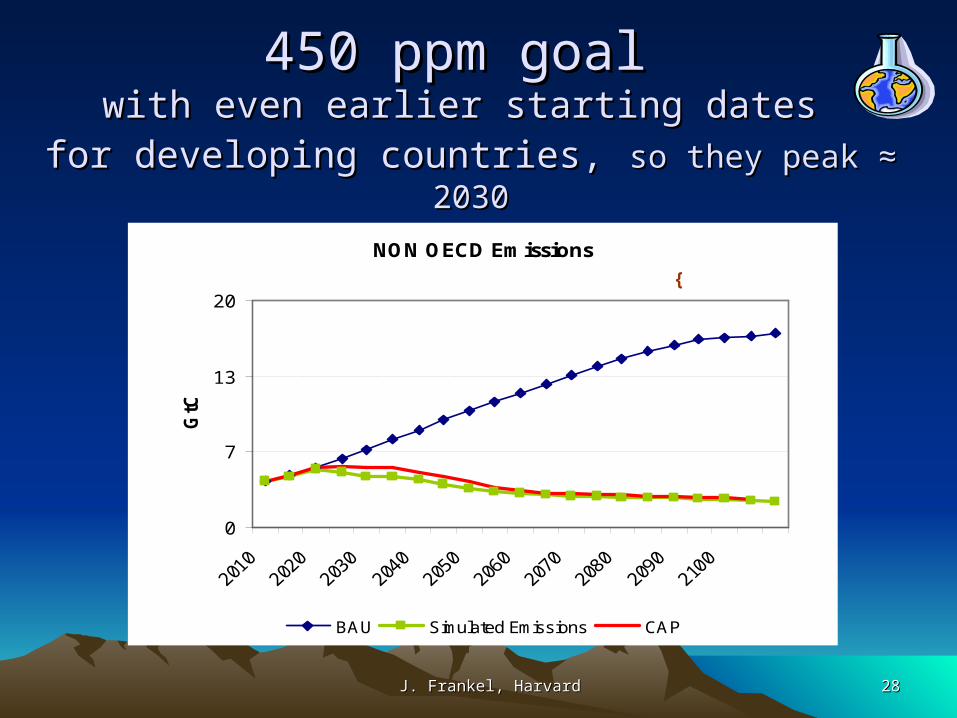
450 ppm goal 450 ppm goal with even earlier starting dates with even earlier starting dates
for developing countries,for developing countries, so they peak ≈ 2030so they peak ≈ 2030
NON OECD Emissions
0
7
13
20
GtC
BAU Simulated Emissions CAP
{
J. Frankel, HarvardJ. Frankel, Harvard 2929
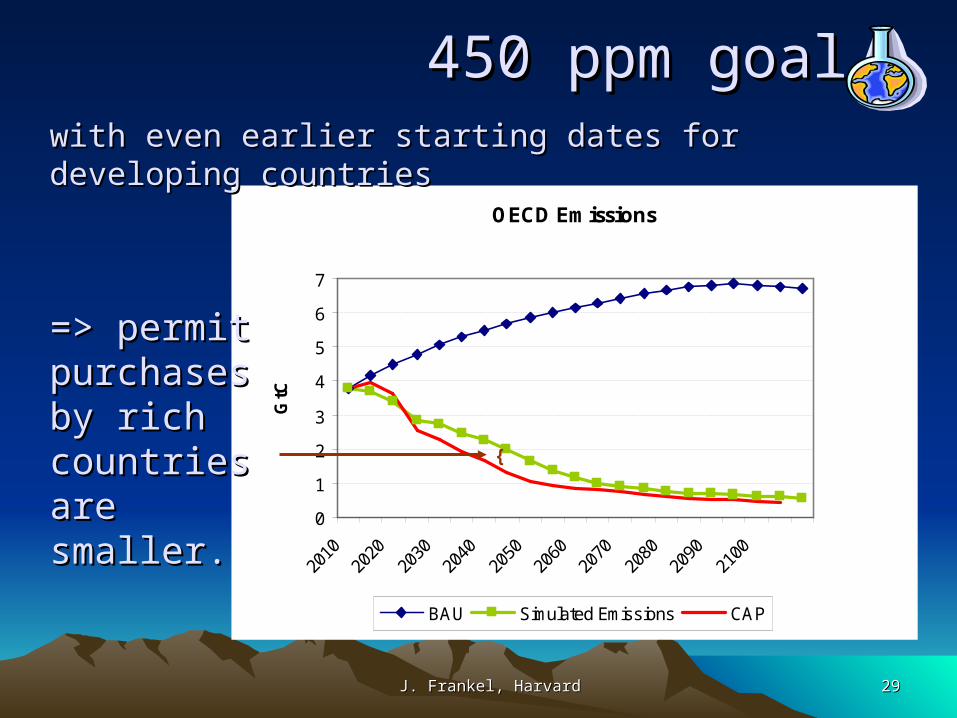
OECD Emissions
0
1
2
3
4
5
6
7G
tC
BAU Simulated Emissions CAP
{
450 ppm goal 450 ppm goal with even earlier starting dates for developing countrieswith even earlier starting dates for developing countries
=> permit => permit purchases purchases by richby richcountriescountriesare are smaller.smaller.
J. Frankel, HarvardJ. Frankel, Harvard 3030
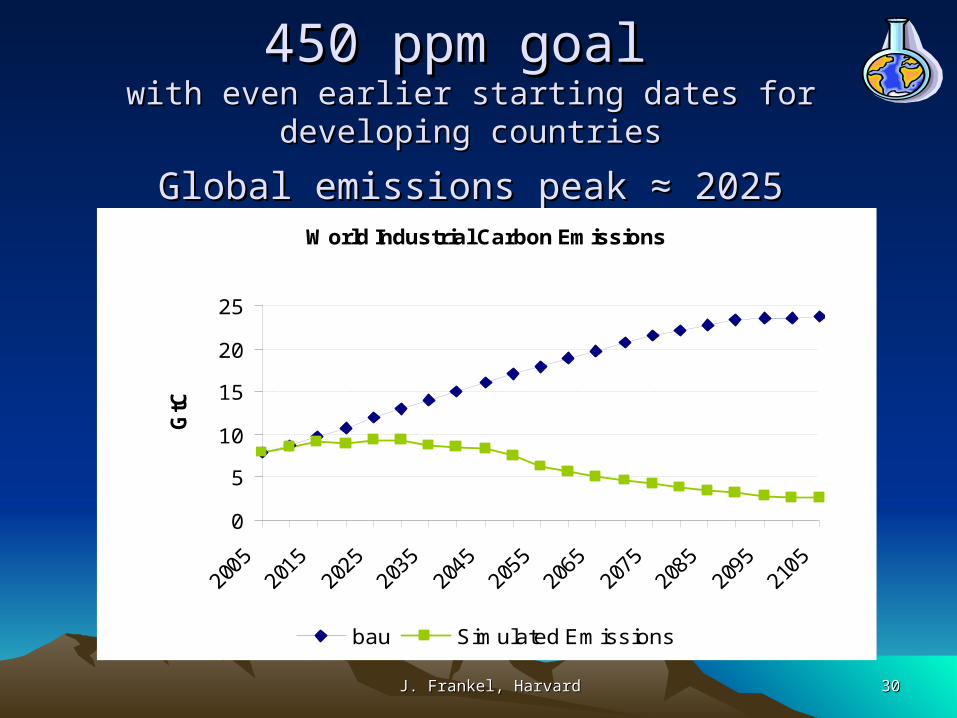
450 ppm goal 450 ppm goal with even earlier starting dates for developing countrieswith even earlier starting dates for developing countries
Global emissions peak ≈ 2025Global emissions peak ≈ 2025
World Industrial Carbon Emissions
0
5
10
15
20
25
GtC
bau Simulated Emissions
J. Frankel, HarvardJ. Frankel, Harvard 3131
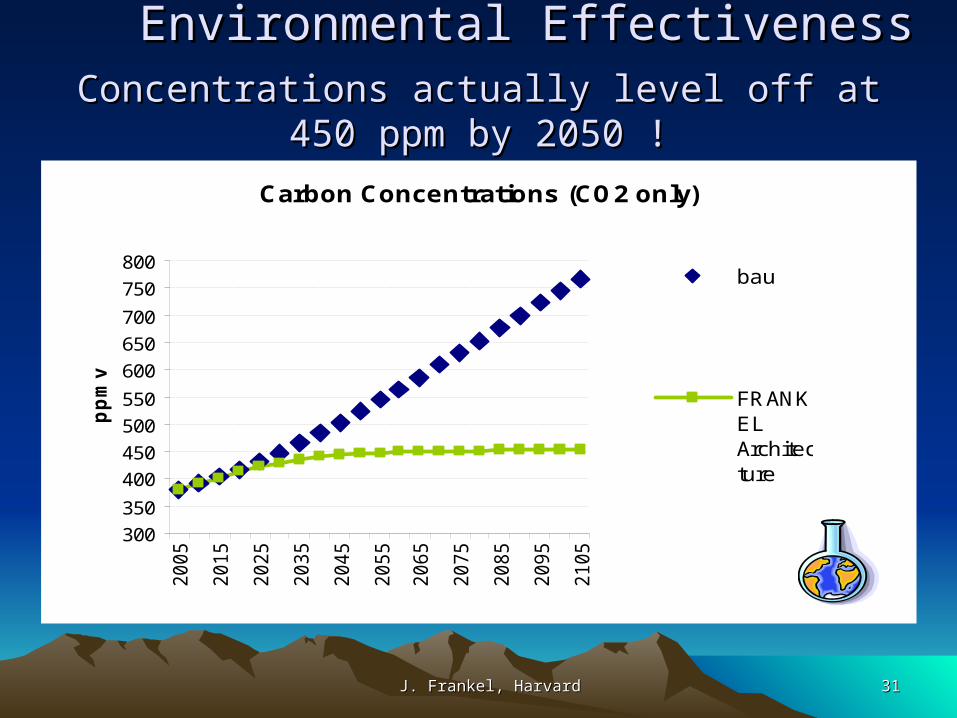
Environmental EffectivenessEnvironmental EffectivenessConcentrations actually level off at 450 ppm by 2050 !Concentrations actually level off at 450 ppm by 2050 !
Carbon Concentrations (CO2 only)
300
350
400
450
500
550
600
650
700
750
800
2005
2015
2025
2035
2045
2055
2065
2075
2085
2095
2105
pp
mv
bau
FRANKELArchitecture
J. Frankel, HarvardJ. Frankel, Harvard 3232
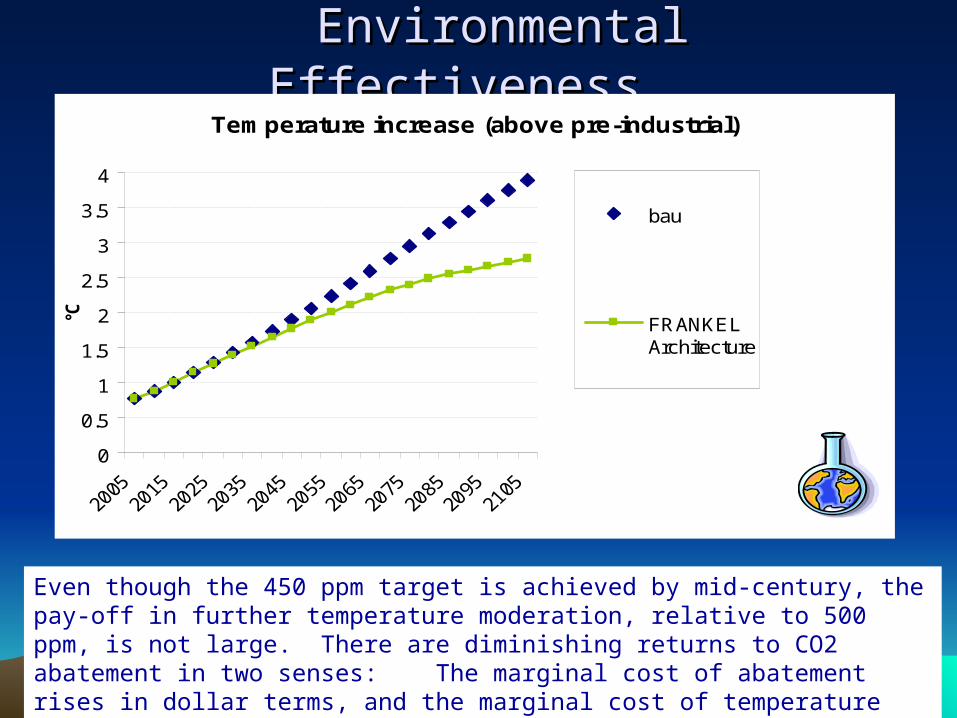
Environmental EffectivenessEnvironmental EffectivenessTemperature increase (above pre-industrial)
0
0.5
1
1.5
2
2.5
3
3.5
4
°C
bau
FRANKELArchitecture
Even though the 450 ppm target is achieved by mid-century, the pay-off in further temperature moderation, relative to 500 ppm, is not large. There are diminishing returns to CO2 abatement in two senses: The marginal cost of abatement rises in dollar terms, and the marginal cost of temperature moderation rises in terms of CO2.
J. Frankel, HarvardJ. Frankel, Harvard 3333
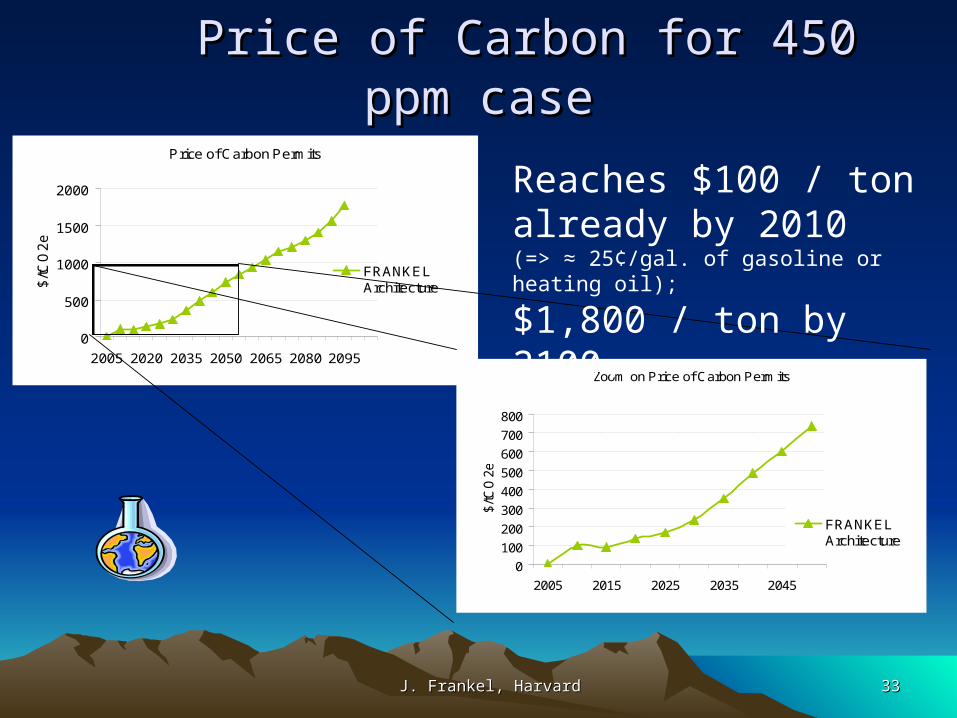
Price of Carbon for 450 ppm casePrice of Carbon for 450 ppm case
Price of Carbon Permits
0
500
1000
1500
2000
2005 2020 2035 2050 2065 2080 2095
$/tC
O2
e
FRANKELArchitecture
Zoom on Price of Carbon Permits
0
100
200
300
400
500
600
700
800
2005 2015 2025 2035 2045
$/tC
O2e
FRANKELArchitecture
Reaches $100 / ton already by 2010 (=> ≈ 25¢/gal. of gasoline or heating oil);
$1,800 / ton by 2100.
J. Frankel, HarvardJ. Frankel, Harvard 3434
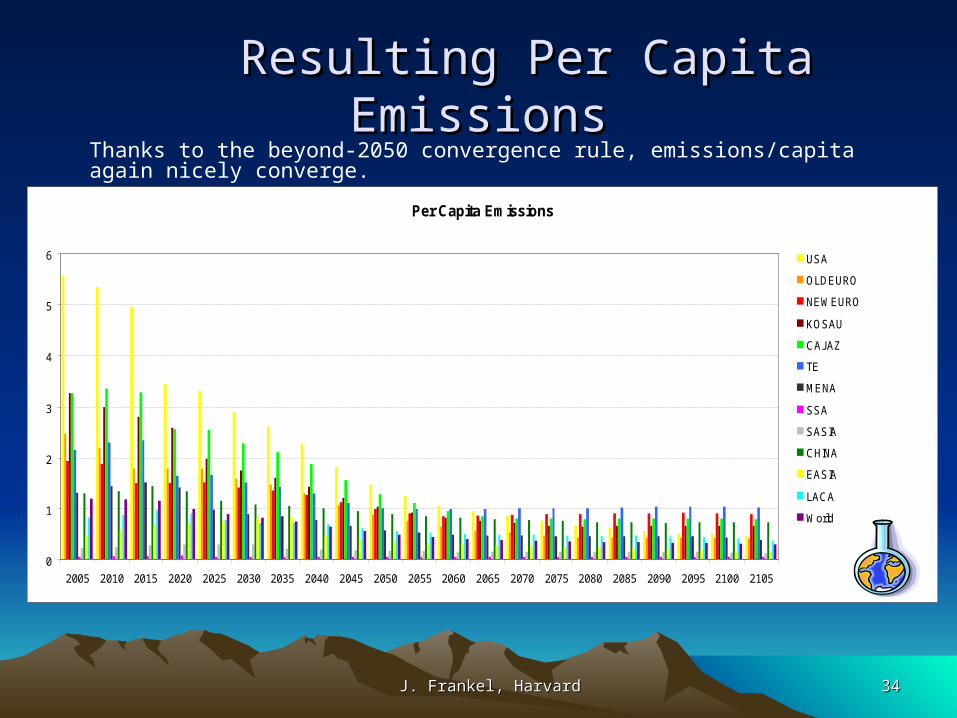
Resulting Per Capita EmissionsResulting Per Capita EmissionsThanks to the beyond-2050 convergence rule, emissions/capita again nicely converge.
Per Capita Emissions
0
1
2
3
4
5
6
2005 2010 2015 2020 2025 2030 2035 2040 2045 2050 2055 2060 2065 2070 2075 2080 2085 2090 2095 2100 2105
USA
OLDEURO
NEWEURO
KOSAU
CAJAZ
TE
MENA
SSA
SASIA
CHINA
EASIA
LACA
World
J. Frankel, HarvardJ. Frankel, Harvard 3535
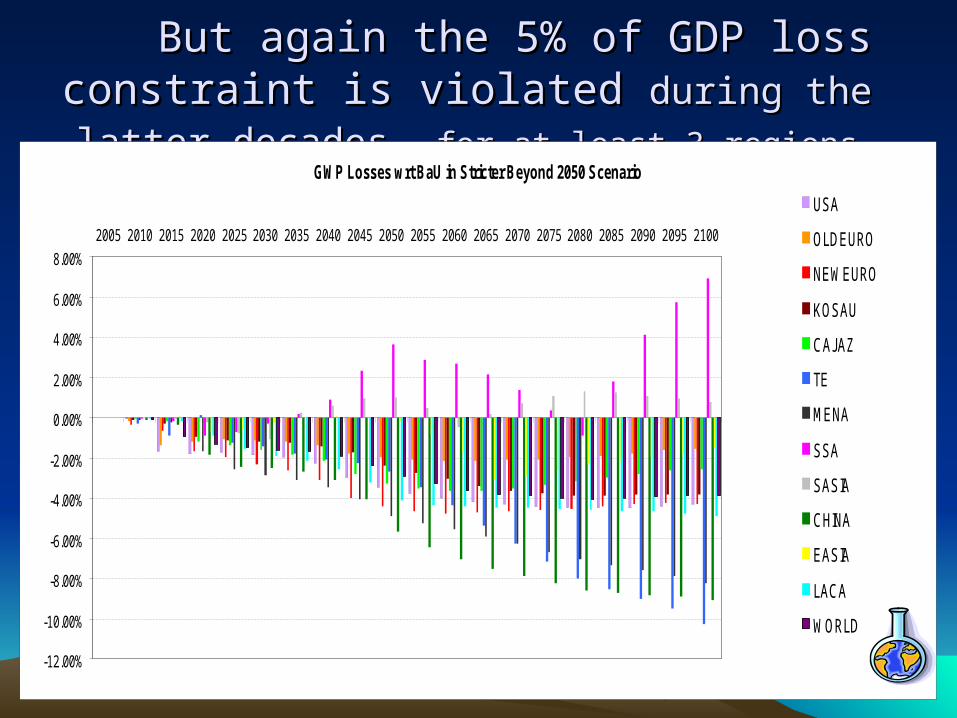
But again the 5% of GDP loss constraint is But again the 5% of GDP loss constraint is violated violated during the latter decades,during the latter decades, for at least 3 regionsfor at least 3 regions
GWP Losses wrt BaU in Stricter Beyond 2050 Scenario
-12.00%
-10.00%
-8.00%
-6.00%
-4.00%
-2.00%
0.00%
2.00%
4.00%
6.00%
8.00%
2005 2010 2015 2020 2025 2030 2035 2040 2045 2050 2055 2060 2065 2070 2075 2080 2085 2090 2095 2100
USA
OLDEURO
NEWEURO
KOSAU
CAJAZ
TE
MENA
SSA
SASIA
CHINA
EASIA
LACA
WORLD

J. Frankel, HarvardJ. Frankel, Harvard 3636
The PDV of cost, as share of GDP, The PDV of cost, as share of GDP, also exceeds the 1% thresholdalso exceeds the 1% threshold
(discount rate = 5%)(discount rate = 5%)
• The global cost is 1.8% of GWP.
PDV of cost as share of GDP to attain 450 ppm concentrations target
(discount rate = 5%)
USA W.Europe
C&EEurope
Kor.SAfr.Austra.
Can.Jpn.NZ
Transtn.Ec.s
2% 1% 2% 1% 1% 2%
ME&NAfr S-S Afr. S.Asia China SE Asia Lat.Amer.
3% -1% 0% 4% 1% 2%
J. Frankel, HarvardJ. Frankel, Harvard 3737
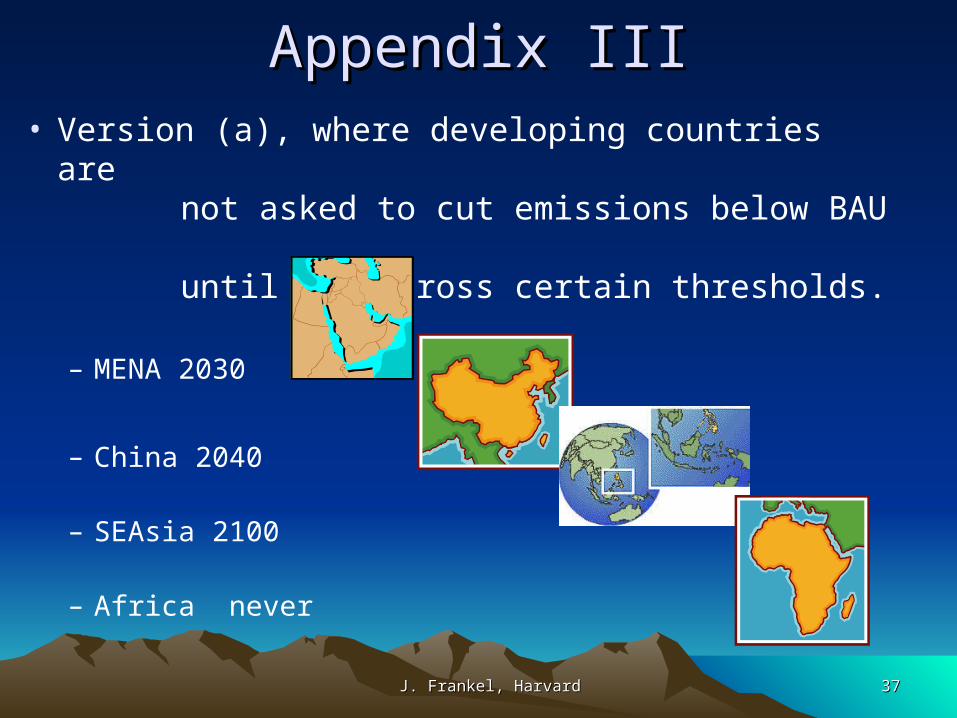
Appendix IIIAppendix III• Version (a), where developing countries are
not asked to cut emissions below BAU
until they cross certain thresholds.
– MENA 2030
– China 2040
– SEAsia 2100
– Africa never
J. Frankel, HarvardJ. Frankel, Harvard 3838
0
1
2
3
4
5
6
7
2005 2010 2015 2020 2025 2030 2035 2040 2045 2050 2055 2060 2065 2070 2075 2080 2085 2090 2095 2100 2105
USA
OLDEURO
NEWEURO
KOSAU
CAJAZ
TE
MENA
SSA
SASIA
CHINA
EASIA
LACA
World
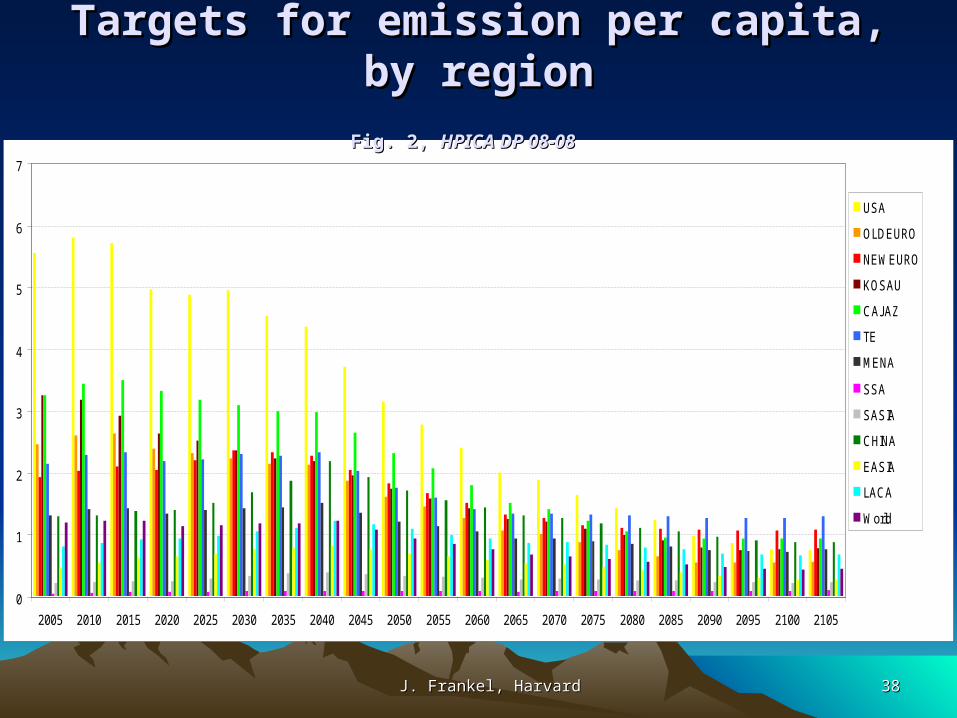
Targets for emission per capita, by regionTargets for emission per capita, by region
Fig. 2, Fig. 2, HPICA DP 08-08HPICA DP 08-08
J. Frankel, HarvardJ. Frankel, Harvard 3939
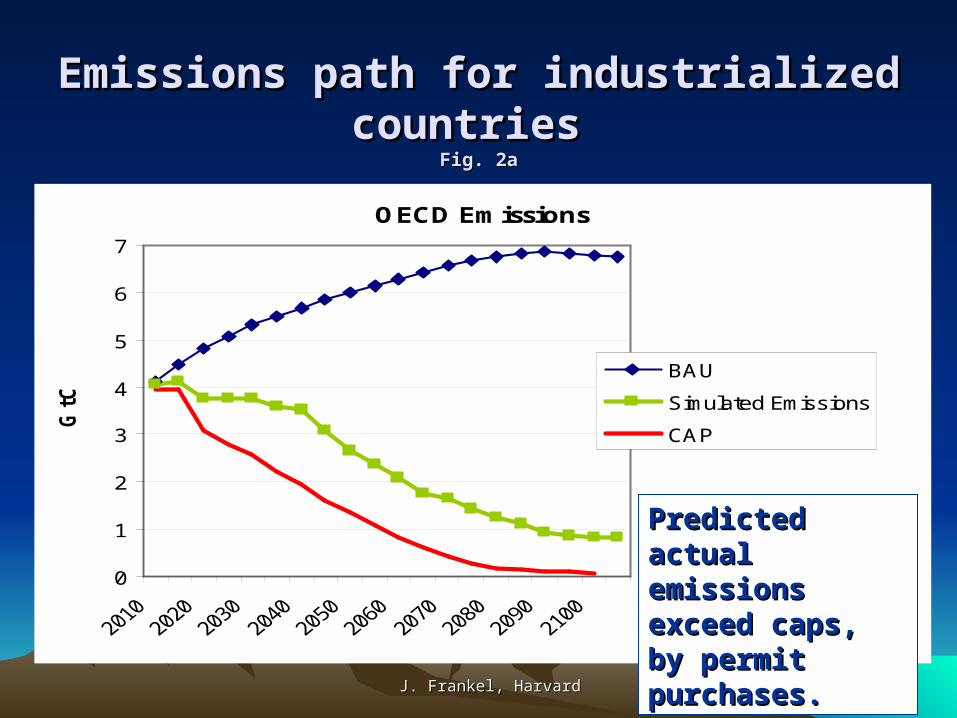
Emissions path for industrialized countries Emissions path for industrialized countries Fig. 2aFig. 2a
OECD Emissions
0
1
2
3
4
5
6
7
GtC
BAU
Simulated Emissions
CAP
Predicted actual Predicted actual emissions exceed emissions exceed caps, by permit caps, by permit purchases.purchases.
J. Frankel, HarvardJ. Frankel, Harvard 4040
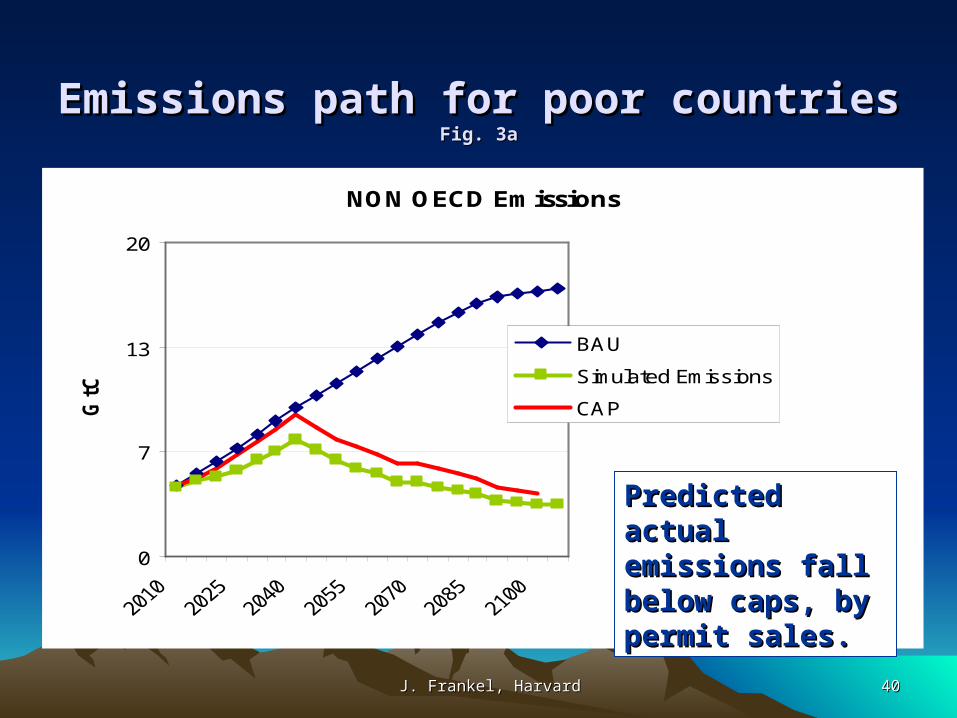
Emissions path for poor countriesEmissions path for poor countriesFig. 3aFig. 3a
NON OECD Emissions
0
7
13
20
GtC
BAU
Simulated Emissions
CAP
Predicted actual Predicted actual emissions fall emissions fall below caps, by below caps, by permit sales.permit sales.
J. Frankel, HarvardJ. Frankel, Harvard 4141
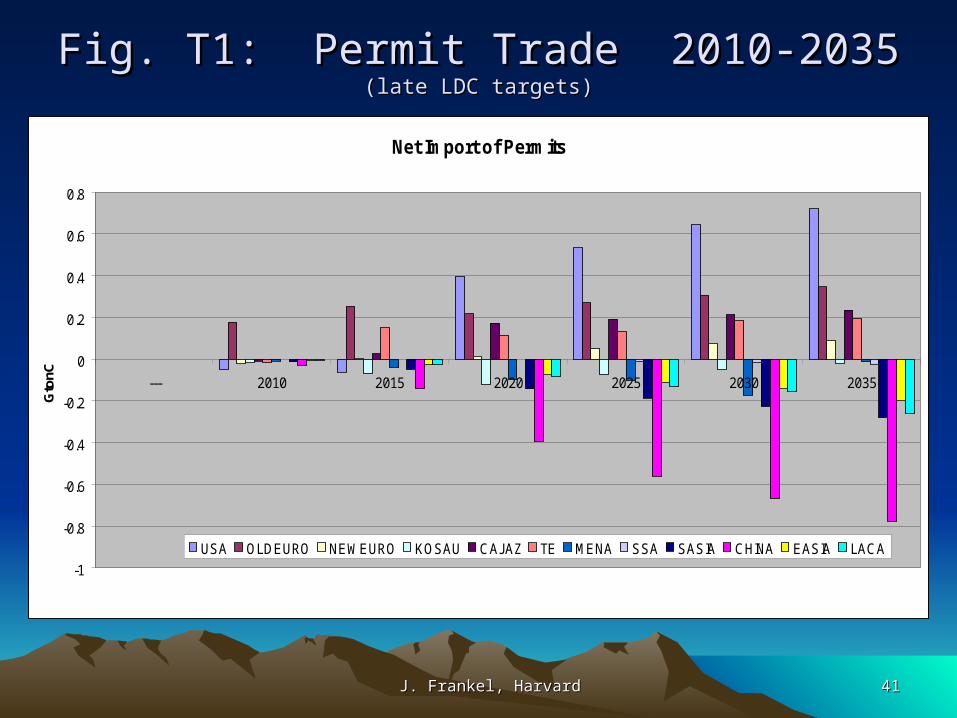
Fig. T1: Permit Trade 2010-2035 Fig. T1: Permit Trade 2010-2035 (late LDC targets)(late LDC targets)
Net Import of Permits
-1
-0.8
-0.6
-0.4
-0.2
0
0.2
0.4
0.6
0.8
--- 2010 2015 2020 2025 2030 2035
Gto
nC
USA OLDEURO NEWEURO KOSAU CAJAZ TE MENA SSA SASIA CHINA EASIA LACA
J. Frankel, HarvardJ. Frankel, Harvard 4242
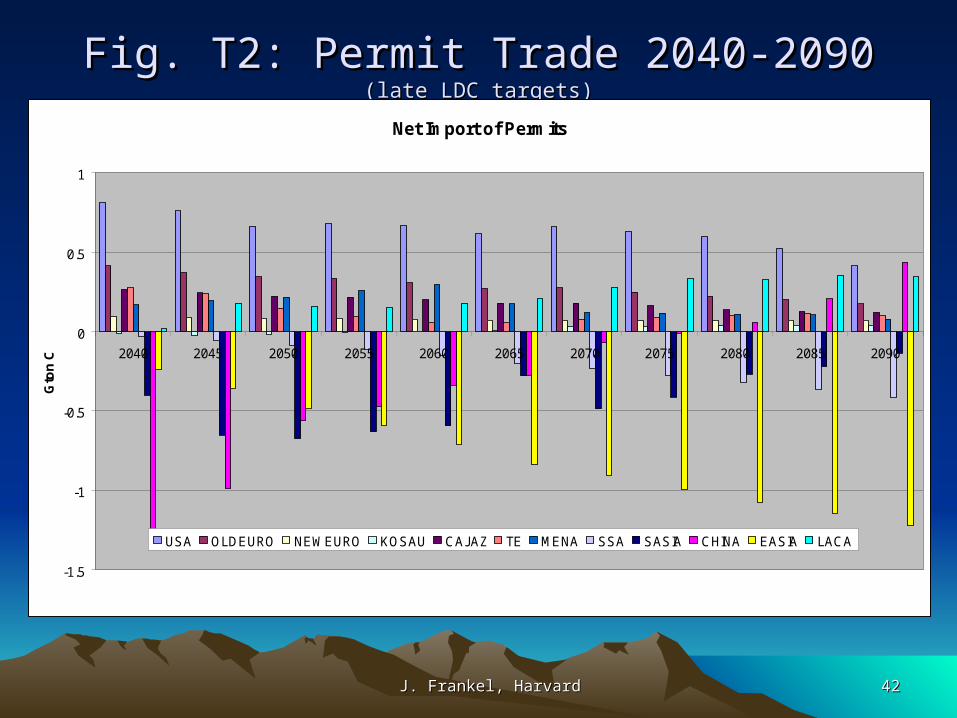
Fig. T2: Permit Trade 2040-2090 Fig. T2: Permit Trade 2040-2090 (late LDC targets)(late LDC targets)
Net Import of Permits
-1.5
-1
-0.5
0
0.5
1
2040 2045 2050 2055 2060 2065 2070 2075 2080 2085 2090
Gto
n C
USA OLDEURO NEWEURO KOSAU CAJAZ TE MENA SSA SASIA CHINA EASIA LACA
J. Frankel, HarvardJ. Frankel, Harvard 4343
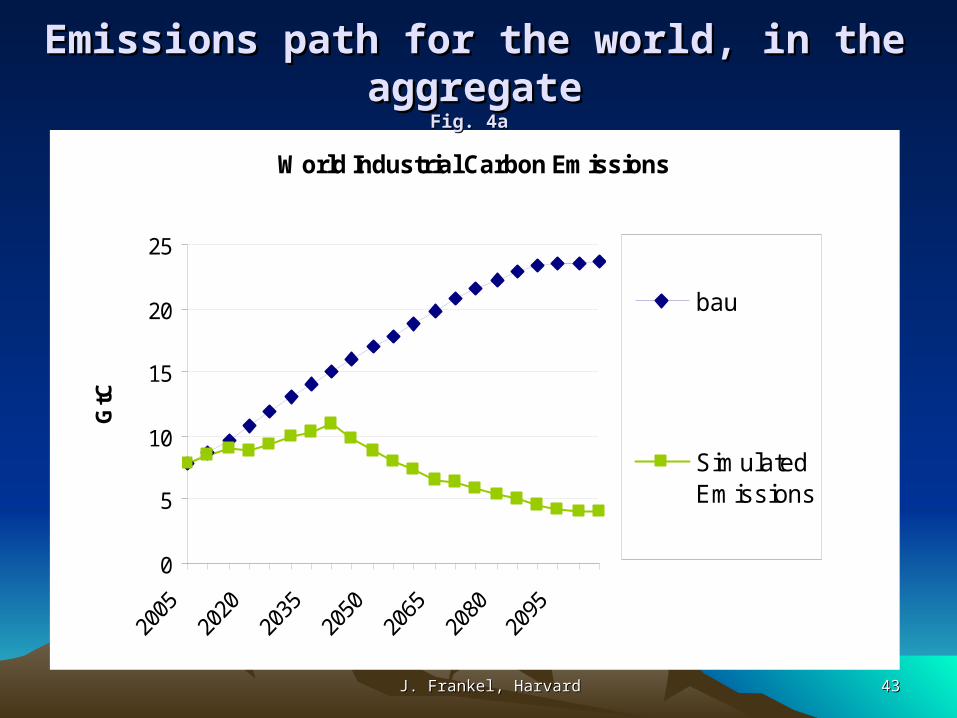
World Industrial Carbon Emissions
0
5
10
15
20
25
GtC
bau
SimulatedEmissions
Emissions path for the world, in the aggregateEmissions path for the world, in the aggregateFig. 4aFig. 4a

J. Frankel, HarvardJ. Frankel, Harvard 4444
Price of Carbon Dioxide Rises Slowly Price of Carbon Dioxide Rises Slowly Over 50 Years, then RapidlyOver 50 Years, then Rapidly
Fig. 5aFig. 5a
Price of Carbon Permits
0100200300400500600700800
2005 2020 2035 2050 2065 2080 2095
$/tC
O2
e
FRANKELArchitecture
Zoom on Price of Carbon Permits
0
20
40
60
80
100
120
140
2005 2015 2025 2035 2045
$/tC
O2e
FRANKELArchitecture
J. Frankel, HarvardJ. Frankel, Harvard 4545
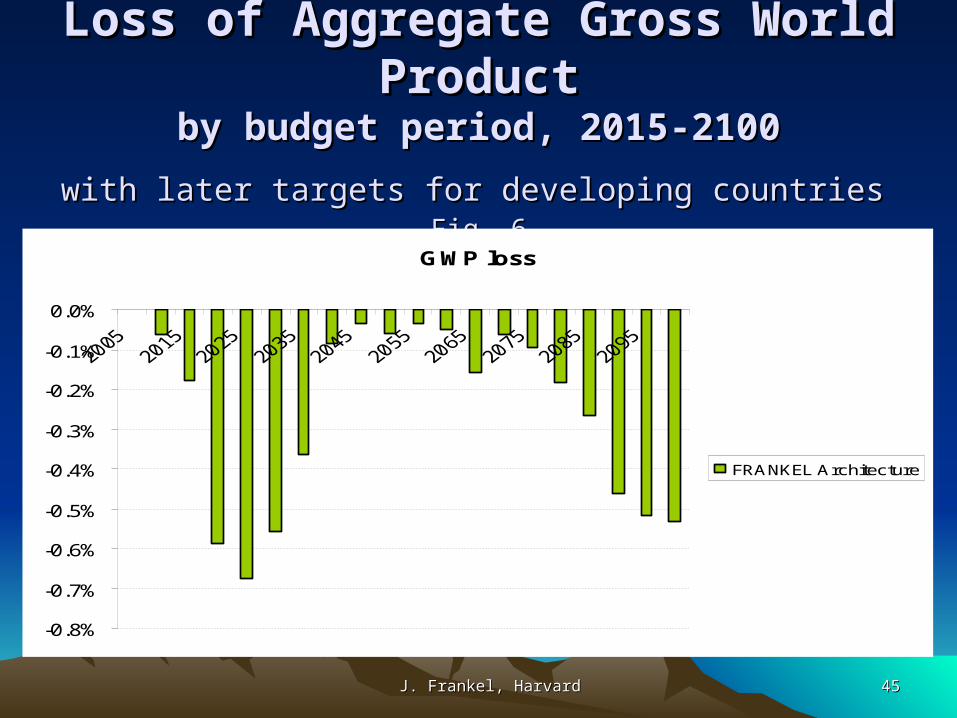
Loss of Aggregate Gross World ProductLoss of Aggregate Gross World Productby budget period, 2015-2100by budget period, 2015-2100
with later targets for developing countries with later targets for developing countries Fig. 6Fig. 6
GWP loss
-0.8%
-0.7%
-0.6%
-0.5%
-0.4%
-0.3%
-0.2%
-0.1%
0.0%
FRANKEL Architecture
J. Frankel, HarvardJ. Frankel, Harvard 4646
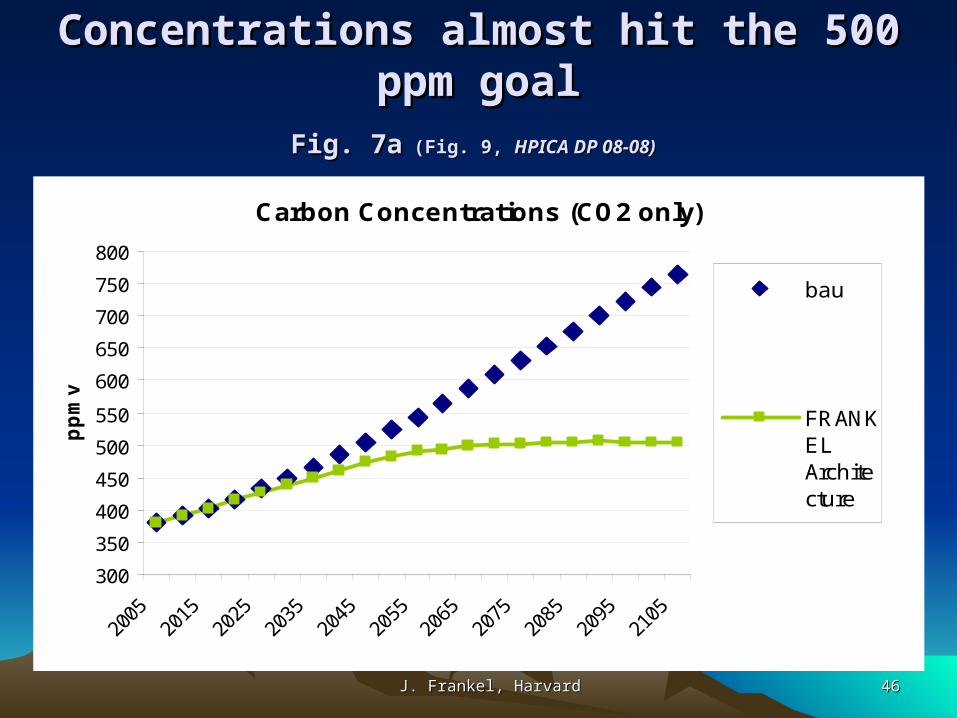
Carbon Concentrations (CO2 only)
300
350
400
450
500
550
600
650
700
750
800
pp
mv
bau
FRANKELArchitecture
Concentrations almost hit the 500 ppm goalConcentrations almost hit the 500 ppm goalFig. 7aFig. 7a (Fig. 9, (Fig. 9, HPICA DP 08-08)HPICA DP 08-08)
J. Frankel, HarvardJ. Frankel, Harvard 4747
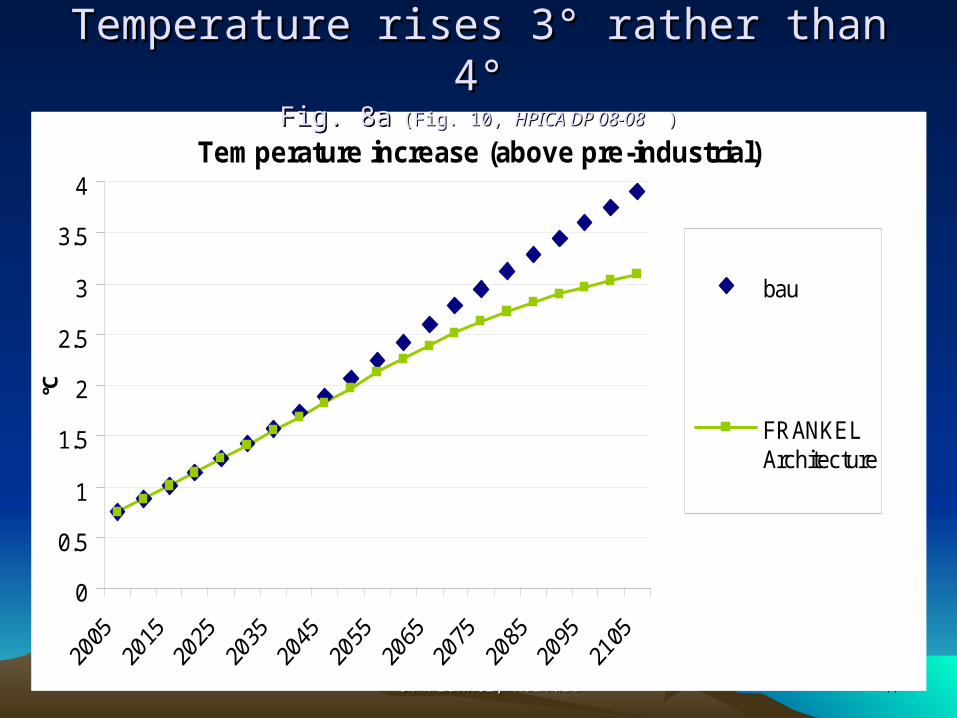
Temperature increase (above pre-industrial)
0
0.5
1
1.5
2
2.5
3
3.5
4
°C
bau
FRANKELArchitecture
Temperature rises 3° rather than 4°Temperature rises 3° rather than 4°Fig. 8aFig. 8a (Fig. 10, (Fig. 10, HPICA DP 08-08HPICA DP 08-08 ) )
Paper:Paper: http://ksghome.harvard.edu/~jfrankel/SpecificTargetsHPICA2009.dochttp://ksghome.harvard.edu/~jfrankel/SpecificTargetsHPICA2009.docAvailable at: http://ksghome.harvard.edu/~jfrankel/currentpubsspeeches.htm#On%20Climate%20ChangeAvailable at: http://ksghome.harvard.edu/~jfrankel/currentpubsspeeches.htm#On%20Climate%20Change
Harvard Project on Harvard Project on
International International
Climate Climate Agreements;Agreements; directed by directed by
J.Aldy & R.Stavins.J.Aldy & R.Stavins.
Thanks to Thanks to ValentinaValentina
BosettiBosetti