abstract this reviewed 2020/21 idp seeks to provide an
TRANSCRIPT
ABSTRACT THIS REVIEWED 2020/21 IDP SEEKS
TO PROVIDE AN OVER-ARCHING
STRATEGIC FRAMEWORK FOR THE
DISTRICT OVER THE NEXT FINANCIAL
YEAR, AS WELL “GUIDE” THE
DISTRICT FISCAL APPROPRIATIONS
FOR THE 2020/21 MTREF

Page 2 of 218
Contents
SECTION 1 ................................................................................................................ 6
INTRODUCTION ........................................................................................................ 6
PURPOSE OF THE IDP ............................................................................................. 6
FOREWORD BY THE EXECUTIVE MAYOR ............................................................ 7
OVERVIEW BY THE MUNICIPAL MANAGER ....................................................... 11
SECTION 2: EXECUTIVE SUMMARY ..................................................................... 12
VISION ..................................................................................................................... 12
MISSION .................................................................................................................. 12
SECTION 3: SPATIAL RATIONALE ....................................................................... 15
SPATIAL DEVELOPMENT ELEMENTS WITHIN NORTH WEST........................... 16
REGIONAL AND INTRA-REGIONAL ACCESSIBILITY AND MOBILITY ............... 16
THE SPATIAL DEVELOPMENT PATTERN ............................................................ 18
CLUSTERS OF POPULATION AND ECONOMIC CONCENTRATIONS ............... 19
MAIN CONCENTRATIONS OF ECONOMIC ACTIVITY AND POPULATION
(REGIONAL NODES) .............................................................................................. 20
DEMOGRAPHIC PROFILE OF OUR DISTRICT...................................................... 20
Total Population ................................................................................................ 21
Population by population group, Gender and Age............................................. 26
OVERALL ECONOMIC OUTLOOK OF THE DISTRICT ......................................... 29
Gross Domestic Product by Region (GDP-R) ................................................... 30
Gross Value Added by Region (GVA-R) ........................................................... 36
Household Infrastructure ...................................................................................... 44
Household by Dwelling Type ............................................................................. 44
Household by Type of Sanitation ...................................................................... 48
Households by Access to water ........................................................................ 52
Households by Type of Electricity ..................................................................... 55
SECTOR PLANS...................................................................................................... 58
District SDF .......................................................................................................... 58
Spatial Development Frameworks ........................................................................ 62
Kgetlengrivier Local Municipality ....................................................................... 63
Moretele Local Municipality ............................................................................... 64
Moses Kotane Local Municipality ...................................................................... 65
Rustenburg Local Municipality .......................................................................... 67

Page 3 of 218
Households by Refuse Disposal ....................................................................... 69
LEGISLATIVE FRAMEWORK ............................................................................. 72
Binding legislation, policies, and planning requirements at National and
Provincial Levels. .............................................................................................. 72
Powers & Functions .............................................................................................. 79
DISTRICT PRIORITIES ........................................................................................... 82
Prioritized needs from constituent Local Municipalities ..................................... 82
MUNICIPAL PRIORITIES ........................................................................................ 83
THE DISTRICT WIDE PRIORITIES ......................................................................... 84
LIST OF UNFUNDED PROJECTS AND PROGRAMMES WITHIN THE DISTRICT
MUNICIPALITY ........................................................................................................ 85
1. ENVIRONMENTAL MANAGEMENT PROJECTS/PROGRAMMES .......... 85
2. COMMUNITY DEVELOPMENT SERVICES ............................................... 91
3. ELECTRICITY PROJECTS .............................................................................. 98
4. HOUSING PROJECTS ...................................................................................... 100
5. LOCAL ECONOMIC DEVELOPMENT ..................................................... 105
6. ROADS PROJECTS ...................................................................................... 108
7. SANITATION .................................................................................................. 113
8. WATER PROJECTS ...................................................................................... 117
9. SPATIAL PLANNING, LAND USAGE AND INSTITUTIONAL DEVELOPMENT
............................................................................................................................ 123
SECTION 3: IDP PLANNING PROCESS .............................................................. 124
THE PLANNING PROCESS .................................................................................. 124
ROLES AND RESPONSIBILITIES OF VARIOUS KEY ROLE PLAYERS ............. 127
ALIGNMENT WITH NATIONAL AND PROVINCIAL POLICY CONTEXT .............. 129
National Development Plan ................................................................................ 129
Outcome Approach ............................................................................................. 131
Table 5: Government's Outcomes ...................................................................... 132
Nine (9) Point Plan .............................................................................................. 132
SECTION 4: GOVERNANCE AND INSTITUTIONAL ARRANGEMENTS ............ 134
District Governance Model ................................................................................. 134
Council’s Political Structure ................................................................................ 135
Political Party Whips ........................................................................................... 139
Administrative Structure ...................................................................................... 140
District Key Performance Areas and Objectives ................................................. 142
Operational Strategies ............................................................................................ 144

Page 4 of 218
Basic Service Delivery and Infrastructure Investment Strategies ........................... 145
Basic Service Delivery and Infrastructure Investment Strategies ........................... 146
Basic Service Delivery and Infrastructure Investment Strategies ........................... 147
Municipal Financial Viability and Management Strategies ...................................... 148
Local Economic Development Strategies ............................................................... 149
Municipal Transformation & Organisational Design ............................................... 150
Good Governance and Public Participation strategies ........................................... 152
Good Governance and Public Participation strategies ........................................... 153
Facilitate and Support Municipal Committees ........................................................ 153
IGR ......................................................................................................................... 153
TOP TEN (10) STRATEGICAL RISK IDENTIFIED ................................................ 154
Current Mitigating Measures ............................................................................... 154
Responsible ........................................................................................................ 154
Person/ Persons ................................................................................................. 154
SECTION 5: 2020/2021 MEDIUM TERM REVENUE AND EXPENDITURE
FRAMEWORK (MTREF) AND THE FINANCIAL PLAN ......................................... 158
2020/21 FINANCIAL PLAN ................................................................................... 162
1. INTRODUCTION ....................................................................................... 162
2. BACKGROUND .............................................................................................. 162
3. THE PURPOSE OF THE FINANCIAL PLAN .................................................. 163
4. KEY FOCUS AREAS OF THE FINANCIAL PLAN ............................................. 163
4.1 TRADE PAYABLES ...................................................................................... 163
4.2 REVENUE .................................................................................................... 163
4.3 EXPENDITURE AND COST CONTAINMENT MEASURES ........................ 168
4.4 DEBT COLLECTION STRATEGY (N/A) ....................................................... 172
4.5 INDIGENTS (N/A) ......................................................................................... 172
4.5 DATA CLEANSING (N/A) ............................................................................. 173
4.6 REPAIRS AND MAINTENANCE OF INFRASTRUCTURE ASSETS (N/A) .. 173
4.7 CASH FLOW MANAGEMENT-SEE ANNEXURE A .................................. 173
4.8 COST REFLECTIVE TARIFFS (N/A) ........................................................... 174
CASHFLOW PROJECTIONS ............................................................................ 175
SECTION 6: SERVICE DELIVERY AND BUDGET IMPLEMENTATION PLAN ... 176
ORGANISATIONAL STRUCTURE........................................................................ 193
OFFICE OF THE EXECUTIVE MAYOR ............................................................. 193
Page 5 of 218
OFFICE OF THE SPEAKER .............................................................................. 194
OFFICE OF THE SINGLE WHIP ........................................................................ 195
OFFICE OF THE MUNICIPAL MANAGER ......................................................... 196
CORPORATE SUPPORT SERVICES ................................................................ 199
DEPARTMENT OF ECONOMIC DEVELOPMENT, TOURISM, AGRIC & RURAL
DEVELOPMENT .................................................................................................... 202
BUDGET & TREASURY ..................................................................................... 203
DEPARTMENT OF HEALTH AND ENVIROMENTAL SERVICES (A) ................... 204
DEPARTMENT OF MUNICIPAL HEALTH & ENVIROMENTAL SERVICES (B) .... 205
SECTION 7: INTEGRATION AND OPERATIONAL STRATEGIES ...................... 212
BOJANALA PLATINUM DISTRICT MUNICIPALITY DISASTER MANAGEMENT
FRAMEWORK ....................................................................................................... 212
BOJANALA PLATINUM DISTRICT MUNICIPALITY DISASTER RISK
MANAGEMENT PLAN .......................................................................................... 212
LOCAL ECONOMIC DEVELOPMENT STRATEGY .............................................. 214
TOURISM ........................................................................................................... 214
AGRICULTURE.................................................................................................. 214
TOURISM DEVELOPMENT STRATEGY .............................................................. 215
PMS FRAMEWORK .............................................................................................. 215
AIR QUALITY MANAGEMENT PLAN ................................................................... 216
ENVIRONMENTAL MANAGEMENT FRAMEWORK ............................................ 216
INTEGRATED WASTE MANAGEMENT PLAN .................................................... 217
INTERNAL AUDIT PLAN ...................................................................................... 217
FRAUD POLICY AND RESPONSE PLAN ............................................................ 217
WORKPLACE SKILLS DEVELOPMENT PLAN ................................................... 218

Page 6 of 218
SECTION 1
INTRODUCTION
According Section 152 and 153 of the Constitution of the Republic of South, local
government is responsible for the development process in a given municipal
area, and responsible for planning and development of the specific area. The
constitutional mandate is to align management, budgeting and planning functions
to its objectives and gives a clear indication of the intended purposes of municipal
integrated development planning.
The Bojanala Platinum District Municipality acknowledges its constitutional
responsibility and understands the importance that strong political leadership;
sound administration and financial management plays in the effective functioning
of a municipality and has therefore reconfirmed its Vision, Mission and Mandate,
which are:
PURPOSE OF THE IDP
The purpose of integrated development planning is a faster and more appropriate
delivery of services and providing a framework for economic and social development
in a municipality. The integrated development planning is aimed at contributing
towards eradicating the development legacy of the past, making the notion of
developmental local governmental work and fostering co-operative governance
The IDP must be reviewed annually and is the municipal strategic planning instrument
that guides and informs all planning, budgeting, management and decision making in
a municipality. It is a tool for bridging the gap between the current reality and the vision
of satisfying the needs of the whole district community in an equitable and sustainable
manner. The integrated development planning will enable the Bojanala Platinum
District Municipality to develop Service Delivery and Budget Implementation Plan
(SDBIP) capacity to mobilise resources and to target activities

Page 7 of 218
FOREWORD BY THE EXECUTIVE MAYOR
It is with great pleasure as the Executive Mayor of Bojanala Platinum
District Municipality to present to the Council, communities and various
stakeholders of the Municipality, the Draft IDP Review for the 2020/21
Financial Year.
The Integrated Development Plan (IDP) is presenting the strategic
blueprint for Bojanala Platinum District Municipality that communicates
to the community of Bojanala Platinum service delivery priorities within
its jurisdiction.
The drafting of the IDP requires a lengthy planning process, and involves
a wide range of role players from inside and outside the municipality.
The process therefore needs to be properly organized and prepared.
As a result, municipalities are required to prepare an Operational Plan
(commonly known as a Process Plan) which indicate what needs to
happen, by when, whom and where and includes the costs estimates for
facilitating the process.
It is very important for municipalities to adhere to this plan in order to
fulfil the legal requirements of Section 28 of the Local Government
Municipal Systems Act of 2000. The processes to be followed in
preparing our IDP`s are as well guided by White Paper on Local
Government promulgated in 1998.
The plan takes cognizance of the successes and challenges of the entire
district and outlines projects designed to circumvent the identified
service delivery challenges. It also gives an overall framework for
development and focuses on economic and social development of the
district as a whole.

Page 8 of 218
This Reviewed IDP document is a result of yet another extensive
consultative process undertaken by our local municipalities within the
district. It is an expression of the general interest of our people and a
mirror that reflects the holistic approach to this process.
We are striving to keep the promise we took when we assumed our
responsibilities, that’s the promise of improving lives of our communities.
When reflecting back to the previous financial year, I look back with
a bit of disappointment. Our planned goals, through various KPIs
were not achieved, long and short terms. This is because the
municipality went through a serious financial challenges. As a result,
we were unable to keep the fire burning as expected.
I can report that during the second half of the year in the 2019/2020
financial year, there was an amount of R134m which was erroneously
transferred into the Bojanala Platinum District Municipality bank
account. We later learned that the money was meant to be going to
the Rustenburg Local Municipality. About R84m of the money was,
therefore used, and R50m was redirected to the Rustenburg Local
Municipality. I also note that these transactions were not brought to
the attention of the municipal council.
Proper arrangements in consultation with the Department of Local
Government and Traditional Affairs involving also the Provincial
Treasury to repay all the money that was transferred in our bank
account.
Upon receiving our first tranche of our equitable shares during the
first quarter of the current financial year, the remaining balance was

Page 9 of 218
paid back to the Provincial Department of Local Government and
Traditional Affairs.
The municipality is currently recovering financially following the
Council’s resolution to place the Municipal Manager and the CFO on
suspension and request the Provincial Government to second
Municipal Manager and CFO on an acting capacity. Repayment of
the money that was erroneously transferred has negatively affected
the financial status of the municipality which has led to the special
adjustment of the budget the 2019/2020 financial year. Financial
recovery plan developed is geared towards ensuring that the
municipality becomes financially stable/ viable.
I am proud to announce that there are plans currently in place to
ensure that there will be no repeat of the same situation in future.
The current 2020/21 draft reviewed IDP and MTREF will still not
enable the Municipality to execute its legislated mandate.
At times I take a pause and reflect, there are a few lessons learnt from
our previous financial challenges and one of those is that it is essential
that spending pressure be controlled, without this measure, municipal
finances are at risk.
I applaud the work currently done by the Acting Municipal Manager and
the Acting CFO in putting systems to protect the municipal budget with
proper financial control.

Page 10 of 218
I am confident, though, that we will be able to manage these pressures.
We need to improve the efficiency of our spending to ensure continued
service delivery to the people of Bojanala Platinum District Municipality.
In conclusion, I convey my sincere appreciation to the Municipal Council,
members of the Budget Steering Committee, Finance and IDP Porfolio
Committees, the Acting Municipal Manager, Acting CFO and all other staff
members who were very instrumental in ensuring that this Draft IDP
Review is finalized.
Ke a leboga Bagaetsho . . .
CLLR FETSANG MOLOSIWA
EXECUTIVE MAYOR
BPDM
Page 11 of 218
OVERVIEW BY THE MUNICIPAL MANAGER
Bojanala Platinum District Municipality (BPDM) is a category C municipality
constituted by the following local municipalities (Category B):
Kgetleng Rivier LM – low capacity LM;
Moretele LM – low capacity LM;
Moses Kotane LM – medium capacity LM;
Madibeng LM – High capacity LM; and
Rustenburg LM – high capacity LM.
In terms of the assigned powers and functions, BPDM does not provide basic services
but coordinate & support in line with section 88(2) the Municipal Structures Act 117 of
1998 to its local municipalities. Within its scope of powers and functions, BPDM
provides disaster management and firefighting services.
The Drafting of the 4th Generation Integrated Development Plan (2017/22 IDP) was
initiated through the adoption of IDP Framework/Process Plan which served as
blueprint for the development of the Integrated Development Plan. The Integrated
Development Plan is deliberately called the principal strategy since all the resources
should be used to implement it successfully.
BPDM is a district that experiences a huge inward migration making the
developmental issues extremely complex. This demanded that various stakeholders
should not only identify challenges but also make concerted efforts to deal with them.
MS. DESIREE TLHOAELE
ACTING MUNICIPAL MANAGER
SECTION 2: EXECUTIVE SUMMARY
The 2020/21 Reviewed IDP is a result of extensive consultation with the various role
players as demonstrated by the developmental priorities that each municipality put
forward. A situation analysis is made of where the municipalities are at present and
where they want to be in future.
The Infra-structure and services delivery, socio-economic, spatial development and
economic framework are respectively outlined. The way forward is subsequently
concretized by a strategic long term vision and secondly, by the detail in which these
strategic objectives will be achieved.
The district municipality derives the following mandate from Section 152 of the
Constitution of South Africa, Act 108 of 1996,
To promote democratic and accountable local government;
To ensure the provision of services to communities in a sustainable manner/;
To promote social and economic development;
To promote a safe and healthy environment; and
To encourage the involvement of communities and community organizations in
the matters of local government
VISION
The IDP is guided by Municipal vision which states that “Bojanala Platinum District
Municipality, a model of cooperative governance for effective and efficient service
delivery in partnership with local municipalities and all stakeholders”.
MISSION
In order to achieve the vision, the district municipality has to adhere to its Mission
Statement and the elucidation of the strategic IDP Objectives through shared services,
will coordinate, facilitate and support local municipalities by equitable sharing of
resources and maximising community benefit of natural resources in a safe and
healthy environment.

Page 13 of 218
The BPDM 2020/21 Reviewed Integrated Development Plan seeks to provide an over-
arching strategic framework for the municipality for the next Financial Year.
This document details several areas that are important for any member of the public
or interested party to have a fuller understanding what is planned over four quarters
of a financial year. It will also be the basis upon which macro targets for service
delivery in the district, taking into account the allocated powers and functions, will be
shaped.
The IDP is developed in line with section 25 of the Local Government: Municipal
Systems Act, 2000 (Act 32 of 2000), which requires each newly elected municipal
council, to adopt a single, inclusive and strategic plan (Integrated Development Plan
or IDP) for the development of the municipality which links, integrates and coordinates
plans and takes into account proposals for the development of the municipality and
which aligns the resources and capacity of the municipality with the implementation of
the said plan. The newly elected council of Bojanala Platinum District Municipality
developed the 4th Generation IDP as the principal strategic planning instrument to
guide and inform all planning, budgeting, management and decision-making
processes in line with the Local Government Systems Act.
The 4th Generation IDP which was approved by Council in May 2017, was developed
in line with the IDP process plan which was approved late by council in November
2019. The IDP process plan seek to identify and coordinate key stakeholders in the
planning process in the district municipality and coordinate their contribution in the
development of the IDP.
In the original 4th Generation IDP, when approved, the following key features as per
section 26 of the Municipal Systems Act, 32 of 2000, were included:
i. an assessment of the existing level of development
ii. the council’s development priorities and objectives
iii. the council’s development strategies
iv. the spatial development framework – albeit, the review of the SDF in line with
the Spatial Planning & Land Use Management Act (SPLUMA);
v. the council’s operational strategies;
vi. the disaster management plan;
Page 14 of 218
vii. a financial plan, and
viii. the key performance indicators and performance targets.
The IDP document will be reviewed at the end of each financial year after the
assessment of the performance of the municipality and an analysis of the situation at
community level.

SECTION 3: SPATIAL RATIONALE

Page 16 of 218
SPATIAL DEVELOPMENT ELEMENTS WITHIN NORTH WEST
North West lies in the northern part of South Africa, north - east of the Northern Cape
Province, west of the Free State Province and Gauteng Province and south of Limpopo
Province. It borders Botswana in the east. The Geographical size of North West is
105703.4 km2.
REGIONAL AND INTRA-REGIONAL ACCESSIBILITY AND MOBILITY
North West has excellent regional and intraregional accessibility supported by a system of
regional and national linkages, providing different levels of mobility within the province.
Road links
The roads of regional importance supporting the development of transportation
development corridors. North West is linked to surrounding areas by a system of national
and provincial roads. The national and provincial roads systems within the North West
provide the following regional links supporting the development of transportation
development corridors:
The N4. Development nodes within along this route include Brits (Madibeng LM),
Rustenburg, Swartruggens (Kgetlengrivier LM ), Groot Marico and Zeerust (
Ramotshere Moloa LM)
The N12 route between Johannesburg and Kimberley (Treasure Corridor) including
the development nodes of Potchefstroom (JB Marks LM), Klerksdorp (Matlosana
LM), Wolmaranstad (Maquassi Hills LM) and Christiana (Lekwa Teemane LM).
The N14 route linking Gauteng with Kuruman ( Northern Cape) including the
development nodes of Ventersdorp, Delareyville (Tswaing LM) and Vryburg ( Naledi
LM)
The N18 linking Gaborone (Botswana ) with Mahikeng, Setlagole (Ratlou LM) ,
Vryburg
(Naledi LM), Taung (Greater Taung) and Christiana and Kimberley (N17)

Page 17 of 218
Railway Systems
The railway system provides the following main links:
Johannesburg- Potchefstroom- Kleksdorp- Christiana – Kimberley( Cape Town)
Johannesburg - Koster - Zeerust – Mahikeng- Setlagole- Vryburg- Taung- Kimberley
( Cape Town)
Johannesburg- Ventersdorp- Delareyville- Wolmaranstad- Taung – Kimberley
Tshwane – Brits – Rustenburg - Elliesrus
Mahikeng- Lobatse- Gaborone - Francistown- Bulawayo- Lusaka- Dar es salaam
Airports
Two major airports are provided:
Pilanesberg International Airport ( ACSA)
The Kgosi Montshioa Airport (Mahikeng Airport - North West Province Department
of Transport and Roads)
Other smaller airfields include:
Potchefstroom
Klerksdorp
Rustenburg
Lichtenburg
Zeerust
Vryburg
The main roads, railway system and airports provide the accessibility and mobility
necessary for regional economic development.
Page 18 of 218
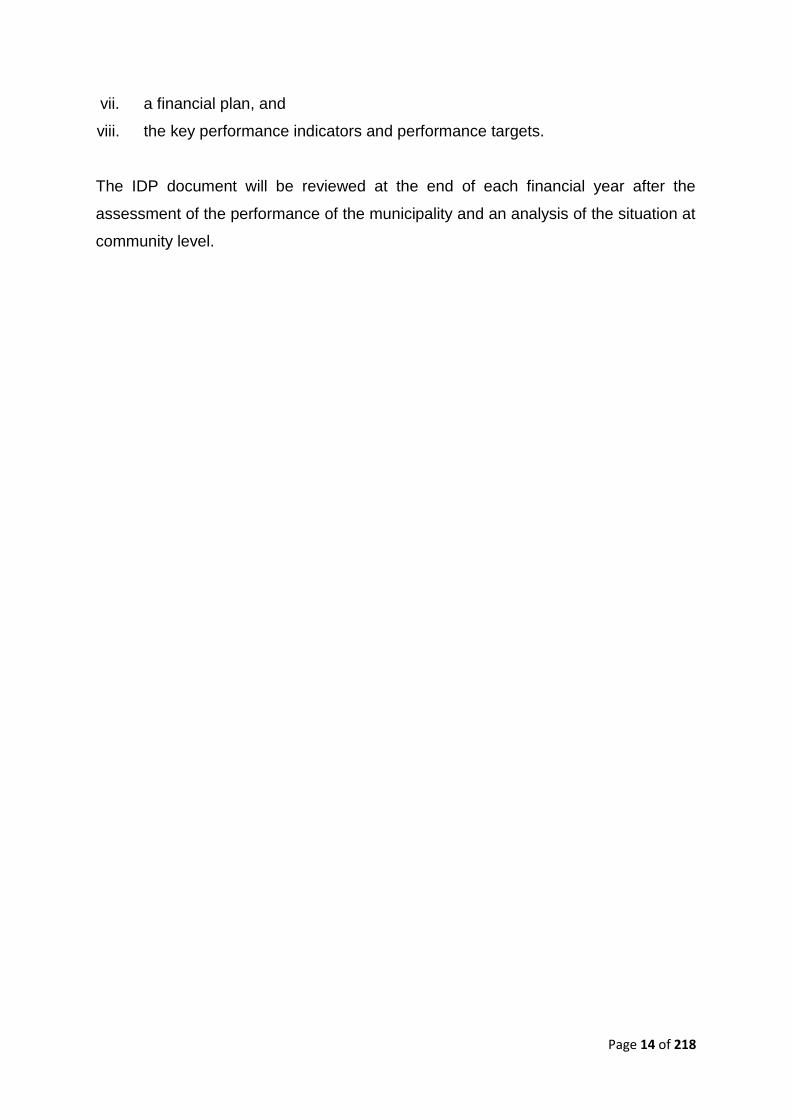
Table 1: Map: Regional Setting
THE SPATIAL DEVELOPMENT PATTERN
The existing spatial pattern within North West provides for a spatial development system
providing for economic development concentrated in a system represented by:
Regional activity nodes within transportation corridors.
o The Platinum Development Corridor as the main regional development corridor
supported by the N4 route focusing on public and private investments initiatives
within the corridor. Within North West, the Platinum Development Corridor
accommodates:
the primary activity nodes of Brits and Rustenburg and associated industrial
and mining concentrations,
the secondary activity nodes of Hartbeespoort and Marikana
Zeerust as tertiary node

Page 19 of 218
The tertiary activity nodes of Swartruggens, Lehurutse, Groot Marico and
Swartruggens
o The N12 development corridor supporting the Johannesburg- Cape Town
transportation corridor with;
Potchefstroom and Klerksdorp as primary activity nodes
Stilfontein and Wolmaranstad as secondary nodes
Bloemhof and Christiana as tertiary nodes
o The concentration of North West’s economic development and population into the
main sub regional/regional development nodes of Madibeng, Rustenburg, Mahikeng
and Matlosana
Attracting sub regional trade, industry and services providing for the existing
population and adjoining rural areas
Providing economic growth, providing employment to the existing as well
future urban and rural hinterland population
A system of smaller activity nodes interconnected with each other and the regional
corridor and activity nodes by a system of roads providing economic and social
infrastructure for their respective populations and economies.
The development of poor rural communities, remote from economic activity nodes
which also form part of rural communities with economic, social and engineering
infrastructure to enable them to participate in the local and regional economies
A strong developed tourism sector as a result of the biodiversity provided by regional,
national, provincial and private protected and conservation areas.
Agriculture taking up the largest part of the province.
CLUSTERS OF POPULATION AND ECONOMIC CONCENTRATIONS
The distribution of population and economic activity indicate a definite pattern of categories
of local municipalities representing main concentrations, the rural communities, medium
sized population concentrations and small concentrations.
Page 20 of 218
MAIN CONCENTRATIONS OF ECONOMIC ACTIVITY AND POPULATION
(REGIONAL NODES)
The main concentrations of economic activity provide the regional activity centres, which
provide collectively the basis for the development of future development corridors and
already accommodate a strong urbanisation trend. Approximately 63% of the total
economic activity of North West is concentrated into the 4 local economies of Madibeng,
Rustenburg, Mahikeng and Matlosana Municipalities. These municipalities represent
approximately 50% of the North West population and 58% of the North West labour force.
All the main concentrations experienced very low or declining economic growth rates. The
population growth rates within these concentrations are exceeding the population growth
rates by far especially in Madibeng (2.4%) and Rustenburg (3.1%).
Should slow economic growth rates prevail, it can be expected that it will assist in lower
incomes and GVA’s per capita and higher unemployment. High employment growth rates
are however necessary to ensure the eradication of poverty. The concentration of
economic activities into the 4 municipalities supported by the large accessible activity
nodes of Madibeng, Rustenburg, Mahikeng and Matlosana provides a strong basis for
further urbanisation and nuclei for attracting and distributing economic development.
DEMOGRAPHIC PROFILE OF OUR DISTRICT
"Demographics", or "population characteristics", includes analysis of the population of a
region. Distributions of values within a demographic variable, and across households, as
well as trends over time are of interest.
In this section, an overview is provided of the demography of the Bojanala Platinum
District Municipality and all its neighbouring regions, the North-West Province and South
Africa as a whole.

Page 21 of 218
Total Population
Population statistics is important when analysing an economy, as the population growth
directly and indirectly impacts employment and unemployment, as well as other economic
indicators such as economic growth and per capita income.
TABLE 1. TOTAL POPULATION - BOJANALA PLATINUM, NORTH-WEST AND
NATIONAL TOTAL, 2006-2016 [NUMBERS PERCENTAGE]
Bojanala
Platinum North-West
National
Total
Bojanala
Platinum
as % of
province
Bojanala
Platinum
as % of
national
2006 1,320,000 3,220,000 47,800,000 41.1% 2.8%
2007 1,350,000 3,260,000 48,400,000 41.5% 2.8%
2008 1,390,000 3,310,000 49,100,000 41.9% 2.8%
2009 1,420,000 3,360,000 49,800,000 42.3% 2.9%
2010 1,460,000 3,430,000 50,700,000 42.7% 2.9%
2011 1,500,000 3,490,000 51,500,000 43.1% 2.9%
2012 1,540,000 3,550,000 52,400,000 43.4% 2.9%
2013 1,570,000 3,610,000 53,200,000 43.6% 3.0%
2014 1,610,000 3,670,000 54,100,000 43.8% 3.0%
2015 1,640,000 3,730,000 54,900,000 44.0% 3.0%
2016 1,670,000 3,790,000 55,700,000 44.1% 3.0%
Average Annual growth
2006-2016 2.37% 1.64% 1.54%
Source: IHS Markit Regional eXplorer version 1277
With 1.67 million people, the Bojanala Platinum District Municipality housed 3.0% of
South *Africa's total population in 2016. Between 2006 and 2016 the population growth
averaged 2.37% per annum which is close to double than the growth rate of South Africa
as a whole (1.54%). Compared to North-West's average annual growth rate (1.64%), the

Page 22 of 218
growth rate in Bojanala Platinum's population at 2.37% was slightly higher than that of
the province.
CHART 1. TOTAL POPULATION - BOJANALA PLATINUM AND THE REST OF
NORTH-WEST, 2016 [PERCENTAGE]
When compared to other regions, the Bojanala Platinum District Municipality accounts for
a total population of 1.67 million, or 44.1% of the total population in the North-West
Province, which is the most populous region in the North-West Province for 2016. The
ranking in terms of the size of Bojanala Platinum compared to the other regions remained
the same between 2006 and 2016. In terms of its share the Bojanala Platinum District
Municipality was significantly larger in 2016 (44.1%) compared to what it was in 2006
(41.1%).When looking at the average annual growth rate, it is noted that Bojanala
Platinum ranked highest (relative to its peers in terms of growth) with an average annual
growth rate of 2.4% between 2006 and 2016.
Bojanala Platinum
Ngaka Modiri Molema
Dr Ruth Segomotsi Mompati
Dr Kenneth Kaunda
Total population North-West Province, 2016
Source: IHS Markit Regional eXplorer version 1277

Page 23 of 218
TABLE 2. TOTAL POPULATION - LOCAL MUNICIPALITIES OF BOJANALA
PLATINUM DISTRICT MUNICIPALITY, 2006, 2011 AND 2016 [NUMBERS
PERCENTAGE]
2006 2011 2016
Average
Annual
growth
Moretele 185,000 187,000 194,000 0.45%
Madibeng 394,000 475,000 541,000 3.23%
Rustenburg 463,000 549,000 631,000 3.15%
Kgetlengrivier 42,400 51,000 58,300 3.23%
Moses Kotane 238,000 240,000 247,000 0.38%
Bojanala
Platinum 1,322,561 1,502,544 1,671,530 2.37%
Source: IHS Markit Regional eXplorer version 1277
The Kgetlengrivier Local Municipality increased the most, in terms of population, with an
average annual growth rate of 3.23%, the Local Municipality of Madibeng had the second
highest growth in terms of its population, with an average annual growth rate of 3.23%.
The Moses Kotane Local Municipality had the lowest average annual growth rate of
0.38% relative to the other within the Bojanala Platinum District Municipality.
Population projections
Based on the present age-gender structure and the present fertility, mortality and
migration rates, Bojanala Platinum's population is projected to grow at an average annual
rate of 1.5% from 1.67 million in 2016 to 1.8 million in 2021.

Page 24 of 218
TABLE 3. POPULATION PROJECTIONS - BOJANALA PLATINUM, NORTH-WEST
AND NATIONAL TOTAL, 2016-2021 [NUMBERS PERCENTAGE]
Bojanala
Platinum North-West
National
Total
Bojanala
Platinum
as % of
province
Bojanala
Platinum
as % of
national
2016 1,670,000 3,790,000 55,700,000 44.1% 3.0%
2017 1,700,000 3,850,000 56,500,000 44.2% 3.0%
2018 1,730,000 3,900,000 57,400,000 44.3% 3.0%
2019 1,750,000 3,960,000 58,100,000 44.4% 3.0%
2020 1,780,000 4,010,000 58,900,000 44.4% 3.0%
2021 1,800,000 4,060,000 59,600,000 44.4% 3.0%
Average Annual growth
2016-2021 1.52% 1.39% 1.37%
Source: IHS Markit Regional eXplorer version 1277
The population projection of Bojanala Platinum District Municipality shows an estimated
average annual growth rate of 1.5% between 2016 and 2021. The average annual growth
rate in the population over the forecasted period for North-West Province and South Africa
is 1.4% and 1.4% respectively and is lower than that the average annual growth in the
Bojanala Platinum District Municipality.
Page 25 of 218
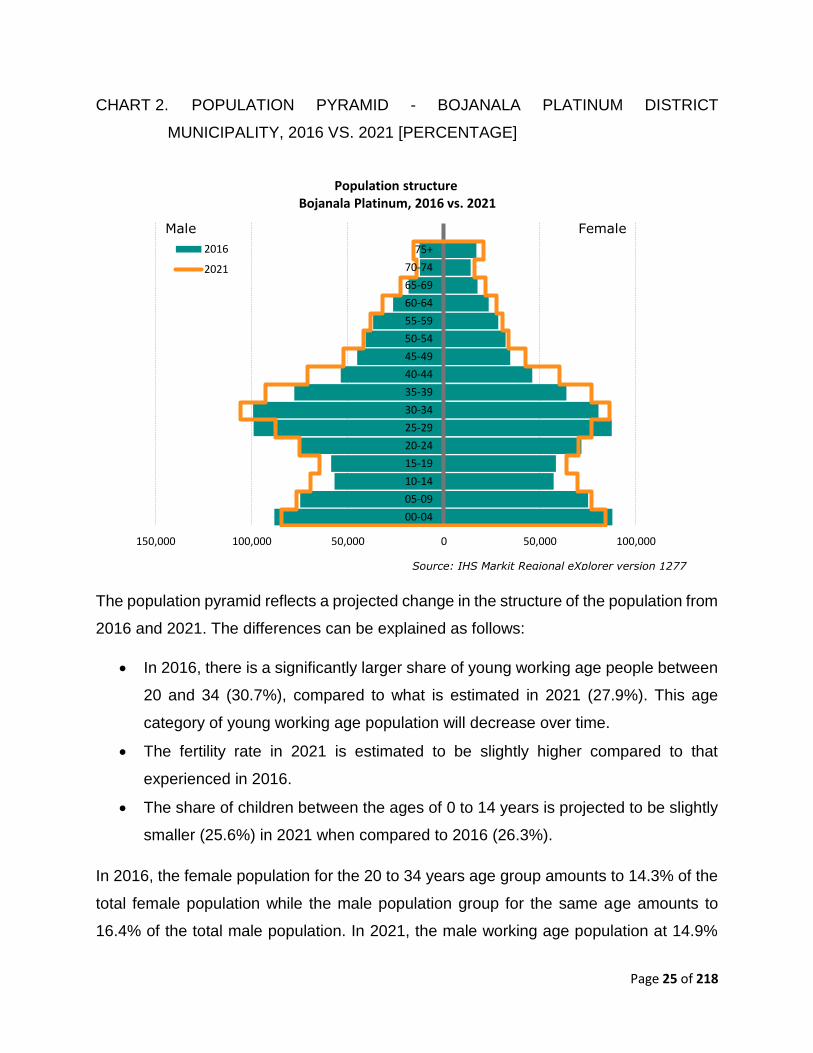
CHART 2. POPULATION PYRAMID - BOJANALA PLATINUM DISTRICT
MUNICIPALITY, 2016 VS. 2021 [PERCENTAGE]
The population pyramid reflects a projected change in the structure of the population from
2016 and 2021. The differences can be explained as follows:
In 2016, there is a significantly larger share of young working age people between
20 and 34 (30.7%), compared to what is estimated in 2021 (27.9%). This age
category of young working age population will decrease over time.
The fertility rate in 2021 is estimated to be slightly higher compared to that
experienced in 2016.
The share of children between the ages of 0 to 14 years is projected to be slightly
smaller (25.6%) in 2021 when compared to 2016 (26.3%).
In 2016, the female population for the 20 to 34 years age group amounts to 14.3% of the
total female population while the male population group for the same age amounts to
16.4% of the total male population. In 2021, the male working age population at 14.9%
150,000 100,000 50,000 0 50,000 100,000
00-04
05-09
10-14
15-19
20-24
25-29
30-34
35-39
40-44
45-49
50-54
55-59
60-64
65-69
70-74
75+
Population structure Bojanala Platinum, 2016 vs. 2021
2016
2021
Male Female
Source: IHS Markit Regional eXplorer version 1277
Page 26 of 218
still exceeds that of the female population working age population at 12.9%, although both
are at a lower level compared to 2016.
Population by population group, Gender and Age
The total population of a region is the total number of people within that region measured
in the middle of the year. Total population can be categorised according to the population
group, as well as the sub-categories of age and gender. The population groups include
African, White, Coloured and Asian, where the Asian group includes all people originating
from Asia, India and China. The age subcategory divides the population into 5-year
cohorts, e.g. 0-4, 5-9, 10-13, etc.
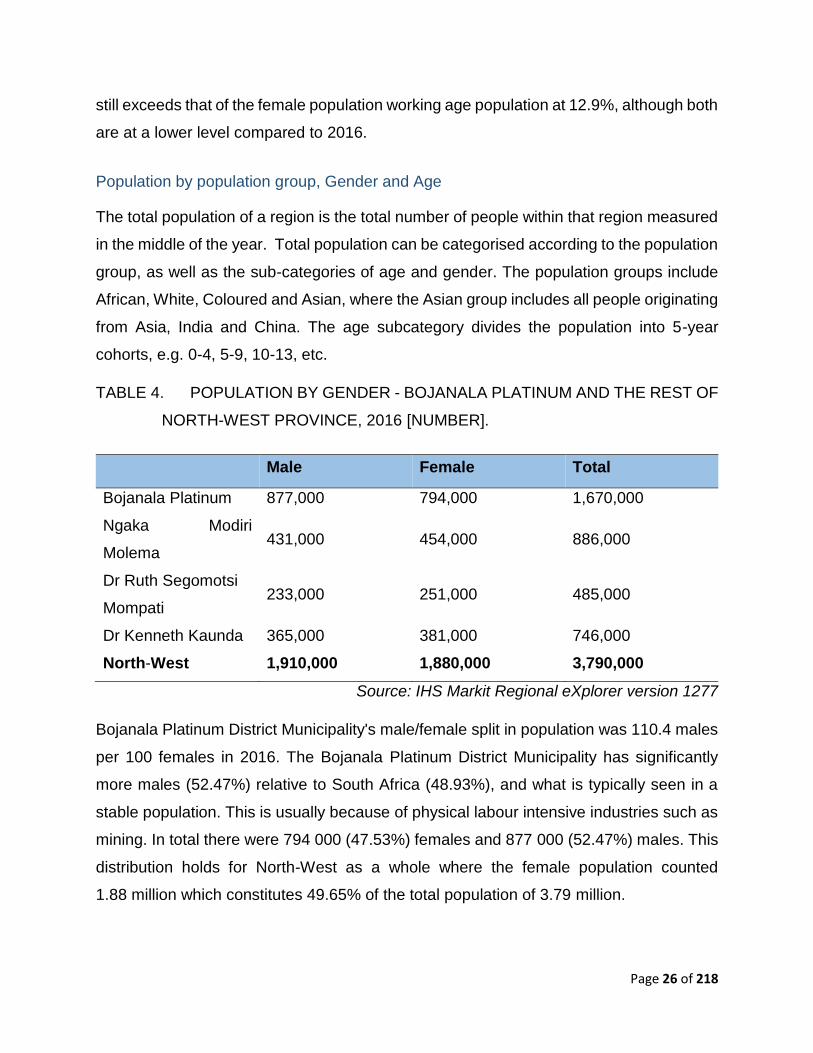
TABLE 4. POPULATION BY GENDER - BOJANALA PLATINUM AND THE REST OF
NORTH-WEST PROVINCE, 2016 [NUMBER].
Male Female Total
Bojanala Platinum 877,000 794,000 1,670,000
Ngaka Modiri
Molema 431,000 454,000 886,000
Dr Ruth Segomotsi
Mompati 233,000 251,000 485,000
Dr Kenneth Kaunda 365,000 381,000 746,000
North-West 1,910,000 1,880,000 3,790,000
Source: IHS Markit Regional eXplorer version 1277
Bojanala Platinum District Municipality's male/female split in population was 110.4 males
per 100 females in 2016. The Bojanala Platinum District Municipality has significantly
more males (52.47%) relative to South Africa (48.93%), and what is typically seen in a
stable population. This is usually because of physical labour intensive industries such as
mining. In total there were 794 000 (47.53%) females and 877 000 (52.47%) males. This
distribution holds for North-West as a whole where the female population counted
1.88 million which constitutes 49.65% of the total population of 3.79 million.

Page 27 of 218
TABLE 5. POPULATION BY POPULATION GROUP, GENDER AND AGE -
BOJANALA PLATINUM DISTRICT MUNICIPALITY, 2016 [NUMBER].
African White Coloured Asian
Female Male Female Male Female Male Female Male
00-04 82,900 83,000 3,900 4,170 622 730 369 387
05-09 70,300 69,600 3,940 4,250 563 529 324 385
10-14 53,400 53,000 3,100 3,330 391 394 279 237
15-19 54,600 54,500 3,090 3,500 432 452 184 211
20-24 67,900 71,600 2,950 3,420 526 564 234 263
25-29 82,100 93,200 4,460 4,800 531 615 388 463
30-34 75,100 93,100 4,210 4,860 608 724 540 638
35-39 58,600 72,100 4,160 4,370 497 563 525 882
40-44 41,000 48,100 4,100 4,440 410 459 512 658
45-49 29,600 39,900 4,170 4,340 316 433 422 415
50-54 27,700 36,100 3,950 4,060 236 285 266 314
55-59 24,300 32,500 3,640 3,950 228 234 189 191
60-64 20,000 23,100 2,890 3,120 171 148 291 145
65-69 14,600 15,700 2,430 2,440 141 164 319 123
70-74 11,800 10,700 1,850 1,620 100 64 252 116
75+ 13,800 10,600 2,720 1,820 100 79 219 123
Total 728,000 807,000 55,600 58,500 5,870 6,440 5,310 5,550
Source: IHS Markit Regional eXplorer version 1277
In 2016, the Bojanala Platinum District Municipality's population consisted of 91.79%
African (1.53 million), 6.82% White (114 000), 0.74% Coloured (12 300) and 0.65% Asian
(10 900) people.
The largest share of population is within the young working age (25-44 years) age
category with a total number of 608 000 or 36.4% of the total population. The age category
with the second largest number of people is the babies and kids (0-14 years) age category
with a total share of 26.3%, followed by the older working age (45-64 years) age category
with 268 000 people. The age category with the least number of people is the retired / old

Page 28 of 218
age (65 years and older) age category with only 91 900 people, as reflected in the
population pyramids below.
Population Pyramids
Definition: A population pyramid is a graphic representation of the population categorised
by gender and age, for a specific year and region. The horizontal axis depicts
the share of people, where the male population is charted on the left-hand side
and the female population on the right-hand side of the vertical axis. The
vertical axis is divided in 5-year age categories.
With the African population group representing 91.8% of the Bojanala Platinum District
Municipality's total population, the overall population pyramid for the region will mostly
reflect that of the African population group. The chart below compares Bojanala
Platinum's population structure of 2016 to that of South Africa.
CHART 3. POPULATION PYRAMID - BOJANALA PLATINUM DISTRICT
MUNICIPALITY VS. SOUTH AFRICA, 2016 [PERCENTAGE]
8.0% 6.0% 4.0% 2.0% 0.0% 2.0% 4.0% 6.0%
00-04
05-09
10-14
15-19
20-24
25-29
30-34
35-39
40-44
45-49
50-54
55-59
60-64
65-69
70-74
75+
Population structure Bojanala Platinum vs. South Africa, 2016
Bojanala Platinum
South Africa
Male Female
Source: IHS Markit Regional eXplorer version 1277

Page 29 of 218
By comparing the population pyramid of the Bojanala Platinum District Municipality with
the national age structure, the most significant differences are:
There is a significantly larger share of young working age people - aged 20 to 34
(30.7%) - in Bojanala Platinum, compared to the national picture (28.6%).
The area appears to be a migrant receiving area, with many of people migrating
into Bojanala Platinum, either from abroad, or from the more rural areas in the
country looking for better opportunities.
Fertility in Bojanala Platinum is slightly higher compared to South Africa as a
whole.
Spatial policies changed since 1994.
The share of children between the ages of 0 to 14 years is significant smaller
(26.3%) in Bojanala Platinum compared to South Africa (29.2%). Demand for
expenditure on schooling as percentage of total budget within Bojanala Platinum
District Municipality will therefore be lower than that of South Africa.
OVERALL ECONOMIC OUTLOOK OF THE DISTRICT
The economic state of Bojanala Platinum District Municipality is put in perspective by
comparing it on a spatial level with its neighbouring district municipalities, North-West
Province and South Africa. The section will also allude to the economic composition and
contribution of the regions within Bojanala Platinum District Municipality.
The Bojanala Platinum District Municipality does not function in isolation from North-West,
South Africa and the world and now, more than ever, it is crucial to have reliable
information on its economy for effective planning. Information is needed that will empower
the municipality to plan and implement policies that will encourage the social development
and economic growth of the people and industries in the municipality respectively.

Page 30 of 218
Gross Domestic Product by Region (GDP-R)
The Gross Domestic Product (GDP), an important indicator of economic performance, is
used to compare economies and economic states.
Definition: Gross Domestic Product by Region (GDP-R) represents the value of all goods
and services produced within a region, over a period of one year, plus taxes
and minus subsidies.
GDP-R can be measured using either current or constant prices, where the current prices
measures the economy in actual Rand, and constant prices measures the economy by
removing the effect of inflation, and therefore captures the real growth in volumes, as if
prices were fixed in a given base year.
TABLE 6. GROSS DOMESTIC PRODUCT (GDP) - BOJANALA PLATINUM, NORTH-
WEST AND NATIONAL TOTAL, 2006-2016 [R BILLIONS, CURRENT PRICES]
Bojanala
Platinum North-West
National
Total
Bojanala
Platinum as
% of
province
Bojanala
Platinum as
% of
national
2006 51.9 105.0 1,839.4 49.4% 2.8%
2007 60.8 120.7 2,109.5 50.4% 2.9%
2008 72.0 138.9 2,369.1 51.9% 3.0%
2009 77.5 147.9 2,507.7 52.4% 3.1%
2010 87.6 164.5 2,748.0 53.2% 3.2%
2011 98.4 185.8 3,023.7 52.9% 3.3%
2012 97.4 191.0 3,253.9 51.0% 3.0%
2013 117.6 222.2 3,539.8 52.9% 3.3%
2014 119.4 227.3 3,807.7 52.5% 3.1%
2015 127.3 243.2 4,049.8 52.4% 3.1%
2016 137.5 263.7 4,345.8 52.1% 3.2%
Source: IHS Markit Regional eXplorer version 1277
With a GDP of R 137 billion in 2016 (up from R 51.9 billion in 2006), the Bojanala Platinum
District Municipality contributed 52.14% to the North-West Province GDP of R 264 billion

Page 31 of 218
in 2016 increasing in the share of the North-West from 49.43% in 2006. The Bojanala
Platinum District Municipality contributes 3.16% to the GDP of South Africa which had a
total GDP of R 4.35 trillion in 2016 (as measured in nominal or current prices).It's
contribution to the national economy stayed similar in importance from 2006 when it
contributed 2.82% to South Africa, but it is lower than the peak of 3.32% in 2013.
TABLE 7. GROSS DOMESTIC PRODUCT (GDP) - BOJANALA PLATINUM, NORTH-
WEST AND NATIONAL TOTAL, 2006-2016 [ANNUAL PERCENTAGE
CHANGE, CONSTANT 2010 PRICES]
Bojanala
Platinum North-West National Total
2006 1.9% 4.6% 5.3%
2007 4.9% 4.4% 5.4%
2008 0.6% 2.2% 3.2%
2009 0.3% -2.3% -1.5%
2010 7.0% 3.9% 3.0%
2011 2.3% 3.0% 3.3%
2012 -1.5% -1.2% 2.2%
2013 4.0% 3.2% 2.5%
2014 -5.6% -3.5% 1.7%
2015 9.7% 5.1% 1.3%
2016 -3.5% -2.1% 0.3%
Average Annual
growth
2006-2016+
1.72% 1.21% 2.12%
Source: IHS Markit Regional eXplorer version 1277
In 2016, the Bojanala Platinum District Municipality achieved an annual growth rate of -
3.49% which is a significant lower GDP growth than the North-West Province's -2.10%,
and is lower than that of South Africa, where the 2016 GDP growth rate was 0.28%.
Contrary to the short-term growth rate of 2016, the longer-term average growth rate for

Page 32 of 218
Bojanala Platinum (1.72%) is slightly lower than that of South Africa (2.12%). The
economic growth in Bojanala Platinum peaked in 2015 at 9.74%.
CHART 4. GROSS DOMESTIC PRODUCT (GDP) - BOJANALA PLATINUM
DISTRICT MUNICIPALITY AND THE REST OF NORTH-WEST, 2016
[PERCENTAGE]
The Bojanala Platinum District Municipality had a total GDP of R 137 billion and in terms
of total contribution towards North-West Province the Bojanala Platinum District
Municipality ranked highest relative to all the regional economies to total North-West
Province GDP. This ranking in terms of size compared to other regions of Bojanala
Platinum remained the same since 2006. In terms of its share, it was in 2016 (52.1%)
significantly larger compared to what it was in 2006 (49.4%). For the period 2006 to 2016,
the average annual growth rate of 1.7% of Bojanala Platinum was the third relative to its
peers in terms of growth in constant 2010 prices.
Bojanala Platinum
Ngaka Modiri Molema
Dr Ruth Segomotsi Mompati
Dr Kenneth Kaunda
Gross Domestic Product (GDP) North-West Province, 2016
Source: IHS Markit Regional eXplorer version 1277
Page 33 of 218
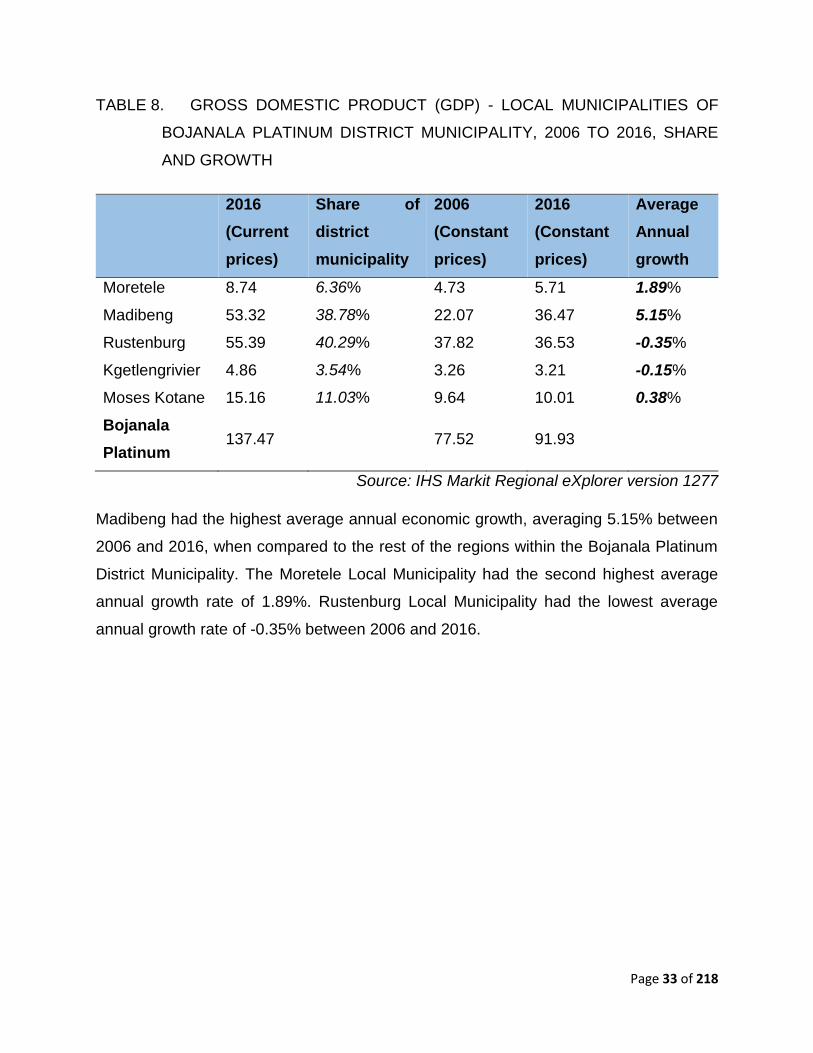
TABLE 8. GROSS DOMESTIC PRODUCT (GDP) - LOCAL MUNICIPALITIES OF
BOJANALA PLATINUM DISTRICT MUNICIPALITY, 2006 TO 2016, SHARE
AND GROWTH
2016
(Current
prices)
Share of
district
municipality
2006
(Constant
prices)
2016
(Constant
prices)
Average
Annual
growth
Moretele 8.74 6.36% 4.73 5.71 1.89%
Madibeng 53.32 38.78% 22.07 36.47 5.15%
Rustenburg 55.39 40.29% 37.82 36.53 -0.35%
Kgetlengrivier 4.86 3.54% 3.26 3.21 -0.15%
Moses Kotane 15.16 11.03% 9.64 10.01 0.38%
Bojanala
Platinum 137.47 77.52 91.93
Source: IHS Markit Regional eXplorer version 1277
Madibeng had the highest average annual economic growth, averaging 5.15% between
2006 and 2016, when compared to the rest of the regions within the Bojanala Platinum
District Municipality. The Moretele Local Municipality had the second highest average
annual growth rate of 1.89%. Rustenburg Local Municipality had the lowest average
annual growth rate of -0.35% between 2006 and 2016.

Page 34 of 218
CHART 5. GDP CONTRIBUTION - LOCAL MUNICIPALITIES OF BOJANALA
PLATINUM DISTRICT MUNICIPALITY, 2016 [CURRENT PRICES,
PERCENTAGE]
The greatest contributor to the Bojanala Platinum District Municipality economy is the
Rustenburg Local Municipality with a share of 40.29% or R 55.4 billion, increasing from
R 24.5 billion in 2006. The economy with the lowest contribution is the Kgetlengrivier
Local Municipality with R 4.86 billion growing from R 2.11 billion in 2006.
Economic Growth Forecast
It is expected that Bojanala Platinum District Municipality will grow at an average annual
rate of 1.76% from 2016 to 2021. The average annual growth rate of North-West Province
and South Africa is expected to grow at 1.41% and 1.32% respectively.
Moretele
Madibeng
Rustenburg
Kgetlengrivier
Moses Kotane
Gross Domestic Product (GDP) Bojanala Platinum District Municipality, 2016
Source: IHS Markit Regional eXplorer version 1277
Page 35 of 218
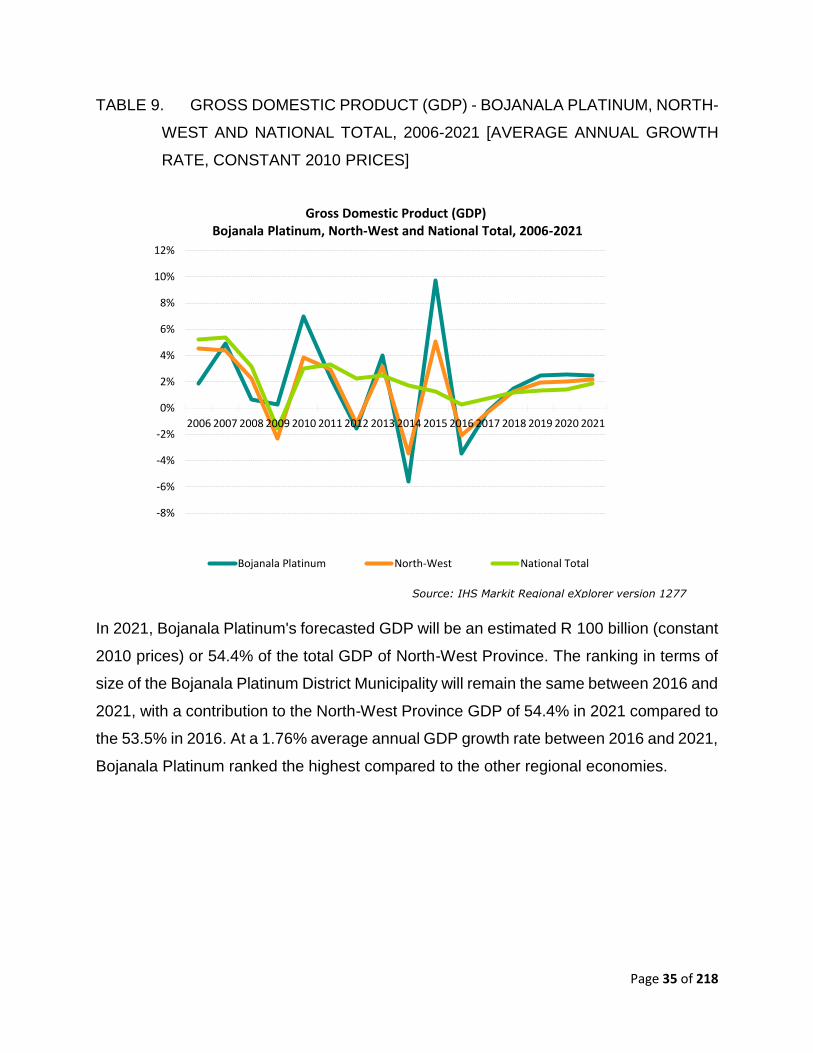
TABLE 9. GROSS DOMESTIC PRODUCT (GDP) - BOJANALA PLATINUM, NORTH-
WEST AND NATIONAL TOTAL, 2006-2021 [AVERAGE ANNUAL GROWTH
RATE, CONSTANT 2010 PRICES]
In 2021, Bojanala Platinum's forecasted GDP will be an estimated R 100 billion (constant
2010 prices) or 54.4% of the total GDP of North-West Province. The ranking in terms of
size of the Bojanala Platinum District Municipality will remain the same between 2016 and
2021, with a contribution to the North-West Province GDP of 54.4% in 2021 compared to
the 53.5% in 2016. At a 1.76% average annual GDP growth rate between 2016 and 2021,
Bojanala Platinum ranked the highest compared to the other regional economies.
-8%
-6%
-4%
-2%
0%
2%
4%
6%
8%
10%
12%
2006 2007 2008 2009 2010 2011 2012 2013 2014 2015 2016 2017 2018 2019 2020 2021
Gross Domestic Product (GDP) Bojanala Platinum, North-West and National Total, 2006-2021
Bojanala Platinum North-West National Total
Source: IHS Markit Regional eXplorer version 1277

Page 36 of 218
TABLE 10. GROSS DOMESTIC PRODUCT (GDP) - LOCAL MUNICIPALITIES OF
BOJANALA PLATINUM DISTRICT MUNICIPALITY, 2016 TO 2021, SHARE
AND GROWTH
2021
(Current
prices)
Share of
district
municipality
2016
(Constant
prices)
2021
(Constant
prices)
Average
Annual
growth
Moretele 9.20 9.18% 5.71 6.00 1.00%
Madibeng 57.60 57.43% 36.47 39.62 1.67%
Rustenburg 60.82 60.63% 36.53 40.34 2.01%
Kgetlengrivier 5.31 5.30% 3.21 3.54 1.95%
Moses Kotane 16.38 16.33% 10.01 10.80 1.53%
Bojanala
Platinum 149.31 91.93 100.30
Source: IHS Markit Regional eXplorer version 1277
When looking at the regions within the Bojanala Platinum District Municipality it is
expected that from 2016 to 2021 the Rustenburg Local Municipality will achieve the
highest average annual growth rate of 2.01%. The region that is expected to achieve the
second highest average annual growth rate is that of Kgetlengrivier Local Municipality,
averaging 1.95% between 2016 and 2021. On the other hand the region that performed
the poorest relative to the other regions within Bojanala Platinum District Municipality was
the Moretele Local Municipality with an average annual growth rate of 1.00%.
Gross Value Added by Region (GVA-R)
The Bojanala Platinum District Municipality's economy is made up of various industries.
The GVA-R variable provides a sector breakdown, where each sector is measured in
terms of its value added produced in the local economy.
Definition: Gross Value Added (GVA) is a measure of output (total production) of a region
in terms of the value that was created within that region. GVA can be broken
down into various production sectors.

Page 37 of 218
The summary table below puts the Gross Value Added (GVA) of all the regions in
perspective to that of the Bojanala Platinum District Municipality.
TABLE 11. GROSS VALUE ADDED (GVA) BY BROAD ECONOMIC SECTOR -
BOJANALA PLATINUM DISTRICT MUNICIPALITY, 2016 [R BILLIONS,
CURRENT PRICES]
Bojanala
Platinum North-West
National
Total
Bojanala
Platinum
as % of
province
Bojanala
Platinum
as % of
national
Agriculture 1.3 6.2 94.4 21.2% 1.40%
Mining 63.5 77.3 306.2 82.2% 20.75%
Manufacturing 7.1 12.6 517.4 56.0% 1.37%
Electricity 3.1 8.0 144.1 39.1% 2.17%
Construction 2.5 6.3 154.3 38.8% 1.59%
Trade 11.9 28.0 589.7 42.5% 2.02%
Transport 6.2 15.2 389.2 40.5% 1.58%
Finance 12.9 30.6 781.7 42.2% 1.65%
Community
services 15.8 49.2 901.1 32.1% 1.75%
Total
Industries 124.3 233.5 3,878.2 53.2% 3.21%
Source: IHS Markit Regional eXplorer version 1277
In 2016, the mining sector is the largest within Bojanala Platinum District Municipality
accounting for R 63.5 billion or 51.1% of the total GVA in the district municipality's
economy. The sector that contributes the second most to the GVA of the Bojanala
Platinum District Municipality is the community services sector at 12.7%, followed by the
finance sector with 10.4%. The sector that contributes the least to the economy of
Bojanala Platinum District Municipality is the agriculture sector with a contribution of
R 1.32 billion or 1.06% of the total GVA.

Page 38 of 218
CHART 6. GROSS VALUE ADDED (GVA) BY BROAD ECONOMIC SECTOR -
BOJANALA PLATINUM DISTRICT MUNICIPALITY, 2016 [PERCENTAGE
COMPOSITION]
The community sector, which includes the government services, is generally a large
contributor towards GVA in smaller and more rural local municipalities. When looking at
the regions within the district municipality, the Local Municipality of Madibeng made the
largest contribution to the community services sector at 53.35% of the district municipality.
As a whole, the Local Municipality of Madibeng contributed R 46.5 billion or 37.41% to
the GVA of the Bojanala Platinum District Municipality. The region within Bojanala
Platinum District Municipality that contributes the most to the GVA of the district
municipality was the Local Municipality of Madibeng with a total of R 46.5 billion or
37.41%.
Agriculture
Mining
Manufacturing
Electricity
Construction
Trade
Transport
Finance
Community services
Gross Value Added (GVA) by broad economic sector Bojanala Platinum District Municipality, 2016
Source: IHS Markit Regional eXplorer version 1277

Page 39 of 218
CHART 7. GROSS VALUE ADDED (GVA) BY BROAD ECONOMIC SECTOR -
LOCAL MUNICIPALITIES OF BOJANALA PLATINUM DISTRICT
MUNICIPALITY, 2016 [PERCENTAGE COMPOSITION]
Historical Economic Growth
For the period 2016 and 2006, the GVA in the construction sector had the highest average
annual growth rate in Bojanala Platinum at 4.94%. The industry with the second highest
average annual growth rate is the community services sector averaging at 4.39% per
year. The electricity sector had an average annual growth rate of 0.75%, while the mining
sector had the lowest average annual growth of 0.58%. Overall a negative growth existed
for all the industries in 2016 with an annual growth rate of -3.37% since 2015.
0%
10%
20%
30%
40%
50%
60%
70%
80%
90%
100%
Moretele Madibeng Rustenburg Kgetlengrivier Moses Kotane
Gross Value Added (GVA) by broad economic sector Bojanala Platinum District Municipality, 2016
Community services
Finance
Transport
Trade
Construction
Electricity
Manufacturing
Mining
Agriculture
Source: IHS Markit Regional eXplorer version 1277
Page 40 of 218
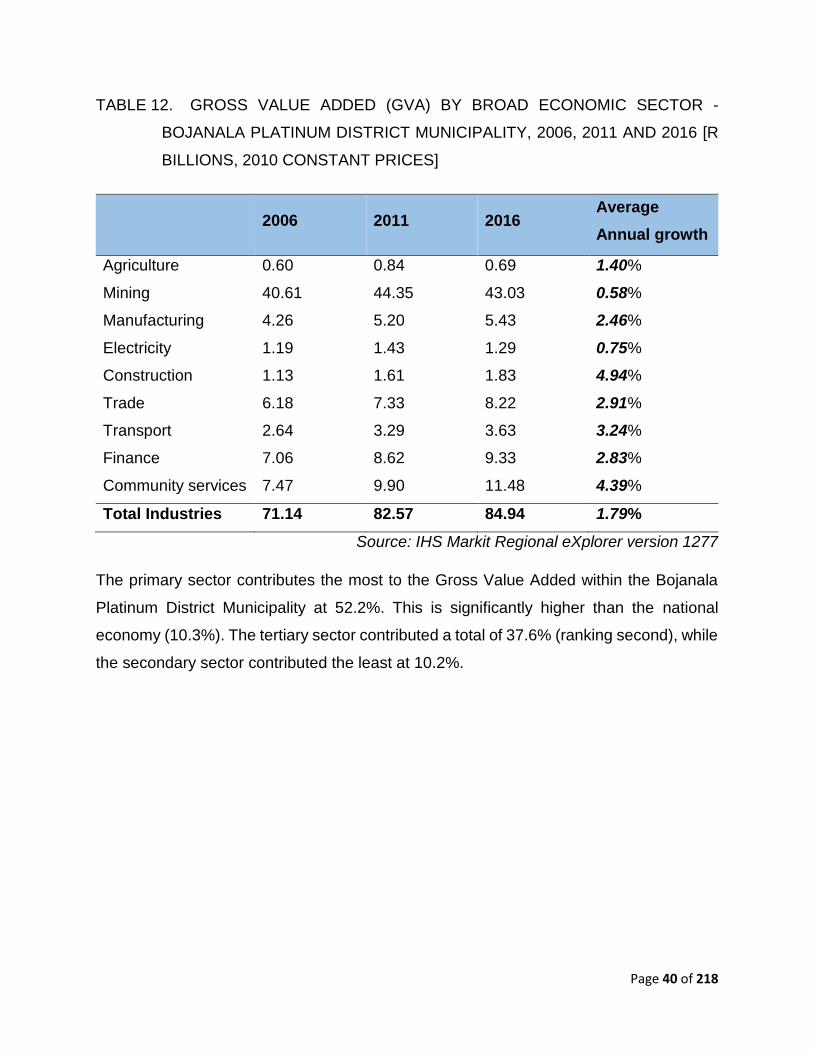
TABLE 12. GROSS VALUE ADDED (GVA) BY BROAD ECONOMIC SECTOR -
BOJANALA PLATINUM DISTRICT MUNICIPALITY, 2006, 2011 AND 2016 [R
BILLIONS, 2010 CONSTANT PRICES]
2006 2011 2016 Average
Annual growth
Agriculture 0.60 0.84 0.69 1.40%
Mining 40.61 44.35 43.03 0.58%
Manufacturing 4.26 5.20 5.43 2.46%
Electricity 1.19 1.43 1.29 0.75%
Construction 1.13 1.61 1.83 4.94%
Trade 6.18 7.33 8.22 2.91%
Transport 2.64 3.29 3.63 3.24%
Finance 7.06 8.62 9.33 2.83%
Community services 7.47 9.90 11.48 4.39%
Total Industries 71.14 82.57 84.94 1.79%
Source: IHS Markit Regional eXplorer version 1277
The primary sector contributes the most to the Gross Value Added within the Bojanala
Platinum District Municipality at 52.2%. This is significantly higher than the national
economy (10.3%). The tertiary sector contributed a total of 37.6% (ranking second), while
the secondary sector contributed the least at 10.2%.

Page 41 of 218
CHART 8. GROSS VALUE ADDED (GVA) BY AGGREGATE ECONOMIC SECTOR -
BOJANALA PLATINUM DISTRICT MUNICIPALITY, 2016 [PERCENTAGE]
The following is a breakdown of the Gross Value Added (GVA) by aggregated sector:
Primary Sector
The primary sector consists of two broad economic sectors namely the mining and the
agricultural sector. The following chart represents the average growth rate in the GVA for
both of these sectors in Bojanala Platinum District Municipality from 2006 to 2016.
Primary sector
Secondary sectorTertiary sector
Gross Value Added (GVA) by aggregate sector Bojanala Platinum District Municipality, 2016
Source: IHS Markit Regional eXplorer version 1277

Page 42 of 218
CHART 9. GROSS VALUE ADDED (GVA) BY PRIMARY SECTOR - BOJANALA
PLATINUM, 2006-2016 [ANNUAL PERCENTAGE CHANGE]
Between 2006 and 2016, the agriculture sector experienced the highest positive growth
in 2008 with an average growth rate of 21.0%. The mining sector reached its highest point
of growth of 20.6% in 2015. The agricultural sector experienced the lowest growth for the
period during 2006 at -18.4%, while the mining sector reaching its lowest point of growth
in 2014 at -12.6%. Both the agriculture and mining sectors are generally characterised by
volatility in growth over the period.
Secondary Sector
The secondary sector consists of three broad economic sectors namely the
manufacturing, electricity and the construction sector. The following chart represents the
average growth rates in the GVA for these sectors in Bojanala Platinum District
Municipality from 2006 to 2016.
-25%
-20%
-15%
-10%
-5%
0%
5%
10%
15%
20%
25%
2006 2007 2008 2009 2010 2011 2012 2013 2014 2015 2016
Gross value added (GVA) by primary sector Bojanala Platinum, 2006-2016
Agriculture Mining
Source: IHS Markit Regional eXplorer version 1277

Page 43 of 218
CHART 10. GROSS VALUE ADDED (GVA) BY SECONDARY SECTOR - BOJANALA
PLATINUM, 2006-2016 [ANNUAL PERCENTAGE CHANGE]
Between 2006 and 2016, the manufacturing sector experienced the highest positive
growth in 2007 with a growth rate of 10.7%. It is evident for the construction sector that
the highest positive growth rate also existed in 2007 and it experienced a growth rate of
21.5% which is higher than that of the manufacturing sector. The manufacturing sector
experienced its lowest growth in 2010 of -2.4%, while construction sector reached its
lowest point of growth in 2010 as with -2.0% growth rate. The electricity sector
experienced the highest growth in 2007 at 6.4%, while it recorded the lowest growth of -
3.5% in 2016.
Tertiary Sector
The tertiary sector consists of four broad economic sectors namely the trade, transport,
finance and the community services sector. The following chart represents the average
-5%
0%
5%
10%
15%
20%
25%
2006 2007 2008 2009 2010 2011 2012 2013 2014 2015 2016
Gross value added (GVA) by secondary sector Bojanala Platinum, 2006-2016
Manufacturing Electricity Construction
Source: IHS Markit Regional eXplorer version 1277

Page 44 of 218
growth rates in the GVA for these sectors in Bojanala Platinum District Municipality from
2006 to 2016.
Household Infrastructure
Drawing on the household infrastructure data of a region is of essential value in economic
planning and social development. Assessing household infrastructure involves the
measurement of four indicators:
Access to dwelling units
Access to proper sanitation
Access to running water
Access to refuse removal
Access to electricity
A household is considered "serviced" if it has access to all four of these basic services. If
not, the household is considered to be part of the backlog. The way access to a given
service is defined (and how to accurately measure that specific Definition over time) gives
rise to some distinct problems. IHS has therefore developed a unique model to capture
the number of households and their level of access to the four basic services.
A household is defined as a group of persons who live together and provide themselves
jointly with food and/or other essentials for living, or a single person who lives alone.
The next few sections offer an overview of the household infrastructure of the Bojanala
Platinum District Municipality between 2016 and 2006.
Household by Dwelling Type
Using the StatsSA definition of a household and a dwelling unit, households can be
categorised according to type of dwelling. The categories are:
Very formal dwellings - structures built according to approved plans, e.g. houses
on a separate stand, flats or apartments, townhouses, rooms in backyards that
also have running water and flush toilets within the dwelling. .

Page 45 of 218
Formal dwellings - structures built according to approved plans, i.e. house on a
separate stand, flat or apartment, townhouse, room in backyard, rooms or flatlet
elsewhere etc., but without running water or without a flush toilet within the
dwelling.
Informal dwellings - shacks or shanties in informal settlements, serviced stands,
or proclaimed townships, as well as shacks in the backyards of other dwelling
types.
Traditional dwellings - structures made of clay, mud, reeds, or other locally
available material.
Other dwelling units - tents, ships, caravans, etc.
CHART 11. HOUSEHOLDS BY DWELLING UNIT TYPE - BOJANALA PLATINUM,
NORTH-WEST AND NATIONAL TOTAL, 2016 [PERCENTAGE]
Bojanala Platinum District Municipality had a total number of 106 000 (19.24% of total
households) very formal dwelling units, a total of 275 000 (50.05% of total households)
0%
10%
20%
30%
40%
50%
60%
70%
80%
90%
100%
Bojanala Platinum North-West National Total
Households by dwelling unit type Bojanala Platinum, North-West and National Total, 2016
Other dwelling type
Traditional
Informal
Formal
Very Formal
Source: IHS Markit Regional eXplorer version 1277
Page 46 of 218
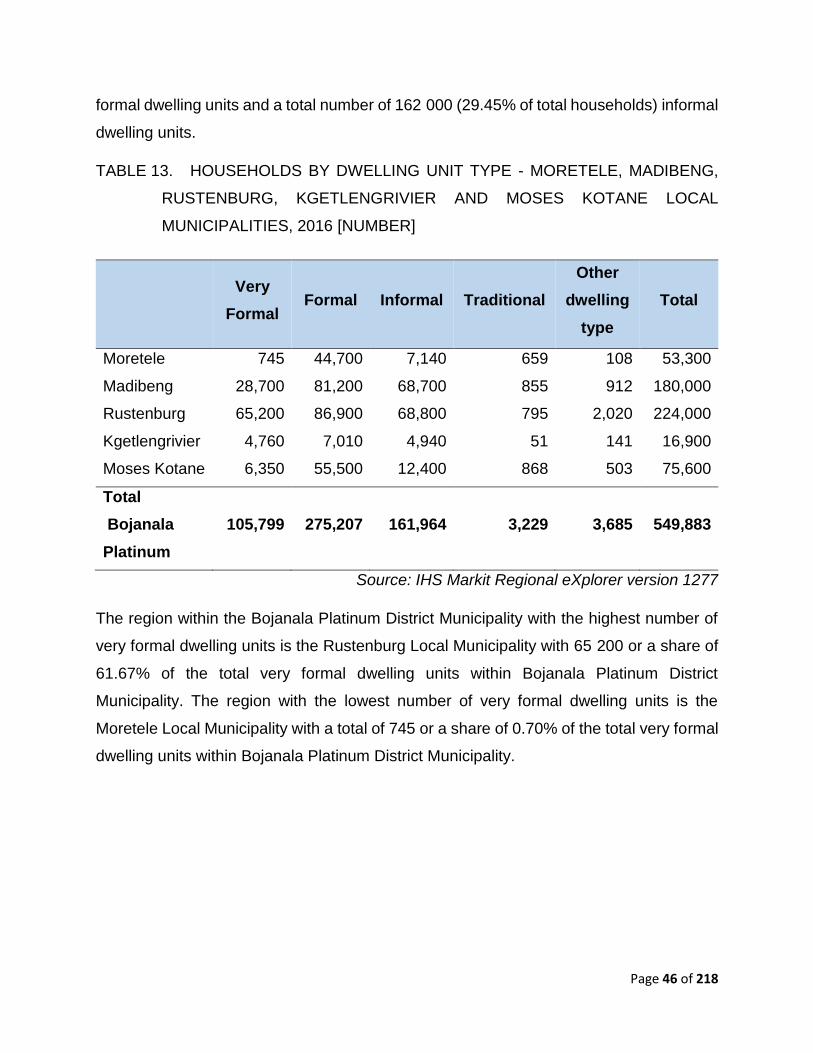
formal dwelling units and a total number of 162 000 (29.45% of total households) informal
dwelling units.
TABLE 13. HOUSEHOLDS BY DWELLING UNIT TYPE - MORETELE, MADIBENG,
RUSTENBURG, KGETLENGRIVIER AND MOSES KOTANE LOCAL
MUNICIPALITIES, 2016 [NUMBER]
Very
Formal Formal Informal Traditional
Other
dwelling
type
Total
Moretele 745 44,700 7,140 659 108 53,300
Madibeng 28,700 81,200 68,700 855 912 180,000
Rustenburg 65,200 86,900 68,800 795 2,020 224,000
Kgetlengrivier 4,760 7,010 4,940 51 141 16,900
Moses Kotane 6,350 55,500 12,400 868 503 75,600
Total
Bojanala
Platinum
105,799 275,207 161,964 3,229 3,685 549,883
Source: IHS Markit Regional eXplorer version 1277
The region within the Bojanala Platinum District Municipality with the highest number of
very formal dwelling units is the Rustenburg Local Municipality with 65 200 or a share of
61.67% of the total very formal dwelling units within Bojanala Platinum District
Municipality. The region with the lowest number of very formal dwelling units is the
Moretele Local Municipality with a total of 745 or a share of 0.70% of the total very formal
dwelling units within Bojanala Platinum District Municipality.
Page 47 of 218
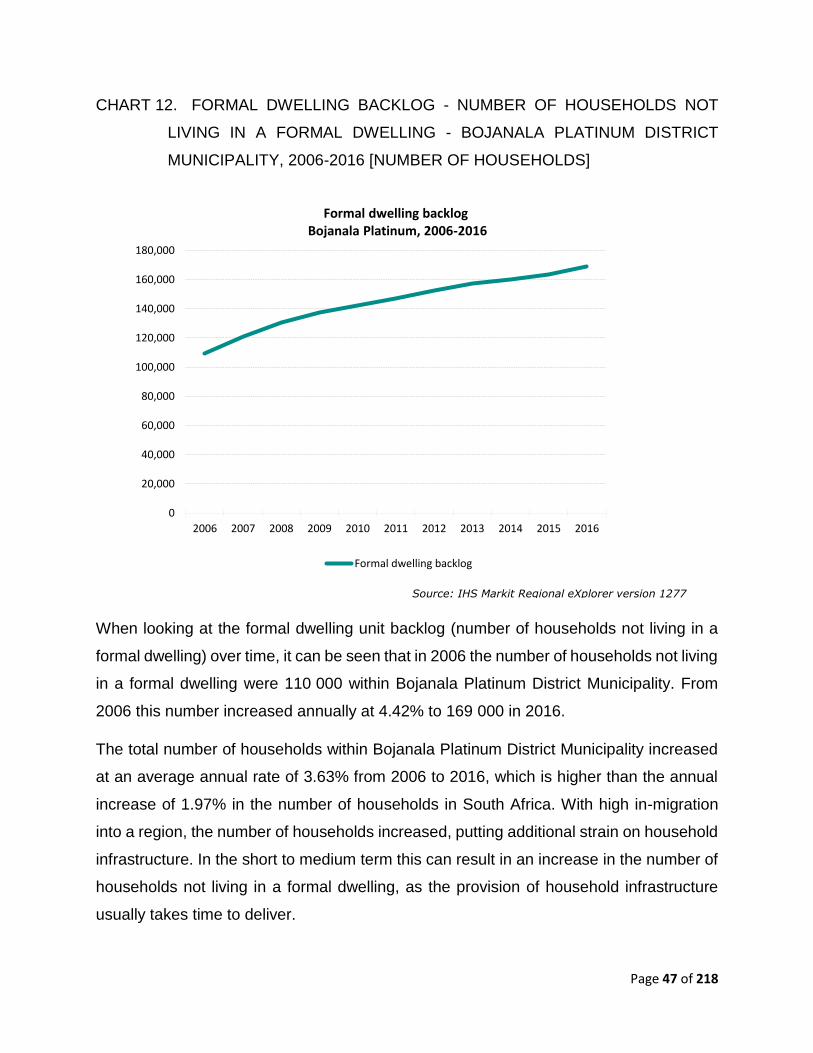
CHART 12. FORMAL DWELLING BACKLOG - NUMBER OF HOUSEHOLDS NOT
LIVING IN A FORMAL DWELLING - BOJANALA PLATINUM DISTRICT
MUNICIPALITY, 2006-2016 [NUMBER OF HOUSEHOLDS]
When looking at the formal dwelling unit backlog (number of households not living in a
formal dwelling) over time, it can be seen that in 2006 the number of households not living
in a formal dwelling were 110 000 within Bojanala Platinum District Municipality. From
2006 this number increased annually at 4.42% to 169 000 in 2016.
The total number of households within Bojanala Platinum District Municipality increased
at an average annual rate of 3.63% from 2006 to 2016, which is higher than the annual
increase of 1.97% in the number of households in South Africa. With high in-migration
into a region, the number of households increased, putting additional strain on household
infrastructure. In the short to medium term this can result in an increase in the number of
households not living in a formal dwelling, as the provision of household infrastructure
usually takes time to deliver.
0
20,000
40,000
60,000
80,000
100,000
120,000
140,000
160,000
180,000
2006 2007 2008 2009 2010 2011 2012 2013 2014 2015 2016
Formal dwelling backlog Bojanala Platinum, 2006-2016
Formal dwelling backlog
Source: IHS Markit Regional eXplorer version 1277
Page 48 of 218
Household by Type of Sanitation
Sanitation can be divided into specific types of sanitation to which a household has
access. We use the following categories:
No toilet - No access to any of the toilet systems explained below.
Bucket system - A top structure with a seat over a bucket. The bucket is
periodically removed and the contents disposed of. (Note: this system is widely
used but poses health risks to the collectors. Most authorities are actively
attempting to discontinue the use of these buckets in their local regions).
Pit toilet - A top structure over a pit.
Ventilation improved pit - A pit toilet but with a fly screen and vented by a pipe.
Depending on soil conditions, the pit may be lined.
Flush toilet - Waste is flushed into an enclosed tank, thus preventing the waste to
flow into the surrounding environment. The tanks need to be emptied or the
contents pumped elsewhere.

Page 49 of 218
CHART 13. HOUSEHOLDS BY TYPE OF SANITATION - BOJANALA PLATINUM,
NORTH-WEST AND NATIONAL TOTAL, 2016 [PERCENTAGE]
Bojanala Platinum District Municipality had a total number of 225 000 flush toilets (40.95%
of total households), 93 900 Ventilation Improved Pit (VIP) (17.08% of total households)
and 206 000 (37.47%) of total households pit toilets.
0%
10%
20%
30%
40%
50%
60%
70%
80%
90%
100%
Bojanala Platinum North-West National Total
Households by type of Toilet Bojanala Platinum, 2006-2016
No toilet
Bucket system
Pit toilet
Ventilation ImprovedPit (VIP)
Flush toilet
Source: IHS Markit Regional eXplorer version 1277

Page 50 of 218
TABLE 14. HOUSEHOLDS BY TYPE OF SANITATION - MORETELE, MADIBENG,
RUSTENBURG, KGETLENGRIVIER AND MOSES KOTANE LOCAL
MUNICIPALITIES, 2016 [NUMBER]
Flush
toilet
Ventilation
Improved
Pit (VIP)
Pit toilet Bucket
system
No
toilet Total
Moretele 2,980 21,900 27,200 482 774 53,300
Madibeng 64,700 21,100 85,100 1,640 7,760 180,000
Rustenburg 133,000 27,800 53,600 1,310 7,870 224,000
Kgetlengrivier 12,900 878 1,210 289 1,650 16,900
Moses Kotane 11,600 22,200 38,900 572 2,380 75,600
Total
Bojanala
Platinum
225,202 93,925 206,025 4,291 20,442 549,883
Source: IHS Markit Regional eXplorer version 1277
The region within Bojanala Platinum with the highest number of flush toilets is Rustenburg
Local Municipality with 133 000 or a share of 59.08% of the flush toilets within Bojanala
Platinum. The region with the lowest number of flush toilets is Moretele Local Municipality
with a total of 2 980 or a share of 1.32% of the total flush toilets within Bojanala Platinum
District Municipality.

Page 51 of 218
CHART 14. SANITATION BACKLOG - BOJANALA PLATINUM DISTRICT
MUNICIPALITY, 2006-2016 [NUMBER OF HOUSEHOLDS WITHOUT
HYGIENIC TOILETS]
When looking at the sanitation backlog (number of households without hygienic toilets)
over time, it can be seen that in 2006 the number of Households without any hygienic
toilets in Bojanala Platinum District Municipality was 220 000, this increased annually at
a rate of 0.48% to 231 000 in 2016.
The total number of households within Bojanala Platinum District Municipality increased
at an average annual rate of 3.63% from 2006 to 2016, which is higher than the annual
increase of 1.97% in the number of households in South Africa. With high in-migration
into a region, the number of households increases, putting additional strain on household
infrastructure. In the short to medium term this can result in an increase in the number of
households not living in a formal dwelling, as the provision of household infrastructure
usually takes time to deliver.
212,000
214,000
216,000
218,000
220,000
222,000
224,000
226,000
228,000
230,000
232,000
2006 2007 2008 2009 2010 2011 2012 2013 2014 2015 2016
Sanitation backlog Bojanala Platinum, 2006-2016
Source: IHS Markit Regional eXplorer version 1277

Page 52 of 218
Households by Access to water
A household is categorised according to its main access to water, as follows:
Regional/local water scheme, Borehole and spring, Water tank, Dam/pool/stagnant
water, River/stream and other main access to water methods. No formal piped water
includes households that obtain water via water carriers and tankers, rain water,
boreholes, dams, rivers and springs.
CHART 15. HOUSEHOLDS BY TYPE OF WATER ACCESS - BOJANALA PLATINUM,
NORTH-WEST AND NATIONAL TOTAL, 2016 [PERCENTAGE]
Bojanala Platinum District Municipality had a total number of 131 000 (or 23.74%)
households with piped water inside the dwelling, a total of 244 000 (44.28%) households
had piped water inside the yard and a total number of 71 400 (12.99%) households had
no formal piped water.
0%
10%
20%
30%
40%
50%
60%
70%
80%
90%
100%
Bojanala Platinum North-West National Total
Households by level of access to Water Bojanala Platinum, 2006-2016
No formal piped water
Communal piped water:more than 200m fromdwelling (Below RDP)
Communal piped water:less than 200m fromdwelling (At RDP-level)
Piped water in yard
Piped water insidedwelling
Source: IHS Markit Regional eXplorer version 1277

Page 53 of 218
TABLE 15. HOUSEHOLDS BY TYPE OF WATER ACCESS - BOJANALA PLATINUM
DISTRICT MUNICIPALITY, 2016 [NUMBER]
Piped
water
inside
dwelling
Piped
water in
yard
Communal
piped
water: less
than 200m
from
dwelling
(At
RDP-level)
Communal
piped
water:
more than
200m from
dwelling
(Below
RDP)
No
formal
piped
water
Total
Moretele 6,170 21,600 7,660 10,200 7,620 53,300
Madibeng 37,000 77,600 14,800 16,100 34,900 180,000
Rustenburg 70,800 112,000 11,300 10,000 20,000 224,000
Kgetlengrivier 5,720 6,810 935 1,740 1,690 16,900
Moses
Kotane 10,900 25,700 20,600 11,100 7,280 75,600
Total
Bojanala
Platinum
130,558 243,464 55,274 49,139 71,448 549,883
Source: IHS Markit Regional eXplorer version 1277
The regions within Bojanala Platinum District Municipality with the highest number of
households with piped water inside the dwelling is Rustenburg Local Municipality with
70 800 or a share of 54.20% of the households with piped water inside the dwelling within
Bojanala Platinum District Municipality. The region with the lowest number of households
with piped water inside the dwelling is Kgetlengrivier Local Municipality with a total of
5 720 or a share of 4.38% of the total households with piped water inside the dwelling
within Bojanala Platinum District Municipality.

Page 54 of 218
CHART 16. WATER BACKLOG - BOJANALA PLATINUM DISTRICT MUNICIPALITY,
2006-2016 [NUMBER OF HOUSEHOLDS BELOW RDP-LEVEL]
When looking at the water backlog (number of households below RDP-level) over time, it
can be seen that in 2006 the number of households below the RDP-level were 97 500
within Bojanala Platinum District Municipality, this increased annually at 2.15% per annum
to 121 000 in 2016.
The total number of households within Bojanala Platinum District Municipality increased
at an average annual rate of 3.63% from 2006 to 2016, which is higher than the annual
increase of 1.97% in the number of households in South Africa. With high in-migration
into a region, the number of households increases, putting additional strain on household
infrastructure. In the short to medium term this can result in an increase in the number of
households not living in a formal dwelling, as the provision of household infrastructure
usually takes time to deliver.
0
20,000
40,000
60,000
80,000
100,000
120,000
140,000
2006 2007 2008 2009 2010 2011 2012 2013 2014 2015 2016
Water backlog Bojanala Platinum, 2006-2016
Water backlog - number of households below RDP-level
Source: IHS Markit Regional eXplorer version 1277

Page 55 of 218
Households by Type of Electricity
Households are distributed into 3 electricity usage categories: Households using
electricity for cooking, Households using electricity for heating, households using
electricity for lighting. Household using solar power are included as part of households
with an electrical connection. This time series categorises households in a region
according to their access to electricity (electrical connection).
CHART 17. HOUSEHOLDS BY TYPE OF ELECTRICAL CONNECTION - BOJANALA
PLATINUM, NORTH-WEST AND NATIONAL TOTAL, 2016 [PERCENTAGE]
Bojanala Platinum District Municipality had a total number of 27 400 (4.99%) households
with electricity for lighting only, a total of 452 000 (82.25%) households had electricity for
lighting and other purposes and a total number of 70 200 (12.76%) households did not
use electricity.
0%
10%
20%
30%
40%
50%
60%
70%
80%
90%
100%
Bojanala Platinum North-West National Total
Households by electricity usage Bojanala Platinum, 2006-2016
Not using electricity
Electricity for lightingand other purposes
Electricity for lightingonly
Source: IHS Markit Regional eXplorer version 1277
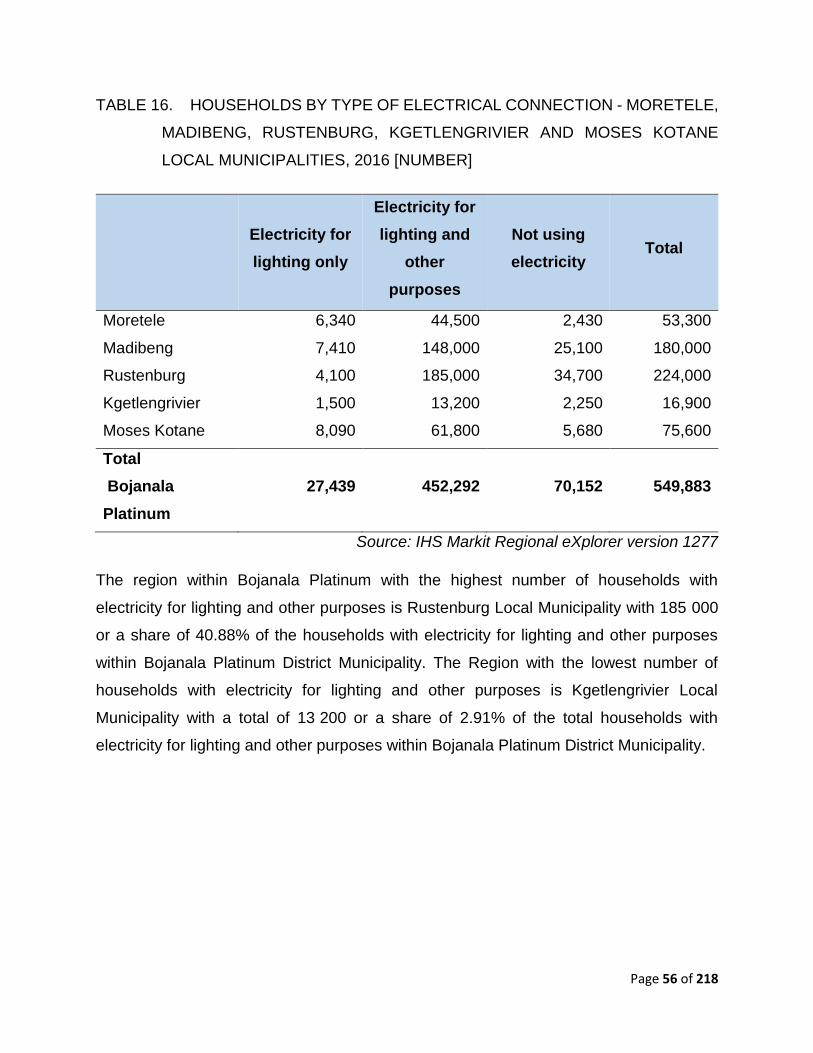
Page 56 of 218
TABLE 16. HOUSEHOLDS BY TYPE OF ELECTRICAL CONNECTION - MORETELE,
MADIBENG, RUSTENBURG, KGETLENGRIVIER AND MOSES KOTANE
LOCAL MUNICIPALITIES, 2016 [NUMBER]
Electricity for
lighting only
Electricity for
lighting and
other
purposes
Not using
electricity Total
Moretele 6,340 44,500 2,430 53,300
Madibeng 7,410 148,000 25,100 180,000
Rustenburg 4,100 185,000 34,700 224,000
Kgetlengrivier 1,500 13,200 2,250 16,900
Moses Kotane 8,090 61,800 5,680 75,600
Total
Bojanala
Platinum
27,439 452,292 70,152 549,883
Source: IHS Markit Regional eXplorer version 1277
The region within Bojanala Platinum with the highest number of households with
electricity for lighting and other purposes is Rustenburg Local Municipality with 185 000
or a share of 40.88% of the households with electricity for lighting and other purposes
within Bojanala Platinum District Municipality. The Region with the lowest number of
households with electricity for lighting and other purposes is Kgetlengrivier Local
Municipality with a total of 13 200 or a share of 2.91% of the total households with
electricity for lighting and other purposes within Bojanala Platinum District Municipality.

Page 57 of 218
CHART 18. ELECTRICITY CONNECTION - BOJANALA PLATINUM DISTRICT
MUNICIPALITY, 2006-2016 [NUMBER OF HOUSEHOLDS WITH NO
ELECTRICAL CONNECTION]
When looking at the number of households with no electrical connection over time, it can
be seen that in 2006 the households without an electrical connection in Bojanala Platinum
District Municipality was 62 800, this increased annually at 1.12% per annum to 70 200
in 2016.
The total number of households within Bojanala Platinum District Municipality increased
at an average annual rate of 3.63% from 2006 to 2016, which is higher than the annual
increase of 1.97% in the number of households in South Africa. With high in-migration
into a region, the number of households increases, putting additional strain on household
infrastructure. In the short to medium term this can result in an increase in the number of
households not living in a formal dwelling, as the provision of household infrastructure
usually takes time to deliver
58,000
60,000
62,000
64,000
66,000
68,000
70,000
72,000
74,000
2006 2007 2008 2009 2010 2011 2012 2013 2014 2015 2016
Electricity connection Bojanala Platinum, 2006-2016
Number of households with no electrical connection
Source: IHS Markit Regional eXplorer version 1277

Page 58 of 218
SECTOR PLANS
As indicated the overarching plan in terms of spatial planning in both the government and
the private sector is the National Development Plan, Vision 2030. In this regard the spatial
development plans of Bojanala Platinum District Municipality and the constituent local
municipalities of Kgetleng Rivier, Madibeng, Moretele, Moses Kotane and Rustenburg will
align to the goals of the NDP with regard to spatial planning and human settlement. The
municipal SDFs will be guided by the following objectives of the NDP:
To build a strong and efficient spatial planning system, well integrated across the
spheres of government.
Upgrade all informal settlements on suitable, well located land by 2030.
Ensure that more people living closer to their places of work.
To provide better quality public transport.
To create more jobs in or close to dense, urban townships.
The NDP also want to contribute towards an inclusive rural economy which should be
characterised by job creation in agriculture and agro-processing.
The district Municipality will contribute towards the realisation of these national objectives
by coordinating and leading planning by local municipalities, sector departments and the
private sector. The provincial strategy of the RRR approach and its five concretes will
also work towards the realisation of these objectives.
District SDF
The function of the District Spatial Development Framework is primarily to integrate and
coordinate on a broader level spatial information which includes the five local
municipalities located in its area of jurisdiction. A Land Use Management System on the
other hand deals with the detail administration of land development and land use change.
It is also for this reason that the local municipalities have to compile their land use

Page 59 of 218
management schemes for their individual areas dealing with individual properties in terms
of their administration, land use rights and also the amendment of these rights for a
particular development and to meet specific requirements. It must, however, conform to
the Spatial Development Framework.
The present situation with regard to the compilation of land use schemes for the remaining
four local municipalities within the Bojanala PDM is as follows:
The Table below indicates the present situation with regard to the compilation of SDFs
and land use schemes for the local municipalities and the Bojanala PDM:
Municipality Status of SDF & LUMS Last Reviewed
Kgetlengrivier Local
Municipality
In 2016 Land Use Management
Scheme (LUMS) was developed
informed as well by a detailed Land
Audit that was conducted in 2010.
SDF was reviewed in
2012
Madibeng Local
Municipality
Madibeng stipulates the structures
responsible for the implementation of
the SDF directives & LUMS were
rationalised in 2019
SDF was reviewed in
2009
LUMS still to be
rationalised in line with
SPLUMA regulations
Moretele Local
Municipality
MLM SDF currently under review
LUMS is also under review
MLM SDF 2012
Moses Kotane Local
Municipality
Predates the SPLUMA was reviewed
in 2018
LUMS is presently being developed
MKLM SDF 2012
Rustenburg Local
Municipality
Rustenburg SDF 2010
LUMS requires alignment to the
SPLUMA regulations
Rustenburg SDF 2010
LUMS in place, albeit
predating the SPLUMA
Regulations
Page 60 of 218
Bojanala Platinum
District
BPDM SDF 2012
LUM will be developed in 2019
BPDM SDF 2012
LUM development to
commence in 2019
The District Municipality’s Land Use Scheme will be pitched at higher level, and primarily
to provide policy and guidelines which must inform the land use management systems of
local municipalities which deal with the individual properties in settlements (i.e.
proclaimed towns and villages) and farm portions.
The Bojanala Platinum District Municipality Land Use Management responsibility is to
identify broad land use zones with an indication of the most probable uses/ land uses for
individual zones such as township development areas (i.e. for residential/ business/
industrial/ open space, etc.), conservation areas, areas with high potential agricultural
land, areas for nature conservation, etc. The land use management system at district
level is very closely related and linked to the Spatial Development Framework for the
District Municipality.
The remaining towns/ settlements are rather small and disconnected; and these areas
are rural in character. No clear hierarchy of nodes can be distinguished among the
settlements/ villages in the BPDM. Accordingly, a Nodal Classification system has been
established in the previous version of the BPDM IDP.
The nodes were classified in terms of a five (5) tier hierarchy and allocated Existing and
Proposed Functions and Guidelines. The categories were as follows:
Primary node – Mixed use economic node
Secondary and emerging secondary nodes – Mixed use economic node
Local Development nodes
Rural Service Centres
Local Service Centres
Tourism node – tourism related node.

Page 61 of 218
The major structuring element within the District is the N4 / Platinum Corridor, and the
ridges, river courses, and nature reserves and Protected Areas that dot the District
landscape. The Magalies Mountain Range traverses the DM from west to east, creating
a physical barrier between the southern extents of the District and the larger northern
section. The Pilanesberg nature reserve is also a distinctive physical feature in the area;
and a major regional tourism attraction with the Sun City development on to its eastern
side. The river courses and tributaries that traverse the landscape are also strong form
giving elements.
The regional road network and railway line system traversing the BPDM provides good
accessibility to the majority of areas in the District.
Principle 1: To achieve a sustainable equilibrium between urbanisation,
conservation, and tourism, mining, and agricultural activities within the District, by way
of proper land use management and in partnership with the private sector and local
communities.
Principle 2: To define and establish a functional hierarchy of urban and rural service
centres in the District, in order to optimise the delivery of social and engineering
services and stimulate the local economy, while protecting valuable agricultural land.
Principle 3: To provide a full range of social/ community services at all identified nodal
points
Principle 4: To optimally capitalize on the strategic location of the District through
enhancing the N4 Platinum Highway and other external linkages, and to functionally
link all nodal points and major destinations in the District to one another, by way of an
extensive movement network.
Principle 5: To ensure that proper public transport infrastructure is provided along the
priority movement network and at all nodal points, serving both urban and rural
communities, and linking to major destinations and to regional routes.

Page 62 of 218
Principle 6: To establish the Magaliesberg and Pilanesberg complexes, together with
Hartbeespoort, as Tourism Anchors in the District, and to develop latent tourism
potential within the District particularly linked to mining, cultural historic heritage, and
eco/ adventure.
Principle 7: To promote irrigated and cultivated farming activities on suitable land
within the District; and to support small scale and/ or subsistence farming throughout
the remainder of the area.
Principle 8: To maximally utilise the mining potential in the municipal area, including
optimising backward and forward linkages, without impeding negatively on the tourism
and agricultural potential.
Principle 9: To enhance business activities (formal and informal) at each of the
identified nodal points in the District by consolidating these activities with the Thusong
Centres and modal transfer facilities.
Principle 10: To consolidate industrial and manufacturing activities around three core
areas, namely Rustenburg Town, Brits and Mogwase (Bodirelo); and to promote
small-scale manufacturing/ light industrial activities, including agro-processing, at
Rural Service Centres.
Principle 11: To ensure that areas displaying little or no potential for growth (urban
and rural) are at least provided with the constitutionally mandated minimum levels of
services as prescribed by the NSDP and enshrined in the Constitution.
Principle 12: To integrate and consolidate the fragmented urban structure of the
BPDM by way of delineating urban and rural development boundaries around nodal
points and promoting infill development and densification within these Strategic
Development Areas.
Principle 13: To compile detailed Precinct Plans for each of the identified nodal points
and Rural Service Centres in the District.
Spatial Development Frameworks

Page 63 of 218
The Spatial Development Frameworks of the five local municipalities that comprise the
Bojanala Platinum District Municipality are briefly discussed below. The proposals
emanating from them should be captured in the District SDF, during the review of the
District SDF in order to promote regional alignment.
Kgetlengrivier Local Municipality
The SDF of Kgetleng Rivier Local Municipality identifies the following strategic, nodal
development priorities:
Two Rural Service Centres were identified, namely Koster and Swartruggens
The river system was identified as a Conservation network
Three pockets of High Potential Agricultural Land were reserved:
o Strip south of the Magaliesberg mountain range
o Pocket in the north-western extents
o Pocket in the far west extents
Two new linkages were proposed to open up northern extents of Kgetlengrivier LM:
North-south link from N4 freeway to Madikwe Dam area (in line with route R53);
Upgrade existing east-west link road running north of and parallel to the N4
freeway, connecting Pella to the mining belt.
Three Tourism Opportunity Areas were identified:
o One just south of the N4 freeway, near the Koster Dam
o One between Koster and Koster Dam
o One north-east of Swartruggens
Madibeng Local Municipality
The Madibeng SDF foresees the following as the interventions:
Identified High Potential Agricultural Areas along western border and central
extents of Madibeng LM

Page 64 of 218
Promote nodal development at identified Economic Activity Areas, with a focus on
establishing integrated housing developments only within such nodes
Consolidate the scattered rural settlements in the central-eastern extents of the
Municipality (around Jonathan, Shakung, and Jericho etc.)
Strengthen linkages between Brits Town and other Economic Activity Areas
The Future Urban Areas / expansion areas should comprise infill development on
the following land pockets (see Figure 23c):
o Between Letlhabile and Brits Town
o Around Modderspruit
o Around Schoemansville
o Observe the Pelindaba Restriction Zone in the south-east of the LM.
Moretele Local Municipality
The Moretele SDF was based on three strategies, implemented within four intervention
zones – as follows:
Strategy 1: Accelerating Growth and Development
o Intervention Zone One: Main economic growth areas for prioritised
development spending
Strategy 2: Sharing growth and development
o Intervention Zone Two: Social inclusion areas representing areas for
investment in people rather than places
o Intervention Zone Three: Stimulating and kick starting new potential growth
nodes
Strategy 3: Sustainable growth and development
o Intervention Zone Four: Environmentally sensitive zone
The following proposals emanated from the SDF:

Page 65 of 218
Preserve regional open spaces system and promote Cradle of Humankind
development;
Wetland Areas and Wetland Buffer Areas were delineated throughout the
municipal area, and should be protected from development or degradation.
The Makapanstad / Mathibestad complex was identified as the Primary and
Development Node, and the Moeka / Swartdam / Ratsiepane / Motle complex as
the Secondary Development Node. Both nodal points are located in the southern
extents of the municipal area, where the linkages to the larger economies of
Tshwane and Brits Town are strongest.
Three Rural Development Nodes were identified in the northern extents of the LM,
namely Moretele, Ngobi, and Cyferskuil / Walman.
A local road, connecting the Primary and Secondary Development Nodes, was
identified as a National Transport Corridor.
Secondary Corridors connect the Primary and Secondary Nodes to the Rural
Development Nodes in the north, and the Rural Nodes to each other.
Two Agricultural Focus Area were identified: In the central extents of the LM, and
along the northern border.
Four pockets of Potential Future Development and Growth Areas were identified
along the southern border of the LM.
Moses Kotane Local Municipality
The following were the development objectives to be achieved as part of the SDF for the
Moses Kotane Local Municipality:
To protect, enhance and manage the natural environmental resources in the
municipality in order to ensure a sustainable equilibrium between the mining,
tourism and agricultural industries in the area.
To utilize the Pilanesberg (primary) and Molatedi (secondary) nature reserves as
anchors to promote eco-tourism and cultural historic heritage development
(Holiday Resorts and “Cradle” and Cultural Historic).

Page 66 of 218
To link the primary and secondary tourism anchors by way of a conservation
corridor.
To maximally utilise the mining potential in the municipal area without impeding
negatively on the tourism and agricultural potential.
To support the commercialization of small scale and/or subsistence farming
activities throughout the remainder part of the municipality.
To facilitate the implementation of a manufacturing hub and incubator network
around Bodirelo, with specific emphasis also on agro-processing.
To establish a hierarchy of service centres to ensure equitable access to social
infrastructure and to promote local economic development by way of Thusong
Centres/ Multi-Purpose Community Centres (MPCC’s).
To compile detailed Precinct Plans for the nodal points/service centres in the rural
parts of the municipality and to integrate and consolidate the fragmented and
dispersed settlement structure in all settlements.
To functionally link all towns and settlements to one another and to ensure that the
main road network in the area is tarred.
To capitalize on the strategic location of the municipality, and establish regional
and provincial linkages.
To ensure that all communities have access to at least the minimum levels of
service as enshrined in the Constitution.
To focus on the Greater Moruleng area as the short term priority for urbanisation,
and to incrementally expand to the west/north-west as and when the need and the
bulk network expands.
To actively promote corridor development along the Ledig, Sun City,
Mogwase/Bodirelo and Saulspoort axis.
To consolidate the urban structure by way of infill development (informal,
subsidised and/or bonded) in the Strategic Development Areas along the corridor
as demarcated.
To define an Urban Development Boundary around the Greater Mogwase complex
in order to contain urban sprawl and to promote infill development and
densification.
Page 67 of 218
To ensure that Mogwase Town accommodates the full range of highest order
community facilities in the municipal area.
A number of nodal points were identified in the Moses Kotane municipal area, as
points where public investment should preferably be focused, with a view of
strengthening existing economic activity / highly populated areas.
Bodirelo was identified as an Industrial Node, which should be strengthened.
Five Tourism Nodes were identified, all centred on the Pilanesberg, and including
the Sun City development.
The extension of the Madikwe Nature Reserve was indicated, together with a
Conservation Corridor spanning the entire north-western border of the LM.
A hierarchy of roads was also delineated. The first priority and second priority
roads connect all the identified nodal points, and should be upgraded and
maintained in order to support economic activities, physical integration and social
upliftment within the Municipality.
The western and far-eastern extents of the LM were reserved for Extensive
Agriculture, while the central extents to the west and north of the Pilanesberg were
primarily demarcated for Mining.
Rustenburg Local Municipality
The Rustenburg SDF was based on the following six objectives/ priorities:
Priority 1: Integrated spatial development supported by the required bulk infrastructure
development
Priority 2: Accelerated and shared economic growth supported by creation of spatial
economic opportunities
Priority 3: Sustainable use and management of natural resources
Priority 4: Integration of land use and transport development
Priority 5: Creation of sustainable settlements through access to appropriate housing
and social facilities
Priority 6: Creation of opportunities for sustainable rural development. The following
proposals emanated from the SDF,

Page 68 of 218
The southern half of the municipal area, as well as the majority of the north-eastern
extents, were demarcated as regional open space.
The Vaalkop Dam Nature Reserve and Kgaswane Nature Reserve were marked as
conservation areas, and should be protected.
A hierarchy of nodes was delineated for the Rustenburg Local Municipality.
Rustenburg Town was identified as the First Order Node; Boitekong and Phokeng as
Second Order Nodes; and Thekwane, Luka/ New Town, Robega and Tlaseng as Third
Order Nodes.
Furthermore, eleven Rural Nodes were identified, namely Hartebeesfontein,
Monnakato, Bethanie, Phatsima, Marikana, Modikwe, Maumong, Tantanana,
Kroondal, Heldina, and Boons.
Urban edges were delineated around all settlements and expansion areas throughout
the LM.
The SDF included detailed plans of all the main towns/ settlements in the area. These
plans identified specific potential sites for community facilities such as an education
hub or police station.
The Platinum SDI traverses the municipal area, linking Rosslyn, Akasia, Mabopane,
Ga-Rankuwa and the Brits industrial areas, to Rustenburg. From Rustenburg, the
route links with the Trans-Kgalagadi Highway at Lobatse in Botswana through
Swartruggens, Groot Marico and Zeerust.
Route R24 was identified as the Mogale City – Rustenburg development corridor in the
Mogale City SDF. The corridor begins at the O.R. Tambo International Airport, running
via Kempton Park, Johannesburg, Krugersdorp and Tarlton to Magalies. The envisioned
corridor was expected to have four major economic nodes, of which the Rustenburg multi-
economic activity node is one.
Large tracts of land in the central and north-western extents of the LM were reserved for
mining and mining infrastructure purposes.
Scattered pockets of land were reserved for Urban-agriculture, all adjacent to small
settlements or on the outskirts of towns.
The land around the Bospoort Dam was reserved for recreation purposes.

Page 69 of 218
Households by Refuse Disposal
A distinction is made between formal and informal refuse removal. When refuse is
removed by the local authorities, it is referred to as formal refuse removal. Informal refuse
removal is where either the household or the community disposes of the waste, or where
there is no refuse removal at all. A further breakdown is used in terms of the frequency
by which the refuge is taken away, thus leading to the following categories:
Removed weekly by authority
Removed less often than weekly by authority
Removed by community members
Personal removal / (own dump)
No refuse removal
CHART 19. HOUSEHOLDS BY REFUSE DISPOSAL - BOJANALA PLATINUM,
NORTH-WEST AND NATIONAL TOTAL, 2016 [PERCENTAGE]
0%
10%
20%
30%
40%
50%
60%
70%
80%
90%
100%
Bojanala Platinum North-West National Total
Households by access to refuse removal Bojanala Platinum, 2006-2016
No refuse removal
Personal removal (owndump)
Removed by communitymembers
Removed less oftenthan weekly byauthority
Removed weekly byauthority
Source: IHS Markit Regional eXplorer version 1277

Page 70 of 218
Bojanala Platinum District Municipality had a total number of 314 000 (57.15%)
households which had their refuse removed weekly by the authority, a total of 16 300
(2.96%) households had their refuse removed less often than weekly by the authority and
a total number of 176 000 (31.91%) households which had to remove their refuse
personally (own dump).
TABLE 17. HOUSEHOLDS BY REFUSE DISPOSAL - MORETELE, MADIBENG,
RUSTENBURG, KGETLENGRIVIER AND MOSES KOTANE LOCAL
MUNICIPALITIES, 2016 [NUMBER]
Removed
weekly
by
authority
Removed
less
often
than
weekly
by
authority
Removed
by
community
members
Personal
removal
(own
dump)
No
refuse
removal
Total
Moretele 19,900 1,090 1,550 28,900 1,880 53,300
Madibeng 63,400 5,020 8,600 92,400 10,900 180,000
Rustenburg 161,000 7,410 7,510 38,000 10,100 224,000
Kgetlengrivier 7,040 345 668 7,820 1,030 16,900
Moses
Kotane 63,200 2,420 562 8,340 1,090 75,600
Total
Bojanala
Platinum
314,235 16,292 18,887 175,473 24,997 549,883
Source: IHS Markit Regional eXplorer version 1277
The region within Bojanala Platinum with the highest number of households where the
refuse is removed weekly by the authority is Rustenburg Local Municipality with 161 000
or a share of 51.15% of the households where the refuse is removed weekly by the
authority within Bojanala Platinum. The region with the lowest number of households
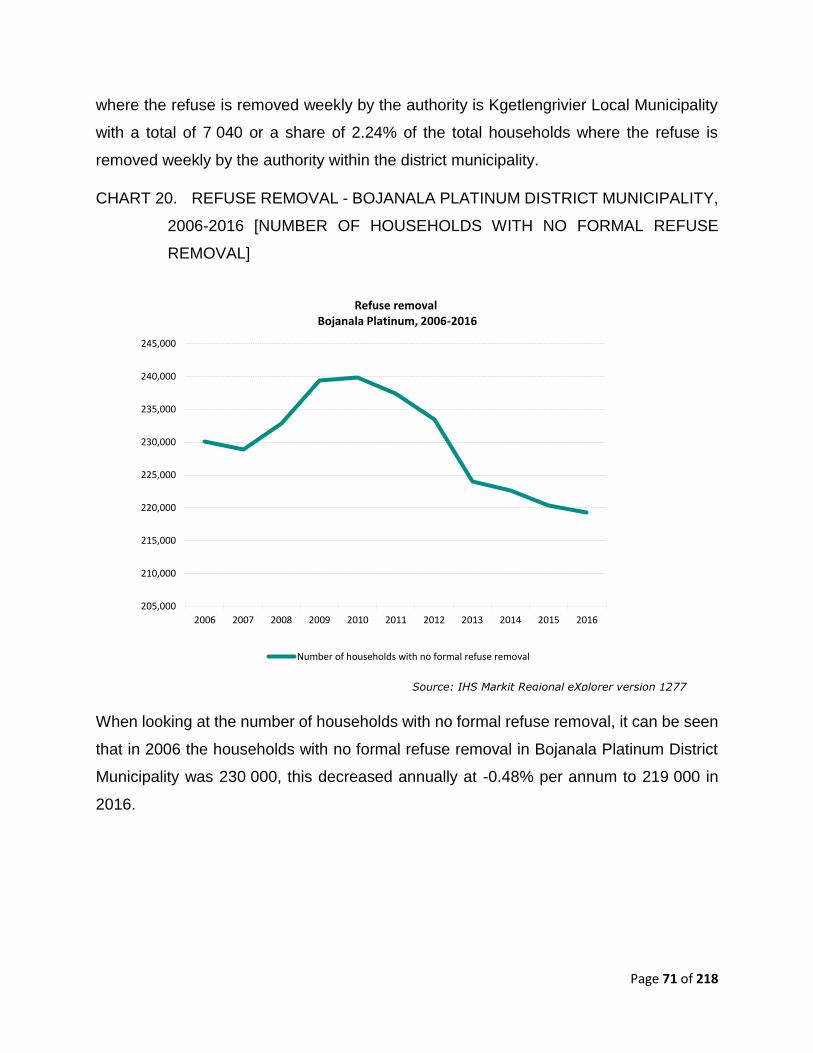
Page 71 of 218
where the refuse is removed weekly by the authority is Kgetlengrivier Local Municipality
with a total of 7 040 or a share of 2.24% of the total households where the refuse is
removed weekly by the authority within the district municipality.
CHART 20. REFUSE REMOVAL - BOJANALA PLATINUM DISTRICT MUNICIPALITY,
2006-2016 [NUMBER OF HOUSEHOLDS WITH NO FORMAL REFUSE
REMOVAL]
When looking at the number of households with no formal refuse removal, it can be seen
that in 2006 the households with no formal refuse removal in Bojanala Platinum District
Municipality was 230 000, this decreased annually at -0.48% per annum to 219 000 in
2016.
205,000
210,000
215,000
220,000
225,000
230,000
235,000
240,000
245,000
2006 2007 2008 2009 2010 2011 2012 2013 2014 2015 2016
Refuse removal Bojanala Platinum, 2006-2016
Number of households with no formal refuse removal
Source: IHS Markit Regional eXplorer version 1277

Page 72 of 218
LEGISLATIVE FRAMEWORK
Binding legislation, policies, and planning requirements at National and Provincial
Levels.
Table 2: Legislative Framework
NO LEGISLATION OBJECTS OF
LEGISLATION
APPROPRIATE MUNICIPAL
RESPONSES
1
The Constitution
of the Republic of
South Africa (Act
108 of 1996)
Sets out the framework within
the Rule of Law will take
place, regulating both the
horizontal & vertical
relationships between
persons, the state etc.
Align all its planning and
public participations
processes towards
contributing positively
towards realization of its
goals.
2
National Spatial
Development
Perspective
To explain all the Spatial
Planning aspects nationally
and guide government on all
matters related to regional
and sub-regional potentials,
challenges and possible
solutions.
Align their Spatial Planning
tools to address the areas
where they can make
maximum gains in terms of
economic, social and
commercial gains.
3
National
Development
Plan
Sets out the long term
strategic Vision of the country
with clear deliverables over
time according each aspect of
development.
Take this into account as they
make five year strategic
plans, and ensure that each
of the municipal programmes
will contribute towards the
realizations of the Vision.
4
Provincial
Development
Plan
A customized version of the
National Development Plan
(NDP) above, inclusive of the
provincial strategic pillars of
(A)griculture, (C)ulture &
Take this into account as they
make five year strategic
plans, and ensure that each
of the municipal programmes

Page 73 of 218
(T)ourism (ACT), as well as
(V)illages, (T)ownships &
(S)mall (D)orpies (VTSD),
(R)enewal (H)ealing &
(R)econciliation (RHR),
Saamtrek Saamwerk and
Setsokotsane
will contribute towards the
realizations of the Vision.
5
Water Services
Act
Sets out the parameters and
regulatory issues around the
management of Water &
Sanitation issues across the
country.
Develop appropriate strategic
frameworks that will lead
towards provision of more
economical and effective
Water & Sanitation systems.
6 North West
Provincial Spatial
Development
Framework
Explains the spatial character
of the province, and details all
the regional spatial issues.
Take into account what the
PSDF explains as regional
spatial context and include
such in their SDFs.
7
White Paper on
Local
Government
Sets out a long term policy
basis for the transformation of
the Local Government
sphere, detailing all the policy
thrusts that must be
implemented in order to effect
the constitutional obligations
of this sphere.
Design their policies in
manner such that
transformation will take place,
and the business systems of
municipalities will be cost
effective and provide value to
citizens.
8 Local
Government:
Municipal
Systems Act (Act
32 of 2000)
Details all the systems issues
that municipalities must be
compliant with, and allocate
various functional
requirements for various tiers
of officials as well issues of
Ensure that they are
integrative at all times into
their planning, and their
strategies are citizen based.
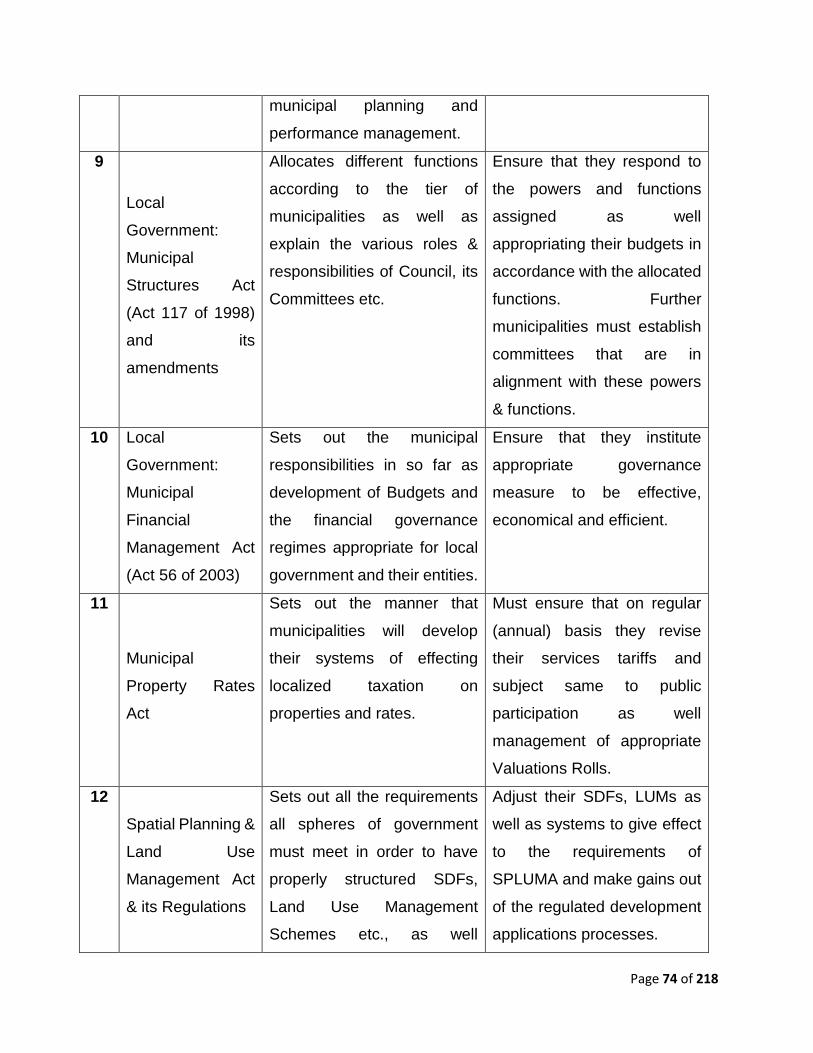
Page 74 of 218
municipal planning and
performance management.
9
Local
Government:
Municipal
Structures Act
(Act 117 of 1998)
and its
amendments
Allocates different functions
according to the tier of
municipalities as well as
explain the various roles &
responsibilities of Council, its
Committees etc.
Ensure that they respond to
the powers and functions
assigned as well
appropriating their budgets in
accordance with the allocated
functions. Further
municipalities must establish
committees that are in
alignment with these powers
& functions.
10 Local
Government:
Municipal
Financial
Management Act
(Act 56 of 2003)
Sets out the municipal
responsibilities in so far as
development of Budgets and
the financial governance
regimes appropriate for local
government and their entities.
Ensure that they institute
appropriate governance
measure to be effective,
economical and efficient.
11
Municipal
Property Rates
Act
Sets out the manner that
municipalities will develop
their systems of effecting
localized taxation on
properties and rates.
Must ensure that on regular
(annual) basis they revise
their services tariffs and
subject same to public
participation as well
management of appropriate
Valuations Rolls.
12
Spatial Planning &
Land Use
Management Act
& its Regulations
Sets out all the requirements
all spheres of government
must meet in order to have
properly structured SDFs,
Land Use Management
Schemes etc., as well
Adjust their SDFs, LUMs as
well as systems to give effect
to the requirements of
SPLUMA and make gains out
of the regulated development
applications processes.

Page 75 of 218
processes for dealing with
various town & regional
planning issues including the
establishment, and
management of Municipal
Planning Tribunals.
13
Housing Act (107
of 1997)
Sets out the systems and
objectives of the government
to manage the housing and
human settlements arena as
well establishment of various
instruments related thereto
such as the Housing
Development Agency, the
Rental Housing Tribunals etc.
Ensure that they develop
appropriate policy
frameworks to comply with,
and give effect to the objects
of the Housing Act
14
National
Environmental
Management Act
Act sets out all requirements
for the better management of
the national Environmental
Resources & Heritage, and
enjoins other spheres of
government and parties
interested in environmental
matters to development
appropriate localized tools for
environmental conservation.
Municipalities are to develop
their environmental
management policies in
accordance with the Act as
well as design any other
framework that will assist in
the management of the
environment effectively.
15
Environmental
Conservation Act
Sets out the manner those
conservations issues are to
be addressed across the
country.
Municipalities to take note of
this as they develop their
policy frameworks, including
their planning systems.
16 National Heritage
Resources Act
Sets out the management
systems for preservation and
Municipal town & regional
planning frameworks are to

Page 76 of 218
conservation of Heritage
Resources across all spheres
of government including the
roles and functions of these
spheres. The Act also
establishes various Heritage
Councils
further take account of the
requirements of the Act and
set out measures of
cooperating with private
Heritage owners within their
areas of jurisdiction.
17
Development
Facilitation Act
Has been replaced in large
parts by the SPLUMA,
however, it served to address
the manner that development
planning and its processes
were to be undertaken.
Municipal development
regulatory regime must take
consideration of its
requirements thereby
avoiding any economic
leakages that may result from
poor responses to its
requirements.
18
Townships
Ordinances
Old order regional by-laws
that regulated various
development planning
regimes across the then four
provinces.
Municipal planning systems
are to take account of those
Ordinances that are still in
effect, and ensure that they
influence their decision-
making processes.
19
National House of
Traditional
Leaders
Amendment Act
Sets out the powers and
functions of Magosi across
the country as well as their
relationships where there are
several tiers of chieftaincy in
some parts of the country and
further determine the powers
and function of the President
in so far as continued reign of
any Monarch/Kgosi etc.
Take into account this Act as
well as have their public
participation and dispute
mediation processes as
closely aligned to the objects
of the Act as possible.

Page 77 of 218
20
Intergovernmental
Relations
Framework Act
Sets out the manner that the
three spheres of government
are to relate, in effect
responding to Chapter Three
of the Constitution.
Design their IGR systems in
line with the Act as well be
sensitive to the manner that
Act instigates dispute
resolution to be like.
21
Disaster
Management Act
Sets out the manner that
Disasters are to be managed
as well the institutional
arrangements around
Disaster Management and
the powers and functions of
National, Province and
Districts, including the
development of Disaster
Management Plans.
Districts are to ensure that
they have Disaster
Management Plans, and local
municipalities ensure that as
Districts development such
plans they take into account
various issues from the LMs.
23
Skills
Development Act
Sets out the parameters that
enjoins the state to contribute
towards skills development.
Municipalities are to ensure
that their Transformation
agenda is in line with the
development of skills and set
targets for skills development
in their jurisdictions.
24
Prevention of
Unfair
Discrimination Act
Determines the manner that
Chapter Two requirements in
terms of elimination of acts of
discrimination across the
state.
Municipal policies are to be
aligned towards the objects of
the act through progressive
measures that protect the
vulnerable and targeted
groups.
25 National Sports
and Recreation
Act
Details the steps that will be
taken by the state to develop
sport & recreation as well as
establishes various bodies
Ensure that they interact and
develop policies that will
promote the objects of the
Sport & Recreation Act.

Page 78 of 218
that are aimed at sport &
recreation development &
promotion
26
Rental Housing
Act
Regulates the manner that
Landlords and tenants are to
relate while protecting the
rights of both tenants and
those of landlords.
Ensure to the extent possible
that they have policies that
are in alignment with the
objects of this Act.
27
Preferential
Procurement
Policy Framework
Act
Sets out how the procurement
space is to be biased towards
clean administration while
promoting the marginalized
groups and ensuring their
unhindered entrance into the
supply of commodities &
services to the state.
The SCM policies of the state
to be sensitive to, and
progressively address the
entrance of the marginalized
groups into the space for
provision of goods & services.
28
Skills
Development
Levies Act
Regulates how levies that are
to be contributed towards the
development skills are to be
charged and their various
disbursements for the
realization of the goals of the
Act and that of the Skills
Development Act.
Ensure their continued
contributions into the fund as
well as exploit to the extent
possible the benefits of the
Act through properly
developed training regimes.
29
Public Service
Amendment Act
Regulates the employment of
persons by the state as well
as setting out code of conduct
for these employees as well
as other measures that
amongst other things include
disciplinary regime
Municipalities to note the
developments that may result
in the amalgamation of the
municipal public &
national/provincial services
corps into one.

Page 79 of 218
30
Employment
Equity Act
Seeks to promote the
entrance of the previously
marginalized groups into the
state as well as the private
sector to eliminate
discrimination on the basis
gender & race in the
employment practices of
institutions.
Recruitment and selections
policies are to be aligned to,
and serve the objectives of
this Act.
The above-mentioned legislations should be taken into consideration in the process of
developing/reviewing the IDPs.
Powers & Functions
The powers and functions of the district are assigned in terms of section 84 of the
municipal structures act. Apart from the powers and functions of the district municipality,
as outlined in terms of Section 83 and 84 respectively of the Municipal Structures Act, the
district is required in terms of section 83 (3) of the same act, to seek to achieve the
integrated, sustainable and equitable social as well as economic development of the
district area as a whole by:
Ensuring integrated development planning for the district;
Promoting bulk infrastructure development and services for the district as a whole;
Building the capacity of local municipalities in its area to perform their functions
and exercise their powers where such capacity is lacking;
Promoting the equitable distribution of resources between the local municipalities
in its area to ensure appropriate levels of municipal services.

Page 80 of 218
Table 3: Powers and Functions of the BPDM
The table above indicates the district municipality’s performance of powers and function
allocated line with section 83 and 84 (1) of the Municipal Structures Act, 117/1998. A √
indicate that the function is performed, while X indicate that the district does not perform
the function.
Section Powers and functions Performance
84(a) Integrated Dev. Planning √
84(b) Portable water supply systems X
84(c) Bulk supply of electricity X
84(d) Domestic waste water & sewage disposal X
84(e) Solid waste disposal sites X
84(f) Municipal Roads X
84(g) Regulation of passenger TPT services Function still to be
performed
84(h) Municipal Airports X
84(i) Municipal Health Services √
84(j) Fire Fighting Services for whole district √
84(k) Fresh Produce markets & Abattoirs X
84(l) Cemeteries & Crematoria X
84(m) Local Tourism for whole district √
84(n) Municipal Public Works X
84(o) Receipt of Grants √
84(p) Taxes, Levies & Duties as authorised by Nat
Legislation X
Page 81 of 218
As reflected in the table above, the district municipality does not perform most of the
allocated powers and functions because the same functions are performed directly by the
constituent local municipalities.
Unlike other district municipalities in the North West Province, BPDM is notably not a
Water Service Authority because the water function has been directly assigned to local
municipalities. However the district has undertaken several bulk water and sanitation
related functions as part of providing support to local municipalities such as Moses
Kotane, Kgetleng Rivier and Moretele local municipalities.
Although it is not feasible for the district to perform all the powers and functions that are
currently not performed, the district municipality will undertake a study to assess its
current situation with regard to available resources, and design a new service delivery
model as a strategy to facilitate the performance of some of these powers and functions.
Among others the study will design a new service delivery model as an integrated
approach to powers and functions by addressing the following:
Define the “as is” and “to be” situation
The definition and allocation of powers and functions between the district and local
municipalities
Capacity assessment of the district and constituent local municipality and develop
a case for possible devolution and assignment of additional powers and functions
The role of the district in the planning and possible provision supply of bulk services
The unfunded mandates
Coordinating role of the district as the IGR centre between and amongst different
spheres of government and SOEs (e.g. Eskom, Water Boards, IDC, SEDA etc.)
The details of the process to be followed will be incorporated in the action plan that forms
part of this document and it will also be elaborated on the IDP and SDBIP which will be
developed from this plan.

Page 82 of 218
DISTRICT PRIORITIES
The priorities of the district municipality are directly influenced by the priorities of the five
constituent local municipalities.
Prioritized needs from constituent Local Municipalities
As a category C municipality, Bojanala Platinum District Municipality is responsible for
supporting service delivery initiatives by its constituent category B municipalities. The
category B municipalities are:
Kgetleng Rivier,
Madibeng,
Moretele,
Moses Kotane, and
Rustenburg.
The priorities tabulated here below, arise from the commonly identified needs of
communities at ward level and submitted to the district municipality to inform planning at
local and district level. The needs reflected in the tables below are the District Priorities
as a cumulative priorities of local municipalities.
Type Priority area
Infrastructure
Water & sanitation
Roads & Storm water
Electricity
Economic issues Local Economic and Rural Development
Development & Planning Land & Housing
Social Infrastructure Community facilities (halls, sport grounds
& libraries)
Financial management Financial Management

Page 83 of 218
MUNICIPAL PRIORITIES
MUNICIPALITY PRIORITIES
1 2 3 4 5
Kgetlengrivier Water and Sanitation
Township Establishment
Roads and Storm-water
Local Economic Development
Amenities
Madibeng Water & Sanitation Roads and Storm Water
Electricity Land and Housing Social Services
Moretele Water Housing High Mast Lights Internal Roads & Storm Water
Sports Facilities
Moses Kotane Water & Sanitation Roads & Storm water
Institutional Development
Sports & Recreation
Economic Development
Rustenburg Water & Sanitation Roads & storm water
Electricity Land & Housing Sustainable Rural development

Page 84 of 218
THE DISTRICT WIDE PRIORITIES
Emanating from the submissions that were submitted by the local municipalities of
Kgetleng Rivier, Madibeng, Moses Kotane, Moretele and Rustenburg, the District
Municipality consolidated them and came up with the following District wide priorities for
the 2020/21 financial year:
Priority 1 - Water and sanitation
Priority 2 - Roads and Storm Water
Priority 3 - Electricity
Priority 4 - Spatial Planning, Land Use and Institutional Development
Priority 5 - Rural and Economic Development
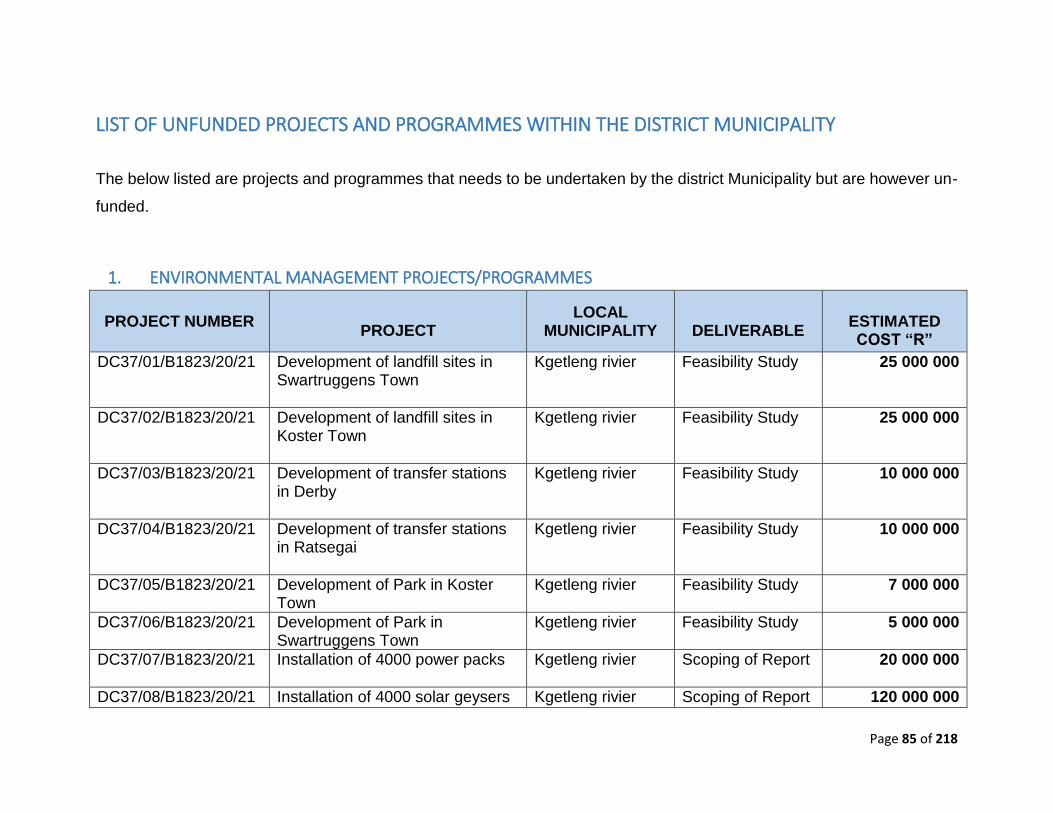
Page 85 of 218
LIST OF UNFUNDED PROJECTS AND PROGRAMMES WITHIN THE DISTRICT MUNICIPALITY
The below listed are projects and programmes that needs to be undertaken by the district Municipality but are however un-
funded.
1. ENVIRONMENTAL MANAGEMENT PROJECTS/PROGRAMMES
PROJECT NUMBER
PROJECT LOCAL
MUNICIPALITY
DELIVERABLE
ESTIMATED COST “R”
DC37/01/B1823/20/21 Development of landfill sites in Swartruggens Town
Kgetleng rivier Feasibility Study 25 000 000
DC37/02/B1823/20/21 Development of landfill sites in Koster Town
Kgetleng rivier Feasibility Study 25 000 000
DC37/03/B1823/20/21 Development of transfer stations in Derby
Kgetleng rivier Feasibility Study 10 000 000
DC37/04/B1823/20/21 Development of transfer stations in Ratsegai
Kgetleng rivier Feasibility Study 10 000 000
DC37/05/B1823/20/21 Development of Park in Koster Town
Kgetleng rivier Feasibility Study
7 000 000
DC37/06/B1823/20/21 Development of Park in Swartruggens Town
Kgetleng rivier Feasibility Study 5 000 000
DC37/07/B1823/20/21 Installation of 4000 power packs
Kgetleng rivier Scoping of Report 20 000 000
DC37/08/B1823/20/21 Installation of 4000 solar geysers Kgetleng rivier Scoping of Report 120 000 000

Page 86 of 218
PROJECT NUM BER
PROJECT
LOCAL MUNICIPALITY
DELIVERABLE
ESTIMATED COST “R”
DC37/09/B1823/20/21 Willie bins 15 000HH
Kgetleng rivier Moretele
Scoping of Report 6 750 000
DC37/10/B1823/20/21 Environmental Legal Compliance Audit
Kgetleng rivier Moretele
Scoping of Report 2 000 000
DC37/11/B1823/20/21 Bio-Fuel manufacturing plant
Kgetleng rivier Scoping of Report 3 000 000 000
DC37/12/B1823/20/21 Waste to energy for the entire district
All 5 Local municipalities
Feasibility Study 19 000 000 000
DC37/13/B1823/20/21 Construction of Madikwe Landfill Site
Moses Kotane Feasibility Study 35 000 000
DC37/14/B1823/20/21 Installation of 50000 power packs
All 5 Local municipalities
Scoping of Report 35 000 000
DC37/15/B1823/20/21 Installation of 50000 solar geysers
All 5 Local municipalities
Scoping of Report 35 000 000
DC37/16/B1823/20/21 Willie Bins- 50000HH
All 5 Local municipalities
Scoping of Report 22 500 000
DC37/17/B1823/20/21 200 Skip bins
All 5 Local municipalities
Scoping of Report 3 200 000
DC37/18/B1823/20/21 Installation of 20000HH power packs
All 5 Local municipalities
Scoping of Report 100 000 000
DC37/19/B1823/20/21 Installation of 60000HH solar geysers
All 5 Local municipalities
Scoping of Report 1 800 000 000
DC37/20/B1823/20/21 Willie Bins-160 000
All 5 Local municipalities
Scoping of Report 72 000 000

Page 87 of 218
PROJECT NUMBER
PROJECT LOCAL
MUNICIPALITY
DELIVERABLE
ESTIMATED COST “R”
DC37/21/B1823/20/21 300 Skip Bins All 5 Local municipalities
Scoping of Report 4 800 000
DC37/22/B1823/20/21 Construction of Makapanstad Landfill Site
Moretele Scoping of Report 35 000 000
DC37/23/B1823/20/21 Installation of 50000 HH power packs
Moretele Moses Kotane
Scoping of Report 250 000 000
DC37/24/B1823/20/21 Willie Bins -52000HH
Moretele Kgetleng
Scoping of Report 23 400 000
DC37/25/B1823/20/21 250 Skip Bins
Moretele Kgetleng
Scoping of Report 4 000 000
DC37/26/B1823/20/21 Rear end Loading compactors
Madibeng Kgetleng
Scoping of Report 8 000 000
DC37/27/B1823/20/21 2xFront end loading comactors
Madibeng Kgetleng
Scoping of Report 6 000 000
DC37/28/B1823/20/21 3xSmall compacotrs
Kgetleng Scoping of Report 3 000 000
DC37/29/B1823/20/21 4xHydraulic bin lifting equipments
All 5 Local municipalities
Scoping of Report 800 000
DC37/30/B1823/20/21 Installations of 100 000HH Power Packs
All 5 Local municipalities
Scoping of Report 800 000
DC37/31/B1823/20/21 Installations of 100 000HH Solar geysers
All 5 Local municipalities
Scoping of Report 800 000
DC37/32/B1823/20/21 Skip Bins-3300
All 5 Local municipalities
Scoping of Report 53 000 000
DC37/33/B1823/20/21 Willie Bins-3300
All 5 Local municipalities
Scoping of Report 1 485 000
DC37/34/B1823/20/21 Waste Collection Kgetleng Scoping of Report 12 000 000

Page 88 of 218
PROJECT NUMBER
PROJECT LOCAL
MUNICIPALITY
DELIVERABLE
ESTIMATED COST “R”
DC37/35/B1823/20/21 Kremetart mini dump
Rustenburg Feasibility Study 5 000 000
DC37/36/B1823/20/21 Zinniaville mini dump
Rustenburg Feasibility Study 5 000 000
DC37/37/B1823/20/21 Waste drop off pilleri
Rustenburg Feasibility Study 14 000 000
DC37/38/B1823/20/21 Strumosa Environmental Center
Rustenburg Feasibility Study 240 000 000
DC37/39/B1823/20/21 The construction for Marikana transfer station
Rustenburg Feasibility Study 11 500 000
DC37/40/B1823/20/21 Phokeng and Tsitsing Transfer Station
Rustenburg Feasibility Study 25 000 000
DC37/41/B1823/20/21 Waterval landfill site rehabilitation
Rustenburg Feasibility Study 100 000 000
DC37/42/B1823/20/21 Jabula Transfer Station
Rustenburg Feasibility Study 8 100 000
DC37/43/B1823/20/21 Waste Recycling Village at Waterval Landfill site
Rustenburg Feasibility Study 23 000 000
DC37/44/B1823/20/21 Phatsima Waste Transfer Station
Rustenburg Feasibility Study 38 600 000
DC37/45/B1823/20/21 Marikana Waste Transfer Station Phase 2 Development
Rustenburg Feasibility Study 12 000 000
DC37/46/B1823/20/21 Phokeng Waste Transfer Station Phase 2 Development
Rustenburg Feasibility Study 17 000 000

Page 89 of 218
PROJECT NUMBER
PROJECT LOCAL
MUNICIPALITY
DELIVERABLE
ESTIMATED COST “R”
DC37/47/B1823/20/21 Tsitsing Waste Transfer Station Phase 2 Development
Madibeng Feasibility Study 15 600 000
DC37/48/B1823/20/21 Deep Bin network for recyclables collection
Madibeng Feasibility Study 10 000 000
DC37/49/B1823/20/21 Recyclables buy-back centres
Rustenburg Feasibility Study 20 000 000
DC37/50/B1823/20/21 Kremetart Lifestyle Park
Rustenburg Feasibility Study 4 400 000
DC37/51/B1823/20/21 Zinniaville Kiddies Park
Rustenburg Feasibility Study 4 400 000
DC37/52/B1823/20/21 Air quality monitoring stations
Madibeng Feasibility Study 24 000 000
DC37/53/B1823/20/21 Review of the district air quality management plan
all 5 local municipalities
Development of the Plan
3 500 000
DC37/54/B1823/20/21 Review of the district integrated waste management plan
all 5 local municipalities
Development of the Plan
2 000 000
DC37/55/B1823/20/21 Strategic environmental assessment
all 5 local municipalities
Assessment Report
2 800 000
DC37/56/B1823/20/21 Environmental management systems
all 5 local municipalities
Development of the Systems
2 600 000
DC37/57/B1823/20/21 Environmental management policy
all 5 local municipalities
Development of Policy
2 800 000
DC37/58/B1823/20/21 Development of Cemetery in Kgetleng Rivier
Kgetleng Rivier Cemetery 3 400 000
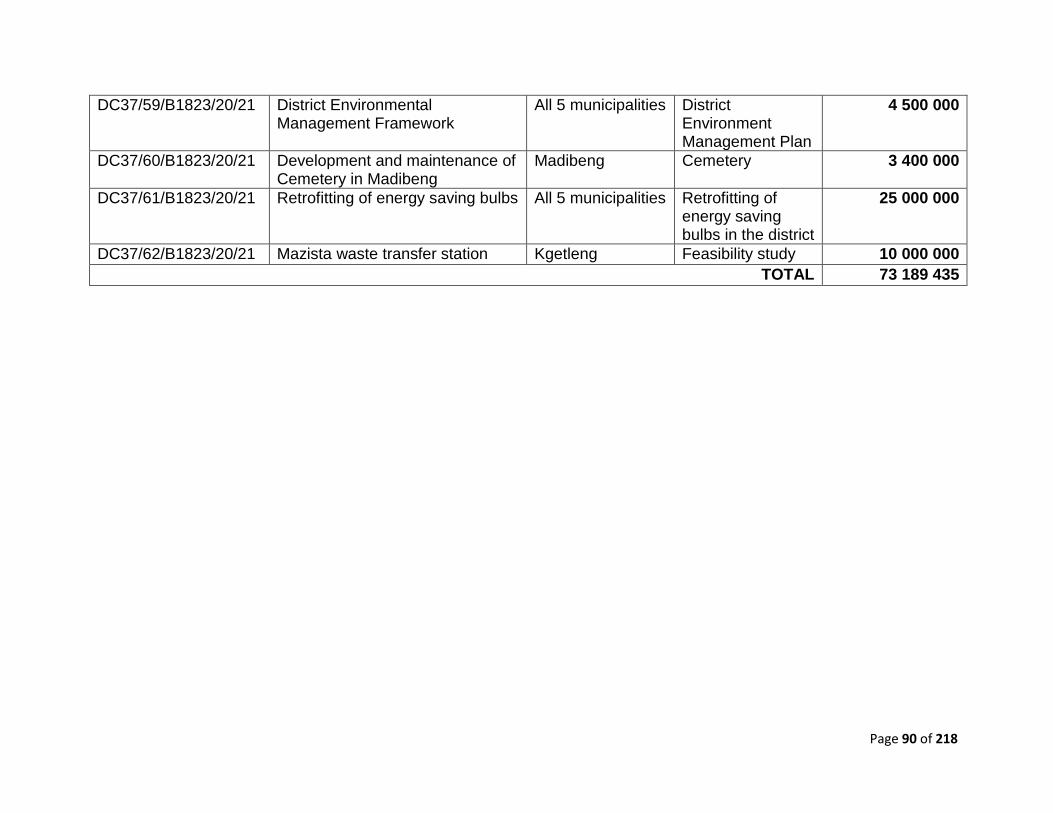
Page 90 of 218
DC37/59/B1823/20/21 District Environmental Management Framework
All 5 municipalities District Environment Management Plan
4 500 000
DC37/60/B1823/20/21 Development and maintenance of Cemetery in Madibeng
Madibeng Cemetery 3 400 000
DC37/61/B1823/20/21 Retrofitting of energy saving bulbs All 5 municipalities Retrofitting of energy saving bulbs in the district
25 000 000
DC37/62/B1823/20/21 Mazista waste transfer station Kgetleng Feasibility study 10 000 000
TOTAL 73 189 435

Page 91 of 218
2. COMMUNITY DEVELOPMENT SERVICES
PROJECT NUMBER
PROJECT LOCAL
MUNICIPALITY
DELIVERABLE
ESTIMATED COST “R”
DC37/63/B1823/20/21 3 Fire Engines Kgetleng rivier Supply and Delivery Only
4 000 000
DC37/64/B1823/20/21 1x Response Vehicle Kgetleng rivier Supply and Delivery Only
2 000 000
DC37/65/B1823/20/21 3x Skid Unit Vehicles Kgetleng rivier Supply and Delivery Only
1 800 000
DC37/66/B1823/20/21 3x Jaws of Life Kgetleng rivier Supply and Delivery Only
1 200 000
DC37/67/B1823/20/21 2x Safety Vehicles Kgetleng rivier Supply and Delivery Only
1 200 000
DC37/68/B1823/20/21 Satellite fire station Kgetleng rivier Supply and Delivery Only
11 000 000
DC37/69/B1823/20/21 Construction of community halls in Extension 4 Borolelo, Redirile, Mazista and Reagile Extension 8
Kgetleng rivier Scoping Reports and Designs
40 000 000
DC37/70/B1823/20/21 Construction of sports and recreational facilities, wards 1,2,3,4 5,6,7&8
Kgetleng rivier Feasibility Study 320 000 000
DC37/71/B1823/20/21 Construction of community halls in Extension 4 Borolelo, Redirile, Mazista and Reagile Extension 8
Kgetleng rivier Scoping Reports and Designs
25 000 000
DC37/72/B1823/20/21 Construction of sports and recreational facilities, wards 1,2,3,4 5,6,7&8
Kgetleng rivier Feasibility Study 320 000 000
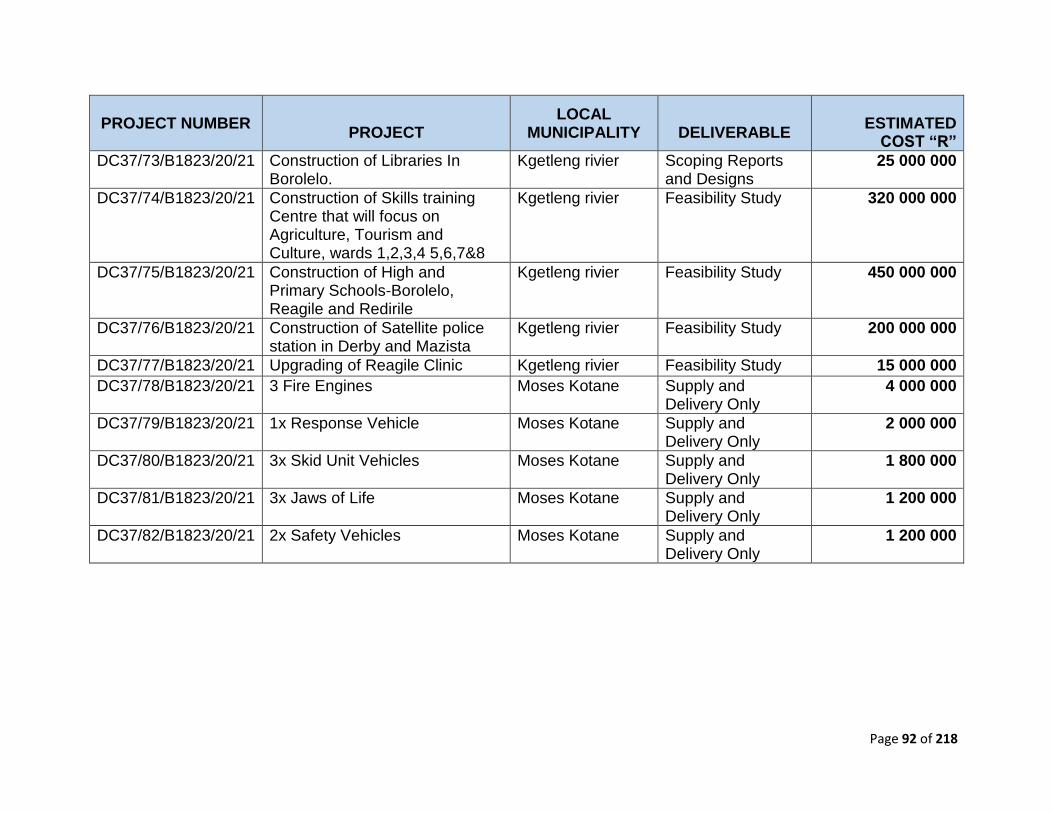
Page 92 of 218
PROJECT NUMBER
PROJECT LOCAL
MUNICIPALITY
DELIVERABLE
ESTIMATED
COST “R”
DC37/73/B1823/20/21 Construction of Libraries In Borolelo.
Kgetleng rivier Scoping Reports and Designs
25 000 000
DC37/74/B1823/20/21 Construction of Skills training Centre that will focus on Agriculture, Tourism and Culture, wards 1,2,3,4 5,6,7&8
Kgetleng rivier Feasibility Study 320 000 000
DC37/75/B1823/20/21 Construction of High and Primary Schools-Borolelo, Reagile and Redirile
Kgetleng rivier Feasibility Study 450 000 000
DC37/76/B1823/20/21 Construction of Satellite police station in Derby and Mazista
Kgetleng rivier Feasibility Study 200 000 000
DC37/77/B1823/20/21 Upgrading of Reagile Clinic Kgetleng rivier Feasibility Study 15 000 000
DC37/78/B1823/20/21 3 Fire Engines Moses Kotane Supply and Delivery Only
4 000 000
DC37/79/B1823/20/21 1x Response Vehicle Moses Kotane Supply and Delivery Only
2 000 000
DC37/80/B1823/20/21 3x Skid Unit Vehicles Moses Kotane Supply and Delivery Only
1 800 000
DC37/81/B1823/20/21 3x Jaws of Life Moses Kotane Supply and Delivery Only
1 200 000
DC37/82/B1823/20/21 2x Safety Vehicles Moses Kotane Supply and Delivery Only
1 200 000

Page 93 of 218
PROJECT NUMBER
PROJECT LOCAL
MUNICIPALITY
DELIVERABLE
ESTIMATED COST
“R”
DC37/83/B1823/20/21 Satellite fire station-Pella Moses Kotane Supply and Delivery Only
11 000 000
DC37/84/B1823/20/21 Refurbishment of Pilanesberg Airport
Moses Kotane Feasibility Study
20 000 000 000
DC37/85/B1823/20/21 3 Fire Engines Madibeng Supply and Delivery Only
4 000 000
DC37/86/B1823/20/21 1x Response Vehicle Madibeng Supply and Delivery Only
2 000 000
DC37/87/B1823/20/21 1x Response Vehicle Madibeng Supply and Delivery Only
2 000 000
DC37/88/B1823/20/21 3x Skid Unit Vehicles Madibeng Supply and Delivery Only
1 800 000
DC37/89/B1823/20/21 3x Jaws of Life Madibeng Supply and Delivery Only
1 200 000
DC37/90/B1823/20/21 2x Safety Vehicles Madibeng Supply and Delivery Only
1 200 000
DC37/91/B1823/20/21 Moiletswane Sport field Madibeng Scoping reports and Designs
1 300 000
DC37/92/B1823/20/21 Kgabalatsane Sports Facility Madibeng Scoping reports and Designs
2 000 000
DC37/93/B1823/20/21 Ward 31 Sports Facility Madibeng Scoping reports and Designs
2 000 000
DC37/94/B1823/20/21 Maboloka Sports Facility Madibeng Scoping reports and Designs
8 000 000
DC37/95/B1823/20/21 Klipgat Library Services Madibeng Scoping reports and Designs
2 000 000

Page 94 of 218
PROJECT NUMBER
PROJECT LOCAL
MUNICIPALITY
DELIVERABLE
ESTIMATED COST
“R”
DC37/96/B1823/20/21 Hospice x 5 Madibeng Feasibility Study
50 000 000
DC37/97/B1823/20/21 Old age Homes x 50 Madibeng Feasibility Study
330 000 000
DC37/98/B1823/20/21 Tennis Courts Madibeng Feasibility Study
500 000 000
DC37/99/B1823/20/21 Soccer Fields Madibeng Feasibility Study
100 000 000
DC37/100/B1823/20/21 Rugby Field x 5 All 5 Local Municipalities
Feasibility Study
800 000 000
DC37/101/B1823/20/21 Netball Field Madibeng Feasibility Study
25 000 000
DC37/102/B1823/20/21 Gymnasium x 33 Madibeng Feasibility Study
120 000 000
DC37/103/B1823/20/21 University in Mooinooi Madibeng Feasibility Study
20 000 000 000
DC37/104/B1823/20/21 Fire Fighting Equipment for farmers
All 5 Local Municipalities
Supply and Delivery Only
20 000 000 000
DC37/105/B1823/20/21 Fire Engines x 100 All 5 Local Municipalities
Supply and Delivery Only
500 000 000
DC37/106/B1823/20/21 Hose for Fire Madibeng Supply and Delivery Only
100 000
DC37/107/B1823/20/21 Foam Equipment Madibeng Supply and Delivery Only
50 000
DC37/108/B1823/20/21 Water and Foam tanks x 10 All 5 Local Municipalities
Supply and Delivery Only
50 000 000
DC37/109/B1823/20/21 Fire Engines x 100 All 5 Local Municipalities
Supply and Delivery Only
500 000 000

Page 95 of 218
PROJECT NUMBER
PROJECT LOCAL
MUNICIPALITY
DELIVERABLE
ESTIMATED COST
“R”
DC37/110/B1823/20/21 Hose for Fire Madibeng Supply and Delivery Only
100 000
DC37/111/B1823/20/21 Foam Equipment Madibeng Supply and Delivery Only
50 000
DC37/112/B1823/20/21 Water and Foam tanks x 10 All 5 Local Municipalities
Supply and Delivery Only
50 000 000
DC37/113/B1823/20/21 10 fire-fighting pumps All 5 Local Municipalities
Supply and Delivery Only
10 000 000
DC37/114/B1823/20/21 Porter Cabins x 10 All 5 Local Municipalities
Supply and Delivery Only
10 000 000
DC37/115/B1823/20/21 Mobile Offices x 10 All 5 Local Municipalities
Supply and Delivery Only
10 000 000
DC37/116/B1823/20/21 3 x Fire Engines Moretele Supply and Delivery Only
4 000 000
DC37/117/B1823/20/21 Construction of community hall in Mmotla
Moretele Completed community hall
9 200 000
DC37/118/B1823/20/21 Construction of community hall in Moeka
Moretele Completed community hall
9 200 000
DC37/119/B1823/20/21 Construction of 10 sports complex in ward 1, 2,4,5,6,9,10,19,21,23 and 26
Moretele Completed sport complex
828 000 000
DC37/120/B1823/20/21 1 x Response Vehicle Moretele Supply and Delivery Only
2 000 000
DC37/121/B1823/20/21 3 x Skid Unit Vehicles Moretele Supply and Delivery Only
1 800 000
DC37/122/B1823/20/21 3 x Jaws of Life Moretele Supply and Delivery Only
1 200 000

Page 96 of 218
PROJECT NUMBER
PROJECT LOCAL
MUNICIPALITY
DELIVERABLE
ESTIMATED COST
“R”
DC37/123/B1823/20/21 2 x Safety Vehicles Moretele Supply and Delivery Only
1 200 000
DC37/124/B1823/20/21 Golf Course in Moretele Moretele Feasibility Study
2 000 000 000
DC37/125/B1823/20/21 Fire station and emergency centre
Moretele Complete fire station and emergency centre
41 931 030
DC37/126/B1823/20/21 3 x Fire Engines Rustenburg Supply and Delivery Only
4 000 000
DC37/127/B1823/20/21 1 x Response Vehicle Rustenburg Supply and Delivery Only
2 000 000
DC37/128/B1823/20/21 3 x Skid Unit Vehicles Rustenburg Supply and Delivery Only
1 800 000
DC37/129/B1823/20/21 3 x Jaws of Life Rustenburg Supply and Delivery Only
1 200 000
DC37/130/B1823/20/21 2 x Safety Vehicles Rustenburg Supply and Delivery Only
1 200 000
DC37/131/B1823/20/21 Satellite fire station-Marikana Rustenburg Feasibility Study
11 000 000
DC37/132/B1823/20/21 Development of sports & recreational facilities-Kanana,Luka, Mogono, Photsaneng, Mfidikwe and Tlapa, Thekwana
Rustenburg Feasibility Study
31 000 000
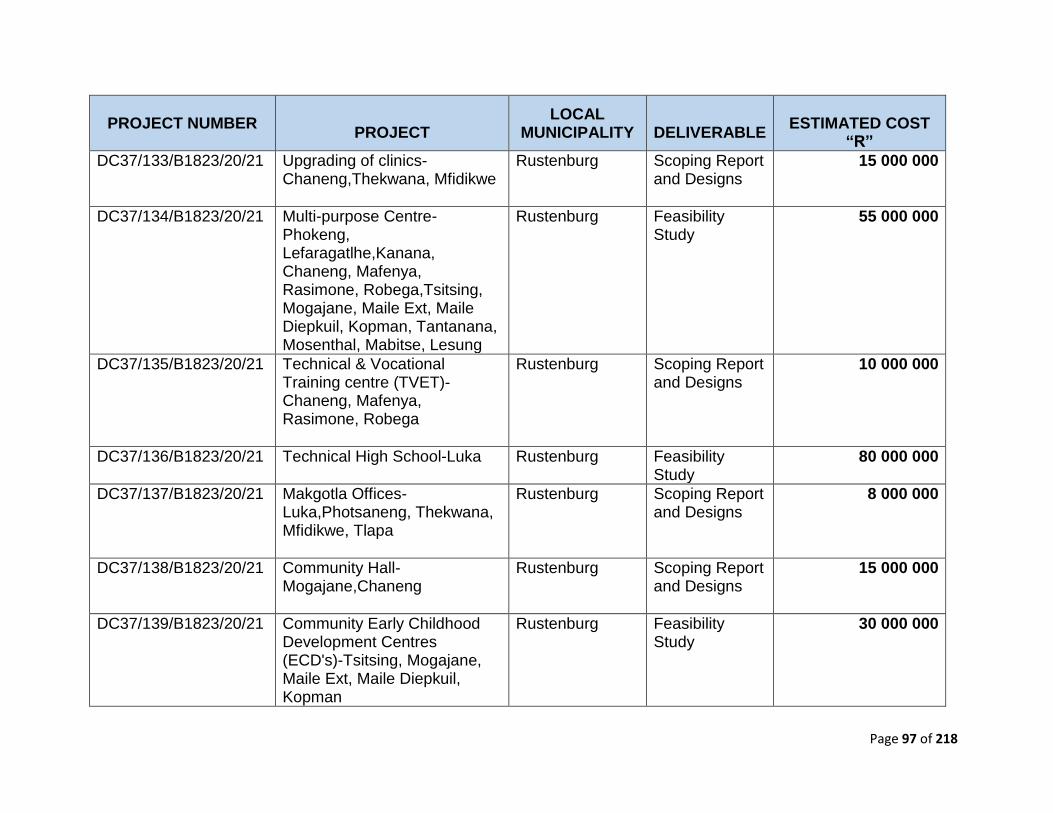
Page 97 of 218
PROJECT NUMBER
PROJECT LOCAL
MUNICIPALITY
DELIVERABLE
ESTIMATED COST
“R”
DC37/133/B1823/20/21 Upgrading of clinics-Chaneng,Thekwana, Mfidikwe
Rustenburg Scoping Report and Designs
15 000 000
DC37/134/B1823/20/21 Multi-purpose Centre-Phokeng, Lefaragatlhe,Kanana, Chaneng, Mafenya, Rasimone, Robega,Tsitsing, Mogajane, Maile Ext, Maile Diepkuil, Kopman, Tantanana, Mosenthal, Mabitse, Lesung
Rustenburg Feasibility Study
55 000 000
DC37/135/B1823/20/21 Technical & Vocational Training centre (TVET)-Chaneng, Mafenya, Rasimone, Robega
Rustenburg Scoping Report and Designs
10 000 000
DC37/136/B1823/20/21 Technical High School-Luka
Rustenburg Feasibility Study
80 000 000
DC37/137/B1823/20/21 Makgotla Offices-Luka,Photsaneng, Thekwana, Mfidikwe, Tlapa
Rustenburg Scoping Report and Designs
8 000 000
DC37/138/B1823/20/21 Community Hall-Mogajane,Chaneng
Rustenburg Scoping Report and Designs
15 000 000
DC37/139/B1823/20/21 Community Early Childhood Development Centres (ECD's)-Tsitsing, Mogajane, Maile Ext, Maile Diepkuil, Kopman
Rustenburg Feasibility Study
30 000 000

Page 98 of 218
PROJECT NUMBER
PROJECT LOCAL
MUNICIPALITY
DELIVERABLE
ESTIMATED COST
“R”
DC37/140/B1823/20/21 Computer School-Kopman Rustenburg Scoping Report and Designs
80 000 000
DC37/141/B1823/20/21 Additional Classrooms at Tlapa Primary
Rustenburg Scoping Report and Designs
3 000 000
DC37/142/B1823/20/21 Bakery/ Confectionery-Phokeng, Lefaragatlhe
Rustenburg Scoping Report and Designs
3 000 000
DC37/143/B1823/20/21 Satellite Police Station Rustenburg Feasibility Study
50 000 000
TOTAL 912 754 450
3. ELECTRICITY PROJECTS
PROJECT NUMBER
PROJECT LOCAL
MUNICIPALITY
DELIVERABLE
ESTIMATED COST “R”
DC37/144/B1823/20/21 Upgrade of electrical main sub-station and mini sub-station in Koster Town
Kgetleng rivier Development of Scoping Reports and Designs
45 000 000
DC37/145/B1823/20/21
Upgrade of electrical main sub-station and mini sub-station in Swatruggens Town
Kgetleng rivier Development of Scoping Reports and Designs
35 000 000
DC37/146/B1823/20/21 Retrofitting of street lights, high mast lights and municipal buildings
Kgetleng rivier Development of Scoping Reports and Designs
30 000 000

Page 99 of 218
PROJECT NUMBER
PROJECT LOCAL
MUNICIPALITY
DELIVERABLE
ESTIMATED COST “R”
DC37/147/B1823/20/21 "Upgrading of the electrical infrastructure-Swartruggens – Koster”
Kgetleng rivier Development of Scoping Reports and Designs
50 000 000
DC37/148/B1823/20/21 Upgrading of existing infrastrucre and new connections and lighting
Moses Kotane Development of Scoping Reports and Designs
135 100 000
DC37/149/B1823/20/21 Installation of Public lighting in various wards 2, 3, 5, 6, 7, 8, 9, 11, 12, 13, 14, 16, 17, 18, 19, 20, 21, 22, 23, 24 and 26- 5434 Households
Moretele Development of Scoping Reports and Designs
100 000 000
DC37/150/B1823/20/21 Electrical reticulation for 185 stands
Rustenburg Development of Scoping Reports and Designs
9 200 000
DC37/151/B1823/20/21 Electricity house connections- 594HH Geelhoutpark
Rustenburg Development of Scoping Reports and Designs
6 831 000
DC37/152/B1823/20/21
Electricity house connections- 6912HH Tlhabane
Rustenburg Development of Scoping Reports and Designs
79 488 000
DC37/153/B1823/20/21 Electricity house connections-1347HH Meriting
Rustenburg Development of Scoping Reports and Designs
15 490 500
DC37/154/B1823/20/21 Electricity house connections – 4653HH Rustenburg town and North
Rustenburg Development of Scoping Reports and Designs
53 509 500
TOTAL 2 284 472 000

Page 100 of 218
4. HOUSING PROJECTS
PROJECT NUMBER
PROJECT LOCAL
MUNICIPALITY
DELIVERABLE
ESTIMATED COST “R”
DC37/155/B1823/20/21 Development of 2500 houses in Reagile Township – 160 square metres
Kgetleng Development of scoping report and Designs
1 400 000 000
DC37/156/B1823/20/21 Development of 300 houses in Redirile Township – 160 square metres
Kgetleng Development of scoping report and Designs
168 000 000
DC37/157/B1823/20/21 Development of 1500 houses in Borelelo Township – 160 square metres
Kgetleng Development of scoping report and Designs
840 000 000
DC37/158/B1823/20/21 Development of 200 houses in Ratsegi township 160 square meters
Kgetleng Development of scoping report and Designs
112 000 000
DC37/159/B1823/20/21 Development of 100 houses in Rodeion – 160 square metres
Kgetleng Development of scoping report and Designs
56 000 000
DC37/160/B1823/20/21 Development of 4170 new houses within Kgetleng rivier local municipality
Kgetleng Development of scoping report and Designs
2 335 200 000
DC37/161/B1823/20/21 Development of 12000 housing units – 160 square meters
Moses Kotane Development of scoping report and Designs
6 720 000 000
DC37/162/B1823/20/21 Dipompong (500 units) Madibeng Development of scoping report and Designs
280 000 000

Page 101 of 218
PROJECT NUMBER
PROJECT LOCAL
MUNICIPALITY
DELIVERABLE
ESTIMATED COST “R”
DC37/163/B1823/20/21 Letlhakaneng (500 Units) Madibeng Development of scoping report and Designs
280 000 000
DC37/164/B1823/20/21 Letlhakaneng : Mmalerato (1000 units)
Madibeng Development of scoping report and Designs
560 000 000
DC37/165/B1823/20/21 Vaalboschsloot (500 units) Madibeng Development of scoping report and Designs
2 80 000 000
DC37/166/B1823/20/21 Fafung (200 units) Madibeng Development of scoping report and Designs
112 000 000
DC37/167/B1823/20/21 Maboloka (500 units) Madibeng Development of scoping report and Designs
280 000 000
DC37/168/B1823/20/21 Jerico (500 units) Madibeng Development of scoping report and Designs
280 000 000
DC37/169/B1823/20/21 Madidi (500 units) Madibeng Development of scoping report and Designs
280 000 000
DC37/170/B1823/20/21 Mmakau ( 1500 Units) Madibeng Development of scoping report and Designs
840 000 000
DC37/171/B1823/20/21 Klipgat (1000 Units) Madibeng Development of scoping report and Designs
560 000 000
DC37/172/B1823/20/21 Hebron Madibeng Development of scoping report and Designs
840 000 000

Page 102 of 218
PROJECT NUMBER
PROJECT LOCAL
MUNICIPALITY
DELIVERABLE
ESTIMATED COST “R”
DC37/173/B1823/20/21 Modderspuruit Mmakau (1500 units)
Madibeng Development of scoping report and Designs
840 000 000
DC37/174/B1823/20/21 Erasmus (1000 Units) Madibeng Development of Scoping report and Designs
560 000 000
DC37/175/B1823/20/21 Tlapa la wa (Damonsvile)-1000 Madibeng Development of Scoping report and Designs
560 000 000
DC37/176/B1823/20/21 Nkandla (Damanosville)-1000 Madibeng Development of Scoping report and Designs
560 000 000
DC37/177/B1823/20/21 Oukasie – Siyahlala (500 Units) Madibeng Development of Scoping report and Designs
280 000 000
DC37/178/B1823/20/21 Bapong (500 Units) Madibeng Development of Scoping report and Designs
280 000 000
DC37/179/B1823/20/21 Bapong Informal (500 Units) Madibeng Development of Scoping report and Designs
280 000 000
DC37/180/B1823/20/21 Sonop (1000 Units) Madibeng Development of Scoping report and Designs
560 000 000
DC/37/181/B1823/20/21 Block I Extension (1000 Units) Madibeng Development of Scoping report and Designs
560 000 000
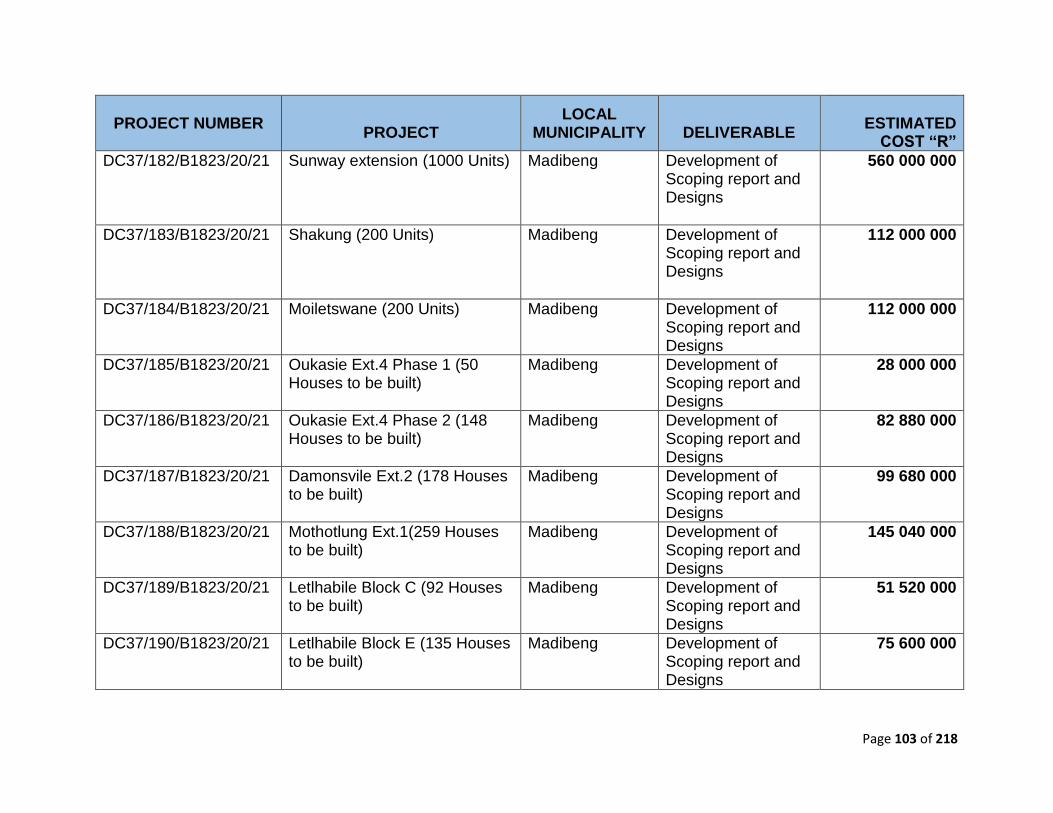
Page 103 of 218
PROJECT NUMBER
PROJECT LOCAL
MUNICIPALITY
DELIVERABLE
ESTIMATED
COST “R”
DC37/182/B1823/20/21 Sunway extension (1000 Units) Madibeng Development of Scoping report and Designs
560 000 000
DC37/183/B1823/20/21 Shakung (200 Units) Madibeng Development of Scoping report and Designs
112 000 000
DC37/184/B1823/20/21 Moiletswane (200 Units) Madibeng Development of Scoping report and Designs
112 000 000
DC37/185/B1823/20/21 Oukasie Ext.4 Phase 1 (50 Houses to be built)
Madibeng Development of Scoping report and Designs
28 000 000
DC37/186/B1823/20/21 Oukasie Ext.4 Phase 2 (148 Houses to be built)
Madibeng Development of Scoping report and Designs
82 880 000
DC37/187/B1823/20/21 Damonsvile Ext.2 (178 Houses to be built)
Madibeng Development of Scoping report and Designs
99 680 000
DC37/188/B1823/20/21 Mothotlung Ext.1(259 Houses to be built)
Madibeng Development of Scoping report and Designs
145 040 000
DC37/189/B1823/20/21 Letlhabile Block C (92 Houses to be built)
Madibeng Development of Scoping report and Designs
51 520 000
DC37/190/B1823/20/21 Letlhabile Block E (135 Houses to be built)
Madibeng Development of Scoping report and Designs
75 600 000

Page 104 of 218
PROJECT NUMBER
PROJECT LOCAL
MUNICIPALITY
DELIVERABLE
ESTIMATED COST “R”
DC37/191/B1823/20/21 Letlhabile Block F (72 Houses to be built)
Madibeng Development of Scoping report and Designs
40 320 000
DC37/192/B1823/20/21 Letlhabile Block G (132 Houses to be built)
Madibeng Development of Scoping report and Designs
73 920 000
DC37/193/B1823/20/21 Lethabong (465 Houses to be built)
Madibeng Development of Scoping report and Designs
260 400 000
DC37/194/B1823/20/21 Refentse (12 Houses to be built)
Madibeng Development of Scoping report and Designs
6 720 000
DC37/195/B1823/20/21 Construction of RDP houses in ward 5, 9, 12, 14, 16, 17, 22, 23, 24 and 26- 12 398 households
Moretele Development of Scoping report and Designs
6 942 880 000
DC37/196/B1823/20/21 Development of 64 536 new housing units
Rustenburg Development of Scoping report and Designs
36 140 160 000
TOTAL 66 354 450 000

Page 105 of 218
5. LOCAL ECONOMIC DEVELOPMENT
PROJECT NUMBER
PROJECT LOCAL
MUNICIPALITY
DELIVERABLE
ESTIMATED COST “R”
DC37/197/B1823/20/21 Rose Geranium and Lucerne Project
Kgetleng rivier Feasibility Study 10 000 000
DC37/198/B1823/20/21 Resuscitation of existing & defunct infrastructure for cooperatives- wards 1,2,3,4 5,6,7&8
Kgetleng rivier Scoping Report and Designs
160 000 000
DC37/199/B1823/20/21 Assist existing emerging farmers and women cooperatives- ward 1,5 and 6
Kgetleng rivier Scoping Report 50 000 000
DC37/200/B1823/20/21 Bankable business plans for all LED programmes Agriculture, Mining & Tourism)
All 5 Local Municipalities
Feasibility Study 2 000 000
DC37/201/B1823/20/21 Feasibility study and development of International Convention Centre
All 5 Local Municipalities
Feasibility Study 500 000 000
DC37/202/B1823/20/21 Development of 64 536 new housing units
Rustenburg Development of Scoping report and Designs
36 140 160 000
DC37/203/B1823/20/21 Feasibility study for post mining All 5 Local Municipalities
Feasibility Study 500 000
DC37/204/B1823/20/21 Promotion of various industrial areas
All 5 Local Municipalities
Feasibility Study 10 000 000
DC37/205/B1823/20/21 Brick yard factories All 5 Local Municipalities
Feasibility Study 50 000 000
DC37/206/B1823/20/21 LED strategy All 5 Local Municipalities
Feasibility Study 1 000 000

Page 106 of 218
PROJECT NUMBER
PROJECT LOCAL
MUNICIPALITY
DELIVERABLE
ESTIMATED COST “R”
DC37/207/B1823/20/21 Investment strategy All 5 Local Municipalities
Feasibility Study 500 000
DC37/208/B1823/20/21 SMME Support through training (retail, agriculture, Tourism, small scale mining)
All 5 Local Municipalities
Feasibility Study 5 000 000
DC37/209/B1823/20/21 SMME Incubation Programme All 5 Local Municipalities
Feasibility Study 6 000 000
DC37/210/B1823/20/21 Spatial Economic Zone All 5 Local Municipalities
Feasibility Study 10 000 000
DC37/211/B1823/20/21 Integrated SMME Database All 5 Local Municipalities
Feasibility Study 2 000 000
DC37/212/B1823/20/21 Training for small scale mining All 5 Local Municipalities
Feasibility Study 20 000 000
DC37/213/B1823/20/21 Sewing projects All 5 Local Municipalities
Feasibility Study 10 000 000
DC37/214/B1823/20/21 Tourism Master Plan All 5 Local Municipalities
Feasibility Study 1 500 000
DC37/215/B1823/20/21 Marketing/ Brand management Strategy
All 5 Local Municipalities
Feasibility Study 1 000 000
DC37/216/B1823/20/21 Tourism information node All 5 Local Municipalities
Feasibility Study 3 000 000
DC37/217/B1823/20/21 Support for tourism establishments
All 5 Local Municipalities
Feasibility Study 5 000 000
DC37/218/B1823/20/21 Tourism routes All 5 Local Municipalities
Feasibility Study 2 000 000
DC37/219/B1823/20/21 Agricultural marketing hubs All 5 Local Municipalities
Feasibility Study 10 000 000
DC37/220/B1823/20/21 Capacity building & Support for cooperatives
All 5 Local Municipalities
Feasibility Study 50 000 000
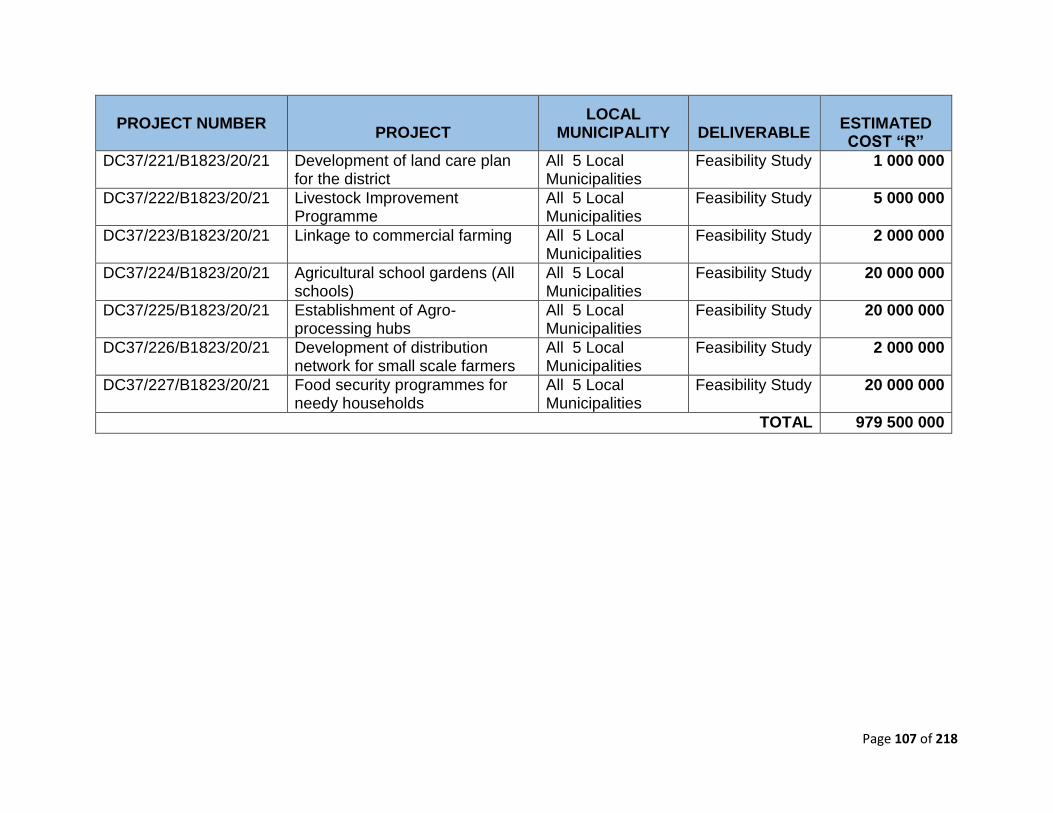
Page 107 of 218
PROJECT NUMBER
PROJECT LOCAL
MUNICIPALITY
DELIVERABLE
ESTIMATED COST “R”
DC37/221/B1823/20/21 Development of land care plan for the district
All 5 Local Municipalities
Feasibility Study 1 000 000
DC37/222/B1823/20/21 Livestock Improvement Programme
All 5 Local Municipalities
Feasibility Study 5 000 000
DC37/223/B1823/20/21 Linkage to commercial farming All 5 Local Municipalities
Feasibility Study 2 000 000
DC37/224/B1823/20/21 Agricultural school gardens (All schools)
All 5 Local Municipalities
Feasibility Study 20 000 000
DC37/225/B1823/20/21 Establishment of Agro- processing hubs
All 5 Local Municipalities
Feasibility Study 20 000 000
DC37/226/B1823/20/21 Development of distribution network for small scale farmers
All 5 Local Municipalities
Feasibility Study 2 000 000
DC37/227/B1823/20/21 Food security programmes for needy households
All 5 Local Municipalities
Feasibility Study 20 000 000
TOTAL 979 500 000
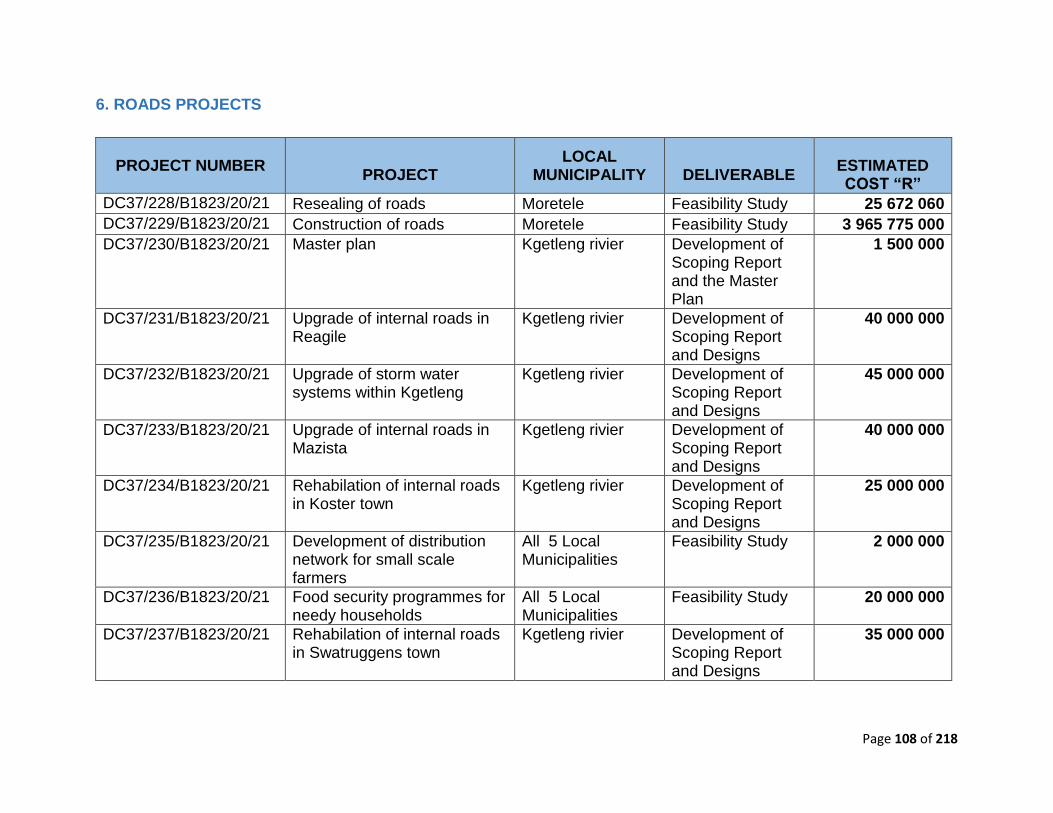
Page 108 of 218
6. ROADS PROJECTS
PROJECT NUMBER
PROJECT LOCAL
MUNICIPALITY
DELIVERABLE
ESTIMATED COST “R”
DC37/228/B1823/20/21 Resealing of roads Moretele Feasibility Study 25 672 060
DC37/229/B1823/20/21 Construction of roads Moretele Feasibility Study 3 965 775 000
DC37/230/B1823/20/21 Master plan Kgetleng rivier Development of Scoping Report and the Master Plan
1 500 000
DC37/231/B1823/20/21 Upgrade of internal roads in Reagile
Kgetleng rivier Development of Scoping Report and Designs
40 000 000
DC37/232/B1823/20/21 Upgrade of storm water systems within Kgetleng
Kgetleng rivier Development of Scoping Report and Designs
45 000 000
DC37/233/B1823/20/21 Upgrade of internal roads in Mazista
Kgetleng rivier Development of Scoping Report and Designs
40 000 000
DC37/234/B1823/20/21 Rehabilation of internal roads in Koster town
Kgetleng rivier Development of Scoping Report and Designs
25 000 000
DC37/235/B1823/20/21 Development of distribution network for small scale farmers
All 5 Local Municipalities
Feasibility Study 2 000 000
DC37/236/B1823/20/21 Food security programmes for needy households
All 5 Local Municipalities
Feasibility Study 20 000 000
DC37/237/B1823/20/21 Rehabilation of internal roads in Swatruggens town
Kgetleng rivier Development of Scoping Report and Designs
35 000 000

Page 109 of 218
PROJECT NUMBER
PROJECT LOCAL
MUNICIPALITY
DELIVERABLE
ESTIMATED COST “R”
DC37/238/B1823/20/21 Rehabilation of internal roads in Borolelo township
Kgetleng rivier Development of Scoping Report and Designs
20 000 000
DC37/239/B1823/20/21 Upgrade of internal roads in Redirile township
Kgetleng rivier Development of Scoping Report and Designs
15 000 000
DC37/240/B1823/20/21 Upgrade of internal roads in Derby township
Kgetleng rivier Development of Scoping Report and Designs
5 000 000
DC37/241/B1823/20/21 Construction of tarred or paved roads. Blading of roads as routine maintenance.-Ratsagae, Magokgoane, Redirele
Kgetleng rivier Development of Scoping Report and Designs
200 000 000
DC37/242/B1823/20/21 Storm water drainage in Borolelo
Kgetleng rivier Development of Scoping Report and Designs
10 000 000
DC37/243/B1823/20/21 Bus Route Infrastructure -162km
All 5 Local Municipalities
Development of Scoping Report and Feasibility Study
275 500 000
DC37/244/B1823/20/21
Non-Motorised Transport- 105km
All 5 Local Municipalities
Development of Scoping Report and Feasibility Study
84 720 000

Page 110 of 218
PROJECT NUMBER
PROJECT LOCAL
MUNICIPALITY
DELIVERABLE
ESTIMATED COST “R”
DC37/245/B1823/20/21 175 Bus Shelter Infrastructure All 5 Local Municipalities
Development of Scoping Report and Feasibility Study
8 022 000
DC37/246/B1823/20/21 Multi-nodal facilities and ranks All 5 Local Municipalities
Development of Scoping Report and Feasibility Study
90 881 450
DC37/247/B1823/20/21 Rehabilitation of Mogwase Internal Roads
Moses Kotane Development of Scoping Report and Designs
90 000 000
DC37/248/B1823/20/21 Eradication of 2148km backlog of road network internal roads
Moses Kotane Development of Scoping Report and Feasibility Study
8 592 000 000
DC37/249/B1823/20/21 Rehabilitation of Madikwe Internal Roads and Stormwater
Moses Kotane Development of Scoping Report and Feasibility Study
35 000 000
DC37/250/B1823/20/21 Eradication of 3867km backlog of road network on provincial roads
Moses Kotane Development of Scoping Report and Feasibility Study
23 202 000 000
DC37/251/B1823/20/21
Mothotlung Bus route Madibeng Development of Scoping Report and Feasibility Study
20 000 000
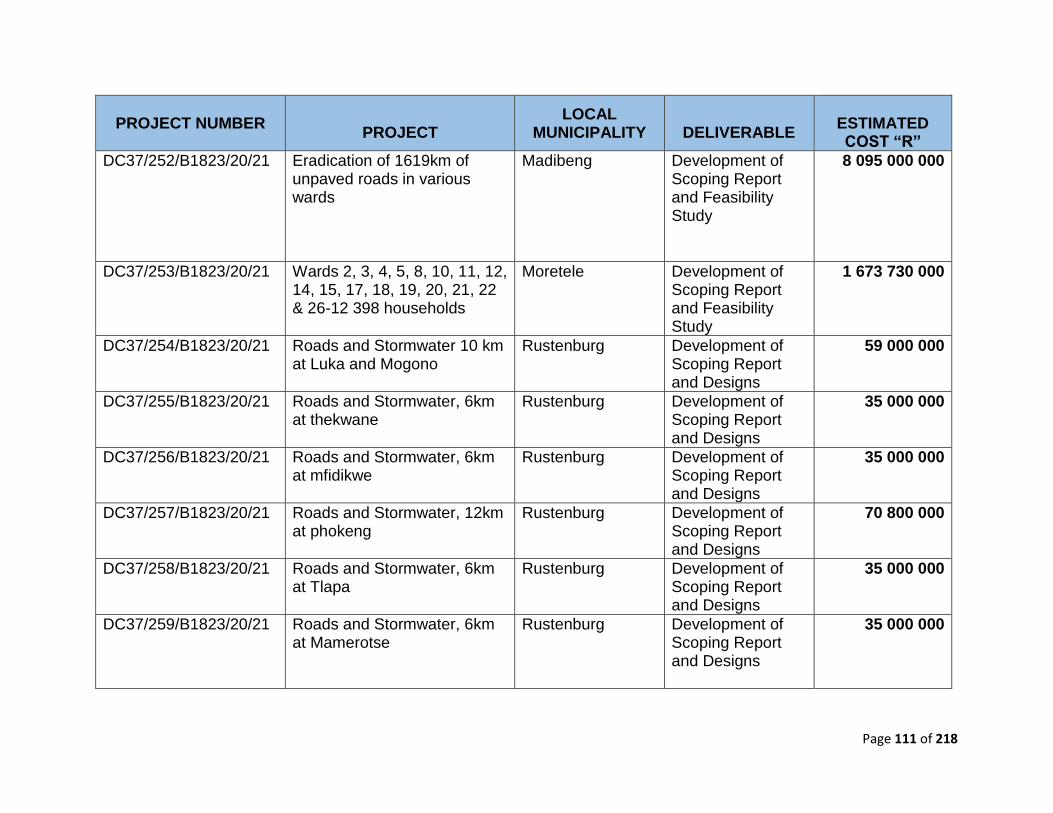
Page 111 of 218
PROJECT NUMBER
PROJECT LOCAL
MUNICIPALITY
DELIVERABLE
ESTIMATED COST “R”
DC37/252/B1823/20/21 Eradication of 1619km of unpaved roads in various wards
Madibeng Development of Scoping Report and Feasibility Study
8 095 000 000
DC37/253/B1823/20/21 Wards 2, 3, 4, 5, 8, 10, 11, 12, 14, 15, 17, 18, 19, 20, 21, 22 & 26-12 398 households
Moretele Development of Scoping Report and Feasibility Study
1 673 730 000
DC37/254/B1823/20/21 Roads and Stormwater 10 km at Luka and Mogono
Rustenburg Development of Scoping Report and Designs
59 000 000
DC37/255/B1823/20/21 Roads and Stormwater, 6km at thekwane
Rustenburg Development of Scoping Report and Designs
35 000 000
DC37/256/B1823/20/21 Roads and Stormwater, 6km at mfidikwe
Rustenburg Development of Scoping Report and Designs
35 000 000
DC37/257/B1823/20/21 Roads and Stormwater, 12km at phokeng
Rustenburg Development of Scoping Report and Designs
70 800 000
DC37/258/B1823/20/21 Roads and Stormwater, 6km at Tlapa
Rustenburg Development of Scoping Report and Designs
35 000 000
DC37/259/B1823/20/21 Roads and Stormwater, 6km at Mamerotse
Rustenburg Development of Scoping Report and Designs
35 000 000

Page 112 of 218
PROJECT NUMBER
PROJECT LOCAL
MUNICIPALITY
DELIVERABLE
ESTIMATED COST “R”
DC37/260/B1823/20/21 Roads and Stormwater, 6km at Tlatseng
Rustenburg Development of Scoping Report and Designs
35 000 000
DC37/261/B1823/20/21 Roads and Stormwater, 4km at Maile Diepkuil
Rustenburg Development of Scoping Report and Designs
23 600 000
DC37/262/B1823/20/21 Reconstruction of roads: Chaneng to Mafenya road, 4km
Rustenburg Development of Scoping Report and Designs
23 600 000
DC37/263/B1823/20/21 Reconstruction of roads: Mogono N4 road to Sun City, 11km
Rustenburg Development of Scoping Report and Designs
64 900 000
DC37/264/B1823/20/21 Storm water reticulation in Phokeng
Rustenburg Development of Scoping Report and Designs
40 000 000
DC37/265/B1823/20/21 Tshwara Pedestrian bridge Rustenburg Development of Scoping Report and Designs
20 000 000
DC37/266/B1823/20/21 Rustenburg RRT Project Rustenburg Construction 1 500 000 000
TOTAL 48 571 600 510

Page 113 of 218
7. SANITATION
PROJECT NUMBER
PROJECT LOCAL
MUNICIPALITY
DELIVERABLE
ESTIMATED COST “R”
DC37/267/B1823/20/21 Rietfontein Waste Water Treatment
Kgetleng rivier Development of Scoping Report, Feasibility Study
57 000 000
DC37/268/B1823/20/21 Sewer outfall line from Refentse to Rietfontein
Kgetleng rivier Development of Scoping Report, Feasibility Study
30 000 000
DC37/269/B1823/20/21 New Koster Waste Water Treatment Works
Kgetleng rivier Development of Scoping Report, Feasibility Study
110 000 000
DC37/270/B1823/20/21 Construction of a new sewer internal reticulation network-Swartruggens
Kgetleng rivier Development of Scoping Report, Feasibility Study
25 000 000
DC37/271/B1823/20/21 Refurbishment of sewer pump stations-Reagile
Kgetleng rivier Development of Scoping Report, Feasibility Study
4 000 000

Page 114 of 218
PROJECT NUMBER
PROJECT LOCAL
MUNICIPALITY
DELIVERABLE
ESTIMATED COST “R”
DC37/272/B1823/20/21 "Construction of VIP toilets-Magokgoane, Moedwil/Ratsagae”
Kgetleng rivier Development of Scoping Report and Designs
2 000 000
DC37/273/B1823/20/21 Upgrading of Mogwase WWTW from 4ml/d to 10Ml/d
Moses Kotane Development of Scoping Report and Designs
55 000 000
DC37/274/B1823/20/21 Rural Sanitation Programme in Various Villages-43506 Households
Moses Kotane Development of Scoping Report and Designs
326 295 000
DC37/275/B1823/20/21 Afsaal Septic Tanks Madibeng Development of Scoping Report and Designs
289 340
DC37/276/B1823/20/21 Rietfontein Wastewater Treatment plant
Madibeng Development of Scoping Report and Designs
57 000 000
DC37/277/B1823/20/21 Letlhabile Waste Water Treatment Plant
Madibeng Development of Scoping Report and Designs
11 000 000
DC37/278/B1823/20/21 Brits Wastewater Treatment Plant
Madibeng Development of Scoping Report and Designs
5 500 000
DC37/279/B1823/20/21 Mothotlung Waste Water Treatment Works
Madibeng Development of Scoping Report and Designs
11 000 000
DC37/280/B1823/20/21 Xanadu Pump Station Madibeng Development of Scoping Report and Designs
1 100 000
DC37/281/B1823/20/21 Yacht Club Pump Station Madibeng Development of Scoping Report and Designs
800 000

Page 115 of 218
PROJECT NUMBER
PROJECT LOCAL
MUNICIPALITY
DELIVERABLE
ESTIMATED COST “R”
DC37/282/B1823/20/21 Elandsrand Pump Station X 4 Madibeng Development of Scoping Report and Designs
1 200 000
DC37/283/B1823/20/21 Brits Small Pump Stations X 12 Madibeng Development of Scoping Report and Designs
3 600 000
DC37/284/B1823/20/21 Damonsville Pump Station Madibeng Development of Scoping Report and Designs
300 000
DC37/285/B1823/20/21 Lethlabile Pump Station/ Block I Madibeng Development of Scoping Report and Designs
300 000
DC37/286/B1823/20/21 Eradication of sanitation backlogs of 93938 households
Madibeng Development of Scoping Report and Designs
4 696 900 000
DC37/287/B1823/20/21 Wards 4, 6, 7, 10, 11, 16, 17, 18, 19, 21, 22, 33408 households
Moretele Development of Scoping Report and Designs
1 670 400 000
DC37/288/B1823/20/21 Construction of internal sewerage connection for 3500 units in Mmotla
Moretele Feasibility Study
54 337 500 000
DC37/289/B1823/20/21 Upgrading of Swartdam Wastewater Treatment Works
Moretele Feasibility Study
40 000 000
DC37/290/B1823/20/21 Upgrading of Motla Sewer Reticulation
Moretele Feasibility Study
15 000 000

Page 116 of 218
PROJECT NUMBER
PROJECT LOCAL
MUNICIPALITY
DELIVERABLE
ESTIMATED COST “R”
DC37/291/B1823/20/21 Mathibestad Sewer and Water Reticulation
Moretele Feasibility Study
20 000 000
DC37/292/B1823/20/21 Construction of 5000 sanitation units in various wards
Moretele Feasibility Study
40 000 000
DC37/293/B1823/20/21 Regional Sewer Plant and Bulk Line, Chaneng, Phokeng and Luka
Rustenburg Development of Scoping Report, Feasibility Study
345 000 000
DC37/294/B1823/20/21 Sewer reticulation, Chaneng, Phokeng and Luka
Rustenburg Development of Scoping Report, Feasibility Study
947 000 000
DC37/295/B1823/20/21 Photsaneng/Mfidikwe Bulk Sewer Line
Rustenburg Development of Scoping Report, Feasibility Study
28 000 000
DC37/296/B1823/20/21 Eradication of 36 047 households with sanitation connections
Development of Scoping Report and Designs
1 802 350 000
TOTAL 10 191 034 340

Page 117 of 218
8. WATER PROJECTS
PROJECT NUMBER
PROJECT LOCAL
MUNICIPALITY
DELIVERABLE
ESTIMATED COST
“R”
DC37/297/B1823/20/21 Bulk raw water supply system from the Koster Dam to the Koster WTW
Kgetleng rivier Development of Scoping report, Feasibility Study and Design Development
16 000 000
DC37/298/B1823/20/21 1.2 ML Steel Reservoir in Witrand
Kgetleng rivier Development of Scoping report and Design Development
6 000 000
DC37/299/B1823/20/21 Configure the pipe network Kgetleng rivier Development of Scoping report and Design Development
19 000 000
DC37/300/B1823/20/21 Replacement of AC pipelines Kgetleng rivier Development of Scoping report and Design Development
55 000 000
DC37/301/B1823/20/21 Installation of water meters Kgetleng rivier Development of Scoping report and Design Development
20 000 000

Page 118 of 218
PROJECT NUMBER
PROJECT LOCAL
MUNICIPALITY
DELIVERABLE
ESTIMATED COST
“R”
DC37/302/B1823/20/21 Development of groundwater supply system
Kgetleng rivier Development of Scoping report and Feasibility Study
21 000 000
DC37/303/B1823/20/21 Upgrading of Swartruggens water plant and cleaning of the dam
Kgetleng rivier Development of Scoping report and Feasibility Study
200 000 000
DC37/304/B1823/20/21 Augmentation refurbishment of boreholes in Derby & Redirile
Kgetleng rivier Development of Scoping report, Feasibility Study and Design Development
10 000 000
DC37/305/B1823/20/21 Construction of reservoir Extension 8, which will accommodate 1700 households.
Kgetleng rivier Development of Scoping report and Design Development
8 000 000
DC37/306/B1823/20/21 Upgrading of Pella Water Works from 1.4 Ml/d to 5Ml/d
Moses Kotane Development of Scoping report and Design Development
60 000 000
DC37/306/B1823/20/21 Upgrading of Madikwe Water Works from 4Ml/d to 8Ml/d
Moses Kotane Development of Scoping report and Design Development
30 000 000

Page 119 of 218
PROJECT NUMBER
PROJECT LOCAL
MUNICIPALITY
DELIVERABLE
ESTIMATED COST
“R”
DC37/307/B1823/20/21 Replacement of Aged Water Infrastructure (Mogwase)
Moses Kotane Development of Scoping report and Design Development
45 000 000
DC37/308/B1823/20/21 Replacement of Aged Water Infrastructure (Madikwe)
Moses Kotane Development of Scoping report and Design Development
18 000 000
DC37/309/B1823/20/21 Extending bulk water supply from Mabeskraal to Uitkyk
Moses Kotane Development of Scoping report and Design Development
85 000 000
DC37/310/B1823/20/21 Water reticulation and bulk augmentation (Manamakgotheng Area) New Section
Moses Kotane Development of Scoping report and Design Development
35 000 000
DC37/311/B1823/20/21 Testing and commissioning of boreholes, storage tanks and bulk water lines to 69 villages
Moses Kotane Development of Scoping report and Design Development
583 060 400
DC37/312/B1823/20/21 Development of Molatedi Dam as a Bulk Water Supply Scheme
Moses Kotane Development of Scoping report, Feasibility Study and Design Development
1 500 000 000
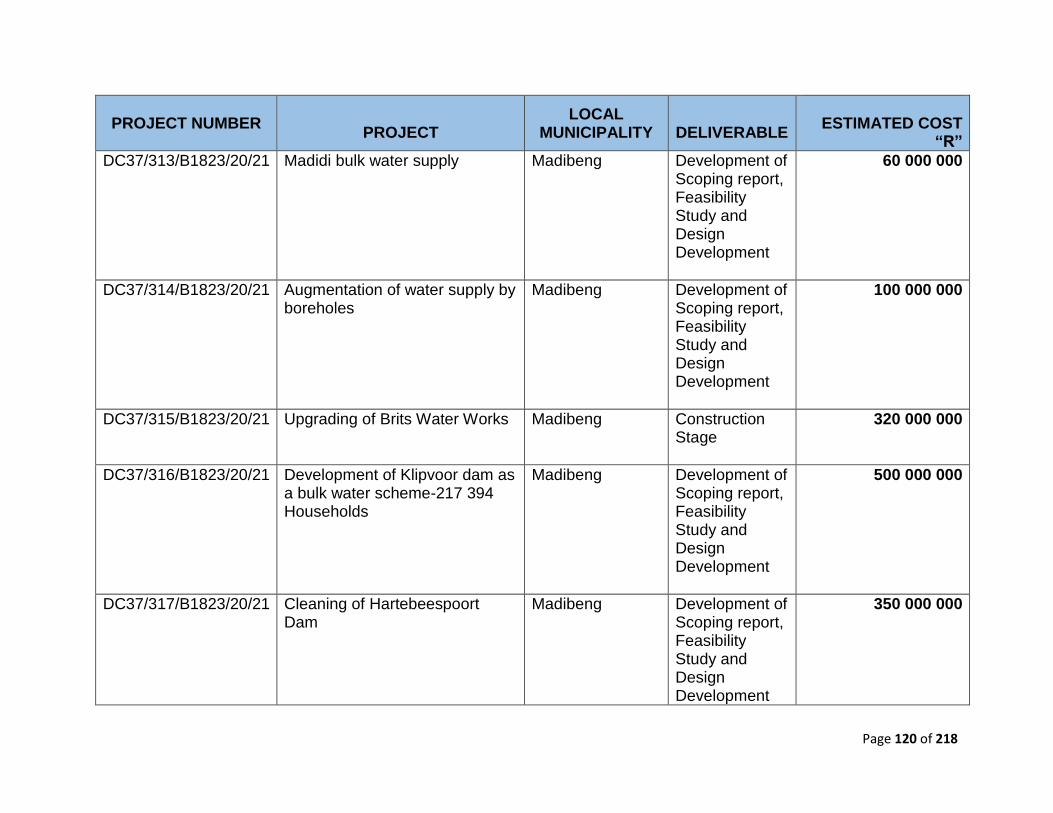
Page 120 of 218
PROJECT NUMBER
PROJECT LOCAL
MUNICIPALITY
DELIVERABLE
ESTIMATED COST
“R”
DC37/313/B1823/20/21 Madidi bulk water supply Madibeng Development of Scoping report, Feasibility Study and Design Development
60 000 000
DC37/314/B1823/20/21 Augmentation of water supply by boreholes
Madibeng Development of Scoping report, Feasibility Study and Design Development
100 000 000
DC37/315/B1823/20/21 Upgrading of Brits Water Works Madibeng Construction Stage
320 000 000
DC37/316/B1823/20/21 Development of Klipvoor dam as a bulk water scheme-217 394 Households
Madibeng Development of Scoping report, Feasibility Study and Design Development
500 000 000
DC37/317/B1823/20/21 Cleaning of Hartebeespoort Dam
Madibeng Development of Scoping report, Feasibility Study and Design Development
350 000 000

Page 121 of 218
PROJECT NUMBER
PROJECT LOCAL
MUNICIPALITY
DELIVERABLE
ESTIMATED COST
“R”
DC37/318/B1823/20/21 Klipdrift bulk water supply- Moretele South
Moretele Development of Scoping report, Feasibility Study and Design Development
260 000 000
DC37/319/B1823/20/21 Wards 1, 2, 5, 7, 14, 15, 16, 17, 20 to 26 water supply- 14016 households
Moretele Development of Scoping report, Feasibility Study and Design Development
700 800 000
DC37/320/B1823/20/21 Development of Klipvoor dam as a Bulk Water Supply Scheme
Moretele Development of Scoping report, Feasibility Study and Design Development
500 000 000
DC37/321/B1823/20/21 Madubu bulk supply line Rustenburg Development of Scoping report and Design Development
8 600 000
DC37/322/B1823/20/21 Kgale East bulk supply line Rustenburg Development of Scoping report and Design Development
5 400 000
DC37/323/B1823/20/21 Kgale West bulk supply line Rustenburg Development of Scoping report and Design Development
5 400 000

Page 122 of 218
PROJECT NUMBER
PROJECT LOCAL
MUNICIPALITY
DELIVERABLE
ESTIMATED COST
“R”
DC37/324/B1823/19/20 Kanana Booster Pump Rustenburg Development of Scoping report and Design Development
8 000 000
DC37/325/B1823/19/20 Luka/Mogono Bulk water line Rustenburg Development of Scoping report and Design Development
28 000 000
DC37/326/B1823/19/20 Eradication of 27 191 households with water connection
Rustenburg Development of Scoping report and Design Development
1 359 550 000
TOTAL 6 916 810 400

Page 123 of 218
9. SPATIAL PLANNING, LAND USAGE AND INSTITUTIONAL DEVELOPMENT
PROJECT NUMBER
PROJECT LOCAL
MUNICIPALITY
DELIVERABLE
ESTIMATED COST
“R”
DC37/327/B1823/20/21 SPLUMA Implementation All 5 local municipalities
Implementation Report
10 000 000
DC37/328/B1823/20/21 SDF Implementation All 5 local municipalities
Implementation Report
10 000 000
DC37/329/B1823/20/21 Spatial Planning awareness sessions
All 5 local municipalities
Report 500 000
DC37/330/B1823/20/21 Review of Budget and IDP
All 5 local municipalities
Reviewed IDP and Budget
2 000 000
DC37/331/B1823/20/21 Strategic Planning Cessions
All 5 local municipalities
District Strategic Planning Report
1 000 000
DC37/332/B1823/20/21 IDP awareness sessions
All 5 local municipalities
Report 2 000 000
TOTAL 25 500 000

Page 124 of 218
SECTION 3: IDP PLANNING PROCESS
THE PLANNING PROCESS The Integrated Development Planning (IDP) Process is a process through which
Municipalities prepare strategic development plans for a five-year period. An IDP is one
of the key tools for Local Government to cope with its developmental role and seeks to
arrive at decisions on issues such as Municipal budgets, land management, promotion
of local economic development, and institutional transformation in a consultative,
systematic and strategic manner.
According to the Municipal Systems Act (MSA) of 2000, all municipalities have to
undertake a process to produce IDP’s. As the IDP is a legislative requirement it has a
legal status and it supersedes all other plans that guide development at local government
level.
The budget is the annual plan in Rands and cents that sets out the amounts each
Department can spend on specific pre-determined items. The legislation governing the
drawing up of the budget is the Municipal Finance Management Act (No. 56 of 2003).
The relevant Sections of the Act setting out the different timeframes are as follows:
Section 21(1)(b) – The Mayor must at least 10 months before the start of the budget year
1 September table in the Council a time schedule outlining key deadlines for:-
(i) The preparation, tabling and approval of the annual budget;
(ii) The annual review of:-
a) The integrated development plan in terms of section 34 of the Systems Act and
the budget related policies
(iii) The tabling and adoption of any amendments to the integrated development plan and
the budget related policies.

Page 125 of 218
Section 16(2) – The Mayor must table the annual budget at a Council meeting at least 90
days before the start of the budget year. Section 24(1) – The Council must at least 30
days before the start of the budget year (1 June) consider approval of the annual budget.
Section 24(2) (a) – The annual budget must be approved before the start of the budget
year (1 July).
The Municipal Finance Management Act provides for an adjustment budget which is a
review of the current budget and would normally take place mid-way through the budget
cycle i.e. December or January.
Figure 1: Abridged IDP Process
The function of the District IDP Framework is to ensure that the process of the district IDP
and local IDP’s are mutually linked and can inform each other ensuring co-operative
governance as contained in section 41 of the Constitution.
Quarter 1: Framework & Process Plan developed &
approved by Council
Quarter 2: IDP Rep Forums convened; Preliminary Drafts of IDP document developed
Quarter 3: Annual Report tabled, s 72 Report &
Adjustment Budgets tabled & approved by Council;
Quarter3: Drafts IDP/Budget tabled before Council
Quarter 4: IDP Rep Forums & Internal consultations on
Drafts IDP & Budgets;
Quarter 4: Consultations with Stakeholders, and
approval of IDP & Budget

Page 126 of 218
The District IDP Framework is a co-ordination tool for the district to ensure that
interrelated parallel planning processes within the district are coordinated to obtain
maximum benefit for the district as a whole.
Various processes within the IDP should be smoothly interlinked to ensure optimal
effectiveness as well as ensure this agreement on joint time frameworks that need
to be reached between the various local municipalities and the district municipality.
The District Municipality is in charge of the District IDP Framework, which has to be
agreed upon by all local municipalities and will be used by the local municipalities in
finalising their Process Plans.
The District Municipality will, through inter-municipal IDP Management Committee
(MC) monitor the compliance of the actual IDP process of all municipalities with the
District IDP Framework. This will ensure that the District Municipality will be in a
position to undertake corrective action in time if a Local Municipality fail to adhere to
the District IDP Framework and the timeframes contained therein.
Each Local Municipality will, however, be responsible for monitoring its own process
plan and ensure that the Framework Plan is being followed as agreed:
Rustenburg;
Kgetleng Rivier;
Moretele;
Madibeng; and
Moses Kotane
Each municipality has an IDP Manager to steer the local IDP process within that
municipality.

Page 127 of 218
ROLES AND RESPONSIBILITIES OF VARIOUS KEY ROLE PLAYERS
The main roles and responsibilities allocated to each of the internal and external role
players relating specifically to the IDP Review Process are set out in the table below.
COUNCIL
Make final decisions
Consider and adopt process plan
Consider, adopt and approve the IDP/Budget before
the start of the financial year
Approves unforeseen and unavoidable expenses
EXECUTIVE
MAYOR
Manage the drafting of the IDP review.
Assign responsibilities in this regard to the Municipal Manager.
Submit the District framework plan and process plan to the Council for adoption;
Submit the draft reviewed IDP to the Council for adoption and approval;
The responsibility for managing the draft of the IDP is assigned to the office of the Municipal Manager;
MUNICIPAL
MANAGER
Municipal Manager has the following
responsibilities, that are assigned to the official
responsible for IDP
Preparation of the process plan;
Day to day management and coordination of the
IDP process in terms of the time, resources and
people, and ensuring: The involvement of all
relevant role-players, officials especially
management officials.

Page 128 of 218
MUNICIPAL
MANAGER
Municipal Manager has the following
responsibilities, that are assigned to the official
responsible for IDP
Preparation of the process plan;
Day to day management and coordination of the
IDP process in terms of the time, resources and
people, and ensuring: The involvement of all
relevant role-players, officials especially
management officials.
IDP MANAGER
Day to day management of the IDP process. Co-
ordination and facilitation of IDP Review Process.
IDP/BUDGET
STEERING
COMMITTEE
Assist and support the Municipal Manager/ IDP Manager
Information ‘GAP’ identification.
Oversee the alignment of the planning process internally with those of the local municipality areas.
MUNICIPAL
OFFICIALS
Provide technical/sector expertise.
Receive sector plans through Office of the Premier
and consolidate into the IDP report.

Page 129 of 218
Planning Professionals/
ALIGNMENT WITH NATIONAL AND PROVINCIAL POLICY CONTEXT
The development challenges facing government in general and municipalities in particular
requires alignment of plans in order to support the goals of government of eradicating
poverty, unemployment and inequality. In this section Bojanala Platinum District
Municipality highlight the plans that the district municipality and its constituent local
municipalities must align to respond to the national planning imperatives.
National Development Plan
The National Development Plan is a direct response to the finding of the Commission’s
Diagnostic Report, released in June 2011, which among others found that as a country,
South Africa is still faced with serious challenges, which affect the government capacity
to deliver on its promise of a better life for all. The Commission’s findings on the
government’s shortcomings include:
Too few people work
The quality of school education for black people is poor
Infrastructure is poorly located, inadequate and under-maintained
SECTOR
DEPARTMENTS
Provide sector information.
Alignment of budgets with the IDP.
Provide sector budget.
Provide professional and technical support.
IDP REP FORUM
Representing stakeholder interest and contributing knowledge and ideas into the IDP.
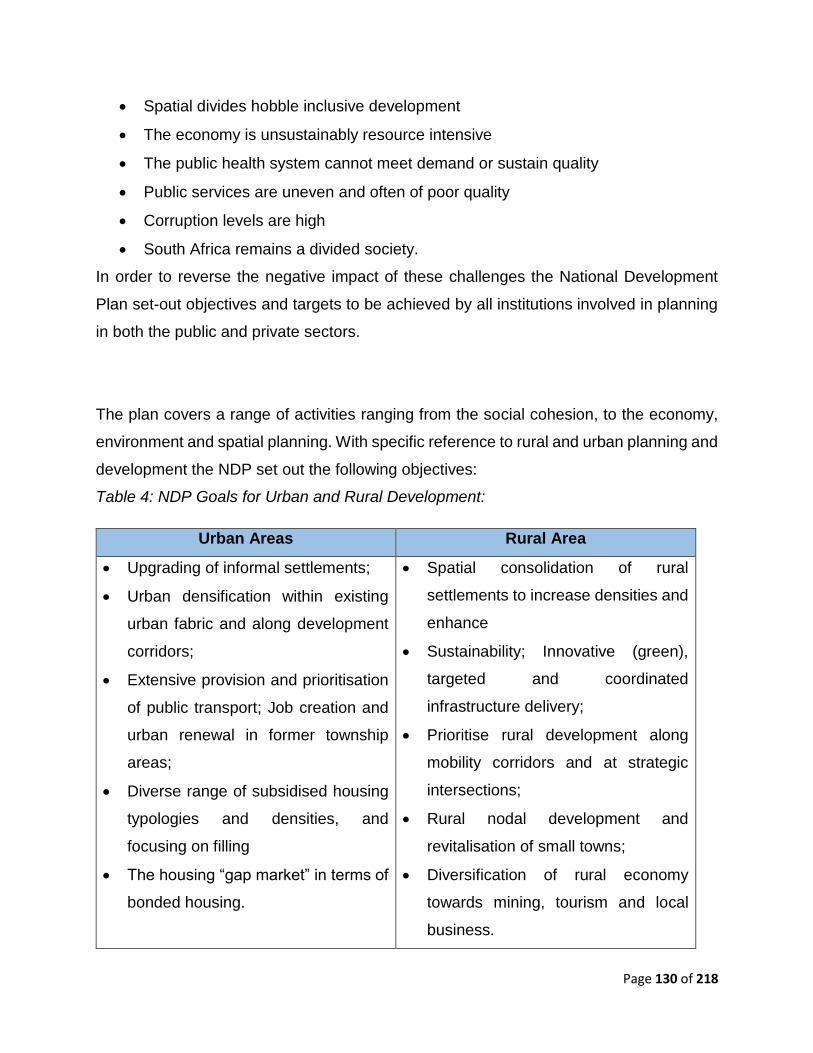
Page 130 of 218
Spatial divides hobble inclusive development
The economy is unsustainably resource intensive
The public health system cannot meet demand or sustain quality
Public services are uneven and often of poor quality
Corruption levels are high
South Africa remains a divided society.
In order to reverse the negative impact of these challenges the National Development
Plan set-out objectives and targets to be achieved by all institutions involved in planning
in both the public and private sectors.
The plan covers a range of activities ranging from the social cohesion, to the economy,
environment and spatial planning. With specific reference to rural and urban planning and
development the NDP set out the following objectives:
Table 4: NDP Goals for Urban and Rural Development:
Urban Areas Rural Area
Upgrading of informal settlements;
Urban densification within existing
urban fabric and along development
corridors;
Extensive provision and prioritisation
of public transport; Job creation and
urban renewal in former township
areas;
Diverse range of subsidised housing
typologies and densities, and
focusing on filling
The housing “gap market” in terms of
bonded housing.
Spatial consolidation of rural
settlements to increase densities and
enhance
Sustainability; Innovative (green),
targeted and coordinated
infrastructure delivery;
Prioritise rural development along
mobility corridors and at strategic
intersections;
Rural nodal development and
revitalisation of small towns;
Diversification of rural economy
towards mining, tourism and local
business.

Page 131 of 218
As a predominantly rural area, Bojanala Platinum District Municipality will respond
adequately to the directives above to ensure that the rural areas are turned into vibrant
economies, while urban development is also supported.
Outcome Approach
From the development focus of the MTSF the government has derived twelve outcome
areas that set the guidance for more results-driven performance. The TWELVE KEY
OUTCOMES that have been identified and agreed to by the Cabinet are:
1. Improved quality of basic education
2. A long and healthy life for all South Africans
3. All people in South Africa are and feel safe
4. Decent employment through inclusive economic growth
5. A skilled and capable workforce to support an inclusive growth path
6. An efficient, competitive and responsive economic infrastructure network
7. Vibrant, equitable and sustainable rural communities with food security for all
8. Sustainable human settlements and improved quality of household life
9. A responsive, accountable, effective and efficient local government system
10. Environmental assets and natural resources that are well protected and
continually enhanced
11. Create a better South Africa and contribute to a better and safer Africa and word
12. An efficient, effective and development oriented pubic service and an
empowered, fair and inclusive citizenship
Out of the outcomes above, Outcome 9 is closest to local government. In order to
achieve the vision of a “Responsive, accountable, effective and efficient local
government system”, seven outputs have been identifies and are as follows”

Page 132 of 218
Table 5: Government's Outcomes
In addition, the IDP also considers the emerging national and provincial long term
strategic plans as encapsulated in the National Development Plan.
Nine (9) Point Plan
The nine point plan was announced during the 2015 state of the Nation Address by
President Jacob Zuma as part of the government’s strategy to implement the NDP.
Among others the nine point plan focus on critical areas such as energy, tourism,
agriculture, boosting SMMES, science and technology, industrialisation and transport.
The components of the nine point plan include:
a) Resolving the energy challenge
b) Revitalising agriculture and the agro-processing value chain
c) Advancing beneficiation or adding value to the mineral wealth
d) More effective implementation of a higher impact Industrial Action Policy Action
Plan (IPAP)
e) Encouraging private-sector investment
f) Moderating workplace conflict
g) Unlocking the potential of SMMEs, cooperatives, townships and rural enterprises
Outputs for Outcome 9
Output 1: Implement a differentiated approach to municipal financing, planning and
support
Output 2: Improving access to basic services
Output 3: Implementation of the Community Work Programme
Output 4: Actions supportive of the human settlement outcome
Output 5: Deepen democracy through a refined Ward Committee Model
Output 6: Administrative and financial capability
Output 7: Single window of coordination

Page 133 of 218
h) State reform and boosting the role of state-owned companies, science, technology
and innovation, information and communications technology infrastructure or
broadband roll-out, water, sanitation and transport infrastructure
i) Operation Phakisa, which is aimed at growing the ocean economy and other
sectors
Although the nine point plan is led by national departments, the local government, as the
sphere closest communities play an important role in its realisation, hence the need for
the IDP to take cognisance of the plan.
Page 134 of 218
SECTION 4: GOVERNANCE AND INSTITUTIONAL ARRANGEMENTS
This section covers how the municipality’s council structures are arranged to facilitate
seamless service delivery and at the same time promoting accountability and good
governance.
Bojanala Platinum District Municipality is a category C municipality, with five local
municipalities in its area of jurisdiction. The district council is a mayoral executive type of
municipality, which is headed by the Executive Mayor.
This chapter reflects the district municipality’s governance model with details on the roles
and responsibilities of its various political and administrative structures.
District Governance Model
The district’s governance structure is made up of the political and administrative wings.
The two wings of Council exist as separate and distinctive parts, but they are all
complementary and inter-dependent. The role of council is legislative and oversight, while
the administrative wing is responsible for the day to day running of the business of the
municipality.
Bojanala Platinum District Municipality regards a good working relationship between the
administration and the politicians as a prerequisite for the management of the interface
between the two structures. The roles of each structure are clearly defines and conflicts
or turf wars do not surface.
The diagram below illustrates the governance and accountability relationships between
the political and administrative structures within Bojanala Platinum District Municipality.

Page 135 of 218
Council’s Political Structure
Council
The municipal council is responsible for ensuring that the municipality performs its
mandate as contained in section 152 of the constitution. The council also plays a
legislative and oversight role over the administration, which include but is not limited to:
Pass by-laws
Approve the IDP and budgets and development plans
Impose rates and other taxes
Charge service fees
Impose fines
Borrow money
Appoint staff
The current council of Bojanala Platinum District Municipality is constituted by seventy
(70) Councillors, who were elected and sworn-in in August 2016. The following political
parties are represented in the district council:
African National Congress (39),
Economic Freedom fighters (16),
Community
Council
Executive Mayor
Municipal Manager
Administration
Po
licy a
nd
Dire
ctio
n
Acco
un
tab
ility

Page 136 of 218
Democratic Alliance (12)
African Independent Congress (1)
Forum 4 Service Delivery (3)
Of the 70 councillors in council, 28 were directly elected, while 42 were seconded from
the five local municipalities as reflected in the table below:
Municipality Number
BPDM 28
Rustenburg Local Municipality 16
Madibeng Local Municipality 13
Moretele Local Municipality 5
Moses Kotane Local Municipality 7
Kgetleng Rivier 1
In line with section 81 of the Municipal Structures Act, 1998, which provides for the
participation of recognised Traditional Leaders in municipal councils, Bojanala Platinum
District Municipality has 10 Traditional Leaders who serve in its council. The Traditional
Leaders do not have the power to vote.
Executive Mayor
The Executive Mayor of Bojanala Platinum District Municipality is Councillor Fetsang
Molosiwa, who was elected by the majority of councillors at the first sitting of the current
council, held on 26th August 2016. The role and functions of the Executive Mayor are
contained in section 56 of the Municipal Structures Act and Chapter 7 of the MFMA. A
brief summary of these powers and functions of the Executive Mayor include:
Identify the needs of the municipality and recommend to Council strategies,
programmes and services to address such needs;
Page 137 of 218
identify and develop criteria for the evaluation of strategies, programmes and services
implemented to address needs of the municipality;
evaluate progress against key performance indicators;
review the performance of the municipality in terms of its:
o economy, efficiency and effectiveness;
o credit control and debt collection efficiency;
monitor the management of Administration;
oversee the sustainable provision of services to communities;
reports annually on the involvement of communities and community organisations in
the affairs of the municipality;
Gives attention to the public views and report on the effect of consultation on the
decisions of council.
providing general political guidance of the fiscal and financial affairs of the
municipality;
monitoring and overseeing the performance of the Accounting Officer taking all
reasonable steps to ensure the municipality performs its Constitutional and statutory
functions
report quarterly to council on the implementation of the budget and the financial state
of affairs of the municipality;
performing any other powers and duties that me be delegated by Council;
Council may from time to time delegate powers and functions to the Executive Mayor.
The Executive Mayor may also delegate some of her functions to the accounting officer
or to members of the Mayoral Committee in line with council’s Delegations of Authority.
Speaker
The speaker of council is Councillor, Emma Tanke. The role of the Speaker is to preside
over the meetings of council in line with the Municipal Structures Act and council’s rules
of order. Other responsibilities of the Speaker include to enforce the Code of Conduct

Page 138 of 218
and to provide information and recommendations to the Municipal Council with respect to
the role of Council; and
Council or the Executive Mayor may also delegate some functions to the speaker in line
with the municipality’s delegation of powers.
Council Single Whip
The Single Whip, Councillor Patrick Tlhapi is responsible for maintaining order and
discipline among councillors and for the creation of a multiparty platform for interaction in
council. The single-whip performs his functions in close cooperation with the Speaker.
Mayoral Committee
The members of the Mayoral Committee are appointed by the Executive Mayor from
among the members of the council. The Mayoral committee consists of the Executive
Mayor, and ten (10) members. The role of the Mayoral Committee is to assist the
Executive Mayor in the execution of her duties. Since members of the Mayoral Committee
serve at the prerogative of the Executive Mayor, the Executive Mayor also has the power
to dismiss a member from the Mayoral Committee.
Section 79 Committees
Section 79 committees are established by council in terms of section 79 of the Municipal
Structures Act. The committees are primarily established to assist council in performing
its oversight role. Bojanala Platinum District Municipality has established the Municipal
Public Accounts Committee.

Page 139 of 218
Portfolio committees
The Executive Mayor has established the following committees (Portfolio Committee) in
terms of Section 80 of the Local Government: Municipal Structures Act No. 117 of 1998.
The role of these committees is to assist the Executive Mayor in the performance of her
function of playing oversight over the administration. Each of the portfolio committees is
headed by a councillor, who is a member of the Mayoral Committee. The list of the
portfolio committees and their chairpersons is reflected in the table below:
Table 6: List of Committees and Chairpersons
Name of Committee Chairperson
IDP, PMS & Public Participation Cllr Nicholas Rakolle
Gender, HIV/AIDS, Youth & Disability (Special
Projects) Cllr Lucky Malope
Budget & Treasury Cllr Violet Maluleka
Sport, Arts and Culture Cllr Vincent Moche
Corporate Support Services Cllr Matshidiso Papa
Local Economic Development Cllr Lucky Moate
Agriculture & Rural Development Cllr Dotty Tlabyane
Technical Services Cllr Lucky Madiba
Community Development Services Cllr Jacob Kgarimetsa
Health & Environmental Services Cllr Berverly Mantsho
Political Party Whips
Party Whips are representatives of all the political parties represented in the council of
the district municipality. The whips are responsible for managing party representatives in
council and for the coordination of the relationship of different political parties.
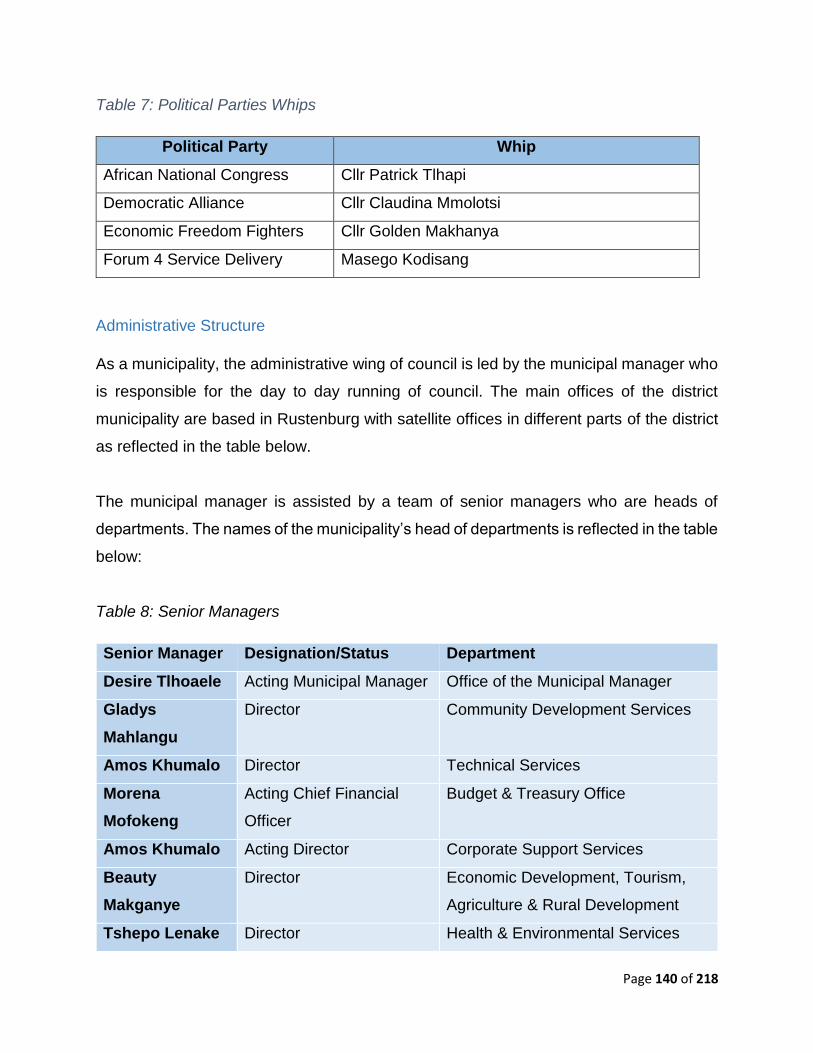
Page 140 of 218
Table 7: Political Parties Whips
Political Party Whip
African National Congress Cllr Patrick Tlhapi
Democratic Alliance Cllr Claudina Mmolotsi
Economic Freedom Fighters Cllr Golden Makhanya
Forum 4 Service Delivery Masego Kodisang
Administrative Structure
As a municipality, the administrative wing of council is led by the municipal manager who
is responsible for the day to day running of council. The main offices of the district
municipality are based in Rustenburg with satellite offices in different parts of the district
as reflected in the table below.
The municipal manager is assisted by a team of senior managers who are heads of
departments. The names of the municipality’s head of departments is reflected in the table
below:
Table 8: Senior Managers
Senior Manager Designation/Status Department
Desire Tlhoaele Acting Municipal Manager Office of the Municipal Manager
Gladys
Mahlangu
Director Community Development Services
Amos Khumalo Director Technical Services
Morena
Mofokeng
Acting Chief Financial
Officer
Budget & Treasury Office
Amos Khumalo Acting Director Corporate Support Services
Beauty
Makganye
Director Economic Development, Tourism,
Agriculture & Rural Development
Tshepo Lenake Director Health & Environmental Services

Page 141 of 218
Table 9: Location of Municipal Offices
Name of Offices Location Department
Main building Rustenburg
CBD
Office of the Executive Mayor
Office of the Speaker
Office of the Single Whip
Budget and Treasury
Office of the Municipal Manager
White Building Rustenburg
CBD
Communications Unit
IDP unit
Steen Street Rustenburg
CBD
Technical Services
Economic Development, Tourism, Agriculture
and Rural Development(EDTAR)
Sports, Arts & Culture
Disaster
Management
Centre
Rustenburg
CBD Disaster Management unit
Heystek Street Rustenburg
CBD
Corporate Support Services
Health and Environmental Services
Community Development Services
Kgetleng Fire
Services Koster Community Development Services
Mogwase Fire
Services Mogwase Community Development Services
Moretele Fire
Services Makapanstad Community Development Services
Moses Kotane
Municipal Health Mogwase Health and Environmental Services
Kgetleng Rivier
Municipal Health Koster Health and Environmental Services
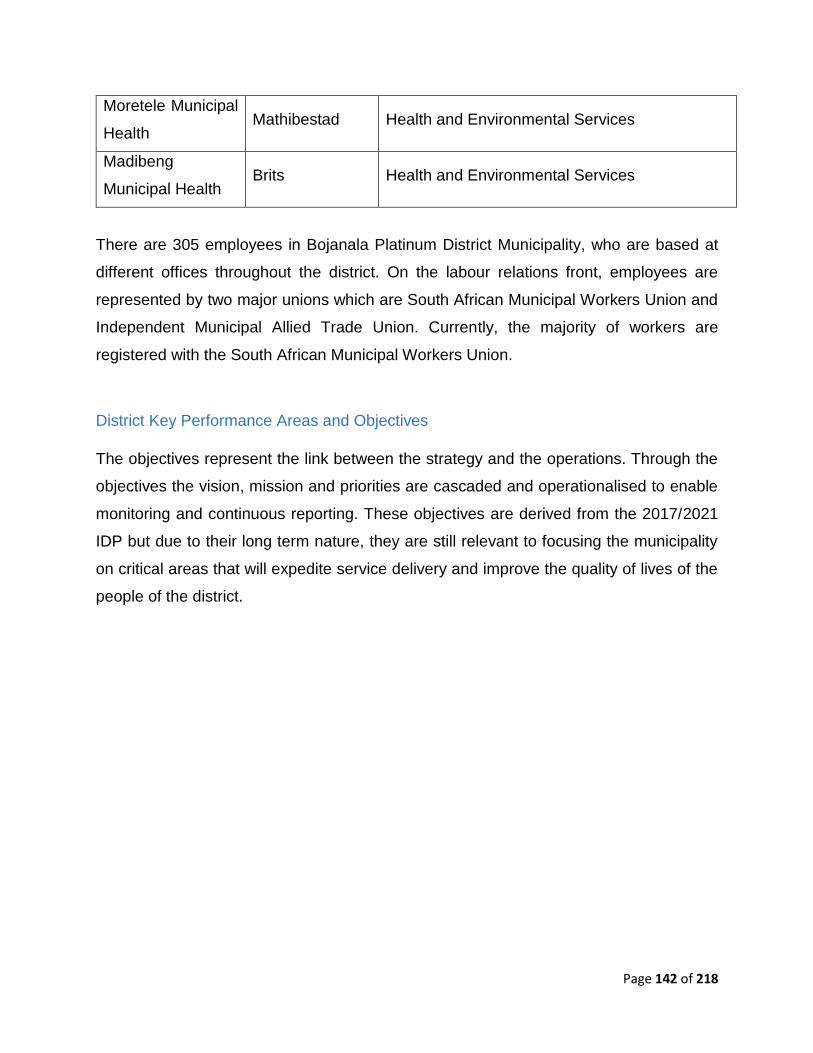
Page 142 of 218
Moretele Municipal
Health Mathibestad Health and Environmental Services
Madibeng
Municipal Health Brits Health and Environmental Services
There are 305 employees in Bojanala Platinum District Municipality, who are based at
different offices throughout the district. On the labour relations front, employees are
represented by two major unions which are South African Municipal Workers Union and
Independent Municipal Allied Trade Union. Currently, the majority of workers are
registered with the South African Municipal Workers Union.
District Key Performance Areas and Objectives
The objectives represent the link between the strategy and the operations. Through the
objectives the vision, mission and priorities are cascaded and operationalised to enable
monitoring and continuous reporting. These objectives are derived from the 2017/2021
IDP but due to their long term nature, they are still relevant to focusing the municipality
on critical areas that will expedite service delivery and improve the quality of lives of the
people of the district.

Page 143 of 218
The objectives covers all the functions performed by the municipal department, including
those that have not been optimally performed.
Key
Performance
Area
Objectives
Bas
ic S
erv
ice D
eliv
ery
Provide Municipal Public Transport Planning
Provide Fire Fighting Service
Provide Disaster Risk Management Services
Facilitate the provision of basic municipal services.
Facilitate the provision of electricity and lighting
Facilitate the maintenance of roads
Facilitate the provision of Solid Waste Management Services
Promote the protection of the environment
Provide Municipal Health Services
Mu
nic
ipa
l T
ran
sfo
rma
tio
n &
Org
an
isa
tio
na
l D
ev
elo
pm
en
t
Promote Skills Development
Achieve Employment Equity
Recruit and Retain Staff
Ensure organisational alignment
Achieve Positive Employee Climate
Implement shared services
Strengthen Integrated development Planning
Improve Performance Management
Provide Occupational Health and Safety
Provide fleet management services
Provide One Office building for all BPDM Employees

Page 144 of 218
Lo
ca
l E
co
no
mic
Dev
elo
pm
en
t
Promote agriculture
Support Enterprise Development
Promote Rural Development
Promote Enterprise Development
Support Tourism and Marketing development
Support Job Creation initiatives
Mu
nic
ipa
l
Fin
an
cia
l V
iab
ilit
y
& F
ina
nc
ial
Ma
na
ge
me
nt
Promote sound financial governance
Promote technology efficiency
Promote Accountability
Manage Assets
Provide integrated SCM service
Go
od
Go
ve
rna
nc
e
& C
om
mu
nit
y
Pa
rtic
ipa
tio
n
Promote good governance
Promote stakeholder participation
Facilitate and Support Municipal Ward Committees and Community
Development Workers
Achieve Clean Audit
Provide Risk Management Services
Operational Strategies
The strategy choices that BPDM has adopted are informed by the need to cleanse as well
as reshape its place in the firmament of local government. Further, understanding its
legislated role, inclusive of the powers and functions assigned to it, a Macro
Environmental Analysis has been conducted to guide its strategy choices. The
operational strategies create a link between the key performance areas, the objectives
and programme and projects, as listed below:-
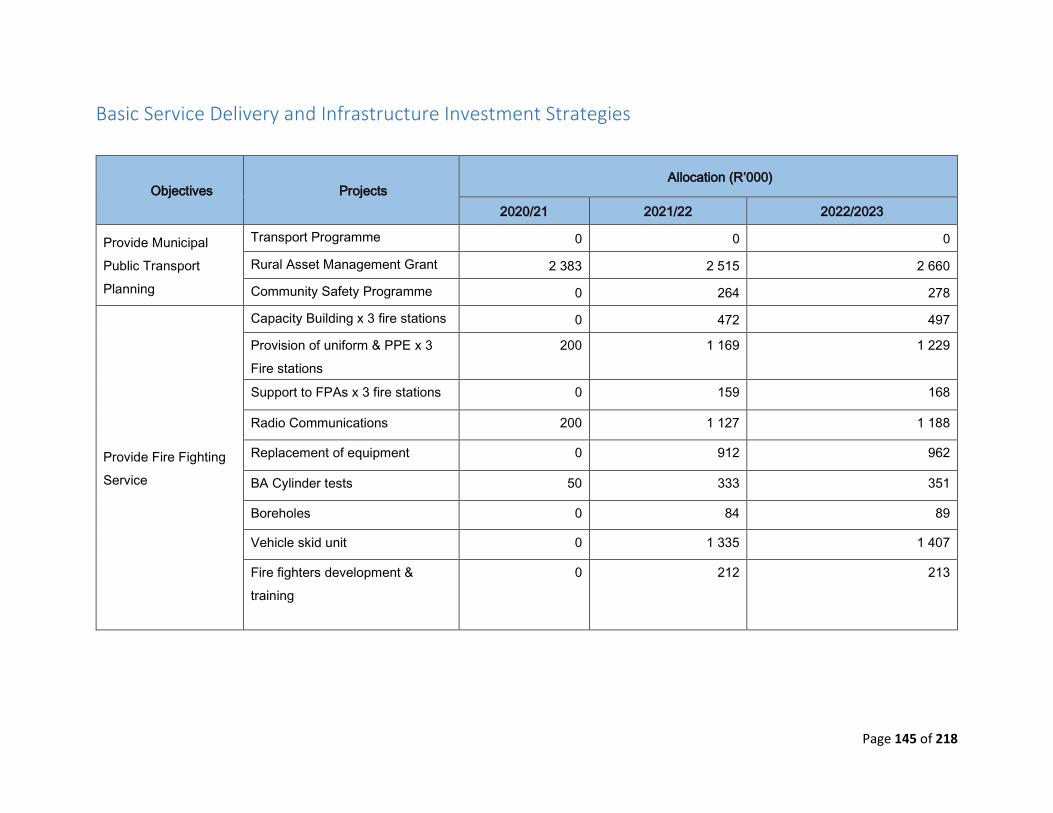
Page 145 of 218
Basic Service Delivery and Infrastructure Investment Strategies
Objectives Projects Allocation (R’000)
2020/21 2021/22 2022/2023
Provide Municipal
Public Transport
Planning
Transport Programme 0 0 0
Rural Asset Management Grant 2 383 2 515 2 660
Community Safety Programme 0 264 278
Provide Fire Fighting
Service
Capacity Building x 3 fire stations 0 472 497
Provision of uniform & PPE x 3
Fire stations
200 1 169 1 229
Support to FPAs x 3 fire stations 0 159 168
Radio Communications 200 1 127 1 188
Replacement of equipment 0 912 962
BA Cylinder tests 50 333 351
Boreholes 0 84 89
Vehicle skid unit 0 1 335 1 407
Fire fighters development &
training
0 212 213

Page 146 of 218
Basic Service Delivery and Infrastructure Investment Strategies
Objectives Projects
Allocation (R’000)
2020/21 2021/22 2022/2023
Provide Disaster Risk
Management Services
Risk Assessment 0 59 63
Capacity Building 0 564 594
Disaster Interventions 0 3 470 3 657
Education & Awareness 0 242 256
Radio Licences 0 0 0
Geographic Information Systems 0 0 0
Facilitate the provision
of basic municipal
services.
Water Related Projects 0 0 0
Sanitation Programme 0 0 0
Community facilities 0 317 334
Facilitate the
maintenance of roads
Roads Programme 0 211 223
Provide Municipal
Health Services
Indigents burials 0 0 0
Burial of Paupers 250 106 0
Food & Water samples testing 0 211 223
Municipal Health Programmes 0 348 367

Page 147 of 218
Basic Service Delivery and Infrastructure Investment Strategies
Objectives Projects
Allocation (R’000)
2020/21 2021/22 2022/2023
Facilitate the provision of
Waste Management
Programmes
Waste Management Programmes 0 339 358
Waste Resources recovery 0 384 404
Promote the protection of the
environment
Roll out of Air quality management
programme 0 329 347
Environmental Education &
Awareness 0 422 445
Environmental rehabilitation 0 422 445
Climate Change 0 335 353
Biodiversity 0 352 371
Promote Sport, Arts &
Culture
Support sport 0 776 818
Provision of basic sport equipment 0 311 328
Arts & Culture support 0 356 364
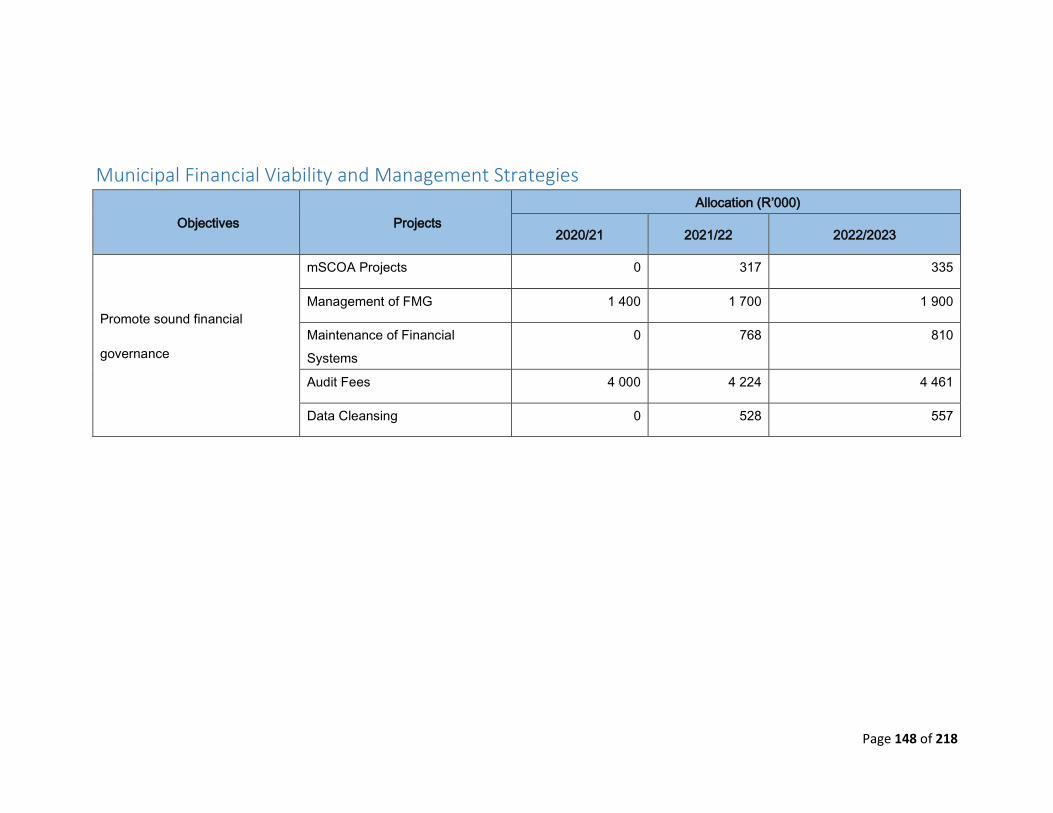
Page 148 of 218
Municipal Financial Viability and Management Strategies
Objectives Projects
Allocation (R’000)
2020/21 2021/22 2022/2023
Promote sound financial
governance
mSCOA Projects 0 317 335
Management of FMG 1 400 1 700 1 900
Maintenance of Financial
Systems
0 768 810
Audit Fees 4 000 4 224 4 461
Data Cleansing 0 528 557

Page 149 of 218
Local Economic Development Strategies
Objectives Projects Allocation (R’000)
2020/21 2021/22 2022/2023
Promote agriculture
Support Agri-Park programmes 0 1 500 1 581
Support Agricultural and Rural
Development Programmes
0 222 234
Promote Enterprise Development
Enterprise support 0 2 000 2 108
LED Strategy 0 125 134
LED Summit 0 223 239
LED Training 0 178 190
Support Tourism and Marketing
development
Tourism support 0 120 129
District Marketing 0 535 572
Support Job Creation initiatives EPWP (social development) 1 789 0 0
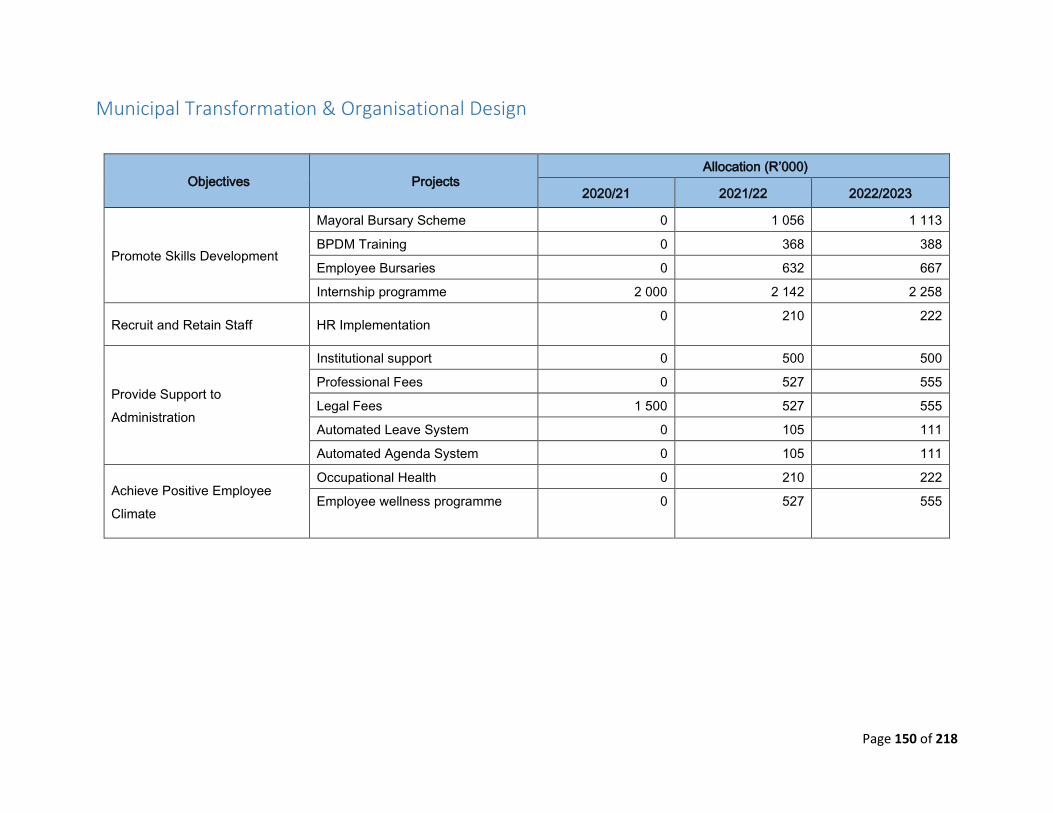
Page 150 of 218
Municipal Transformation & Organisational Design
Objectives Projects Allocation (R’000)
2020/21 2021/22 2022/2023
Promote Skills Development
Mayoral Bursary Scheme 0 1 056 1 113
BPDM Training 0 368 388
Employee Bursaries 0 632 667
Internship programme 2 000 2 142 2 258
Recruit and Retain Staff HR Implementation 0 210 222
Provide Support to
Administration
Institutional support 0 500 500
Professional Fees 0 527 555
Legal Fees 1 500 527 555
Automated Leave System 0 105 111
Automated Agenda System 0 105 111
Achieve Positive Employee
Climate
Occupational Health 0 210 222
Employee wellness programme 0 527 555

Page 151 of 218
Objectives Projects Allocation (R’000)
2020/21 2021/22 2022/2023
Provide Filing and archiving
services
Records & storage Maintenance 00 105 111
Strengthen Integrated
development Planning
IDP Review 0 632 667
SDF review/update 0 509 536
District Investment Incentives 0 334 352
Promote technology efficiency Maintenance of the municipal
website
0 111 117
Computer license maintenance 0 854 900
Replacement of computer
hardware
0 58 61
Repair of computers & servers 0 58 61
Improve Performance
Management
Mid Term Performance Review 0 249 262
Provide Occupational Health
and Safety
Office & Parking rental 7 822 7 865 8 651
Security Payments 6 600 6 900 7 273
Provide fleet management
service
Acquisition of municipal vehicles 0 7 378 7 776

Page 152 of 218
Good Governance and Public Participation strategies
Objectives Projects Allocation (R’000)
2020/21 2021/22 2022/2023
Promote good governance
NGO/NPO support 0 167 176
Food parcels 0 519 547
Anti-Corruption programmes 0 632 666
Capacity Building 0 1 451 1 533
Ward Committee Programmes 0 1 054 1 110
Development & Printing of annual
report
0 445 469
Training of Single Whips 0 4 528 4 773
Meetings 0 533 562
Promote stakeholder
participation
Public Participation Programmes 0 3 266 3 442
District Imbizo 0 844 990
Outreach Programme 0 1 160 1 222
Communication 0 1 305 1 490

Page 153 of 218
Good Governance and Public Participation strategies
Objectives Projects Allocation (R’000)
2020/21 2021/22 2022/2023
Facilitate and Support
Municipal Committees
IGR
0 774 784
Achieve clean audit
MPAC Programmes 0 975 1 028
Risk Assessment 0 55 58
Audit Committee 250 571 601

Page 154 of 218
TOP TEN (10) STRATEGICAL RISK IDENTIFIED
No Description of
risk Consequences
Bu
sin
ess
un
it
Imp
act
Ra
tin
g
Pro
ba
bili
ty
Ra
tin
g
Pri
ori
ty R
ati
ng
Current
Mitigating
Measures
Cu
rren
t St
atu
s
Imp
act
Ra
tin
g
Pro
ba
bili
ty
Rating
Pri
ori
ty R
ati
ng
Recommendation on
Measures
Res
po
nsi
ble
Per
son
/
Per
son
s Ti
me-
Fram
e
1
Non compliance to Occupational Health and Safety Act
Closure of municipal offices by the department of Labour
H&
ES
5 5 25 None
Inad
equ
ate
5 5 25 Municipal buildings that are compliant to the OHSA A
LL
On -
goin
g
On g
oin
g
2
Non-compliance to the Disaster Management Act 200 (Act no. 57 of 2002)
Infected personnel and closure of municipal offices by the department of labour
CD
S
5 5 25 None
Inad
equ
ate
5 5 25
Adherence to the Covid 19 Regulations for municipal employees and Councillors
ALL
On -
goin
g
3
Inadequate systems in place to monitor approved and prevent unauthorized expenditure
Unauthorized expenditure
Bud
geting
5 5 25 Spending in line as per the approved budget
Inad
equ
ate
5 5 25
Budget system to be programmed in a way that expenditure is only incurred for items contained in the approved budget.
CF
O
On g
oin
g

Page 155 of 218
No Description of
risk Consequences
Bu
sin
ess
un
it
Imp
act
Ra
tin
g
Pro
ba
bili
ty
Ra
tin
g
Pri
ori
ty R
ati
ng
Current
Mitigating
Measures
Cu
rren
t St
atu
s
Imp
act
Ra
tin
g
Pro
ba
bili
ty
Rating
Pri
ori
ty R
ati
ng
Recommendation on
Measures
Res
po
nsi
ble
Per
son
/
Per
son
s Ti
me-
Fram
e
4
Non-market related project costs / prices
Overspending on project resulting in unauthorized expenditure B
ud
geting
5 5 25 Compliance based budgeting process
Inad
equ
ate
5 5 25
All major projects should be technically reviewed by the experts prior being advertised. A benchmark of costs should be performed prior advertising All quotations shall be requested by, SCM for any services required
CF
O
Ongoin
g
5
Management of Assets, register and valuation
Asset register may not be up to date
Asset U
nit
5 5 25 GRAAP Compliance based Process
ina
deq
uate
5 5 25
Asset register must be updated on a monthly basis. Depreciation to be confirmed by supervisor
CF
O
Month
ly
6
Cash flow Management
Insufficient cash to cover projects and operations. Unauthorized expenditures
BT
O
5 5 25
Spending by departments not done within the approved budget
Part
ially
ad
equ
ate
5 5 25
Bank reconciliation must be performed monthly and reviewed by senior official Spending on projects and programmes to be done as per the approved budget
CF
O
Month
ly

Page 156 of 218
No Description of
risk Consequences
Bu
sin
ess
un
it
Imp
act
Ra
tin
g
Pro
ba
bili
ty
Ra
tin
g
Pri
ori
ty R
ati
ng
Current
Mitigating
Measures
Cu
rren
t St
atu
s
Imp
act
Ra
tin
g
Pro
ba
bili
ty
Rating
Pri
ori
ty R
ati
ng
Recommendation on
Measures
Res
po
nsi
ble
Per
son
/
Per
son
s Ti
me-
Fram
e
7
Outdated Policies failure to clarify the roles in the public sector space
Undue delays in service delivery because of conflicts Negative impact on performance management A
ll
5 5 25
Annual Review of Policies and procedures not monitored
Inad
equ
ate
5 5 25
Annual Review of Municipal Policies
Training on role specifications
Proper corporate governance structures
Developed charters and mandates that clarifying the roles should be regularly communicated
Directo
r C
SS
31 D
ece
mb
er
201
9
8
IT risk due to insufficient IT internal control environment, back up plans and policies.
Unathorised users may access IT systems. No recovery plans in disasters. Weak IT control environment IT
5 5 25
Username and password checks. Back up performed externally.
Inad
equ
ate
5 5 25
Recommendations of AGSA 2017/18 findings relating to IT must be implemented
Vusi M
og
ale
31 D
ece
mb
er
202
0

Page 157 of 218
No Description of
risk Consequences
Bu
sin
ess
un
it
Imp
act
Ra
tin
g
Pro
ba
bili
ty
Ra
tin
g
Pri
ori
ty R
ati
ng
Current
Mitigating
Measures
Cu
rren
t St
atu
s
Imp
act
Ra
tin
g
Pro
ba
bili
ty
Rating
Pri
ori
ty R
ati
ng
Recommendation on
Measures
Res
po
nsi
ble
Per
son
/
Per
son
s Ti
me-
Fram
e
9
Inadequate management of human capital
Compromised service delivery Potential loss of information
CS
S
5 5 25 Prioritize on service provision
Inad
equ
ate
5 5 25
Skills audit be performed Placement Policy be developed and implemented Organogram must be reviewed and revised to ensure that officials who are not used to capacity are allocated to areas where there is human capital needs
CS
S
31 D
ece
mb
er
202
0
10
Fruitless and wasteful expenditure
Overspending on unbudgeted expenses leading to none compliance and cash flow challenges
Bud
get
5 5 25
Compliance to laws and regulations
Part
ially
effective
5
5
25
Implementation of consequence management
Mun
icip
al M
an
ager
On g
oin
g

158
SECTION 5: 2020/2021 MEDIUM TERM REVENUE AND EXPENDITURE
FRAMEWORK (MTREF) AND THE FINANCIAL PLAN
The proposed 2020/21 Medium-term Revenue and Expenditure Framework is as follows:
REVENUE PER REVENUE SOURCE
The Municipality is dependent on equitable share which is allocated in terms of the
Division of Revenue Act (DORA). According to the Act, the Municipality has been
allocated R353 381 000 for the 2020/2021 financial year, which is 4% more than the
2019/2020 allocation.
Transfers recognised includes the local government equitable share and other operating
grants from national and provincial government. It needs to be noted that in real terms
the grants receipts from national government are growing rapidly over the MTREF for the
outer years. The equitable share remains to be the most important part of the
municipality’s revenue base as no services are rendered for which revenue can be
collected.
Equitable share represents 98.5% of the Municipality’s total revenue and the remaining
1.5% is made up of conditional grants of which can only be realised as an incoming after
it meets its condition after the expenditure and the other is interest on investment as well
as revenue collected in respect of municipal by-laws.
INCOME BUDGET 2019/20 FEB BUDGET 2019/20 DRAFT BUDGET 2020/2021 2021/22
Equitable shares 339 278 000 339 278 000 353 381 000 368 676 000
EPWP 1 437 000 1 437 000 - -
FIRE income 200 000 50 000 60 000 65 000
FMG 1 000 000 1 000 000 1 432 000 1 696 000
HES income - 50 000 50 000 55 000
Interest 1 500 000 1 200 000 1 000 000 1 200 000
Disaster Capacity - - - -
Other income 100 000 10 000 10 000 10 000
R A M S 2 504 000 2 504 000 2 648 000 2 794 000 TOTAL REVENUE 346 019 000 345 529 000 358 581 000 374 496 000

159
Total revenue has increased by R13 052 000 for the 2020/2021 financial year when
compared to the 2019/20 Budget. For the outer year, total revenue will increase by 4.4%.
For Bojanala Platinum District Municipality to continue improving the quality of services
provided to its citizens and local municipalities it needs to generate the required revenue.
In these tough economic times strong revenue management is fundamental to the
financial sustainability of every municipality. The reality is that the municipality is faced
with development backlogs and poverty. The expenditure required to address these
challenges will inevitably always exceed available funding; hence difficult choices have to
be made in balancing expenditures against realistically anticipated revenues.
The Municipality has been allocated conditional grants to the value of R4 080 000. These
grants are made of the Finance Management Grant as well as the Rural Asset
Management Grants. Total conditional grants represent 1.1% of total revenue of the
Municipality.
With the monthly cash flow projections, the Municipality aims to keep and maintain a
healthy investment portfolio which will generate money in terms of interest on
investments. An amount of R1 000 000 has been projected.
EXPENDITURE PER EXPENDITURE TYPE
Total operating expenditure for the 2020/21 financial year has been appropriated at
R341 391 338 and translates into a budgeted surplus of R17 189 662. Operational
expenditure has increased by R52 952 159 in the 2020/21, the primary reasons is due to
increases in salaries, payments to creditors, operational cost and contracted services.
In line with the formats prescribed by the Municipal Budget and Reporting Regulations,
capital transfers and contributions are excluded from the operating statement, as
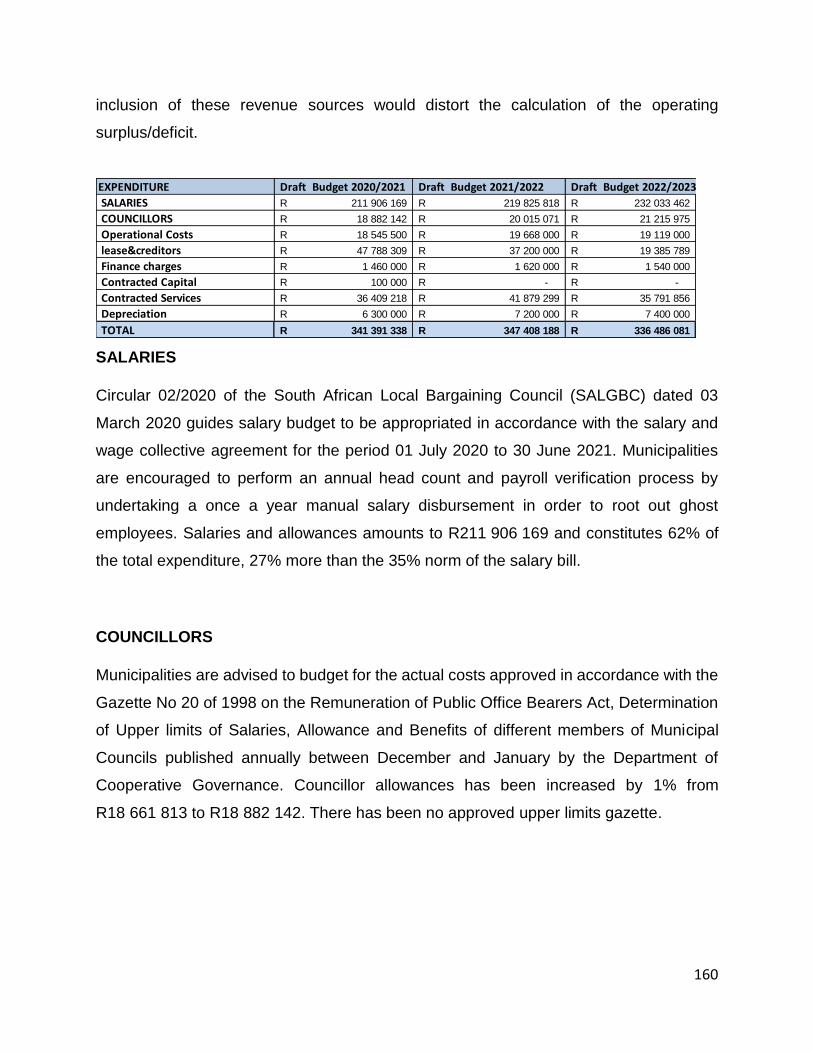
160
inclusion of these revenue sources would distort the calculation of the operating
surplus/deficit.
SALARIES
Circular 02/2020 of the South African Local Bargaining Council (SALGBC) dated 03
March 2020 guides salary budget to be appropriated in accordance with the salary and
wage collective agreement for the period 01 July 2020 to 30 June 2021. Municipalities
are encouraged to perform an annual head count and payroll verification process by
undertaking a once a year manual salary disbursement in order to root out ghost
employees. Salaries and allowances amounts to R211 906 169 and constitutes 62% of
the total expenditure, 27% more than the 35% norm of the salary bill.
COUNCILLORS
Municipalities are advised to budget for the actual costs approved in accordance with the
Gazette No 20 of 1998 on the Remuneration of Public Office Bearers Act, Determination
of Upper limits of Salaries, Allowance and Benefits of different members of Municipal
Councils published annually between December and January by the Department of
Cooperative Governance. Councillor allowances has been increased by 1% from
R18 661 813 to R18 882 142. There has been no approved upper limits gazette.
EXPENDITURE Draft Budget 2020/2021 Draft Budget 2021/2022 Draft Budget 2022/2023
SALARIES 211 906 169R 219 825 818R 232 033 462R
COUNCILLORS 18 882 142R 20 015 071R 21 215 975R
Operational Costs 18 545 500R 19 668 000R 19 119 000R
lease&creditors 47 788 309R 37 200 000R 19 385 789R
Finance charges 1 460 000R 1 620 000R 1 540 000R
Contracted Capital 100 000R -R -R
Contracted Services 36 409 218R 41 879 299R 35 791 856R
Depreciation 6 300 000R 7 200 000R 7 400 000R
TOTAL 341 391 338R 347 408 188R 336 486 081R

161
OPERATIONAL COSTS
Operational costs have decreased to R18 545 500 as compared to the budget adjustment
in February 2020. The operational services mainly are for the day to day activities of the
municipality.
CREDITORS AND LEASES
The Municipality’s creditors were not paid since the beginning of the financial year. An
overall assessment is still being done on creditors taking into consideration invoices that
were received late by the Municipality. The non-payment of creditors was as a result of a
refund to Cooperative Governance Human Settlement and Traditional Affairs that was
paid by error to the Municipality
The Municipal age analysis at the end of June 2019 reflected a balance of R47 788 309
owed to suppliers. The Municipality could not service the rental agreements, leases as
well existing contracts during the 2019/20 financial year to date. Provision is therefore
made to the value of R47 788 309 to pay the monies owed by the Municipality.
CAPITAL EXPENDITURE
This expenditure increased from R70 000 to R100 000 as compared to the adjustment in
February 2020 and is provided for acquisition of laptops. The Municipality has no
infrastructure assets except to service delivery project to be done on behalf and in support
of local municipalities. No adequate provision could be made for services done on behalf
of the constituent local municipalities because of the payment error suffered during the
2018/2019 financial year.

162
CONTRACTED SERVICES
Contracted services increased from R23 942 892 to R36 409 218 in accordance with the
contractual commitments entered into by the municipality as well as the envisioned
procurement plan.
2020/21 FINANCIAL PLAN 1. INTRODUCTION
MFMA section 18 requires that a municipality tables a funded budget that will cater for
the creditors as well as the current year operations. It is expected of municipalities to
develop a financial plan that will clearly demonstrate strategies or measures to be put in
place to ensure that budget is finally funded. This financial plan document serves as a
commitment to be used by oversight committees when reviewing the section 71 reports.
2. BACKGROUND
Bojanala Platinum District Municipality has been approving budget funded with risk for
the past years and it was discovered that the municipality had repeatedly not been
disclosing its creditors timeously. Provincial Treasury assessed the 2019/20 MTREF and
highlighted areas that needs to be revised to ensure that the Municipal budget is funded
if not a financial plan with strategies and measures to be implemented should be adopted
in Council to allow oversight bodies to monitor the plan on a monthly basis. This is done
to ensure that the Municipality do not incur the unauthorized expenditures at year end.
Furthermore, National and Provincial Treasuries have directed the Municipality to
formulate a financial plan in order to demonstrate how the budget will be funded during
the MTREF.

163
3. THE PURPOSE OF THE FINANCIAL PLAN
The plan seeks to address the unfunded budget in the municipality, further outline how
will the municipality use the equitable share as its main revenue source to fund the
budget, as well as measures in place to curb excessive expenditure.This plan is
developed for Council consideration and approval thereof to ensure strict monitoring of
the budget.
4. KEY FOCUS AREAS OF THE FINANCIAL PLAN
4.1 TRADE PAYABLES
Creditors Age Analysis as of 19 March 2020
1-30 31-60 31-60 61-90 91-120 121-150 151+ Total
3 475 005 1 066 723 659 812 1 450 646 1 554 249 2 114 810 44 745 089 55 066 374
Creditors consist of suppliers of contractual and operational expenditure. Creditors
account for 206% of the free cash flow after taking into consideration the salary
commitment for the remaining financial year. The municipality will only be able to survive
the 2020/21 financial year via cutting all non-critical and committed expenditure.
4.2 REVENUE
Bojanala is a category C Municipality and it is not a water service authority. This means
that it does not provide basic services rather provides support to its local municipalities in
terms of financial or technical when the resources are available.
Bojanala’s mandate is defined in terms of section 84 of the Municipal Structure Act. Our
Mandate is merely the ensuring compliance with Environmental and health management
services and disaster. When enforcing these compliance revenue gets maximized by
issuing permits and licensing and penalties.
164
Bojanala remains the biggest District in Northwest with larger contribution to the economy
of Province as well as in the Country. This financial plan will demonstrate how the
municipality intends raising revenue within its powers and function vested in terms of the
structures Act.
The expectation is to demonstrate the key revenue sources of the municipality, activities
or measures to be put in place, the feasible timeframe and its financial implication. Below
is the list of revenue sources applicable to local government; -
i Revenue Management committees(N/A)
Due to the fact that the municipality do not provide basic services therefore
revenue management committees is not applicable to Bojanala
ii Property rates(N/A)
Bojanala is a category C Municipality which means it does not have jurisdiction to
levy property rates and taxes, therefore this is not applicable.
iii Electricity(N/A)
Bojanala is not a licenced to provide bulk electricity or distribution/ reticulation,
therefore no applicable plan is necessary at this stage. As a long term plan the
municipality can focus on renewable energy from the disposal of waste services.
iv Water and sanitation(N/A)
Bojanala is not a water services authority as a result there is no need for financial
plan on how to maximize revenue
v Refuse removal(N/A)
Refuse removal is the responsibility of local municipality our role is to develop a
regional landfill sites for disposal in terms of environmental and health Services
Act. With the current budgetary constraints, the municipality unable to embark on
the long term plan for this particular function. A request for assistance to develop
strategies from the Department of Local Government and Housing Settlement with
provincial treasury assistance will be submitted in this regard

165
vi Rental facilities(N/A)
The Municipality does not own any property where it can generate revenue, in fact
the municipality is operating on five leased properties with different land Lord
vii Other revenue- Health and environmental services (Licencing and penalties)
The following is the list of other revenue to be generated in our municipality and was
approved by council in terms of Section 84 of the structures Act Bojanala are entrusted
with nine components where revenue can be maximized. Database has been developed,
Air quality plan has been approved only awaiting full implementation. It is anticipated that
the following revenue streams will be brought in fruition within the MTREF.
Activities Timeframe Financial impact
2020/21 2021/22 2022/23
R R R
Issuing of compliance certificates for
health care centres (once every two
years)
141 @ R5 300
July 2021 0 840 000 0
Issuing of compliance certificates for
schools (once every two years)
141 @ R5 300
July 2021 0 747 000 0
Certificate to operate smelters 12
@ R10 000 (once every 3 years)
Levying atmospheric
licensing fee once every three
years
July 2021 0 40 000 40 000
Certificate for operating a
mortuary annually Tariff R14 800
July 2021 0 695 600 695 600
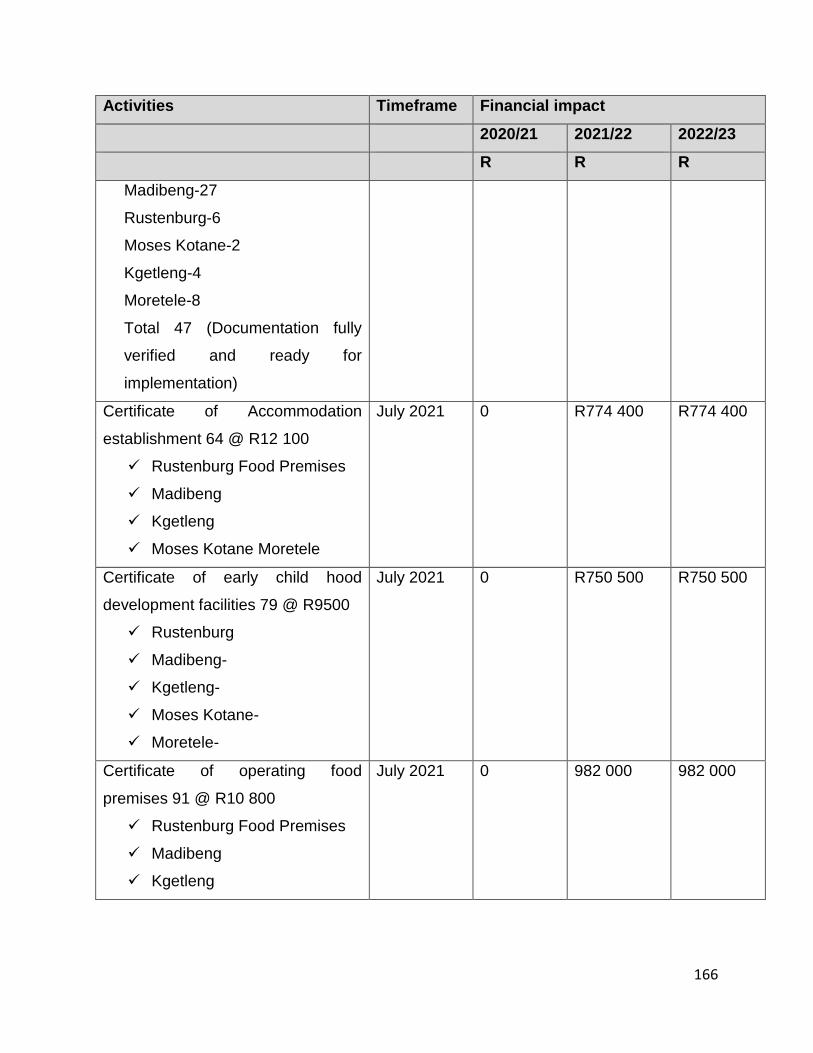
166
Activities Timeframe Financial impact
2020/21 2021/22 2022/23
R R R
Madibeng-27
Rustenburg-6
Moses Kotane-2
Kgetleng-4
Moretele-8
Total 47 (Documentation fully
verified and ready for
implementation)
Certificate of Accommodation
establishment 64 @ R12 100
Rustenburg Food Premises
Madibeng
Kgetleng
Moses Kotane Moretele
July 2021 0 R774 400 R774 400
Certificate of early child hood
development facilities 79 @ R9500
Rustenburg
Madibeng-
Kgetleng-
Moses Kotane-
Moretele-
July 2021 0 R750 500 R750 500
Certificate of operating food
premises 91 @ R10 800
Rustenburg Food Premises
Madibeng
Kgetleng
July 2021 0 982 000 982 000

167
Activities Timeframe Financial impact
2020/21 2021/22 2022/23
R R R
Moses Kotane
Moretele
0 4 830 600 3 243 300
The above mentioned revenues are based on the relevant by-lays being passed by
council after the conclusion of public participation activities. It is also considered that due
to the 2020/21 financial constraints, public participation process should utilise as little
financial resources as possible.

168 | P a g e
4.3 EXPENDITURE AND COST CONTAINMENT MEASURES
The Municipality requires savings of R19 135 656 for the budget to be fully funded within
the current and outer year of the MTREF. Major expenditure is incurred on the following
categories which the municipality can actually make a major savings on these.
Activities Timeframe Financial impact
2020/21 2021/22 2022/23
Develop , approve and
implement cost containment
plan(Done)
30 May 2019 No financial implication
Plan to address wage bill
The Municipality does not
have blotted structure, its
challenge is the wage bill
which was created after the
revenue from levies were
abolished.
This resulted in the less
income thereby reducing less
expenditure leaving the
organogram with no changes
- - -
Bulk purchase N/a - - -
Overtime
Baseline the Municipal
overtime policies caters for
maximum 40hours

169 | P a g e
Activities Timeframe Financial impact
2020/21 2021/22 2022/23
Strategy- Revised the policy
to regulate 20 Maximum
overtime to be incurred
during the month with the
remaining hours to be taken
as time off. Engage with
labour to obtain an amicable
solution.
July 2022
R0
R0
R0
Training
Base line
Training is also budgeted for
ward committees
Strategy
Pass a resolution
that only 1 delegate per
section will be allowed to
attended a conference or
workshop,
that pre-approval will be
given by the Accounting
officer prior training being
taken
that officials will only attend
training that will not exceed
Cost at R894,321.12 for mm
office, disaster, health and
community development
January 2020

170 | P a g e
Activities Timeframe Financial impact
2020/21 2021/22 2022/23
The intention is to reduce the
cost of four employees who
have been in the institution
since establishment.
R894 321/12 =R74 526
A saving of four employees
Savings on ward
committees training (This
will be considered when the
municipality is viable)
R223 580
R300 000
R236 994
R316 200
R251 214
R333 274
Accommodation
Base line
Bookings for accommodation is
done irrespective kilometres to
be travelled
There is no policy to regulate the
different starts to be applied to
different categories of the
officials.
Strategy
Booking will only be done if
kilometres to be travelled
exceed 450 to and from
Savings to be realized
R3,430,940.00 @ 20%
July 2019
R686 188
R727 359
R771 001

171 | P a g e
Activities Timeframe Financial impact
2020/21 2021/22 2022/23
Catering
Base line
Catering is provided for all
meetings
Catering is provided with
decoration
All MMC are having
entertainment exceeding
R20 000 p.a.
Strategy
Pass a resolution in council to in
line with the cost containment
regulation
Savings to be realized; -
Savings on deco
Savings on either breakfast or
lunch
Savings on entertainment
allowances
January 2020
R2 171 926
R2 304 042
R2 444 182
Events and promotional
material

172 | P a g e
Activities Timeframe Financial impact
2020/21 2021/22 2022/23
The cost containment measures
prohibit the promotional material
at all cost
Strategy-Savings in the office of
the single whip speaker
R475,200 R503 712 R533 935
Total savings to be realize R3 856 894 R4 088 307 R4 333 606
4.4 DEBT COLLECTION STRATEGY (N/A)
Activities Timeframe Financial impact
2020/21 2021/22 2022/23
% on collection of rates N/a No financial impact
4.5 INDIGENTS (N/A)
Activities Timeframe Financial impact
2020/21 2021/22 2022/23
Review of indigent policies to
refrain from providing free for
all consumers
N/a No financial impact
Indigent registration process N/a No financial impact
Updating of indigent register N/a No financial impact
173 | P a g e
4.5 DATA CLEANSING (N/A)
The municipality does not have billing so data cleansing is not applicable in this case. At
this present moment the municipality mainly focus is data collection for the purpose of
inspection and ensure compliance thereby generating revenue for the municipality.
4.6 REPAIRS AND MAINTENANCE OF INFRASTRUCTURE ASSETS (N/A)
The Municipality does not have revenue generating assets due to the fact that it does not
provide basic services to the community. The municipality does not own a major building
even where the head office where the Bojanala district offices are held is rented.
The Municipality is constantly confronted by service delivery interventions in both the low
capacity Municipalities (Moretele and Kgetleng rivier Local Municipality). Our role is as a
when the request is submitted for our consideration by these Locals.
4.7 CASH FLOW MANAGEMENT-SEE ANNEXURE A
The municipality has developed cash flow projections for the entire three year MTREF
based on the current status which clearly shows that the municipality finance is under
pressure.
The cash flow projections clearly show that the municipality will be funded as from July
2021/22 financial period. All the anticipated revenue is expected to be realize from July
2021/22. The revenues will be included in the budget statements as soon as the tariffs
have been approved by council.
174 | P a g e
4.8 COST REFLECTIVE TARIFFS (N/A)
Due to fact that the municipality do not provide the basic services there is no applicable
tariff structure which is required to be cost reflective. Our role is more on compliance and
it is legislated
5. CONCLUSION
In conclusion the municipality is committed to implement the cost containment strategies
highlighted above to realize the savings needed at this stage. Senior managers will be
workshopped on cost containment measures as outlined in the gazette followed by
departmental meetings where all officials will be workshopped.
The notice will also be placed in all municipal entrance, copied all emails and the
municipal website. On quarterly basis Department will be expected to demonstrate the
savings made in their department in line with the cost containment gazette.
The Municipality must on a monthly basis, consider the status with regards to
implementation of the Financial Plan. The Accounting Officer must on a monthly basis,
present to a Mayor/Executive Mayor, a status with regards to implementation of the
Financial Plan. The Mayor/Executive Mayor must report the status with regards to
implementation of the Financial Plan to Council.
The Accounting Officer must on a monthly basis, when reporting on the Section 71, report
also on the status with regards to implementation of the Financial Plan.
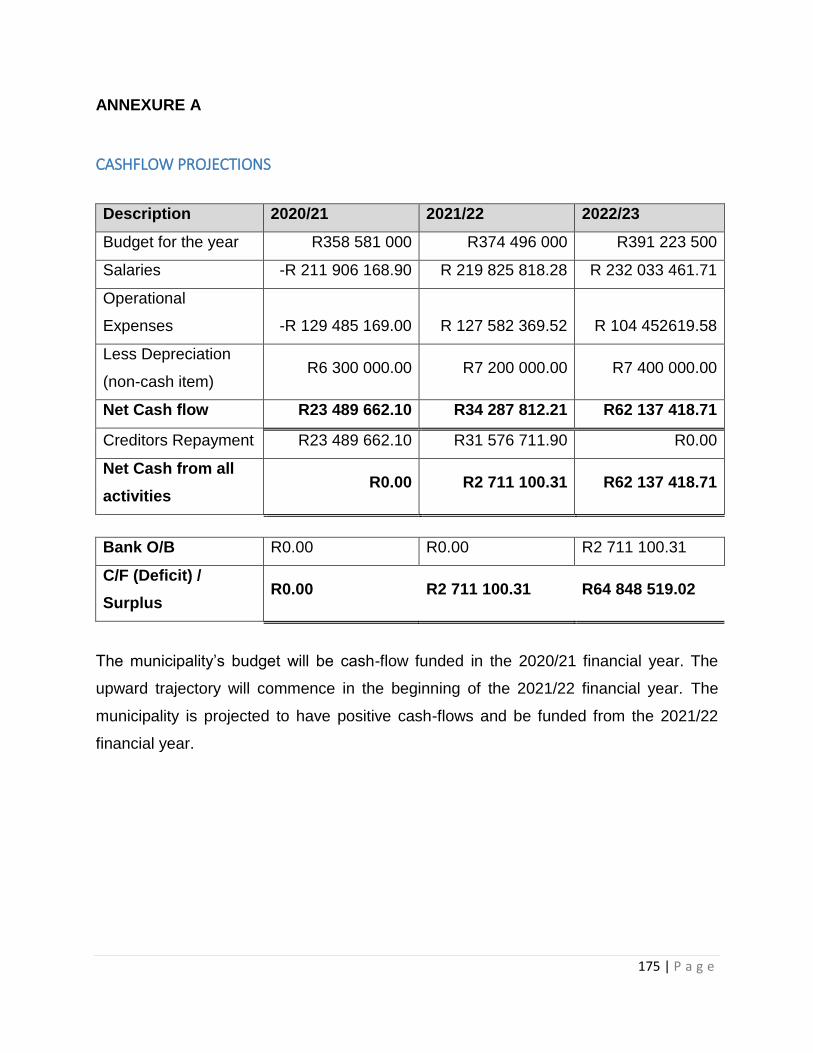
175 | P a g e
ANNEXURE A
CASHFLOW PROJECTIONS
Description 2020/21 2021/22 2022/23
Budget for the year R358 581 000 R374 496 000 R391 223 500
Salaries -R 211 906 168.90 R 219 825 818.28 R 232 033 461.71
Operational
Expenses -R 129 485 169.00 R 127 582 369.52 R 104 452619.58
Less Depreciation
(non-cash item) R6 300 000.00 R7 200 000.00 R7 400 000.00
Net Cash flow R23 489 662.10 R34 287 812.21 R62 137 418.71
Creditors Repayment R23 489 662.10 R31 576 711.90 R0.00
Net Cash from all
activities R0.00 R2 711 100.31 R62 137 418.71
Bank O/B R0.00 R0.00 R2 711 100.31
C/F (Deficit) /
Surplus R0.00 R2 711 100.31 R64 848 519.02
The municipality’s budget will be cash-flow funded in the 2020/21 financial year. The
upward trajectory will commence in the beginning of the 2021/22 financial year. The
municipality is projected to have positive cash-flows and be funded from the 2021/22
financial year.

176 | P a g e
SECTION 6: SERVICE DELIVERY AND BUDGET IMPLEMENTATION PLAN
GOOD GOVERNANCE AND PUBLIC PARTICIPATION
Outcome 9 OUTPUT 1 Implement a differentiated approach to municipal financing, planning and support
OUTPUT 3 Implementation of the community work programme
OUTPUT 5 Deepen democracy through a refined ward committee model
OUTPUT 7 Single window of coordination
Strategic Objective Key Performance
Indicator Baseline Annual Target Budget
Responsible Department
Quarterly Targets Portfolio of Evidence
Q 1 Q 2 Q 3 Q 4
Support Local Governance Structure
Number of Ward Committee programmes conducted in Bojanala Region
2 ward committees trainings conducted in 2019/20 FY
2 Ward Committee programmes conducted in Bojanala Region by 30 June 2021
R 0 Office of the Speaker
KPI not due Ward Committee programme conducted in Bojanala Region
KPI not due Ward Committee programme conducted in Bojanala Region
Q1 – KPI not due Q2 - Attendance register & Report Q3 - KPI not due Q4 - Attendance Register and Report
Number of Audit Committee reports for BPDM adopted by Council
4 Audit Committee Reports adopted during 19/20FY
4 Audit Committee Reports adopted by Council by 30 June 2021
Operational Office of the Municipal Manager
2019/20 Q4 Audit Committee Report for BPDM adopted by Council
2020/21 Q1 Audit Committee Report for BPDM adopted by Council
2020/21 Q2 Audit Committee Report for BPDM adopted by Council
2020/21 Q3 Audit Committee Report for BPDM adopted by Council
Q1 – 19/20 Q4 Audit Committee Report & Council Resolution Q2 - 20/21 Q1 Audit Committee Report & Council Resolution Q3 - 20/21 Q2 Audit Committee Report & Council Resolution Q4 - 20/21 Q3 Audit Committee Report & Council Resolution
Number of quarterly Internal Audit Reports on Internal Audit activities submitted to Audit Committee
New 4 quarterly Internal Audit reports on Internal Audit activities submitted to the Audit Committee by 30 June 2021
Operational Office of the Municipal Manager
1 quarterly Internal Audit report submitted to Audit Committee
1 quarterly Internal Audit report submitted to Audit Committee
1 quarterly Internal Audit report submitted to Audit Committee
1 quarterly Internal Audit report submitted to Audit Committee
Q1; Q2;Q3;Q4 - Attendance register, signed reports and minutes
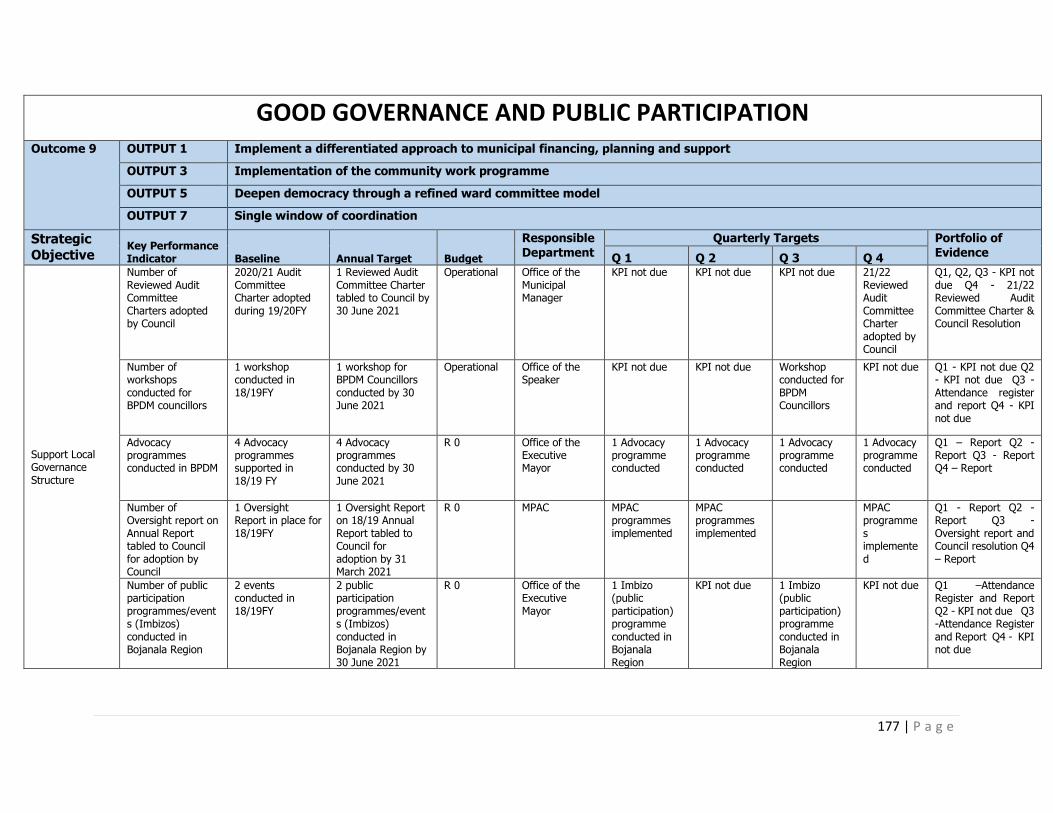
177 | P a g e
GOOD GOVERNANCE AND PUBLIC PARTICIPATION
Outcome 9 OUTPUT 1 Implement a differentiated approach to municipal financing, planning and support
OUTPUT 3 Implementation of the community work programme
OUTPUT 5 Deepen democracy through a refined ward committee model
OUTPUT 7 Single window of coordination
Strategic
Objective Key Performance Indicator Baseline Annual Target Budget
Responsible Department
Quarterly Targets Portfolio of Evidence Q 1 Q 2 Q 3 Q 4
Support Local Governance Structure
Number of Reviewed Audit Committee Charters adopted by Council
2020/21 Audit Committee Charter adopted during 19/20FY
1 Reviewed Audit Committee Charter tabled to Council by 30 June 2021
Operational Office of the Municipal Manager
KPI not due KPI not due KPI not due 21/22 Reviewed Audit Committee Charter adopted by Council
Q1, Q2, Q3 - KPI not due Q4 - 21/22 Reviewed Audit Committee Charter & Council Resolution
Number of workshops conducted for BPDM councillors
1 workshop conducted in 18/19FY
1 workshop for BPDM Councillors conducted by 30 June 2021
Operational Office of the Speaker
KPI not due KPI not due Workshop conducted for BPDM Councillors
KPI not due Q1 - KPI not due Q2 - KPI not due Q3 - Attendance register and report Q4 - KPI not due
Advocacy programmes conducted in BPDM
4 Advocacy programmes supported in 18/19 FY
4 Advocacy programmes conducted by 30 June 2021
R 0 Office of the Executive Mayor
1 Advocacy programme conducted
1 Advocacy programme conducted
1 Advocacy programme conducted
1 Advocacy programme conducted
Q1 – Report Q2 - Report Q3 - Report Q4 – Report
Number of Oversight report on Annual Report tabled to Council for adoption by Council
1 Oversight Report in place for 18/19FY
1 Oversight Report on 18/19 Annual Report tabled to Council for adoption by 31 March 2021
R 0 MPAC MPAC programmes implemented
MPAC programmes implemented
MPAC programmes implemented
Q1 - Report Q2 - Report Q3 - Oversight report and Council resolution Q4 – Report
Number of public participation programmes/events (Imbizos) conducted in Bojanala Region
2 events conducted in 18/19FY
2 public participation programmes/events (Imbizos) conducted in Bojanala Region by 30 June 2021
R 0 Office of the Executive Mayor
1 Imbizo (public participation) programme conducted in Bojanala Region
KPI not due 1 Imbizo (public participation) programme conducted in Bojanala Region
KPI not due Q1 –Attendance Register and Report Q2 - KPI not due Q3 -Attendance Register and Report Q4 - KPI not due

178 | P a g e
GOOD GOVERNANCE AND PUBLIC PARTICIPATION
Outcome 9 OUTPUT 1 Implement a differentiated approach to municipal financing, planning and support
OUTPUT 3 Implementation of the community work programme
OUTPUT 5 Deepen democracy through a refined ward committee model
OUTPUT 7 Single window of coordination
Strategic
Objective Key Performance Indicator Baseline Annual Target Budget
Responsible Department
Quarterly Targets Portfolio of Evidence Q 1 Q 2 Q 3 Q 4
Support Local Governance Structure
Number of District Anti Corruption awareness campaigns convened in Bojanala Region
2 Anti Corruption awareness campaign conducted in 18/19 FY
1 Anti Corruption awareness campaigns conducted in Bojanala Region by 30 June 2021
R 0 Office of the Speaker
KPI not due Anti Corruption awareness campaign conducted in Bojanala Region
KPI not due KPI not due Q1 – KPI not due Q2 - Attendance Register and Report Q3 -KPI not due Q4 - KPI not due
Number of NGO's/NPO's financially supported in Local Municipalities
5 NGO's/NPO's financially supported in 18/19 FY
5 NGO's/NPO's financially supported in Local Municipalities by 30 June 2021
R 0 Community Development Services
Advertisement for submission of business plans
Submission and Registration of Business Plans, Screening, Assessment, Verification and Awarding Ceremony.
Monitoring and Evaluation And Submission of Reports
Monitoring and Evaluation And Submission of Reports
Q1 - Advert and report Q2 - Report & photos Q3 - Report Q4 – Report
Number of Single Whip Forums convened in BPDM
4 Single Whip Forums convened in 18/19 FY
3 Single Whip Forums convened in BPDM by 30 June 2021
R 0 Office of the Single Whip
1 Chief Whip’s Forum convened
KPI not due 1 Home Affairs Forum convened
1 Multi Party Forum convened
Q1- Attendance register & minutes Q2 - KPI not due Q3 & Q4 – Attendance register & minutes
To Promote Good Governance and Community Participation
Number of IGR meetings held and facilitated by BPDM
2 IGR District Forum meetings held 18/19 FY
4 IGR Forum meetings held by 30 June 2021
R 0 Office of the Executive Mayor
1 IGR meeting held
1 IGR meeting held
1 IGR meeting held
1 IGR meeting held
Q1 - Report Q2 - Report Q3 - Report Q4 - Report

179 | P a g e
GOOD GOVERNANCE AND PUBLIC PARTICIPATION
Outcome 9 OUTPUT 1 Implement a differentiated approach to municipal financing, planning and support
OUTPUT 3 Implementation of the community work programme
OUTPUT 5 Deepen democracy through a refined ward committee model
OUTPUT 7 Single window of coordination
Strategic
Objective Key Performance Indicator Baseline Annual Target Budget
Responsible Department
Quarterly Targets Portfolio of Evidence Q 1 Q 2 Q 3 Q 4
Support Local Governance Structure
Number of public participation engagements with Local Municipalities in Bojanala Region convened
2 public participation engagements in 18/19FY
1 public participation engagement with Local Municipalities in Bojanala Region convened by 30 June 2021
R 0 Office of the Speaker
KPI not due KPI not due KPI not due 1 public participation engagement convened
Q1;Q2;Q3 - KPI not due Q4 - Attendance register and Report
To Promote Good Governance and Community Participation
Number of Community Outreach programmes supported
2 programmes supported in 18/19FY
2 Community Outreach programmes supported in Bojanala Region by 30 June 2021
R 0 Office of the Executive Mayor
Mandela Day programme financially supported in Bojanala Region
KPI not due 1 Community Outreach programme conducted in Bojanala Region
KPI not due
Q1 - Report Q2 - Not due Q3 - Report Q4 - Not due

180 | P a g e
MUNICIPAL INSTITUTIONAL DEVELOPMENT AND TRANSFORMATION
Outcome 9 OUTPUT 1 Implement a differentiated approach to municipal financing, planning and support
OUTPUT 6 Administrative and financial capability
Strategic
Objective Key Performance Indicator Baseline Annual Target Budget
Responsible Department
Quarterly Targets Portfolio of Evidence
Q 1 Q 2 Q 3 Q 4
Develop and Strengthen politically and administratively stable system of a municipality
Number of Reviewed 2020/21 IDP adopted by Council
2019/20 Reviewed IDP in place 19/20 FY
1 Reviewed 2020/21 IDP adopted by Council by 30 May 2020
Operational Office of the Municipal Manager
Consultation with Stakeholders LMs, Provincial HOD and Mining Sectors
Consultation with Stakeholders LMs, Provincial HOD and Mining Sectors
Draft Reviewed 2020/21 IDP tabled to Council for noting
1 Reviewed 2020/21 IDP tabled to Council for adoption
Q1 -Attendance Register & report Q2 - Attendance register & report Q3 - Draft Reviewed 2020/21 IDP & Council Resolution Q4 - Reviewed 2020/21 IDP & Council Resolution
Number of 2021/22 District IDP Framework and Process Plan approved by Council
2020/21 District IDP Framework & Process Plan approved in 19/20FY
1 2020/21 District IDP Framework & Process Plan approved by Council by 31 August 2020
Operational Office of the Municipal Manager
2020/21 District IDP Framework & Process Plan tabled to Council for approval
KPI not due KPI not due KPI not due Q1 - 2020/21 District IDP Framework & Process Plan and Council resolution Q2 - KPI not due Q3 - KPI not due Q4 - KPI not due
Number of 2020/21 Performance Agreements signed by BPDM Sec 56 Managers in accordance with MSA Sec 57
7 signed 2019/20 Performance Agreements in place
7 2020/21 Performance Agreements signed by BPDM Sec 56 Managers in accordance with Sec 57 of the MFA by 28 July 2020
Operational Office of the Municipal Manager
7 2020/21 Performance Agreements signed by Sec 56 Managers
KPI not due KPI not due KPI not due Q1 - Copies of signed Pas
Number of 2020/21 Mid Term Performance Review Reports adopted by Council
1 2019/20 Mid Term report in place
1 2020/21 Midterm Performance Review Report adopted by Council by 25 January 2021
Operational Office of the Municipal Manager
KPI not due KPI not due Mid Term Performance Report adopted by Council
KPI not due Q1 - KPI not due Q2 – KPI not due Q3 - Mid term report & Council Resolution Q4 - KPI not due

181 | P a g e
MUNICIPAL INSTITUTIONAL DEVELOPMENT AND TRANSFORMATION
Outcome 9 OUTPUT 1 Implement a differentiated approach to municipal financing, planning and support
OUTPUT 6 Administrative and financial capability
Strategic Objective
Key Performance Indicator Baseline Annual Target Budget
Responsible Department
Quarterly Targets Portfolio of Evidence Q 1 Q 2 Q 3 Q 4
Develop and Strengthen politically and administratively stable system of a municipality
Number of Quarterly Performance Reports for BPDM adopted by Council
4 x Quarterly Performance Reports in place
4 x quarterly performance reports adopted by Council by 30 June 2021
Operational Office of the Municipal Manager
1 Quarterly Performance report for BPDM adopted by Council (4th Quarter 19/20)
1 Quarterly Performance report for BPDM adopted by Council (1st Quarter 20/21)
1 Quarterly Performance report for BPDM adopted by Council (2nd Quarter 20/21)
1 Quarterly Performance report for BPDM adopted by Council (3rd Quarter 20/21)
Q1 – 19/20 Q4 report & council resolution Q2 - 20/21 Q1 report & council resolution Q3 - 20/21 Q2 report & council resolution Q4 - 20/21 Q3 report & council resolution
Number of Annual Reports tabled to Council for approval
1 Annual Report approved by Council in 19/20 FY
1 Annual Report tabled to Council for approval by 31 January 2021
Operational Office of the Municipal Manager
KPI not due Compilation of Draft Annual Report
Annual Report tabled to Council for approval
KPI not due Q1 - KPI not due Q2 - Draft Annual Report Q3 - Annual Report & Council Resolution Q4 - KPI not due
Number of financial reports uploaded on the official BPDM website
12 reports uploaded on the website for 19/20 FY
?? Financial reports uploaded on the BPDM website by 30 June 2021
Operational Office of the Municipal Manager
Financial reports uploaded on the BPDM website
Financial reports uploaded on the BPDM website
Financial reports uploaded on the BPDM website
Financial reports uploaded on the BPDM website
Q1 - Report Q2 - Report Q3 - Report Q4 – Report
Number of computer licences renewed for BPDM
5 computer licences renewed for BPDM for 18/19FY
4 computer licences renewed for BPDM by 30 June 2021
R 0 Office of the Municipal Manager
Antivirus and Payday computer licences renewed and paid
Global Insights computer licence renewed and paid
Pastel computer licence renewed and paid
KPI not due Q1 - Report Q2 - Report Q3 - Report Q4 - KPI not due

182 | P a g e
MUNICIPAL INSTITUTIONAL DEVELOPMENT AND TRANSFORMATION
Outcome 9 OUTPUT 1 Implement a differentiated approach to municipal financing, planning and support
OUTPUT 6 Administrative and financial capability
Strategic Objective
Key Performance Indicator Baseline Annual Target Budget
Responsible Department
Quarterly Targets Portfolio of Evidence
Q 1 Q 2 Q 3 Q 4
Develop and Strengthen politically and administratively stable system of a municipality
Number of quarterly updates of the Top 10 institutional risks in the BPDM Risk Register
Quarterly updates of risks in the BPDM Risk Register in place for 2019/20
2 Quarterly updates of risks in the BPDM Risk Register by 30 June 2021
R 0 Office of the Municipal Manager
KPI not due Quarterly update of the Top 10 institutional risks in the BPDM risk register
KPI not due Quarterly update of the Top 10 institutional risks in the BPDM risk register
Q1 - KPI not due Q2 - Quarterly report Q3 - KPI not due Q4 - Quarterly report
Achieve a sound labour and positive employee climate
Number of Labour Relations awareness workshops convened
4 Local Government Labour Relations awareness workshops convened in 17/18FY
4 Labour Relations workshops facilitated and convened by 30 June 2021
Operational Corporate Support Services
1 Labour Relations workshop facilitated
1 Labour Relations workshop facilitated
1 Labour Relations workshop facilitated
1 Labour Relations workshop facilitated
Q1 - Attendance register & Report Q2 - Attendance register & Report Q3 - Attendance register & Report Q4 - Attendance register & Report
Percentage of employees assisted through Employee Assistance Programme by BPDM
8 employees taken through EAP services in 17/18 FY
100% employees that have applied assisted through EAP by BPDM by 30 June 2021
R 0 Corporate Support Services
100% employees that have applied for assistance through EAP assisted
100% employees that have applied for assistance through EAP assisted
100% employees that have applied for assistance through EAP assisted
100% employees that have applied for assistance through EAP assisted
Q1, Q2, Q3 & Q4 - Quarterly referral letters and EAP reports
Enhance Employees Skills
Number of Training and Development Plans and Reports submitted to LGSETA
2 Training and Development Plans and Reports submitted to LGSETA in 19/20FY
2 Training and Development Plans and Reports submitted to LGSETA by 30 June 2021
R 0 Corporate Support Services
Implementation of training programmes
Implementation of training programmes
Training needs analysis completed
Submission of Training Report to LGSETA
Q1 - Report Q2 - Report Q3 - Report Q4 - Training report
Number of bursary committee meetings facilitated
2 bursary committee meetings facilitated in 19/20 FY
2 bursary committee meetings facilitated by 30 June 2021
R 0 Corporate Support Services
Review of the bursary Policy
Facilitation of application process for study bursaries. Convene bursary committee meeting
Progress report on bursary holders
Facilitation of application process for study bursaries. Convene bursary committee meetings
Q1 - Report Q2 - Agenda and minutes - Q3 - Report Q4 - Agenda and minutes

183 | P a g e
MUNICIPAL INSTITUTIONAL DEVELOPMENT AND TRANSFORMATION
Outcome 9 OUTPUT 1 Implement a differentiated approach to municipal financing, planning and support
OUTPUT 6 Administrative and financial capability
Strategic Objective
Key Performance Indicator Baseline Annual Target Budget
Responsible Department
Quarterly Targets Portfolio of Evidence Q 1 Q 2 Q 3 Q 4
Promote good governance through provision of administrative support
Number of legislated Council meetings convened
Secretarial services in place
6 Council meetings convened by 30 June 2021
Operational Corporate Support Services
1 Council meeting convened
1 Council meeting convened
2 Council meeting convened
2 Council meeting convened
Q1, Q2, Q3 & Q4 - Agendas, Attendance registers and Minutes
Number of monthly Mayoral Committee meetings convened
New 12 monthly Mayoral Committee meetings convened
Operational Corporate Support Services
3 Mayoral Committee meetings convened
3 Mayoral Committee meetings convened
3 Mayoral Committee meetings convened
3 Mayoral Committee meetings convened
Q1, Q2, Q3 & Q4 - Agendas, Attendance registers and Minutes
Number of Local Labour Forum meetings held
4 Local Labour Forum meetings held in 19/20FY
4 Local Labour Forum meetings held by 30 June 2021
Operational Corporate Support Services
1 Local Labour Forum meeting held
1 Local Labour Forum meeting held
1 Local Labour Forum meeting held
1 Local Labour Forum meeting held
Q1, Q2, Q3 & Q4 - Agendas, Attendance registers and Minutes
Number of Occupational Health and Safety Reports developed
New 4 quarterly Occupational Health and Safety Reports developed and submitted to the Accounting Officer by 30 June 2021
Operational Corporate Support Services
1 quarterly Occupational Health and Safety report developed and submitted to the Accounting Officer
1 quarterly Occupational Health and Safety report developed and submitted to the Accounting Officer
1 quarterly Occupational Health and Safety report developed and submitted to the Accounting Officer
1 quarterly Occupational Health and Safety report developed and submitted to the Accounting Officer
Q1 -Report Q2 - Report Q3 - Report Q4 – Report
Number of District Records Management Forum meetings held
4 District Records Management Forum meetings held 18/19FY
4 District Records Management Forum meetings held by 30 June 2021
Operational Corporate Support Services
1 District Records Management Forum meeting held
1 District Records Management Forum meeting held
1 District Records Management Forum meeting held
1 District Records Management Forum meeting held
Q1 - Report Q2 - Report Q3 - Report Q4 - Report
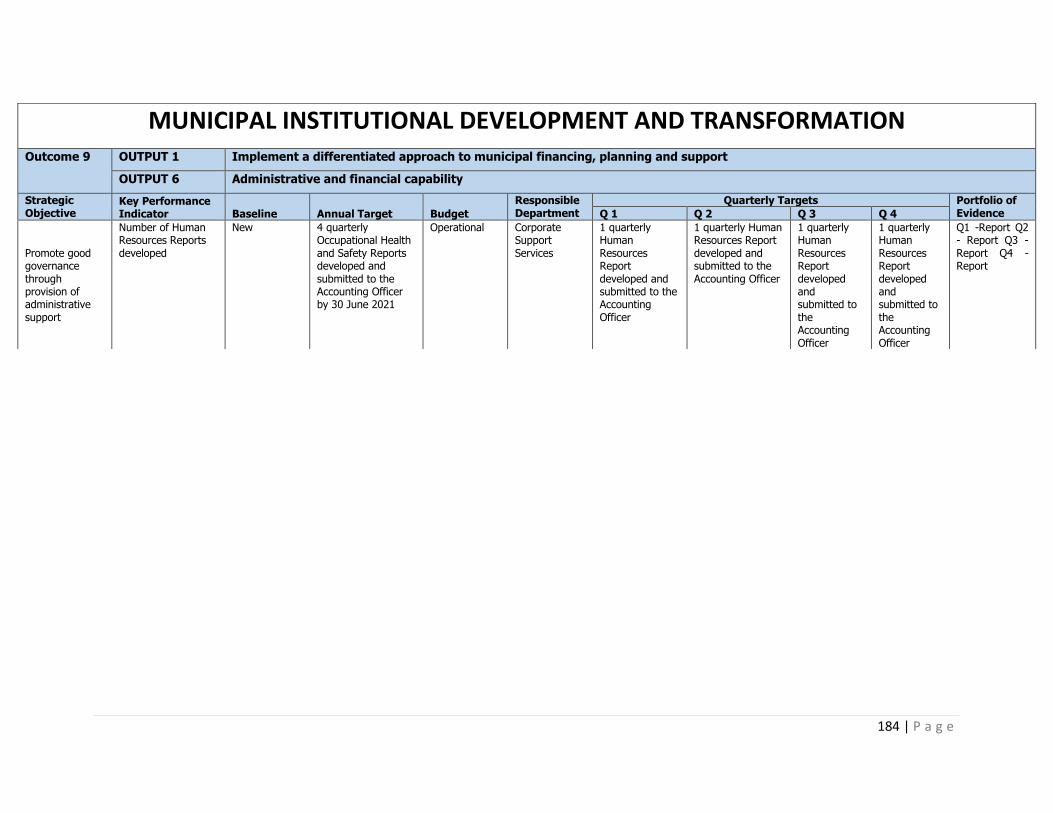
184 | P a g e
MUNICIPAL INSTITUTIONAL DEVELOPMENT AND TRANSFORMATION
Outcome 9 OUTPUT 1 Implement a differentiated approach to municipal financing, planning and support
OUTPUT 6 Administrative and financial capability
Strategic Objective
Key Performance Indicator Baseline Annual Target Budget
Responsible Department
Quarterly Targets Portfolio of Evidence Q 1 Q 2 Q 3 Q 4
Promote good governance through provision of administrative support
Number of Human Resources Reports developed
New 4 quarterly Occupational Health and Safety Reports developed and submitted to the Accounting Officer by 30 June 2021
Operational Corporate Support Services
1 quarterly Human Resources Report developed and submitted to the Accounting Officer
1 quarterly Human Resources Report developed and submitted to the Accounting Officer
1 quarterly Human Resources Report developed and submitted to the Accounting Officer
1 quarterly Human Resources Report developed and submitted to the Accounting Officer
Q1 -Report Q2 - Report Q3 - Report Q4 - Report

185 | P a g e
MUNICIPAL FINANCIAL VIABILITY AND MANAGEMENT
Outcome 9 OUTPUT 1 Implement a differentiated approach to municipal financing, planning and support
OUTPUT 6 Administrative and financial capability
Strategic Objective
Key Performance Indicator Baseline Annual Target Budget
Responsible Department
Quarterly Targets Portfolio of Evidence Q 1 Q 2 Q 3 Q 4
Strengthen the administrative and financial capability of municipalities
Number of MFMA Reports submitted to relevant stakeholders
16 MFMA Reports submitted to relevant stakeholders in 19/20 FY
18 MFMA Reports to be submitted to relevant stakeholders by 30 June 2021
Operational Budget and Treasury
3 x Sec 71 reports (19/20FY 4th Quarter Monthly budget statements) submitted to Provincial Treasury. 1 x Sec 21(1)(b) report - Key deadlines for the preparation, tabling and approval of the Annual Budget to Council for approval. 1 x Sec 126(1) - Submission of Annual Financial Statements to Auditor-General, Provincial Treasury and National Treasury
3 x Sec 71 reports (20/21 1st Quarter Monthly budget statements) submitted to Provincial Treasury.
3 Sec 71 reports (20/21 2nd Quarter Monthly budget statements) submitted to Provincial Treasury. 1 x Sec 72(1) Mid-year budget and Performance report. 1 x Sec 28 report - Municipal budget adjustment submitted to council for approval. 1 x Sec 16 report - Tabling of Annual Budget (Draft budget submitted to Council for tabling)
3 x Sec 71 reports (20/21 3rd Quarter Monthly budget statements) submitted to Provincial Treasury. 1x Sec 24 report - Approval of Annual budget by Council (Final Budget)
Q1: Acknowledgement by Provincial Treasury & Auditor General, Council Resolution Q2 - Acknowledgment letter by Provincial Treasury Q3 - Acknowledgement letter by Provincial Treasury & Council Resolution Q4 - Acknowledgement by Provincial Treasury & Council Resolution
Number of financial statements submitted to Council
Mid term AFS in place in 19/20 FY
1 Mid term AFS submitted to Council by 30 June 2021
Operational Budget and Treasury
KPI not due KPI not due Mid term AFS submitted to Council
KPI not due Q1 - KPI not due Q2 - KPI not due Q3 - Mid-Term AFS & Council Resolution Q4 - KPI not due
Number of annual budget compiled and approved
2019/20 Annual budget in place
1 BPDM Annual Budget compiled and approved by Council by 30 May 2021
Operational Budget and Treasury
KPI not due Consultation process
Draft Budget tabled to Council
Final Budget tabled to Council
Q1 - KPI not due Q2 - Report Q3 - Draft Budget Q4 - Final Budget & Council Resolution
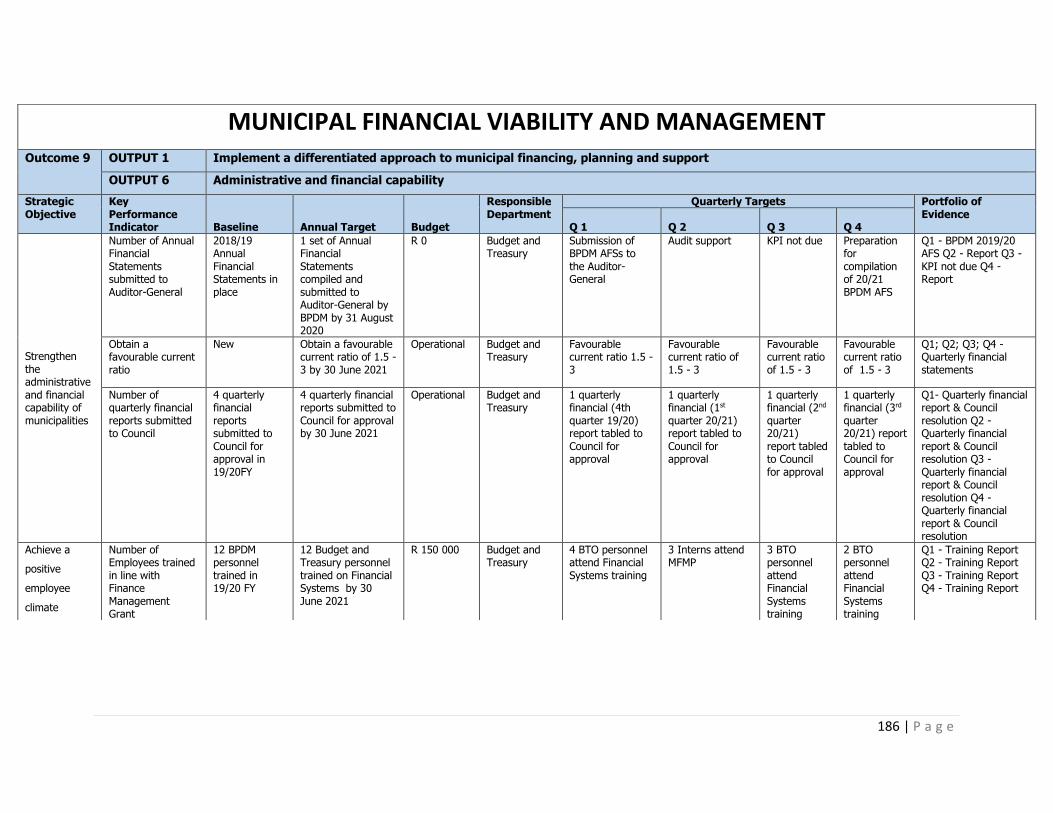
186 | P a g e
MUNICIPAL FINANCIAL VIABILITY AND MANAGEMENT
Outcome 9 OUTPUT 1 Implement a differentiated approach to municipal financing, planning and support
OUTPUT 6 Administrative and financial capability
Strategic Objective
Key Performance Indicator Baseline Annual Target Budget
Responsible Department
Quarterly Targets Portfolio of Evidence
Q 1 Q 2 Q 3 Q 4
Strengthen the administrative and financial capability of municipalities
Number of Annual Financial Statements submitted to Auditor-General
2018/19 Annual Financial Statements in place
1 set of Annual Financial Statements compiled and submitted to Auditor-General by BPDM by 31 August 2020
R 0 Budget and Treasury
Submission of BPDM AFSs to the Auditor-General
Audit support KPI not due Preparation for compilation of 20/21 BPDM AFS
Q1 - BPDM 2019/20 AFS Q2 - Report Q3 - KPI not due Q4 - Report
Obtain a favourable current ratio
New Obtain a favourable current ratio of 1.5 - 3 by 30 June 2021
Operational Budget and Treasury
Favourable current ratio 1.5 - 3
Favourable current ratio of 1.5 - 3
Favourable current ratio of 1.5 - 3
Favourable current ratio of 1.5 - 3
Q1; Q2; Q3; Q4 - Quarterly financial statements
Number of quarterly financial reports submitted to Council
4 quarterly financial reports submitted to Council for approval in 19/20FY
4 quarterly financial reports submitted to Council for approval by 30 June 2021
Operational Budget and Treasury
1 quarterly financial (4th quarter 19/20) report tabled to Council for approval
1 quarterly financial (1st quarter 20/21) report tabled to Council for approval
1 quarterly financial (2nd quarter 20/21) report tabled to Council for approval
1 quarterly financial (3rd quarter 20/21) report tabled to Council for approval
Q1- Quarterly financial report & Council resolution Q2 - Quarterly financial report & Council resolution Q3 - Quarterly financial report & Council resolution Q4 - Quarterly financial report & Council resolution
Achieve a
positive
employee
climate
Number of Employees trained in line with Finance Management Grant
12 BPDM personnel trained in 19/20 FY
12 Budget and Treasury personnel trained on Financial Systems by 30 June 2021
R 150 000 Budget and Treasury
4 BTO personnel attend Financial Systems training
3 Interns attend MFMP
3 BTO personnel attend Financial Systems training
2 BTO personnel attend Financial Systems training
Q1 - Training Report Q2 - Training Report Q3 - Training Report Q4 - Training Report

187 | P a g e
BASIC SERVICE DELIVERY AND INFRASTRUCTURE DEVELOPMENT
Outcome 9 OUTPUT 2 Improving access to basic services
OUTPUT 4 Actions supportive of the human settlement outcome
10 POINT PLAN NUMBER 1
Improve the quantity and quality of municipal basic services to the people in the area of access to water, sanitation, electricity, waste management, roads and disaster management
Strategic Objective
Key Performance Indicator Baseline Annual Target Budget
Responsible Department
Quarterly Targets Portfolio of Evidence Q 1 Q 2 Q 3 Q 4
Provision of new water infrastructure in support of LM’s towards free basic services
Number of Boreholes, Pipelines and Storage Tank constructed
1 borehole Drilled, Pipelines and 14 stand pipes completed in 2018/19 FY
1 Borehole, Pipelines and Storage tank constructed in Brakkuil (Phase 2), Moses Kotane LM by 30 June 2021
R 0 Technical Services
Construction of Pump House
Installation of Storage Tank ongoing
Construction of pipelines and electrification of the borehole ongoing
Boreholes, Pipelines and Storage Tank completed
Q1 Progress Report Q2 Progress Report Q3 Progress Report Q4 Completion Certificate
Provision of new Sanitation infrastructure in support of LM’s towards free basic services
Number of VIP toilets constructed in Dihibidung Phase 2 (Moretele LM-)
120 VIP toilets constructed in Dihibidung in 2018/19FY
180 VIP toilets constructed in Dihibidung (Moretele LM) by 30 June 2021
R 0 Technical Services
SCM Processes for Appointment of a service provider
Construction of VIP toilets commences
Construction of VIP toilets ongoing
Construction of 180 VIP toilets completed
Q1 Appointment letter Q2 Progress Report Q3 Progress Report Q4 Completion Certificate
Provision of new roads infrastructure in support of LM’s towards free basic services
Number of kilometres of access roads constructed
0.478 kms of internal roads completed in Reagile 2018/19 FY
Construction of 0.5km access road completed in Reagile (Kgetlengrivier LM) by 30 June 2021
R 0 Technical Services
SCM Processes for Appointment of a service provider
Road survey commences
Construction of layer works commences
Construction of 0,5kms access road completed
Q1 Appointment letter Q2 Progress Report Q3 Progress Report Q4 Completion Certificate
Provision of Transport Planning and Community Safety support
Number of Transport Planning projects developed by BPDM
1 Transport Planning project implemented in 19/20 FY
1 Rural Roads Asset Management System report for BPDM completed by 30 June 2021
R 2 648 000 Technical Services
Visual Assessments of the unpaved road network
Execution of traffic surveys
Updating and finalization of RRAMS GIS Model and mapping
RRAMS Final Technical report completed for BPDM
Q1 - Appointment letter Q2 - Progress Report Q3 - Progress Report Q4 - RRAMS Final Technical Report

188 | P a g e
BASIC SERVICE DELIVERY AND INFRASTRUCTURE DEVELOPMENT
Outcome 9 OUTPUT 2 Improving access to basic services
OUTPUT 4 Actions supportive of the human settlement outcome
10 POINT PLAN NUMBER 1
Improve the quantity and quality of municipal basic services to the people in the area of access to water, sanitation, electricity, waste management, roads and disaster management
Strategic Objective
Key Performance Indicator Baseline Annual Target Budget
Responsible Department
Quarterly Targets Portfolio of Evidence Q 1 Q 2 Q 3 Q 4
Provision of Transport Planning and Community Safety support
Number of Transport Planning projects developed by BPDM
1 Transport Planning project implemented in 19/20 FY
4 transport support programmes financially supported in 18/19 FY
R 0 Technical Services
1 transport support programme financially supported
1 transport support programme financially supported
1 transport support programme financially supported
1 transport support programme financially supported
Q1 - Report Q2 - Report Q3 - Report Q4 - Report
Number of community safety projects financially supported by BPDM
4 community safety programmes financially supported in 18/19 FY
4 community safety programmes financially supported by 30 June 2021
R 0 Technical Services
1 community safety programme financially supported
1 community safety programme financially supported
1 community safety programme financially supported
1 community safety programme financially supported
Q1 - Report Q2 - Report Q3 - Report Q4 - Report
To support local municipalities in Sport, Arts and Culture
Number of sport programmes implemented and financially supported by BPDM
4 Sports programmes supported in 18/19 FY
4 sport programmes to be implemented and financially supported by BPDM by 30 June 2021
R 0 Community Development Services
1 sport programme implemented and financially supported
1 sport programme implemented and financially supported
1 sport programme implemented and financially supported
1 sport programme implemented and financially supported
Q1 – Reports & photos Q2 - Report & photos Q3 - Report & photos Q4 - Reports & photos
Number of Local Municipalities supported with sports equipment by BPDM
4 sporting codes supported with sport equipment in 18/19 FY
5 Local Municipalities supported with sports equipment by BPDM by 30 June 2021
R 0 Community Development Services
Consultation with Local Municipalities
KPI not due KPI not due BPDM ensures that sport equipment is delivered to the Local Municipalities
Q1 – Request letters from Local Municipalites Q2 - KPI not due Q3 - KPI not due Q4 - Photos & report
Number of Arts and Culture events/programmes hosted and financially supported by BPDM
5 Arts and Culture events/programmes to be hosted and financially supported in 18/19 FY
4 Arts and Culture events/programmes to be hosted and financially supported by 30 June 2021
R 0 Community Development Services
1 Arts and Culture event/programme hosted and financially supported
1 Arts and Culture event/programme hosted and financially supported
1 Arts and Culture event/programme hosted and financially supported
1 Arts and Culture event/programme hosted and financially supported
Q1 – Attendance register, Report & photos Q2 - Attendance register, Report & photos Q3 - Attendance register, Report & photos Q4 - Attendance register, Report & photos

189 | P a g e
BASIC SERVICE DELIVERY AND INFRASTRUCTURE DEVELOPMENT
Outcome 9 OUTPUT 2 Improving access to basic services
OUTPUT 4 Actions supportive of the human settlement outcome
10 POINT PLAN NUMBER 1
Improve the quantity and quality of municipal basic services to the people in the area of access to water, sanitation, electricity, waste management, roads and disaster management
Strategic Objective
Key Performance Indicator Baseline Annual Target Budget
Responsible Department
Quarterly Targets Portfolio of Evidence Q 1 Q 2 Q 3 Q 4
To support local municipalities to improve the quantity and quality of municipal disaster management and Fire Services
Number of Community Based Disaster Risk Assessments completed in BPDM region
9 Community Based Disaster Risk Assessments completed in 19/20 FY
20 Community Based Disaster Risk Assessments completed by 30 June 2021 in BPDM region
R 0 Community Development Services
5 Community Based Disaster Risk Assessment reports with recommendations for action completed
5 Community Based Disaster Risk Assessment reports with recommendations for action completed
5 Community Based Disaster Risk Assessment reports with recommendations for action completed
5 Community Based Disaster Risk Assessment reports with recommendations for action completed
Q1 - Report Q2 - Report Q3 - Report Q4 - Report
Number of Public Awareness campaigns conducted in BPDM
6 Public Awareness campaigns conducted in 19/20 FY
20 Public Awareness campaigns conducted in BPDM region by 30 June 2021
R 0 Community Development Services
5 public awareness campaigns conducted in BPDM
5 public awareness campaigns conducted in BPDM
5 public awareness campaigns conducted in BPDM
5 public awareness campaigns conducted in BPDM
Q1 - Report Q2 - Report Q3 - Report Q4 - Report
To support local municipalities to improve the quantity and quality of municipal waste management, climate change, air quality and biodiversity
Number of Air Quality Management Programmes implemented in Bojanala Region
2 Air Quality programmes implemented in 19/20 FY
3 Air quality Management Programmes implemented in Bojanala Region by 30 June 2021
R 0 Health and Environmental Services
Consultation with stakeholders
Air quality management programmes implemented within BPDM
Air quality management programmes implemented within BPDM
Air quality management programmes implemented within BPDM
Q1 - Attendance register & Report Q2 - Attendance register & Report Q3 - Attendance register & Report Q4 - Attendance register & Report
Number of climate change awareness programmes implemented
2 initiatives implemented in 19/20 FY
4 climate change awareness programmes implemented within Bojanala District by 30 June 2021
R 0 Health and Environmental Services
Consultation with stakeholders
Climate change awareness programme implemented within Bojanala District
Climate change awareness programme implemented within Bojanala District
Climate change awareness programme implemented within Bojanala District
Q1 - Attendance register & Report Q2 - Attendance register & Report Q3 - Attendance register & Report Q4 - Attendance register & Report

190 | P a g e
BASIC SERVICE DELIVERY AND INFRASTRUCTURE DEVELOPMENT
Outcome 9 OUTPUT 2 Improving access to basic services
OUTPUT 4 Actions supportive of the human settlement outcome
10 POINT PLAN NUMBER 1
Improve the quantity and quality of municipal basic services to the people in the area of access to water, sanitation, electricity, waste management, roads and disaster management
Strategic Objective
Key Performance Indicator Baseline Annual Target Budget
Responsible Department
Quarterly Targets Portfolio of Evidence Q 1 Q 2 Q 3 Q 4
To support local municipalities to improve the quantity and quality of municipal waste management, climate change, air quality and biodiversity
Number of waste management programmes implemented
3 Waste Management programmes implemented in 19/20FY
3 waste management Programmes to be implemented within BPDM by June 2021
R 0 Health and Environmental Services
Consultation with stakeholders
Waste management Programmes to be implemented within BPDM
Waste management Programmes to be implemented within BPDM
Waste management Programmes to be implemented within BPDM
Q1 - Report Q2 - Report Q3 - Report Q4 - Report
Number of Municipal Health outreach activities conducted for Environmental Health compliance with legislation
6 Municipal Health outreach activities implemented during 19/20 FY
7 Municipal Health outreach activities implemented within the Bojanala Region by 30 June 2021
R 0 Health and Environmental Services
1 Health awareness training implemented
KPI not due 3 Health awareness training implemented
3 Health awareness training implemented
Q1 - Attendance register & Report Q2 - KPI not due Q3 - Attendance register & Report Q4 - Attendance register & Report
Number of waste recovery awareness campaigns implemented
2 waste recovery awareness campaigns implemented in 5 Local Municipalities in 19/20FY
5 waste recovery awareness campaigns implemented within Bojanala Region by 30 June 2021
R 0 Health and Environmental Services
2 Waste recovery awareness campaign implemented in Bojanala Region
KPI not due 2 Waste recovery awareness campaign implemented in Bojanala Region
1 Waste recovery awareness campaign implemented in Bojanala Region
Q1 - Attendance register & Report Q2 -KPI not due Q3 - Attendance register & Report Q4 - Attendance register & Report
Number of biodiversity projects implemented
2 Biodiversity projects implemented in 19/20FY
3 greening biodiversity projects implemented within Bojanala Region by 30 June 2021
R 0 Health and Environmental Services
Consultation with Stakeholders
1 Greening Project implemented in Bojanala Region
1 Greening Project implemented in Bojanala Region
1 Greening Project implemented in Bojanala Region
Q1 - Attendance register & Report Q2 - Attendance register & Report Q3 - Attendance register & Report Q4 - Attendance register & Report
Number of environmental education and awareness programmes implemented
2 environmental and education awareness programmes implemented in 19/20FY
4 environmental and education awareness programmes implemented within Bojanala Region by 30 June 2021
R 0 Health and Environmental Services
1 environmental education awareness programmes implemented
1 environmental education awareness programmes implemented
1 environmental education awareness programmes implemented
1 environmental education awareness programmes implemented
Q1 - Attendance register & Report Q2 - Attendance register & Report Q3 - Attendance register & Report Q4 - Attendance register & Report

191 | P a g e
LOCAL ECONOMIC DEVELOPMENT
Outcome 9 OUTPUT 3 Implementation of the community work programme
Strategic Objective
Key Performance Indicator Baseline Annual Target Budget
Responsible Department
Quarterly Targets Portfolio of Evidence Q 1 Q 2 Q 3 Q 4
Enhance the municipal contribution to job creation and sustainable livelihoods through Local Economic Development
Number of Enterprises supported by BPDM
2 Enterprises supported in 18/19 FY
5 co-operatives financially supported by 30 June 2021
R 0 Economic Development, tourism, mining and rural development
Stakeholder engagements
SCM processes 2 co-operatives financially supported
3 co-operatives financially supported
Q1 - Report and Attendance register Q2 - Report Q3 -Report Q4 -Report
5 SMMEs financially supported by 30 June 2021
R 0 Economic Development, tourism, mining and rural development
Stakeholder engagements
SCM processes 2 SMMEs financially supported
3 SMMEs financially supported
Q1 - Report and Attendance register Q2 - Report Q3 -Report Q4 -Report
New 1 LED Strategy reviewed and tabled to Council for adoption by 30 June 2021
R 0 Economic Development, tourism, mining and rural development
SCM Processes Consultations on the Draft LED Strategy
Review process completed
Reviewed LED Strategy tabled to Council for adoption
Q1 - Report Q2 - Report Q3 -Report Q4 -LED Strategy and Council Resolution
Number of LED trainings conducted
1 training initiative implemented in 2018/19FY
2 trainings conducted for LED co-operatives and SMMEs by 30 June 2021
R 0 Economic Development, tourism, mining and rural development
Stakeholder engagements
1 training conducted
1 training conducted
KPI not due Q1 - Report and Attendance register Q2 - Report Q3 -Report Q4 -KPI not due
Co-ordination and consolidation of a District wide Social Labour Plans
New 1 District wide Social Labour Plans co-ordinated and consolidated by 30 June 2021
R 0 Economic Development, tourism, mining and rural development
Stakeholder engagements
Consolidation of SLPs
KPI not due Final District wide consolidated SLPs
Q1 - Report and Attendance register Q2 - Report Q3 -KPI not due Q4 - Report
Number of Agricultural and Rural Development trainings conducted
1 Agriculture and Rural Development training in 18/19FY
2 Agricultural and Rural Development trainings conducted by 30 June 2021
R 0 Economic Development, tourism, mining and rural development
Stakeholder engagements and profiling
1 training conducted
1 training conducted
KPI not due Q1 - Report and Attendance register Q2 - Report Q3 -Report Q4 - KPI not due
Number of Agriculture and Rural Development Co-operatives/Individuals financially supported
4 Agriculture and Rural Development Co-operatives financially supported in 18/19FY
5 agriculture and rural development co-operatives/individuals financially supported by 30 June 2021
R 0 Economic Development, tourism, mining and rural development
Stakeholder engagements and profiling
2 co-ops financially supported
3 co-ops financially supported
Final report Q1 - Report and Attendance register Q2 - Report Q3 -Report Q4 - Final Report

192 | P a g e
LOCAL ECONOMIC DEVELOPMENT
Outcome 9 OUTPUT 3 Implementation of the community work programme
Strategic Objective
Key Performance Indicator Baseline Annual Target Budget
Responsible Department
Quarterly Targets Portfolio of Evidence Q 1 Q 2 Q 3 Q 4
Enhance the municipal contribution to job creation and sustainable livelihoods through Local Economic Development
Number of livestock improvement programme activities for Agri-park financially supported
5 Agri-park livestock improvement programme activities financially supported in 18/19FY
3 Agri-park livestock improvement programme activities financially supported in BPDM by 30 June 2021
R 0 Economic Development, tourism, mining and rural development
Stakeholder engagements
Identification of Agri-park livestock improvement programme activities to be financially supported
KPI not due 3 Agri-park livestock improvement programme activities financially supported in BPDM and final report
Q1 - Report and Attendance register Q2 - Report Q3 - KPI not due Q4 - Report
Number of Tourism Associations financially supported
5 District Tourism activities financially supported in 18/19FY
5 Tourism Associations financially supported by 30 June 2021
R 0 Economic Development, tourism, mining and rural development
Stakeholder engagements
SCM processes 2 Tourism Associations financially supported
3 Tourism Associations financially supported
Q1 - Report and Attendance register Q2 - Report Q3 - Report Q4 - Report
Number of Tourism Summits financially supported
2 District Tourism exhibition events to be held in 18/19FY
1 Tourism summit financially supported by 30 June 2021
R 0 Economic Development, tourism, mining and rural development
Stakeholder engagements
SCM Processes 1 Tourism Summit financially supported
KPI not due Q1 - Report and Attendance register Q2 - Report Q3 - Report Q4 - KPI not due
Number of Land Care Plans developed
New 1 Land Care Plan developed and approved by Council by 30 June 2021
R 0 Economic Development, tourism, mining and rural development
Stakeholder engagements
SCM Processes Consultations on the Draft Land Care Plan
Land Care Plan tabled to Council
Q1 - Report and Attendance register Q2 - Report Q3 - Report Q4 - KPI not due

193 | P a g e
ORGANISATIONAL STRUCTURE
OFFICE OF THE EXECUTIVE MAYOR
OFFICE OF THE EXECUTIVE MAYOR
F MOLOSIWA
CORDINATOR IGR
N MOLOI
LEVEL 5
VIP PROTECTOR
SK Mogorosi
JS Mekgwe
RT NDIMANE
JM MATSOBE
LEVEL 7
CORDINATOR SPECIAL PROJECT
C LEKETE
LEVEL 5
EXECUTIVE SECRETARY
S LETSWALO
LEVEL 9
CHIEF OF STAFF
P MAGANO
RECEPTIONIST
M MSOMI
LEVEL 12
SECRETARY TO MMC’S
NDLOVU H, DIALE DG, MODIMOLA EMT,
MOKOENA SJ, SEBONEGO EH, THEBE LTR, TLABYANE LT,
XATASI N, M DIBETSO, F TEMA LEVEL 9
MANAGER
COMMUNICATION
LEVEL 2(A)
A BABEILE
COMMUNICATION
OFFICER
VACANT LEVEL 5

194 | P a g e
OFFICE OF THE SPEAKER
c
SPEAKER OF COUNCIL
E.TANKE
MPAC CHIARPERSON
S DAVIDS
MANAGER: OFFICE
OF THE SPEAKER
B QIQIMANA
LEVEL 2A
CORDINATOR
MPAC
M.
RAMAKOBYA
LEVEL 6
SECRETARY TO THE
SPEAKER
T MOLETE
LEVEL 9
CORDINTOR
OFFICE OF
THE SPEAKER
X2
B CHIDI
1 VACANT
(LEVEL 5)
RESEACHER
MPAC
LEVEL 5
VACANT
SECRETARY
MPAC
VACANT
LEVEL 9
DRIVER X 1
LEVEL 14
VACANT

195 | P a g e
OFFICE OF THE SINGLE WHIP
SINGLE WHIP OF
COUNCIL
P TLHAPI
SECRETARY TO THE
SINGLE WHIP LEFOLA
MB
LEVEL 9 MANAGER – OFFICE OF
THE SINGEL WHIP
VACANT
LEVEL 2A
CO-ORDINATOR
LEVEL 5
VACANT
CO-ORDINATOR
LEVEL 5
VACANT
RESEARCHER
LEVEL 14
VACANT
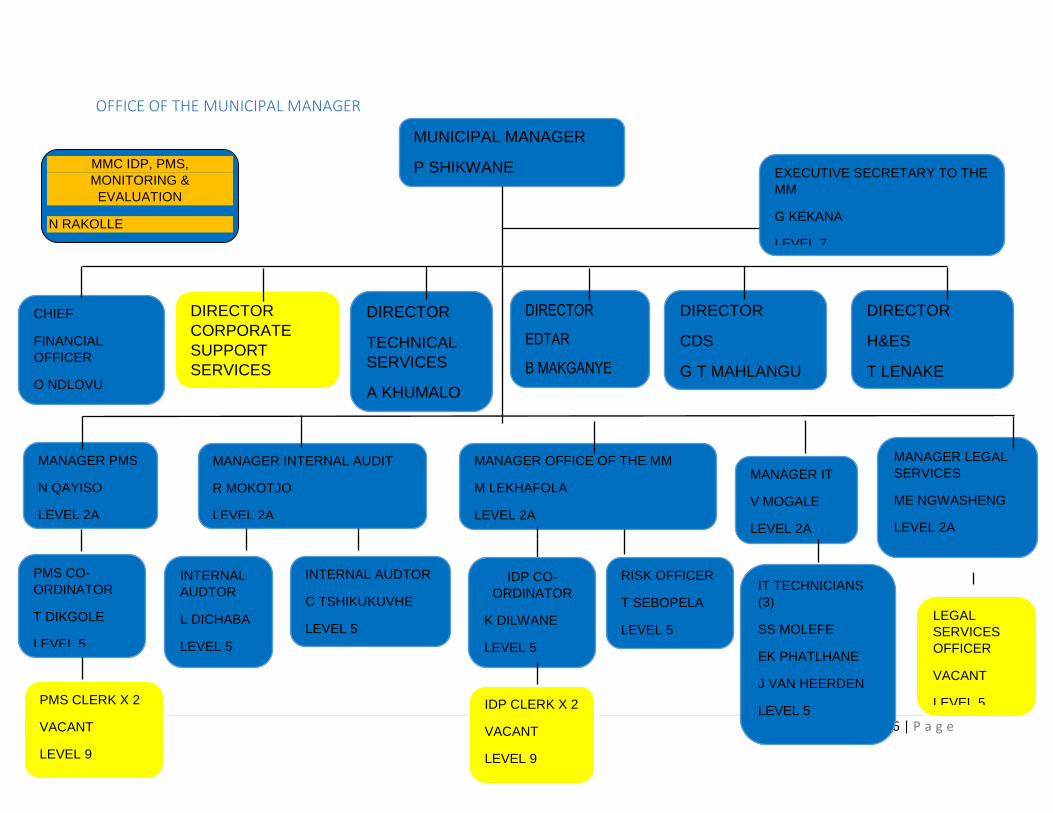
196 | P a g e
OFFICE OF THE MUNICIPAL MANAGER
MUNICIPAL MANAGER
P SHIKWANE EXECUTIVE SECRETARY TO THE
MM
G KEKANA
LEVEL 7
CHIEF
FINANCIAL
OFFICER
O NDLOVU
DIRECTOR
TECHNICAL
SERVICES
A KHUMALO
DIRECTOR
EDTAR
B MAKGANYE
DIRECTOR
CDS
G T MAHLANGU
DIRECTOR
H&ES
T LENAKE
MANAGER PMS
N QAYISO
LEVEL 2A
MANAGER INTERNAL AUDIT
R MOKOTJO
LEVEL 2A
MANAGER OFFICE OF THE MM
M LEKHAFOLA
LEVEL 2A
MANAGER IT
V MOGALE
LEVEL 2A
MANAGER LEGAL
SERVICES
ME NGWASHENG
LEVEL 2A
DIRECTOR
CORPORATE
SUPPORT
SERVICES
VACANT
PMS CO-
ORDINATOR
T DIKGOLE
LEVEL 5
INTERNAL
AUDTOR
L DICHABA
LEVEL 5
INTERNAL AUDTOR
C TSHIKUKUVHE
LEVEL 5
PMS CLERK X 2
VACANT
LEVEL 9
IDP CO-
ORDINATOR
K DILWANE
LEVEL 5
RISK OFFICER
T SEBOPELA
LEVEL 5
IT TECHNICIANS
(3)
SS MOLEFE
EK PHATLHANE
J VAN HEERDEN
LEVEL 5
LEGAL
SERVICES
OFFICER
VACANT
LEVEL 5 IDP CLERK X 2
VACANT
LEVEL 9
MMC IDP, PMS,
MONITORING &
EVALUATION
N RAKOLLE

197 | P a g e
TECHNICAL SERVICES (A)
DIRECTOR
A KHUMALO
Ms. B Matlhase
SECRETARY
MANAGER: LAND,
HOUSING
&ELECTRICITY
LEVEL 2(A)
MANAGER: WATER &
SANITATION
LEVEL 2(A)
VACANT
M.M.C:
TECHNICAL SERVICES
Mrs K Monamodi
MANAGER:
ROADS & STORM
WATER
CIVIL
TECHNICIAN
PS MAKHAYE
Mr. Neo Mokone SOCIAL FACILITATOR
LEVEL 5
Mr K Moilwa Coordinator
Mr S Magakwe Coordinator
MrsDKhethani Coordinator
LEVEL (5)
MANAGER: TRANSPORT PLANNING
VACANT LEVEL 2A
CIVIL TECHNICIAN
VACANT LEVEL5
CIVIL TECHNICIAN
VACANT LEVEL5
GENERAL MAINTANANCE
VACANT LEVEL15
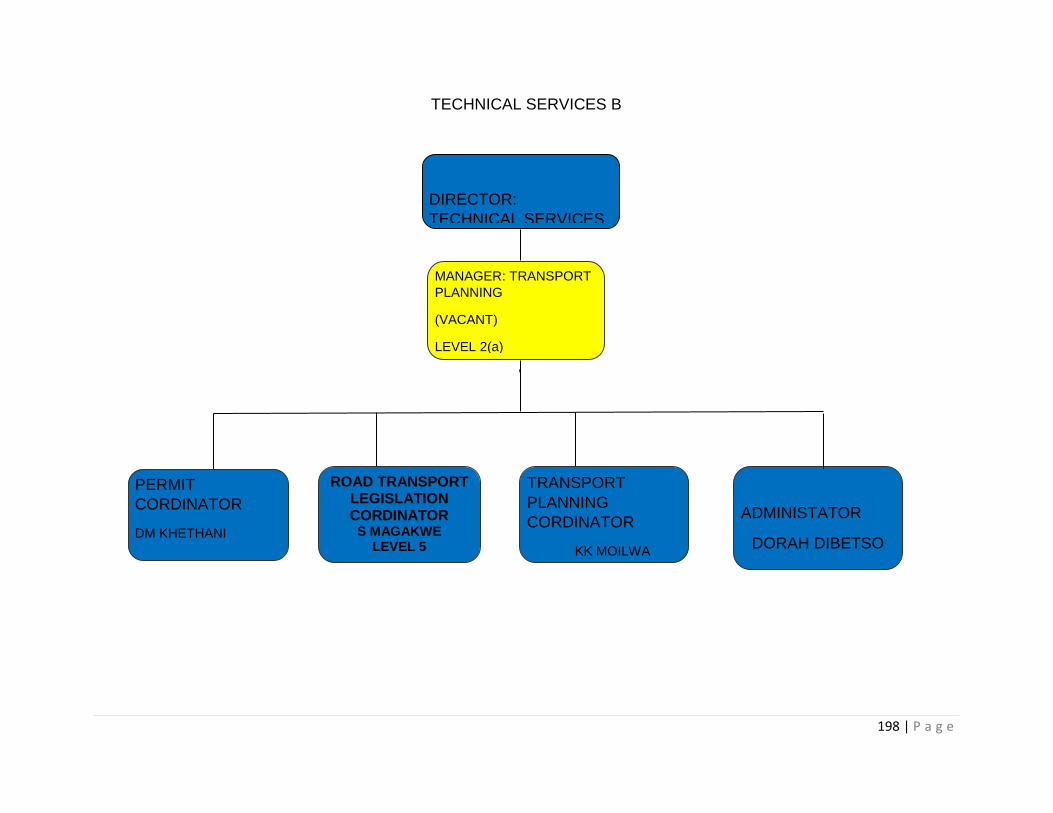
198 | P a g e
TECHNICAL SERVICES B
MANAGER: TRANSPORT
PLANNING
(VACANT)
LEVEL 2(a)
DIRECTOR:
TECHNICAL SERVICES
PERMIT
CORDINATOR
DM KHETHANI
LEVEL 5
TRANSPORT
PLANNING
CORDINATOR
KK MOILWA
ADMINISTATOR
DORAH DIBETSO
LEVEL 8
ROAD TRANSPORT LEGISLATION CORDINATOR
S MAGAKWE LEVEL 5

199 | P a g e
CORPORATE SUPPORT SERVICES - A
DIRECTOR
VACANT SECRETARY
S RAMASIA
MANAGER:
ADMINISTRATION
M MAAPE
M.M.C:
Corporate Support Services
T PAPA
PRINTING
OFFICER
C LEKABE
ADMIN SUPPORT
OFFICER: COMMITTES
F MASILO
COUNCIL
SECRETARY X 3
R TSATSANE
T MOGAPI
SUPERVISOR:
GENERAL WORKERS
B RAMONG
DRIVERS
X5
S MOSAJWANE
S KGAKOE
B DIALE
MESSENGERS X
2
L MABELE
B ZITHA
GENERAL WORKERS X15
M MOTSAPI D KGWADI S POOE D MAHUMA M MSIBI I TSHOKOTSI MK MOOKETSI M SEBEGO THWALA S J SEDUMEDI MMOPE B M LETSHOLO B MOLEFE J RAMOKOKA G MALEBYE K CUNA
B MARURE LEVEL 15
RECEPTIONISTS X3
F MONYANA E PHAKA
N SENELO LEVEL 12
LOGISTICS OFFICER
S RAMAKHULA
LEVEL 7

200 | P a g e
CORPORATE SUPPORT SERVICES C (HR UNIT)
DIRECTOR
VICANT
HR MANAGER
KH MPETE
(LEVEL 2(A)
LABOUR
RELATIONS
OFFICER
K RAMOKOPELWA
LEVEL 5
HR ADMIN
OFFICER
N MPETE
LEVEL 7
OHS SAFETY
OFFICER
K MOLAPISI
LEVEL (6)
HRD & OD
(LEVEL 5)
VACANT
HR ADMIN
OFFICER
VACANT
LEVEL 7

201 | P a g e
CORPORATE SUPPORT SERVICES:”B” RECORDS UNIT
DIRECTOR:
CORPORATE
SUPPORT SERVICES
VACANT
RECORDS OFFICER:
Records Keeping
D MMUSHI
RECORDS OFFICER: Archives
D MOGOTSI LEVEL 7
FILING CLERK X 2
M MAFATLHE H MOTSHABI
LEVEL 9
M
TSHUKUDU
RECORD
MANAGER
RECORDS CLERK
A MODISANE
C KGARIMETSA
R TSHOKE

202 | P a g e
DEPARTMENT OF ECONOMIC DEVELOPMENT, TOURISM, AGRIC & RURAL DEVELOPMENT
DIRECTOR – ECONOMIC
DEV, AGRICULTURE &
RURAL DEV.
B MAKGANYE
SECRETARY
EA STROCH
MANAGER
TOURISM,
MARKETING &
DEVELOPMENT
MANAGER
RURAL
DEVELOPMENT,
AGRICULTURE
MOKGATSI L.M
M.M.C: ECONOMIC DEV,
TOURISM, AGRIC & RURAL
DEV.
D TLABYANE
MANAGER:
MINING &
ENTERPRISE
DEVELOPMENT
K.P MASEMOLA
COORDINATOR:
MINING &
ENTERPRISE
DEVELOPMENT
COORDINATOR: AGRICULTURE &
RURAL DEVELOPMENT M.D LETLAPE
LEVEL 5
OFFICER TOURISM &
MARKETING ENTERPRISE
DEVELOPMENT MATSHEGO O
LEVEL 5
CORDINATOR
AGRICULTURE AND
RURAL
DEVELOPMENT
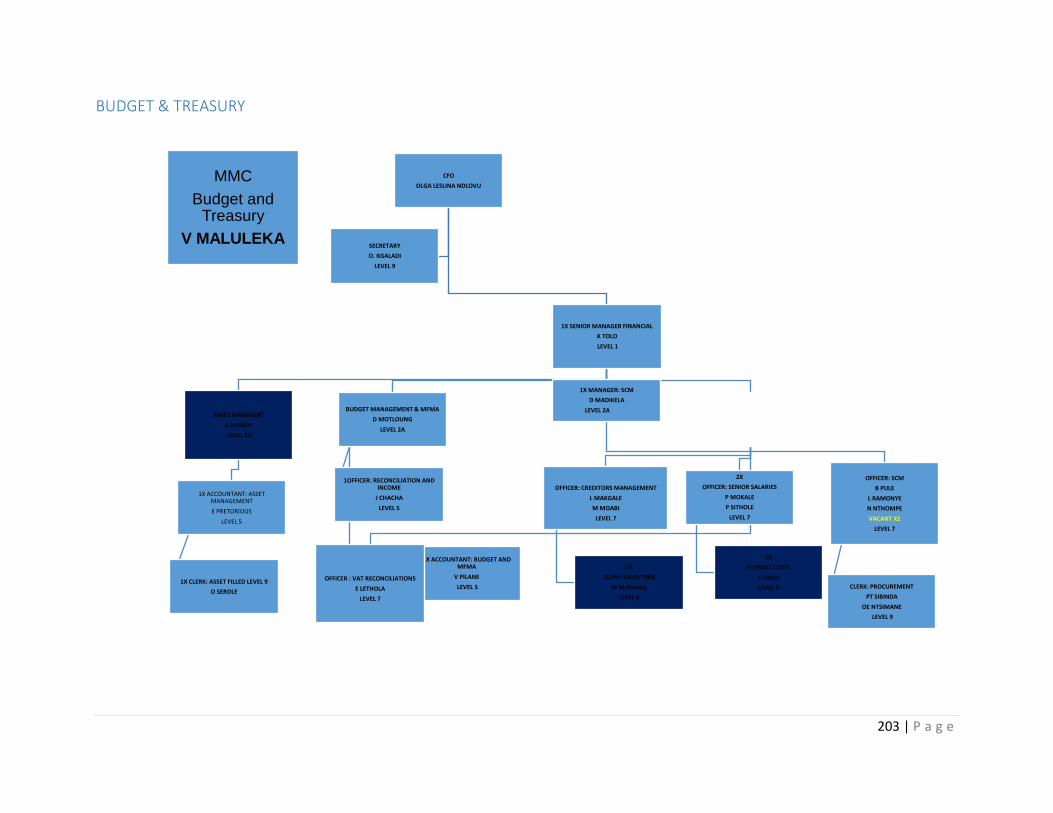
203 | P a g e
BUDGET & TREASURY
CFO
OLGA LESLINA NDLOVU
1X SENIOR MANAGER FINANCIAL
A TOLO
LEVEL 1
OFFICER: SCM
B PULE
L RAMONYE
N NTHOMPE
VACANT X1
LEVEL 7
CLERK: PROCUREMENT
PT SIBINDA
OE NTSIMANE
LEVEL 9
ASSET MANAGER"
A JANSEN
LEVEL 2A
1X ACCOUNTANT: ASSET MANAGEMENT
E PRETORIOUS
LEVEL 5
1X CLERK: ASSET FILLED LEVEL 9
O SEROLE
BUDGET MANAGEMENT & MFMA
D MOTLOUNG
LEVEL 2A
1OFFICER: RECONCILIATION AND INCOME
J CHACHA
LEVEL 5
1X ACCOUNTANT: BUDGET AND MFMA
V PILANE
LEVEL 5
1X MANAGER: EXPENDITURE
PROPOSED VACANT (TO BE FILLED) LEVEL 2
OFFICER: CREDITORS MANAGEMENT
L MAKGALE
M MOABI
LEVEL 7
1X
CLERK: CREDITORS
M Mokwena
LEVEL 9
2X
OFFICER: SENIOR SALARIES
P MOKALE
P SITHOLE
LEVEL 7
1X
PAYROLL CLERK
L Rabisi
LEVEL 9
OFFICER : VAT RECONCILIATIONS
E LETHOLA
LEVEL 7
SECRETARY
O. KGALADI
LEVEL 9
MMC
Budget and Treasury
V MALULEKA
1X MANAGER: SCM
D MADIKELA
LEVEL 2A
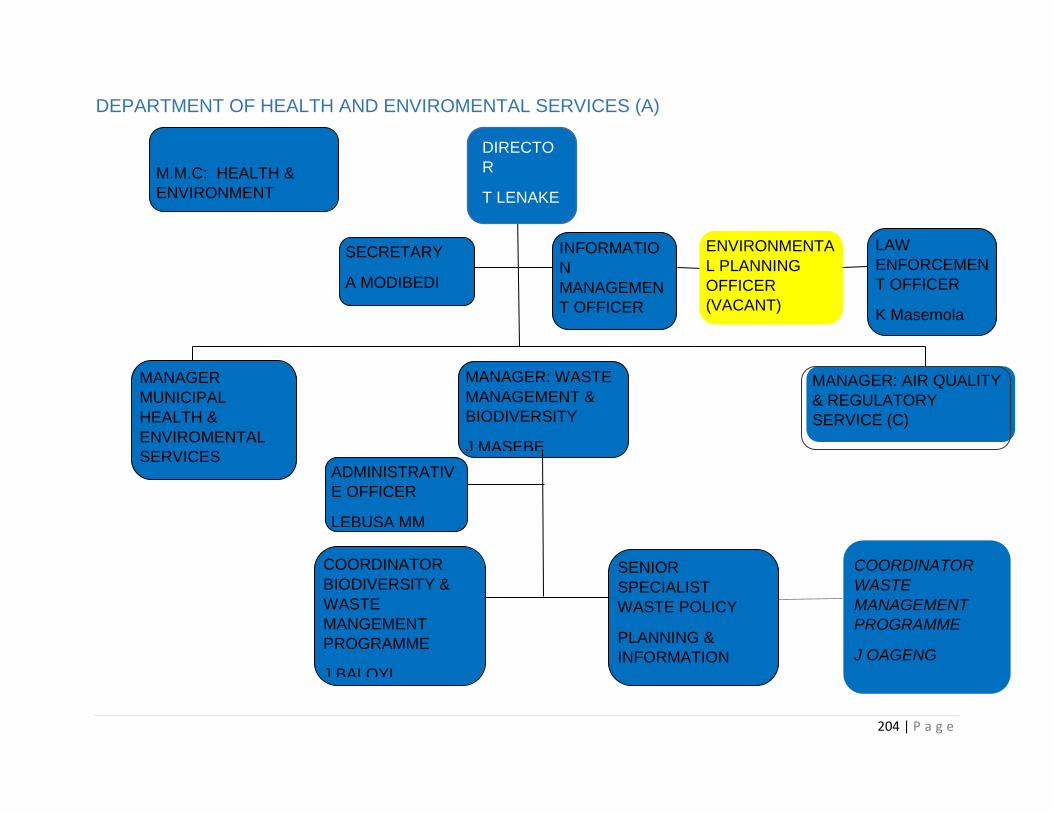
204 | P a g e
DEPARTMENT OF HEALTH AND ENVIROMENTAL SERVICES (A)
MANAGER: WASTE
MANAGEMENT &
BIODIVERSITY
J MASEBE
M.M.C: HEALTH &
ENVIRONMENT
MANAGER: AIR QUALITY
& REGULATORY
SERVICE (C)
LEVEL 2A
ADMINISTRATIV
E OFFICER
LEBUSA MM
COORDINATOR
BIODIVERSITY &
WASTE
MANGEMENT
PROGRAMME
J BALOYI
SENIOR
SPECIALIST
WASTE POLICY
PLANNING &
INFORMATION
R MKHONDO
INFORMATIO
N
MANAGEMEN
T OFFICER
ENVIRONMENTA
L PLANNING
OFFICER
(VACANT)
LAW
ENFORCEMEN
T OFFICER
K Masemola
SECRETARY
A MODIBEDI
LEVEL 9
DIRECTO
R
T LENAKE
MANAGER
MUNICIPAL
HEALTH &
ENVIROMENTAL
SERVICES
VACANT
LEVEL 2A
COORDINATOR
WASTE
MANAGEMENT
PROGRAMME
J OAGENG
LEVEL 5
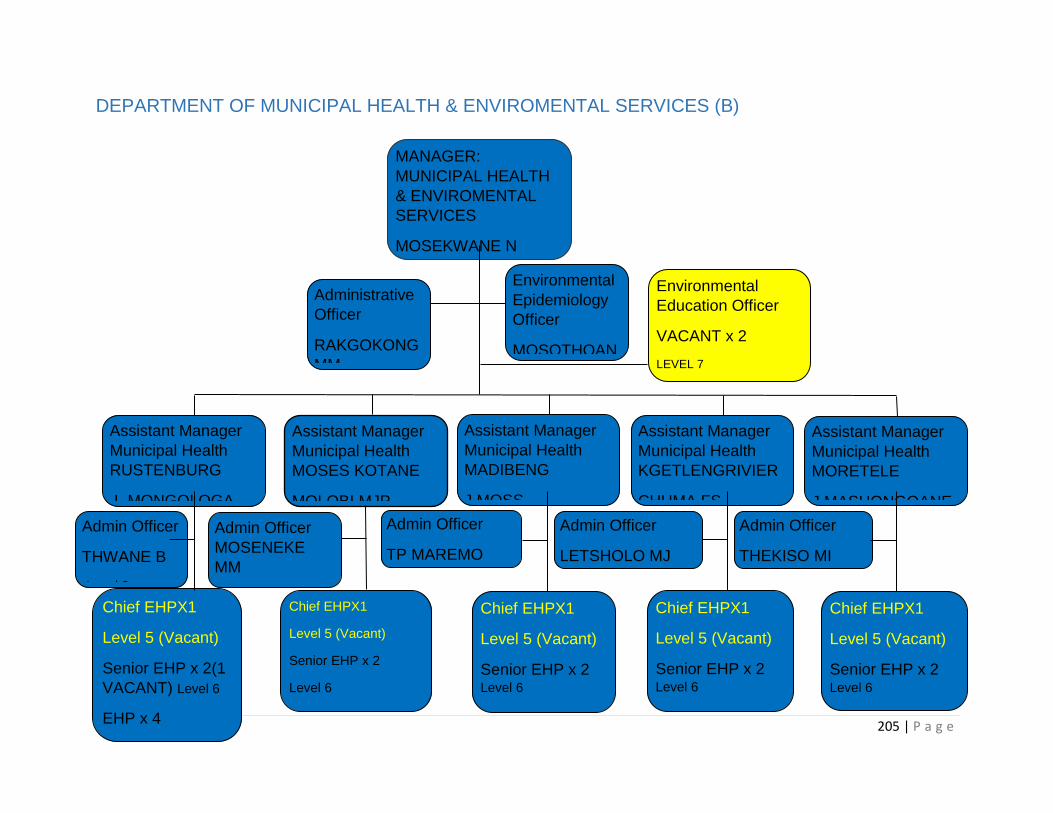
205 | P a g e
DEPARTMENT OF MUNICIPAL HEALTH & ENVIROMENTAL SERVICES (B)
MANAGER:
MUNICIPAL HEALTH
& ENVIROMENTAL
SERVICES
MOSEKWANE N
Administrative
Officer
RAKGOKONG
MM
Assistant Manager
Municipal Health
RUSTENBURG
L MONGOLOGA
Chief EHPX1
Level 5 (Vacant)
Senior EHP x 2(1
VACANT) Level 6
EHP x 4
Environmental
Education Officer
VACANT x 2
LEVEL 7
Admin Officer
THWANE B
Level 8
Assistant Manager
Municipal Health
MOSES KOTANE
MOLOBI MJP
Assistant Manager
Municipal Health
MADIBENG
J MOSS
Assistant Manager
Municipal Health
KGETLENGRIVIER
CHUMA FS
Assistant Manager
Municipal Health
MORETELE
J MASHONGOANE
Admin Officer
MOSENEKE
MM
Admin Officer
TP MAREMO
Admin Officer
LETSHOLO MJ
Admin Officer
THEKISO MI
Chief EHPX1
Level 5 (Vacant)
Senior EHP x 2 Level 6
EHP x 2
Chief EHPX1
Level 5 (Vacant)
Senior EHP x 2 Level 6
EHP x2
Chief EHPX1
Level 5 (Vacant)
Senior EHP x 2 Level 6
EHP x 2
Chief EHPX1
Level 5 (Vacant)
Senior EHP x 2
Level 6
EHP x 2
Environmental
Epidemiology
Officer
MOSOTHOAN

206 | P a g e
DEPARTMENT OF HEALTH &ENVIROMENTAL SERVICES (C) - AIR QUALITY & REGULATORY
MANAGER: AIR
QUALITY &
REGULATORY
SERVICE
Administrative
Officer
A Aphiri
Co-ordinator: Air
Quality and
Regulatory Services
VACANT
Climate Change and
Cleaner Production
Officers
P MATHEBA
W MANGANYI
Compliance
Monitoring Officers
T
PUSHOYABONE
Emission Licensing
Officer
LEVEL (6)
Air Quality
Control officer
LEVEL (6)
Senior Specialist:
Permitting and Air
Quality
(Management
T MATHEKGA

207 | P a g e
DEPARTMENT OF COMMUNITY DEVELOPMENT SERVICES (A)
DIRECTOR
G MAHLANGU
MANAGER: FIRE
SERVICES
P DIRAPELO
MANAGER:
DISASTER RISK
MANAGEMENT
P MORARE
M.M.C: COMMUNITY
DEVELOPMENT
SERVICES
MANAGER:
SOCIAL
DEVELOPMENT
J MOSETE
ADMINISTRATIVE
OFFICER
P MANGOLE
GIS
OFFICER
T Malebo
DISASTER
MANAGEMENT
FIELD
OFFICER
D MAKGALE
S NCONGOLOX
MANAGER:
SPORTS, ARTS &
CULTURE
M RADITLADI
COMMUNICATIO
N & TRAINING
OFFICER
I KGOMO
RISK OFFICER K MOLAO LEVEL 7
DISASTER ASSESSMENT
OFFICER P TSELAPEDI
LEVEL 7
RADIO CONTROL
OFFICER X 3 P
LEKOTLOANE R
MOLOKWANE T MASHIACHIDI
LEVEL 9
SECRETARY L MODISE
LEVEL 8
COORDINATOR COMMUNITY SAFETY
K DIKOBE
LEVEL 5
SOCIAL DEVELOPMENT COORDINATOR
X2 M MALETE N MOGOTSI
LEVEL 5

208 | P a g e
DEPARTMENT OF COMMUNITY DEVELOPMENT SERVICES (B) – FIRE SERVICES
Station Officer-
OPS x 3
Level 7
Chief Fire Officer:
Kgetleng Fire Station :
P.D.S.Mosito
Level 4A
Assistant Chief Fire
Officer :A.Mphahlele
Level 5
Chief Fire Officer:
Moretele Fire
Station:D.S.Khunou
Level 4A
Chief Fire Officer:
Mogwase Fire Station
:F.J.Mogale
Level 4A
Assistant Chief Fire
Officer : Vacant
Level 5
VACANT
Assistant Chief Fire
Officer :N.F.Tsitsi
Level 5
Station Officer-
OPS x 4
Level 7
Station Officer-
OPS x 4
Level 7
S/O Pro-Active
x 2
Level 7
Pro-Active
2x S/O
Level 7
Pro-Active
Station Officer
x 2
Level 7
Leading
FF=08
FireFighters
=6
Snr FF =
17
Level 9 to 12
Trainee Fire Fighter
Vacant X2
Level 12
Pro-Active
Leading Fire
Fighter x 2
Vacant Lev
8
Level 8
Leading=2
SnrFF=20
F/Fighters = 3
Level 8
Leading =9
Snr Fighter=14
F/Fighter= 07
Level 8
Leading Fire
Fighter x 2
Pro-Active
Level 8
2 x VACANT
Leading Pro-
Activ x 2
Vacant
Vacant
Level 8
Trainee Fire
Fighter : 2X
Vacant
Level 12
Level 12
Manager: Fire
Services: P.Dirapelo
Level 2 a
Trainee Fire
Fighter : 2X
Vacant
Level 12
Level 12

209 | P a g e
CO-ORDINATOR:
ARTS & CULTURE
K MALAO
LEVEL 5
MANAGER:
SPORTS, ARTS &
CULTURE
LEVEL 2(a)
SPORTS CO-
ORDINATOR X2
LEVEL 5
DIRECTOR:
COMMUNITY
DEVELOPMENT
SERVICES
G MAHLANGU
DEPARTMENT OF COMMUNITY DEVELOPMENT SERVICES: SPORTS, ARTS AND CULTURE (C)
M RADITLADI
KHUNOU K
MAGWETE J
MMC SPORTS,
ARTS AND
CULTURE
V MOCHE

210 | P a g e

211 | P a g e

212 | P a g e
SECTION 7: INTEGRATION AND OPERATIONAL STRATEGIES
BOJANALA PLATINUM DISTRICT MUNICIPALITY DISASTER MANAGEMENT
FRAMEWORK
The strategy of the framework is to provide a coherent, transparent and inclusive policy
on disaster management in the District Municipality and also to provide municipalities in
the Bojanala Platinum District Municipality, role-player departments, NGO’s, CBO’s and
other agencies with guidelines which will enable these to establish structures and
programs to empower communities to jointly reduce their vulnerability, by the
implementation of a process whereby such communities can prevent disasters from
occurring, mitigate against disasters, prepare and respond to the consequences of any
hazard or disaster situation that communities can be confronted with. The strategic
objectives aim to enable the policy framework to strengthen its ability to prepare and
respond to disasters.
BOJANALA PLATINUM DISTRICT MUNICIPALITY DISASTER RISK MANAGEMENT
PLAN
BPDM has a Disaster Management Plan as part of its Integrated Development Plans,
according to the Municipal Systems Act. Disaster management aims to reduce the
occurrence of disasters and to reduce the impact of those that cannot be prevented. The
purpose of the plan, therefore, is to provide municipalities in the Bojanala Platinum District
Municipality, role-player departments, NGO’s, CBO’s and other agencies with guidelines
which will enable these to establish structures and programs to empower communities to
jointly reduce their vulnerability, by the implementation of a process whereby such
communities can prevent disasters from occurring, mitigate against disasters, prepare
and respond to the consequences of any hazard or disaster situation that communities
can be confronted with.

213 | P a g e
The Municipal Disaster Risk Management Plan should:-
Form an integral part of the Bojanala Platinum District Municipality IDP so that
disaster risk reduction activities can be incorporated into its developmental
initiatives;
Anticipate the likely types of disaster that might occur in the District Municipal area
and their possible effects;
Identify the communities at risk;
Provide for appropriate prevention, risk reduction and mitigation strategies;
Identify and address weaknesses in capacity to deal with possible disasters
Facilitate maximum emergency preparedness;
Establish the disaster risk management policy framework and organisation that will
be utilized to mitigate any significant emergency or disaster affecting the District
Municipality;
Establish the operational concepts and procedures associated with day-to-day
operational response to emergencies by District, Departments and other entities.
These SOPs will also form the basis for a more comprehensive disaster response
document;
Incorporate all special Hazard / Risk-specific and Departmental DRM Plans and
related emergency procedures that are to be used in the event of a disaster. These
will provide for:-
o the allocation of responsibilities to the various role players and co-ordination
in the carrying out
o of those responsibilities;
o prompt disaster response and relief;
o disaster recovery and rehabilitation focused on risk elimination or mitigation;
o the procurement of essential goods and services;
o the establishment of strategic communication links;
o the dissemination of information.

214 | P a g e
LOCAL ECONOMIC DEVELOPMENT STRATEGY
The purpose of the LED Strategy is to position the Bojanala Platinum District Municipality
as a centre of sustainable economic growth and development. The LED is in partial
fulfilment of the district’s IDP goals which will position the district in attaining its vision as
a “model of cooperative governance for effective and efficient service delivery in
partnership with local municipalities and all stakeholders”. The LED strategy has an
objective of economic growth for next 5 years; reduce unemployment below in five years;
decrease the number of households below poverty line; increase and develop access to
economic opportunities and expand the municipal revenue base.
TOURISM
Tourism is identified as a sector with high potential. Key interventions in the areas of
marketing, developing identified tourist attractions, packaging and promoting tourist
destinations. The need to improve tourism research through different efforts such as
coordinating and engaging industry players, promoting trade relations and supporting the
development of community and local tourism should be explored.
AGRICULTURE
Has a role to play in the District economy. The climatic and soil conditions may not be the
best; however, technological advances may lead to improved productivity in this industry.
Partnerships with research institutions such as the Agricultural Research Council are
required to explore high value crops and different production methods and techniques.
Forty one villages in the Amatole District municipality are said to be benefiting from a
similar partnership. Agro-processing is also viewed as an industry with a lot of potential.
This would add value to the raw materials the District and the Province export for
processing elsewhere.

215 | P a g e
TOURISM DEVELOPMENT STRATEGY
This Strategy acts as a strategic planning document to provide direction to BPDM on
tourism development issues. The strategy aims to guide and coordinate sustainable
tourism development from a land use planning perspective within the district in recognition
of the important role that tourism plays in an economic, social and environmental
perspective.
PMS FRAMEWORK
The PMS framework is meant to provide measures and practical guidelines for the optimal
management of all aspects of the performance of BPDM as an organization as well as
individuals who work in BPDM in a manner that aligns their efforts and achievements to
increase the levels of service delivery in the municipality currently deemed to be most
appropriate. The framework is seen as a process that will specifically contribute to the
achievement of establishing an improved performance culture in BPDM by planning,
measuring, communicating, recognising and rewarding performance and also serving as
a vehicle for implementing BPDM’s goals and strategies by facilitating continuous
performance improvement, individual and organisational development and continuously
enhancing employees’ competence through the identification of KRA’s as well as career
related training and development needs and strategies to deliver the best training
available while communicating the standards and performance expectations of each
employee by evaluating performance fairly and objectively.
The MSA emphasises the need for performance management in local government and
requires municipalities to develop a Service Delivery and Budget Implementation Plan
(SDBIP) as the Municipal Planning and Performance Management Regulations (2001)
stipulate that a “Municipality’s Performance Management System entails a framework that
describes and represents how the municipality’s cycle and processes of performance
planning, monitoring, measurement, reviewing and reporting and improvement will be
conducted, organized and managed, including determining the roles of the different role
players” (Chapter 3, Section 7, Municipal Planning and Performance Management

216 | P a g e
Regulations, 2001). There is a Municipal Scorecard (SDBIP) that is critical institutional
performance management document that links strategic planning and IDP processes.
The municipal scorecard captures the key aspects of the IDP and the Strategic Plan in
terms of, inter alia:
Key Performance Areas;
Strategic objectives;
Key Performance Indicators;
Baseline;
Targets
The district is currently reviewing the PMS Framework
AIR QUALITY MANAGEMENT PLAN
The National Environment Management: Air Quality Act, 2004 requires that a local
authority prepare a plan for the preservation or the improvement of air quality within their
area jurisdiction. BPDM Air Quality Management Plan is primarily directed at protecting
the valuable asset of good air quality in the district and particularly of ensuring that
adverse air quality does not impact on the most vulnerable of the population. The district
is currently reviewing the Air Quality Management Plan.
ENVIRONMENTAL MANAGEMENT FRAMEWORK
Environmental issues have become an important part of developmental thinking and
decision making in South Africa and the Integrated Environmental Plan (IEP) is therefore
an important sector plan of the Integrated Development Plan (IDP), which serves as a
useful tool for the evaluation and alignment of development proposals with the principles
of sustainable development.
This Environmental Management Framework has been completed and is awaiting
authority from the Minister and the Provincial MEC before it can be gazette.

217 | P a g e
INTEGRATED WASTE MANAGEMENT PLAN
Waste Management Plan has a key role to play in achieving sustainable waste
management. Their main purpose is to give an outline of waste streams and treatment
options. More specifically it aims to provide a planning framework for the following:
Compliance with waste policy and target achievement;
Outline of waste characteristics and sufficient capacity for managing waste;
Control of technological measures; and
Outline of economy and investment requirements.
INTERNAL AUDIT PLAN
The internal audit plan sets out the Strategic Three Year Rolling Internal Audit Plan as
well as the Annual Internal Audit Plan for the financial year ending 30 June 2021. The
approach was to formulate a risk-based plan to align the priorities of the internal audit
function with the strategic objectives and goals of BPDM and related strategic risks as
identified by management.
FRAUD POLICY AND RESPONSE PLAN
This policy is intended to set down the stance of BPDM to fraud and corruption and to
reinforce existing systems, policies and procedures of BPDM aimed at deterring,
preventing, detecting, reacting to and reducing the impact of fraud and corruption. The
policy of BPDM is zero tolerance to fraud and corruption. In addition, all fraud and
corruption will be investigated and followed up by the application of all remedies available
within the full extent of the law and the implementation of appropriate prevention and
detection controls. These prevention controls include the existing financial and other
218 | P a g e
controls and checking mechanisms as prescribed in the systems, policies and procedures
of BPDM.
WORKPLACE SKILLS DEVELOPMENT PLAN
Workplace Skills Plan (WSP) it is a well-researched and reasoned plan for developing the
skills needed by the institution. It includes a survey of the qualifications and roles of the
staff and an analysis of the institution's expected future trends. The plan is developed for
every financial year.