advances in haemodynamic monitoring
TRANSCRIPT
AdvAnces in HemodynAmic AdvAnces in HemodynAmic monitoringmonitoring
ByBy
moHAmed A. AlimoHAmed A. Ali
security Forces HospitAl mAKKAHsecurity Forces HospitAl mAKKAH
introduction
• Hemodynamics is concerned with the forces generated by the heart and the resulting motion of blood through the cardiovascular system.
• Hemodynamic monitoring is the intermittent or continuous observation of physiological parameters related to the circulatory system that lead to early detection of the need for therapeutic interventions.

1- Intravascular volume
2-Myocardial contraction
3- heart rate
4- Vasoactivity

old equipments1. ArteriAl line
1. Real time SBP, DBP, MAP
2. Pulse pressure variation (∆PP)
• ΔPP (%) = Respiratory-induced pulse pressure variations obtained with an arterial line which indicate fluid responsiveness in mechanically ventilated patients
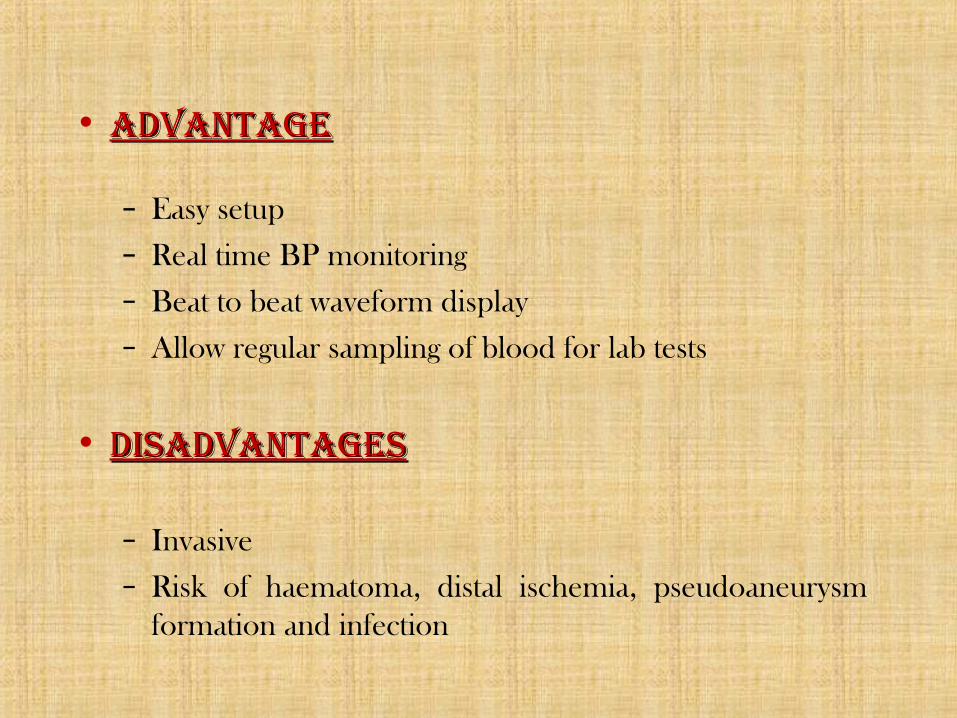
• AdvAntAgeAdvAntAge
– Easy setup– Real time BP monitoring– Beat to beat waveform display– Allow regular sampling of blood for lab tests
• disAdvAntAgesdisAdvAntAges
– Invasive– Risk of haematoma, distal ischemia, pseudoaneurysm
formation and infection

2. centrAl venous cAtHeter2. centrAl venous cAtHeter
– Measurement of CVP, medications infusion and modified form allow for dialysis
•AdvAntAgesAdvAntAges– Easy setup– Good for medications infusion
•disAdvAntAgesdisAdvAntAges– Cannot reflect actual RAP in most situations– Multiple complications
•Infections, thrombosis, complications on insertion, vascular erosion and bleeding
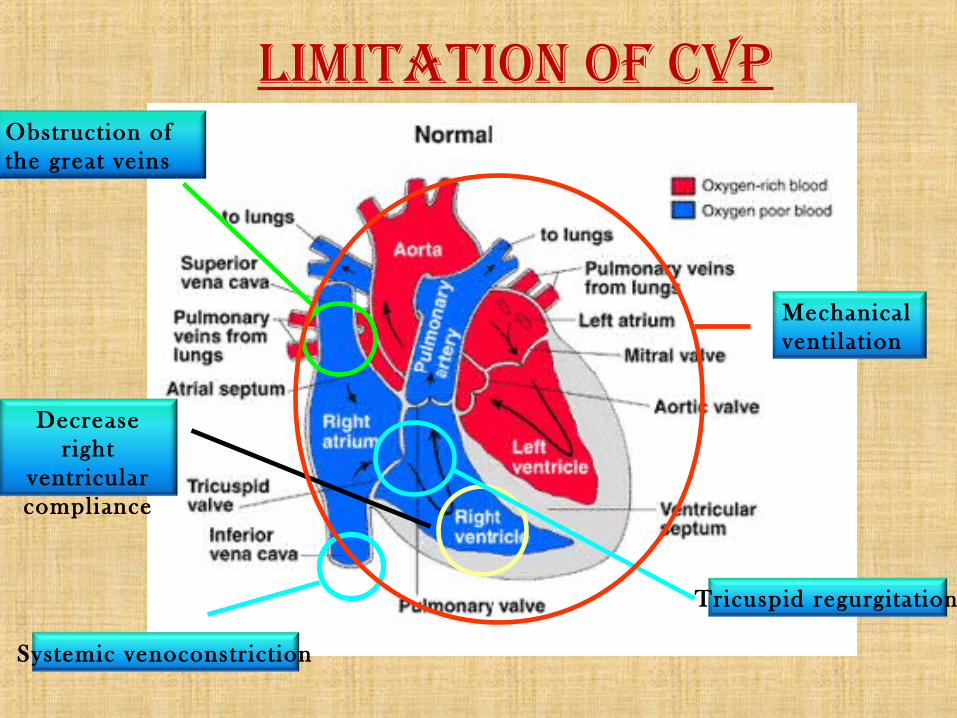
limitAtion oF cvp
Systemic venoconstrict ion
Decrease right
ventricular compliance
Obstruction of the great veins
Tricuspid regurgitat ion
Mechanical venti lat ion
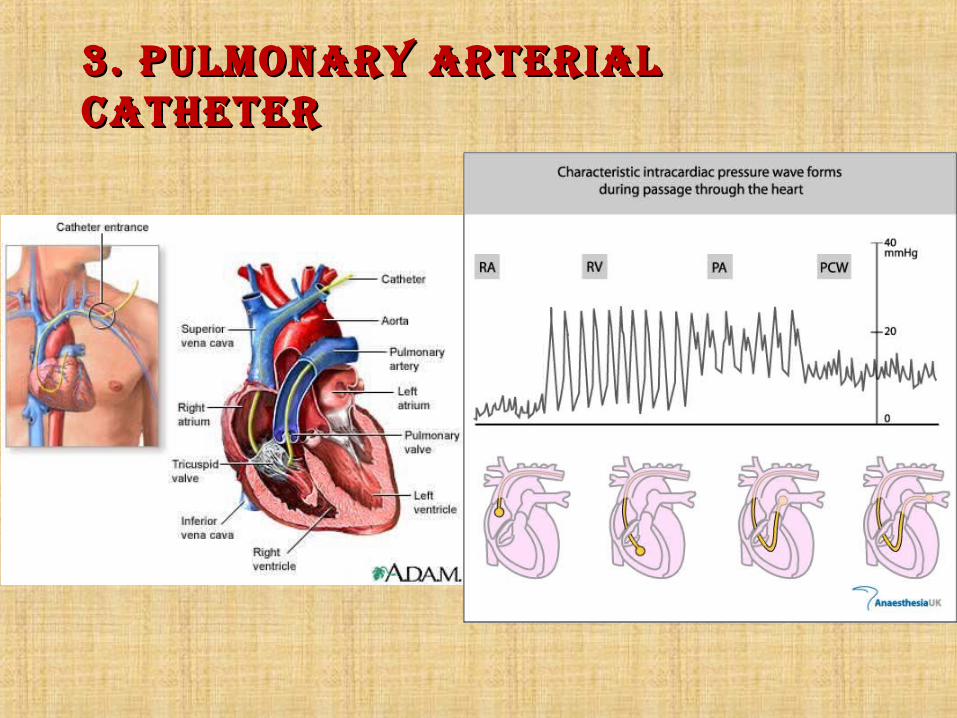
3. pulmonAry ArteriAl 3. pulmonAry ArteriAl cAtHetercAtHeter
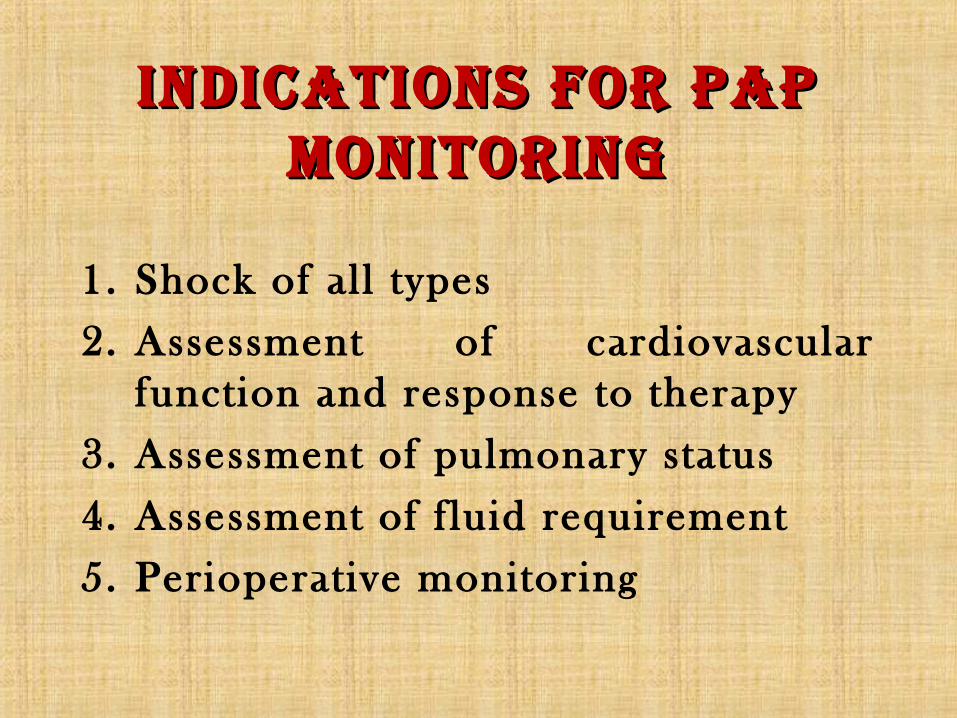
indicAtions For pAp indicAtions For pAp monitoringmonitoring
1. Shock of al l types
2. Assessment of cardiovascular function and response to therapy
3. Assessment of pulmonary status
4. Assessment of f luid requirement
5. Perioperative monitoring

clinicAl ApplicAtions oF clinicAl ApplicAtions oF pAcpAc
PAC can generate large numbers of haemodynamic variables
BAsic pArAmeters• Central venous pressure (CVP)• Pulmonary artery pressure (PAP)• Pulmonary arterial occlusion pressure (PAOP)• Cardiac output (CO)
derived pArAmeters• cardiac index (CI)• Stroke volume (SV) • Rt ventricle ejection fraction/ end diastolic volume (RVEF / RVEDV)• Systemic vascular resistance index (SVRI)• Pulmonary vascular resistance index (PVRI)• Oxygen delivery / uptake (DO2 / VO2)
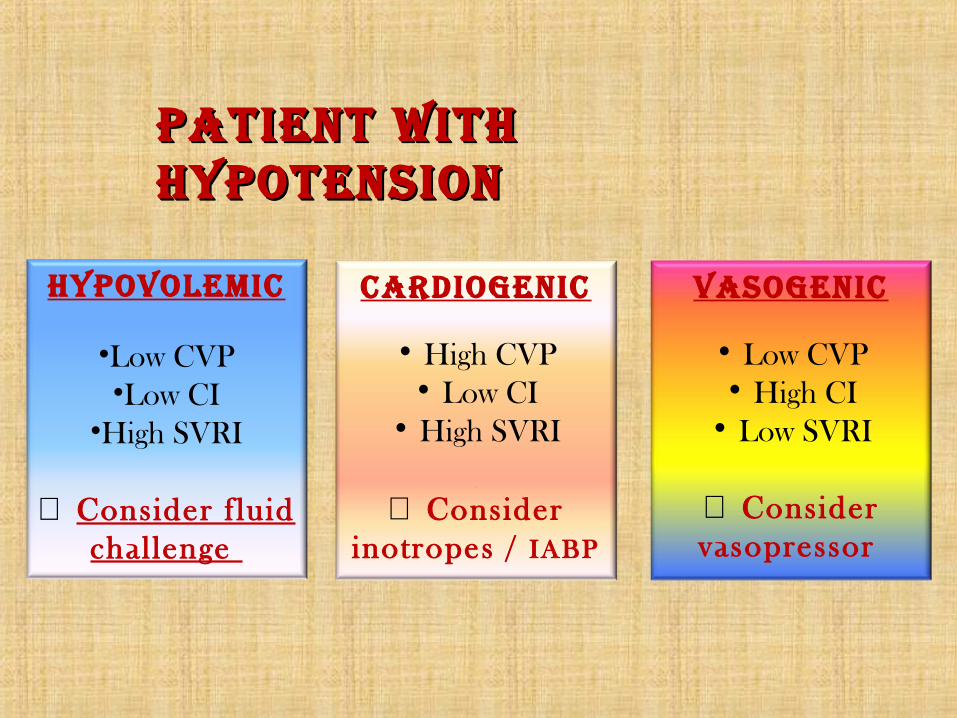
cArdiogenic
• High CVP• Low CI
• High SVRI
[[
⇒ Consider inotropes / IABP
vAsogenic
• Low CVP• High CI
• Low SVRI
⇒ Consider vasopressor
pAtient witH pAtient witH HypotensionHypotension
Hypovolemic
•Low CVP•Low CI
•High SVRI
⇒ Consider f luid challenge

mixed venous mixed venous sAturAtion (svo2)sAturAtion (svo2)
• Measured in pulmonary artery blood• Marker of the balance between whole body O2
delivery (DO2) and O2 consumption (VO2) • VO2 = DO2 * (SaO2 – SvO2)• In fact, DO2 is determined by CO, Hb and SaO2.
Therefore, SvO2 affected by– CO– Hb– Arterial oxygen saturation– Tissue oxygen consumption

• normAl svo2 = 70-75%normAl svo2 = 70-75%
decreAsed svo2decreAsed svo2
• Increased consumption • Pain, Hyperthermia• Decreased delivery
• Low CO• Anemia• Hypoxia
increAsed svo2increAsed svo2
• Increased delivery• High CO• Hyperbaric O2
• Low consumption• Sedation• Paralysis• Cyanide toxicity
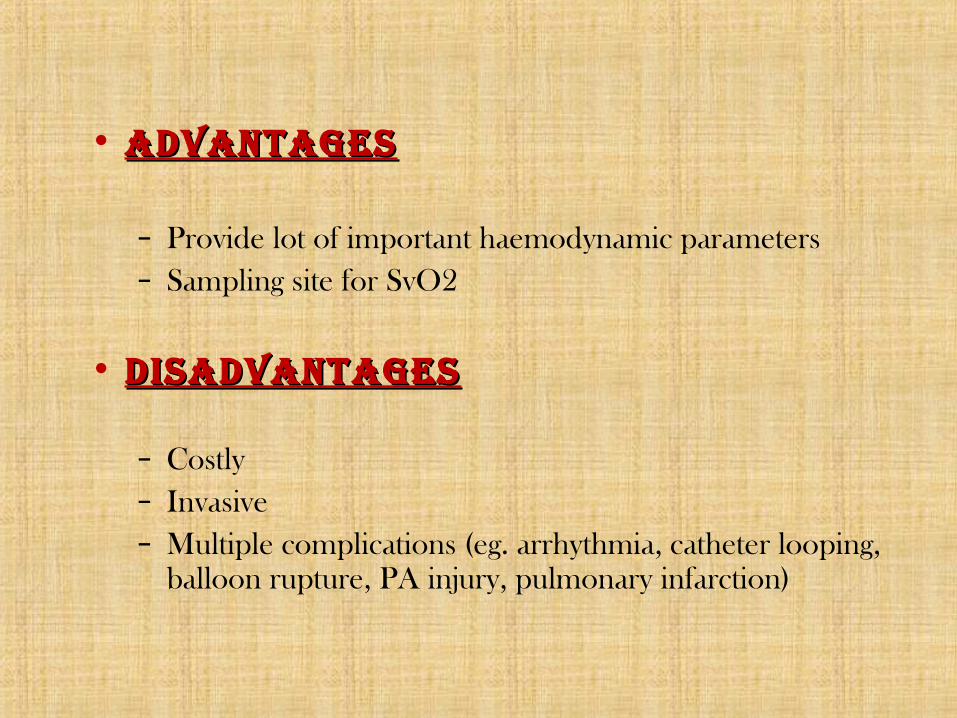
• AdvAntAgesAdvAntAges
– Provide lot of important haemodynamic parameters– Sampling site for SvO2
• disAdvAntAgesdisAdvAntAges
– Costly– Invasive– Multiple complications (eg. arrhythmia, catheter looping,
balloon rupture, PA injury, pulmonary infarction)

AdvAnce in hAemodynAmic AdvAnce in hAemodynAmic AssessmentAssessment
1. Modification of old equipment
2. Echocardiogram and esophageal doppler
3. Pulse contour analysis and transpulmonary thermodilution
4. Partial carbon dioxide rebreathing with application of Fick principle
5. Electrical bioimpedance

truCCOMS systemReal Time Continuous Cardiac Output Monitoring
System
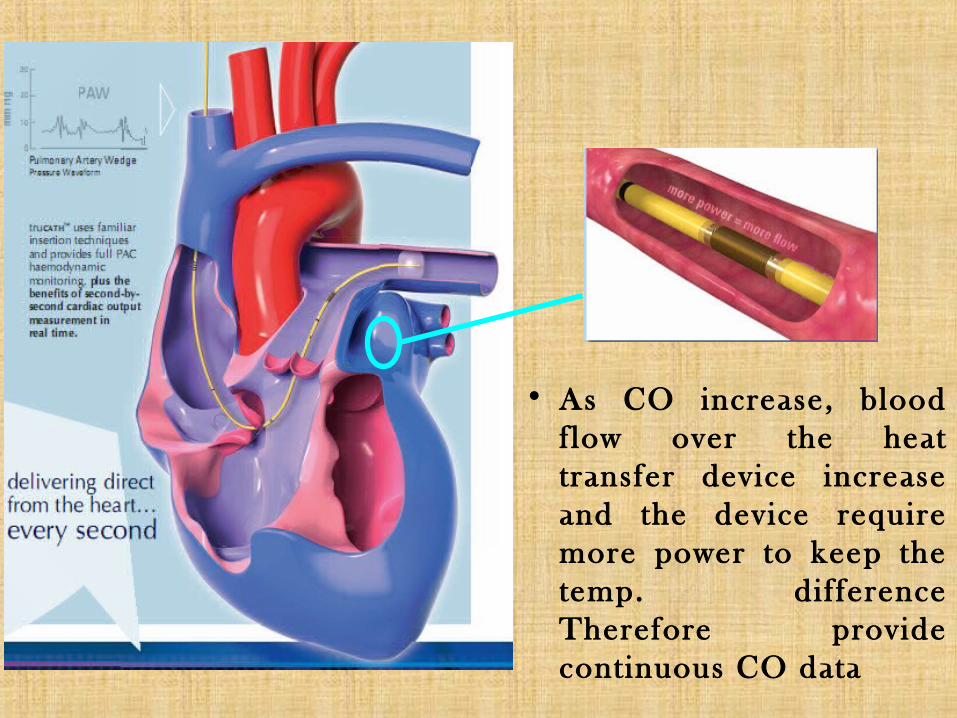
• As CO increase, blood flow over the heat transfer device increase and the device require more power to keep the temp. difference Therefore provide continuous CO data

• AdvAntAgeAdvAntAge
– Continuous CO monitoring– Provision of important haemodynamic parameter
as PAC
• disAdvAntAgedisAdvAntAge
– Invasive– Costly– Complications associated with PAC use

echo• Assessment of cardiac structure, ejection
fraction and cardiac output• Based on 2D and doppler flow technique
EF (%) = [(EDV - ESV) / EDV] x 100

echo doppler echo doppler ultrAsoundultrAsound
• Measure blood flow velocity in heart and great vessels• Based on Doppler effect ⇒ “ Sound freq. increases as
sound source moves toward the observer and decreases as the sound moves away”
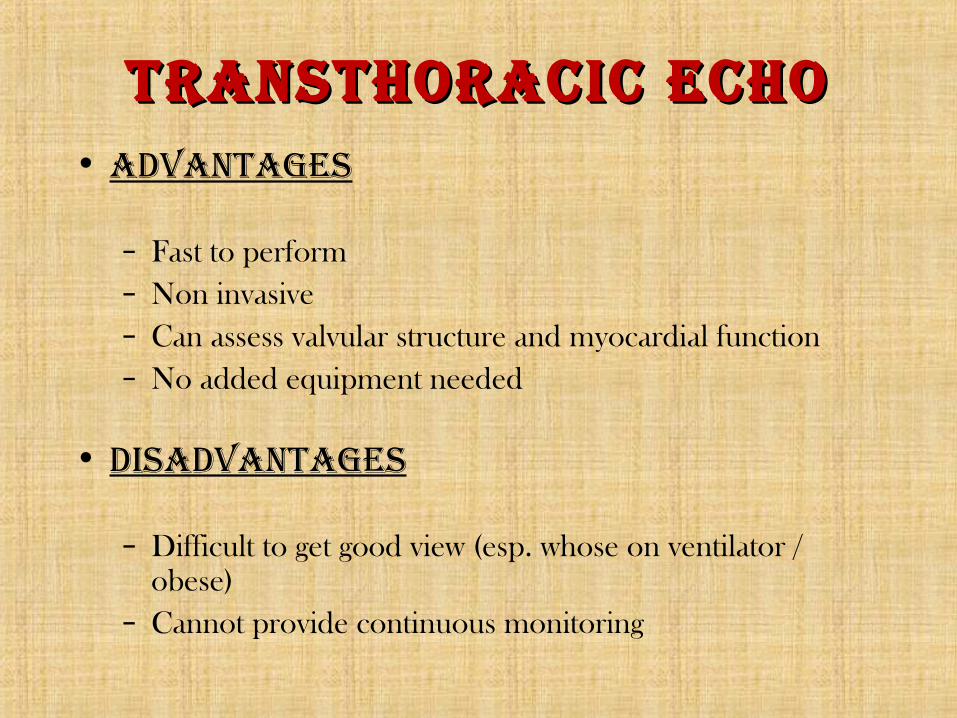
trAnsthorAcic echotrAnsthorAcic echo• AdvAntAges
– Fast to perform– Non invasive– Can assess valvular structure and myocardial function– No added equipment needed
• disAdvAntAges
– Difficult to get good view (esp. whose on ventilator / obese)
– Cannot provide continuous monitoring

esophAgeAl Aortic doppler esophAgeAl Aortic doppler usus
• Doppler assessment of decending aortic flow
• CO is determined by measuring aortic blood flow assuming a constant partition between caudal and cephalic blood supply areas
• Probe is smaller than that of TEE• Correlate well with CO measured
by thermodilution
Decending aorta
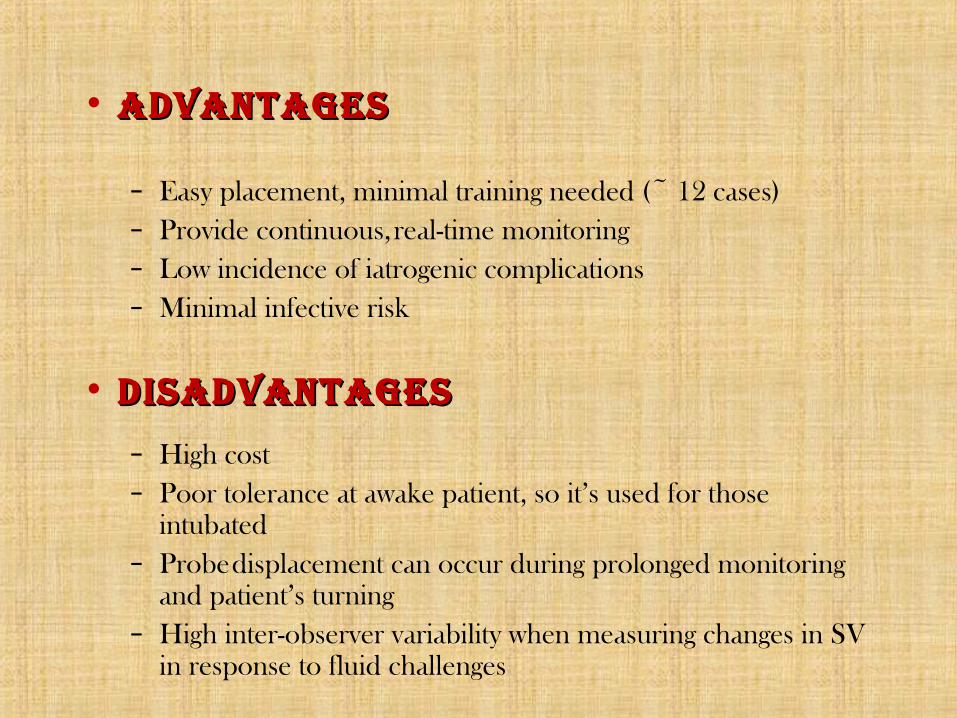
• AdvAntAgesAdvAntAges
– Easy placement, minimal training needed (~ 12 cases)– Provide continuous, real-time monitoring – Low incidence of iatrogenic complications– Minimal infective risk
• disAdvAntAgesdisAdvAntAges
– High cost– Poor tolerance at awake patient, so it’s used for those
intubated– Probe displacement can occur during prolonged monitoring
and patient’s turning– High inter-observer variability when measuring changes in SV
in response to fluid challenges

pulse contour pulse contour AnAlysisAnAlysis• Arterial pressure waveform is determined by
interaction of stroke volume and SVR

pulse contour pulse contour AnAlysisAnAlysis
• PiCCOPiCCO and LiDCOLiDCO are the two commonly used model on basis of PCA
• PCA involves the use of an arterially placed catheter with a pressure transducer, which can measure pressure tracings on a beat-to-beat basis
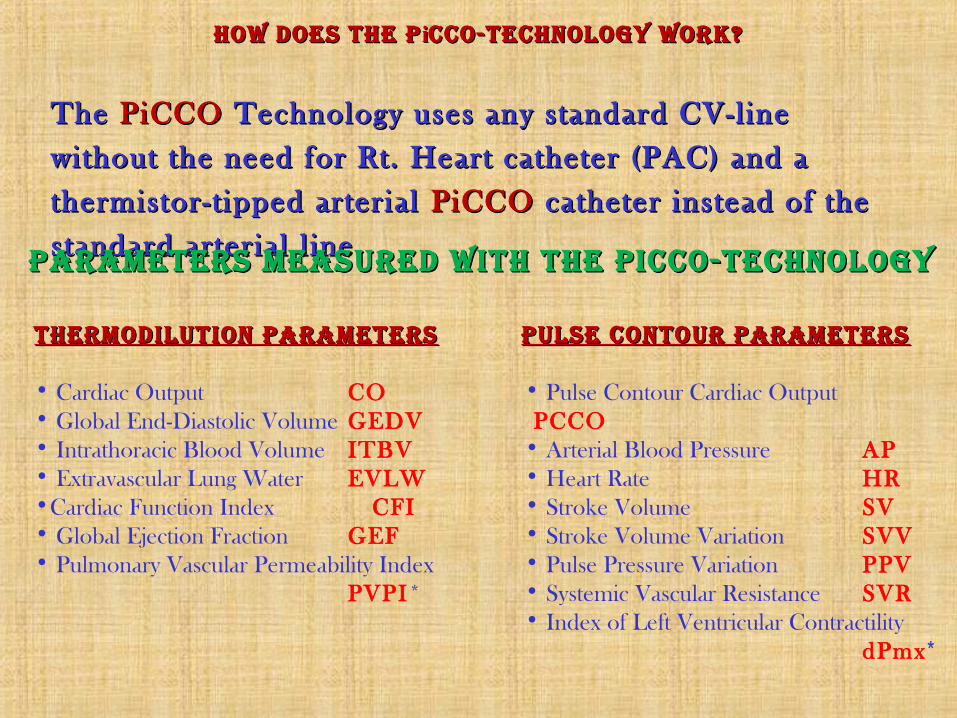
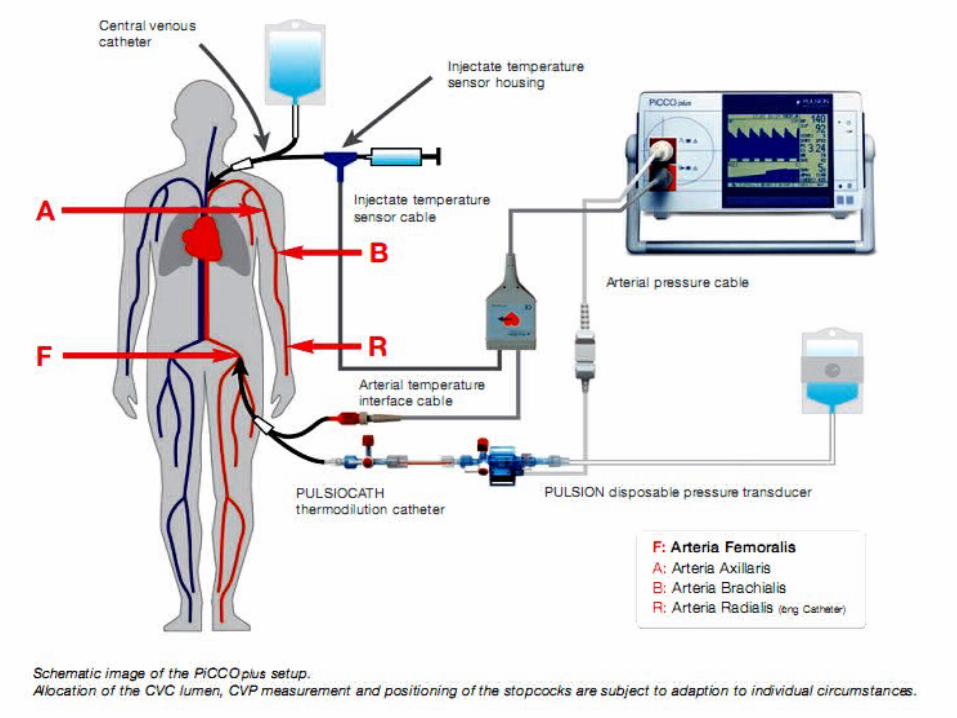
The The PiCCOPiCCO Technology uses any standard CV-line Technology uses any standard CV-line
without the need for Rt. Heart catheter (PAC) and a without the need for Rt. Heart catheter (PAC) and a
thermistor-t ipped arterial thermistor-t ipped arterial PiCCO PiCCO catheter instead of the catheter instead of the
standard arterial l ine.standard arterial l ine.
how does the phow does the p iicco-technology work?cco-technology work?
pArAmeters meAsured with the picco-technologypArAmeters meAsured with the picco-technology
thermodilution pArAmetersthermodilution pArAmeters
• Cardiac Output CO• Global End-Diastolic Volume GEDV• Intrathoracic Blood Volume ITBV• Extravascular Lung Water EVLW•Cardiac Function Index CFI• Global Ejection Fraction GEF• Pulmonary Vascular Permeability Index
PVPI*
pulse contour pArAmeterspulse contour pArAmeters
• Pulse Contour Cardiac OutputPCCO
• Arterial Blood Pressure AP• Heart Rate HR• Stroke Volume SV• Stroke Volume Variation SVV• Pulse Pressure Variation PPV• Systemic Vascular Resistance SVR• Index of Left Ventricular Contractility
dPmx*
CV
A
B
F
R
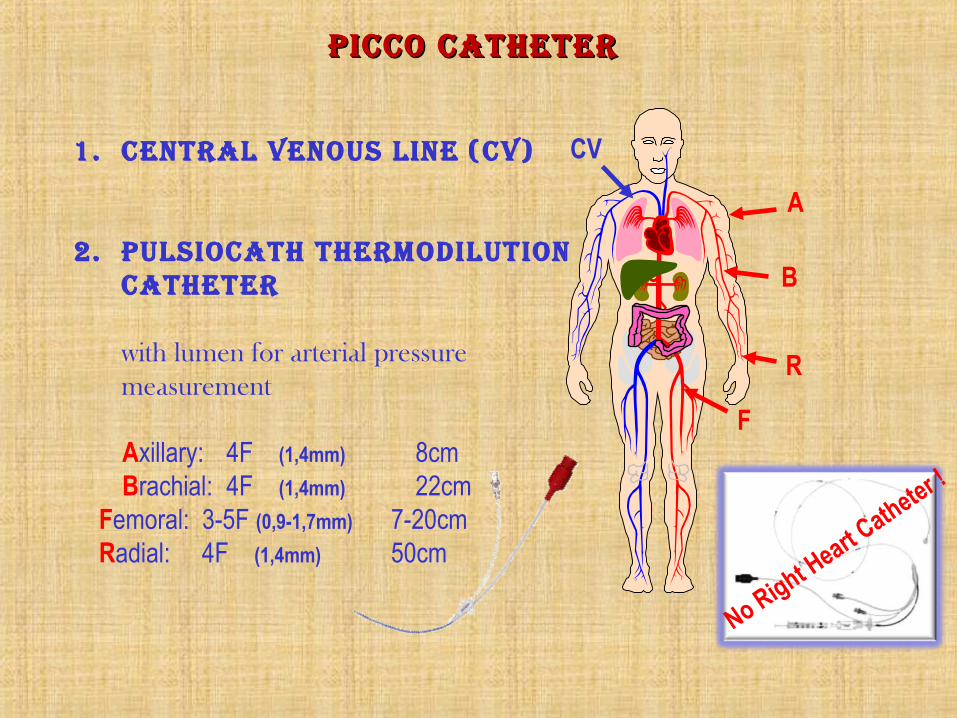
picco cAtheter picco cAtheter
1. centrAl venous line (cv)
2. pulsiocAth thermodilution cAtheter
with lumen for arterial pressure measurement
Axillary: 4F (1,4mm) 8cmBrachial: 4F (1,4mm) 22cm
Femoral: 3-5F (0,9-1,7mm) 7-20cm Radial: 4F (1,4mm) 50cm
No Right Heart C
atheter !

Bolus Injecti
on
Lungs
PiCCO Catheter e.g. in femoral artery
Transpulm. Thermodilution measurement only requires Central Venous Injection of a cold saline either at •(< 8°C) •(< 24°C) Room Temp.
ThermodiluTion parameTersThermodiluTion parameTers
Left HeartRight Heart
RA PBV
EVLW
LA LV
EVLW
RV
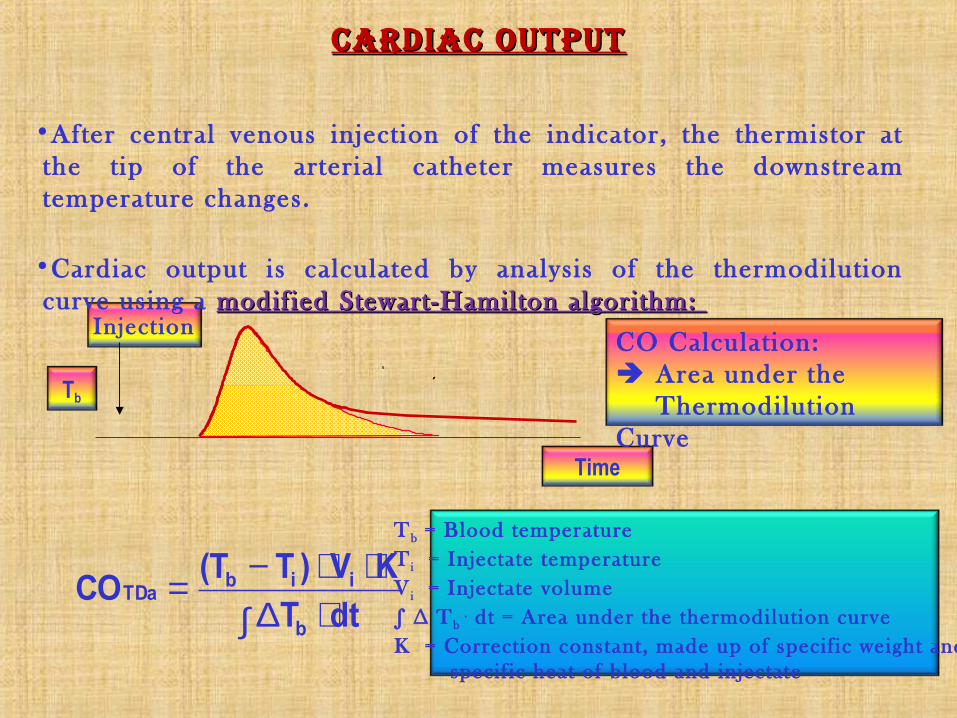
Tb
Inject ion
Time
∫ ⋅∆⋅⋅−=
dtTKV)T(T
COb
iibTDa
CardiaC ouTpuTCardiaC ouTpuT
Tb = Blood temperatureT i = Injectate temperatureV i = Injectate volume∫ ∆ Tb
. dt = Area under the thermodilution curveK = Correction constant, made up of specif ic weight and specif ic heat of blood and injectate
CO Calculation: Area under the
Thermodilution Curve
•After central venous injection of the indicator, the thermistor at the tip of the arterial catheter measures the downstream temperature changes.
•Cardiac output is calculated by analysis of the thermodilution curve using a modif iedmodif ied Stewart-Hamilton algorithm: Stewart-Hamilton algorithm:
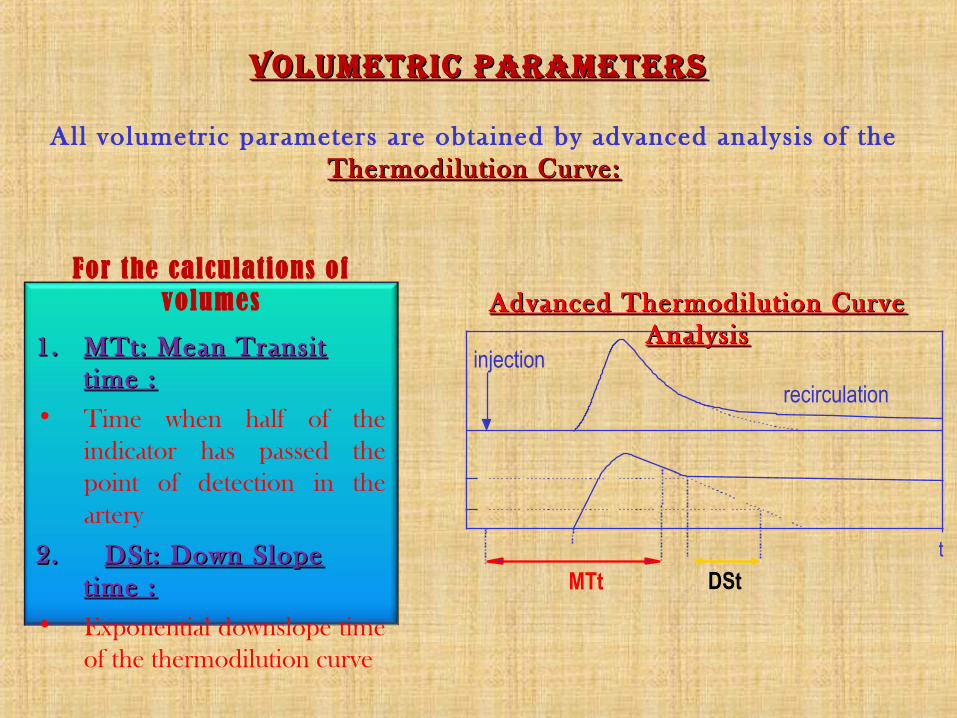
Advanced Thermodilution Curve Advanced Thermodilution Curve AnalysisAnalysis
VolumeTriC parameTersVolumeTriC parameTers
1.1. MTt: Mean Transit MTt: Mean Transit t ime :t ime :
• Time when half of the indicator has passed the point of detection in the artery
2. 2. DSt: Down Slope DSt: Down Slope time :t ime :
• Exponential downslope time of the thermodilution curve
For the calculations of volumes
injection
recirculation
MTtt
DSt
All volumetric parameters are obtained by advanced analysis of the Thermodilution Curve:Thermodilution Curve:
RAEDV
Thermodilution curve measured
with arterial catheter
CV Bolus Injection
LAEDV LVEDVRVEDV Lungs
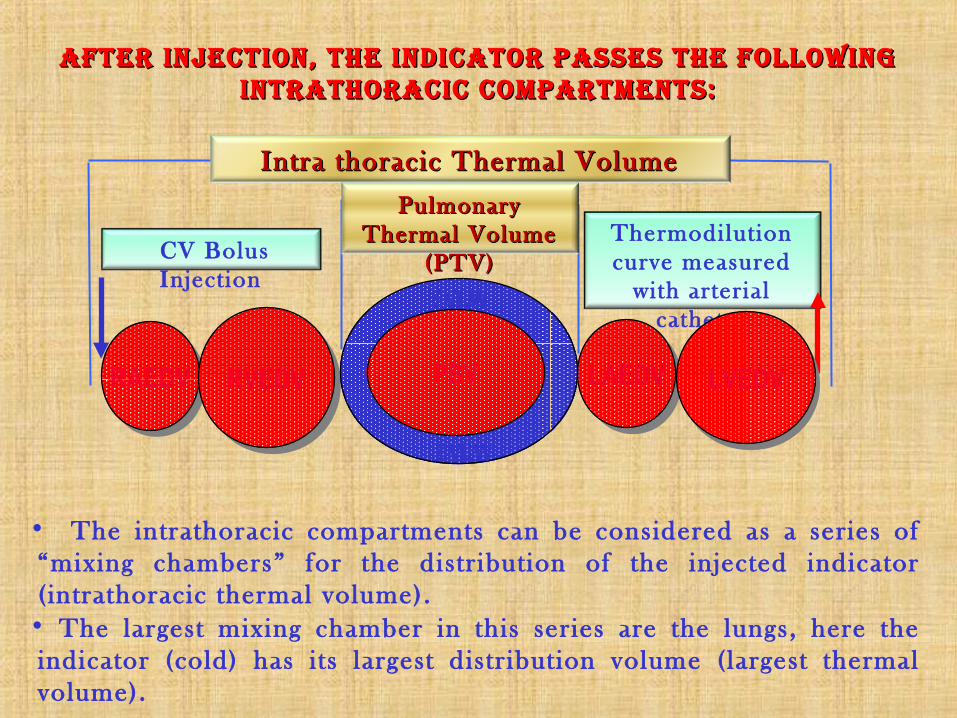
afTer injeCTion, The indiCaTor passes The following afTer injeCTion, The indiCaTor passes The following inTraThoraCiC ComparTmenTs:inTraThoraCiC ComparTmenTs:
• The intrathoracic compartments can be considered as a series of “mixing chambers” for the distribution of the injected indicator ( intrathoracic thermal volume).
• The largest mixing chamber in this series are the lungs, here the indicator (cold) has i ts largest distr ibution volume (largest thermal volume).
Intra thoracic Thermal Volume Intra thoracic Thermal Volume (ITTV)(ITTV)Pulmonary Pulmonary
Thermal Volume Thermal Volume (PTV)(PTV)
PBV
EVLW
EVLW

ITTV = CO * MTtTDa
PTV = CO * DStTDa
ITBV = 1.25 * GEDV
EVLW = ITTV - ITBV
GEDV = ITTV - PTV RAEDV RVEDV LAEDV LVEDV
RAEDV RVEDV LAEDV LVEDVPBV
RAEDV RVEDV LAEDV LVEDVPTV
PTV
EVLW*
EVLW*
Volume CalCulaTionsVolume CalCulaTions

pulmonary VasCular permeabiliTy indexpulmonary VasCular permeabiliTy index
Pulmonary Vascular Permeabili ty Index ( PVPI*) is the ratio of Extravascular Lung Water (EVLW*) to pulmonary blood volume (PBV). It al lows to identify the type of pulmonary oedema.
Pulmonarv Blood Volume
Hydrostatic Pulmonary Odema
Permeabil i typulmonary edema
PVPI =PBV
EVLW
Normal
Elevated
Elevated
PVPI =PBV
EVLWElevat
ed
Elevated
Normal
PVPI =PBV
EVLW
Normal
Normal
Normal
PBV
PBV
PBV Norma Lun
gExtra Vascular
Lung Water

Global Ejection Fraction (GEF)
(Transpulmonary Thermodilution)
GEF =GED
V
4 x SV
RVEF =RVEDV
SVLVEF =
LVEDV
SV
RV ejection fraction (RVEF)
(Pulm. Artery Thermodilution)
LV ejection fract ion (LVEF)
(Echocardiography)
1 2& 3
global ejeCTion fraCTion
Right Heart
Left Heart
Lungs
RAEDV
RVEDV
LVEDV
Stroke Volume SV
LAEDV
• Ejection Fraction: Stroke Volume related to End-Diastolic Volume
PBV
EVLW
EVLW
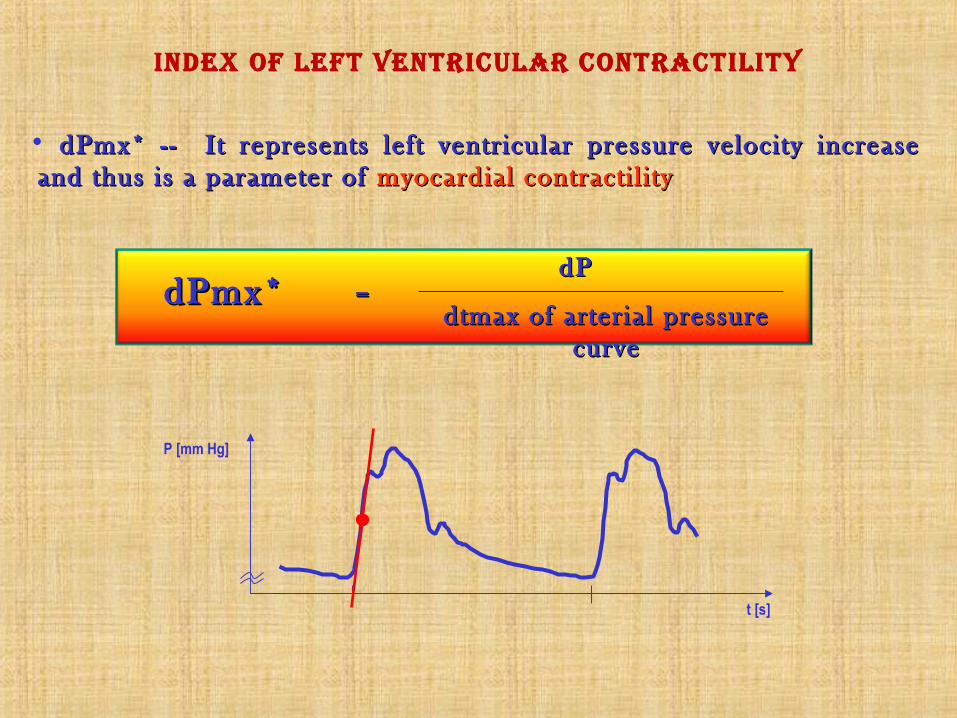
index of lefT VenTriCular ConTraCTiliTy
t [s]
P [mm Hg]
• dPmx* -- It represents left ventricular pressure velocity increase dPmx* -- It represents left ventricular pressure velocity increase and thus is a parameter of and thus is a parameter of myocardial contracti l i tymyocardial contracti l i ty
dtmax of arterial pressure dtmax of arterial pressure cc urveurve
dPdPdPmx* dPmx* ==
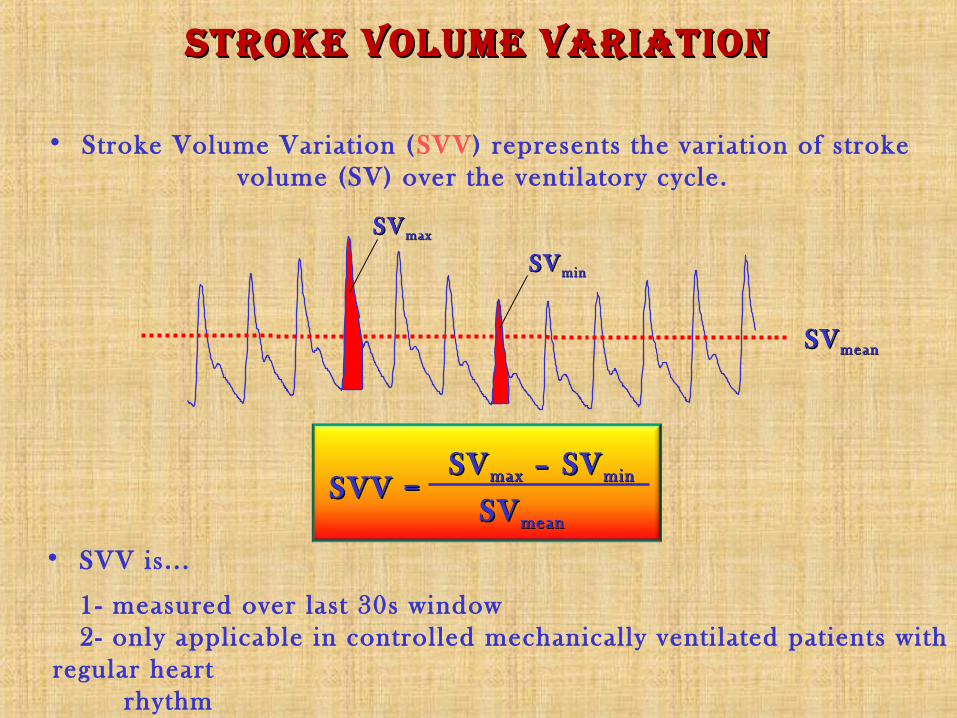
SVSV maxmax
SVSV minmin
SVSV meanmean
SVSV maxmax – SV – SV minminSVV =SVV =
SVSV meanmean
sTroke Volume VariaTionsTroke Volume VariaTion
• Stroke Volume Variation (SVV) represents the variat ion of stroke volume (SV) over the venti latory cycle.
• SVV is. . .
1- measured over last 30s window 2- only applicable in controlled mechanically venti lated patients with regular heart
rhythm
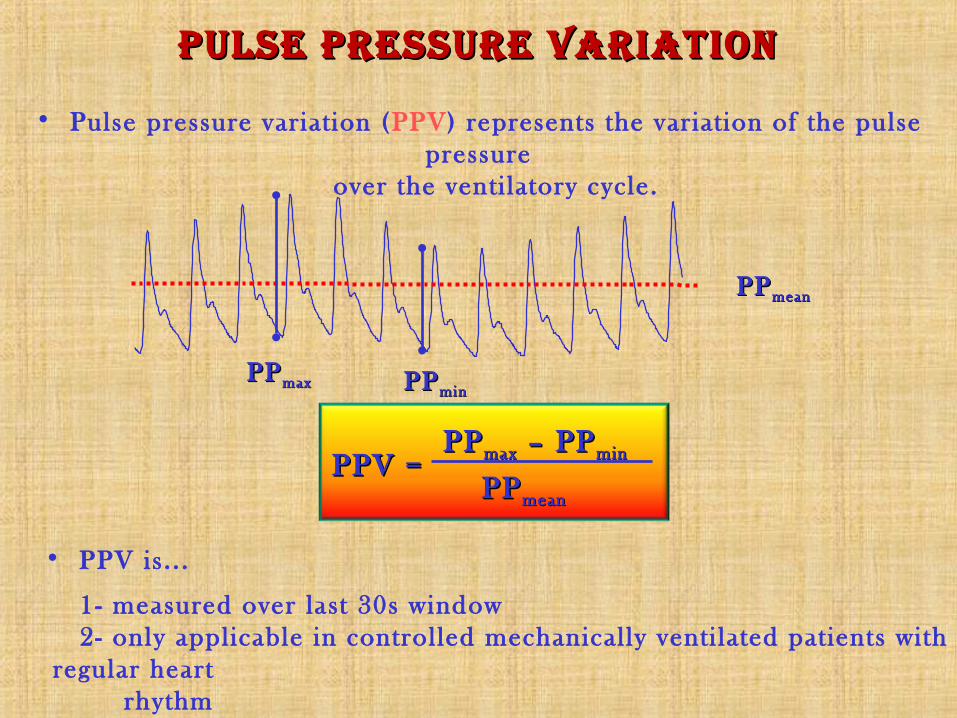
pulse pressure VariaTionpulse pressure VariaTion
PPPP maxmax – PP – PP minminPPV =PPV =
PPPP meanmean
PPPP maxmax
PPPP meanmean
PPPP minmin
• Pulse pressure variation (PPV) represents the variation of the pulse pressure
over the venti latory cycle.
• PPV is. . .
1- measured over last 30s window 2- only applicable in controlled mechanically venti lated patients with regular heart
rhythm
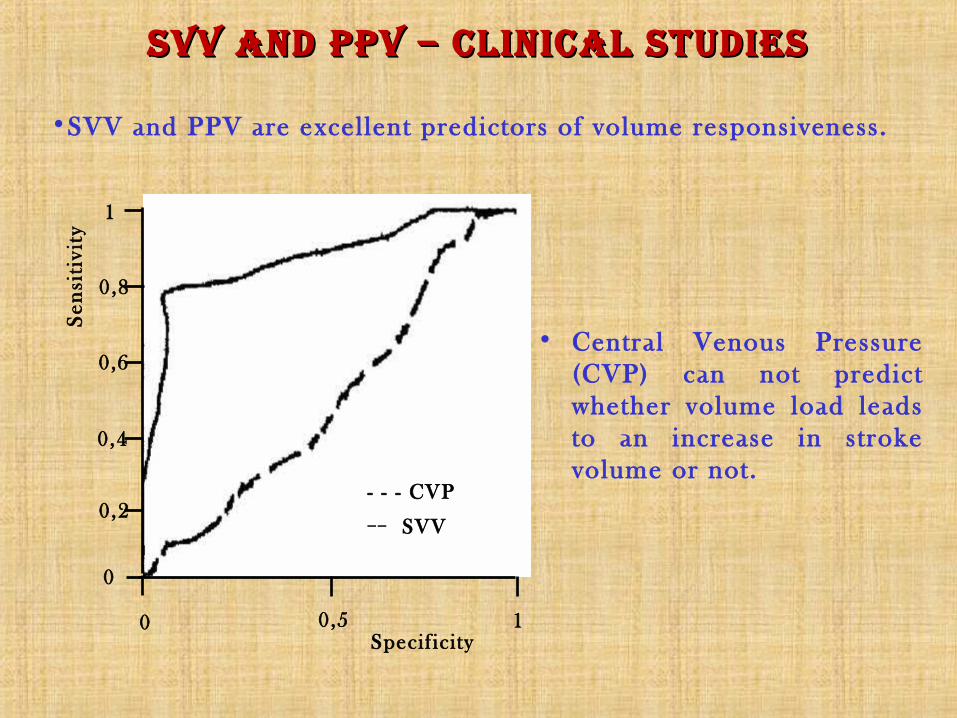
sVV and ppV – CliniCal sTudiessVV and ppV – CliniCal sTudiesS
ensi
tivi
ty
Specif icity
• Central Venous Pressure (CVP) can not predict whether volume load leads to an increase in stroke volume or not.
- - - CVP__ SVV
1
0,2
0,4
0,6
0,8
1
0,5 0
0
•SVV and PPV are excellent predictors of volume responsiveness.

DrugsVolume
What is the current s ituation?.………..…... .…..………….Cardiac
Output!
What is the preload?.……………….... .….Global End-Diastolic
Volume!
Will volume increase CO?... .………...….…….Stroke Volume
Variation!
What is the afterload?……………..…... . . . . .Systemic Vascular
Resistance!
Are the lungs sti l l dry?.. .…….……...…..…... . . .Extravascular
Lung Water!
CliniCal appliCaTion
• Global End-Diastolic Volume, GEDV and Intrathoracic Blood Volume (ITBV): have shown to be far more sensitive and specific to cardiac preload compared to the standard cardiac filling pressures CVP + PCWP as well as right ventricular enddiastolic volume.
• The striking advantage of GEDV and ITBV is that they are not adversely influenced by mechanical ventilation
• Extravascular Lung Water, EVLW* has shown to have a clear correlation to severity of ARDS, length of ventilation days, ICU-Stay and Mortality and is superior to assessment of lung odema by chest x-ray and clearly indicates fluid overload
signifiCanCesignifiCanCe

normal rangesnormal ranges
ParameterParameter RangeRange UnitUnit
CI 3.0 – 5.0 l/min/m 2
SVI 40 – 60 ml/m2
GEDI 680 – 800 ml/m 2
ITBI 850 – 1000 ml/m 2
ELWI 3.0 – 7.0 ml/kg
PVPI 1.0 – 3.0 ml/kg
SVV ≤ 10 %
PPV ≤ 10 %
GEF 25 – 35 %
CFI 4.5 – 6.5 1/min
MAP 70 – 90 mmHg
SVRI 1700 – 2400 dyn*s*cm-5*m

Decision tree for hemoDynamic / volumetric monitoring
CI (l/min/m 2)
GEDI (ml/m 2)or ITBI (ml/m 2)
ELWI* (ml/kg)(s lowly responding)
>3.0<3.0
>700>850
<700<850
>700>850
<700<850
ELWI* (ml/kg)
GEDI (ml/m 2)or ITBI (ml/m 2)
CFI (1/min)or GEF (%)
<10 >10 <10 <10 <10>10 >10 >10
V+ V+! V+!V+Cat Cat
OK!
V-
>700>850
700-800850-1000
>4.5>25
>5.5>30
>4.5>25
700-800 850-1000
Cat
>5.5>30
>700>850
700-800 850-1000
700-800 850-1000
≤10 ≤10 ≤10 ≤10
V-
V+ = volume loading (! = cautiously)V- = volume contractionCat = catecholamine / cardiovascular agents** SVV only applicable in venti lated patients without cardiac arrhythmia
>700>850
<10Optimise to SVV** (%)<10 <10 <10
RESULTS
TARGET
THERAPY
1.
2. <10 <10 <10 <10
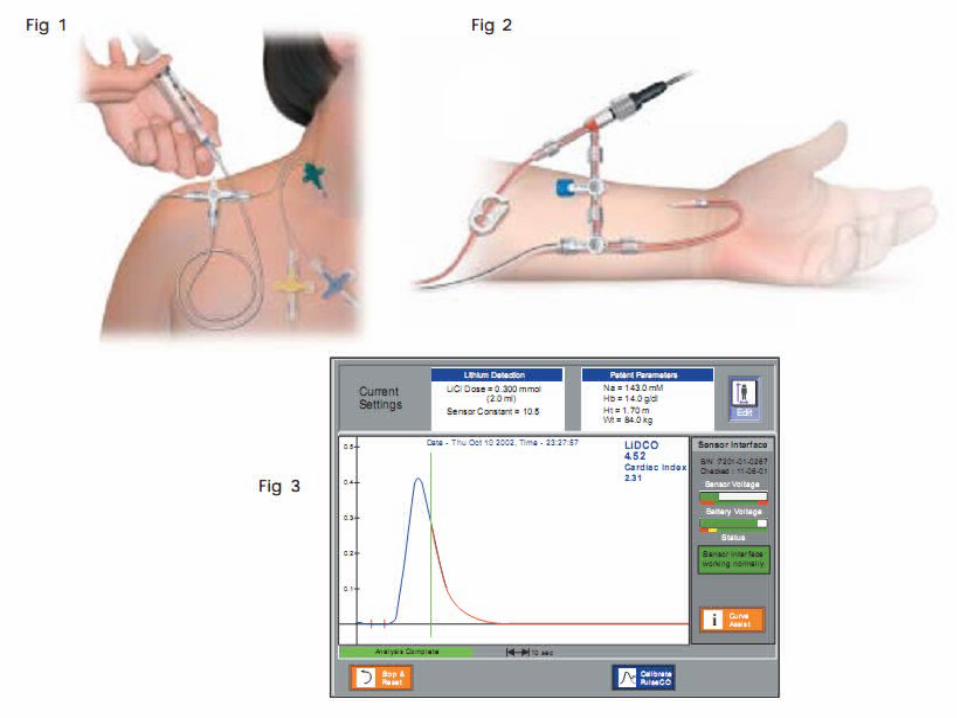
• The LiDCO™ System provides a bolus indicator dilution method of measuring cardiac output.
• A small dose of LITHIUM CHLORIDE is injected via a central or peripheral venous line ; the resulting arterial lithium concentration-time curve is recorded by withdrawing blood past a lithium sensor attached to the patient’s existing arterial line.
• The dose of lithium needed (0.15 - 0.3 mmol for an average adult) is very small and has no known pharmacological effects
ll iiDco systemDco system
l iDco™plus monitor
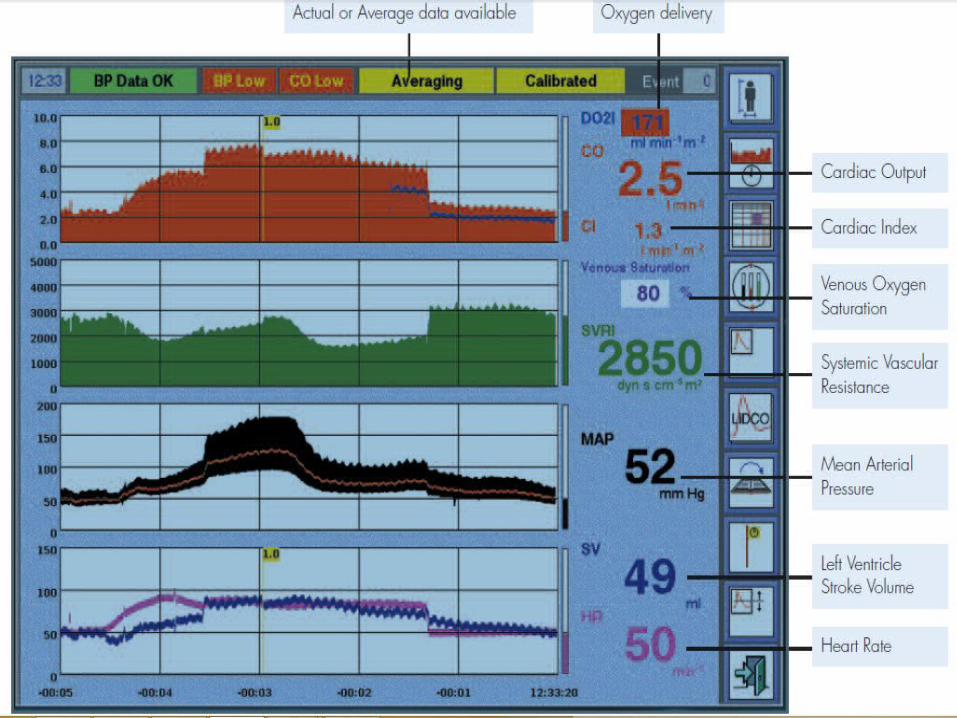
The LiDCOplus System combines the LiDCO & PulseCO Systems software and provides a real-time and continuous assessment of a patient’s hemodynamic status.
PulseCO SystemIt’s a software (incorporated in the LiDCO™plus Monitor) that calculates continuous beat-to-beat cardiac output by analysis of the arterial blood pressure trace following calibration with an absolute LiDCO cardiac output value.
This method has been shown to be accurate and reliable in various clinical settings.
It has also been shown that recalibration is unnecessary for at least eight hours and more recently for 24 hours.

PULSEco system autocorrelation algorithm
The analogue arterial blood pressure trace is slaved from the conventional blood pressure monitor and undergoes a three step transformation
•Step 1: Arterial pressure transformation into a volume-time waveform.
•Step 2: Deriving nominal stroke volume and heartbeat duration.
•Step 3: Actual stroke volume via calibration with an absolute cardiac output value

liDco™plus Parameters
•Body Surface Area
•Systolic Pressure Variation & Pulse Pressure Variation
•Cardiac Index
•Oxygen Delivery & Oxygen Delivery Index
•Heart Rate & Heart Rate Variation
•Stroke Volume & Stroke Volume Index
•Stroke Volume Variation
•Intra Thoracic Blood Volume
•Systemic Vascular Resistance
•Systemic Vascular Resistance Index

aDvantages of liDco plus system
•Provides an absolute cardiac output value via a novel and proven indicator dilution technique
•Provides ITBV
•Requires no additional invasive catheters
•Safe – using non-toxic bolus dosages
•Simple and quick to set up and can be used by nursing staff
•Accurate
•Temperature non-dependent
•Less invasive monitoring
•Utilises existing peripheral or central venous and arterial lines

Picco anD liDco plus system

electrical bioimPeDance• Make use of constant electrical current stimulation for identification
of thoracic or body impedance variations induced by vascular blood flow.
• Electrodes are placed in specific areas on the neck and thorax.
• A low-grade electrical current, from 2 - 4 mA is emitted, and received by the adjacent electrodes.
• Impedance to the current flow produces a waveform.
• Through electronic evaluation of these waveforms, the timing of aortic opening and closing can be used to calculate the left ventricular ejection time and stroke volume.


electrical bioimPeDance
aDvantage:
•Non invasive•Some report same clinical accuracy as thermodilution technique.•New generation of EB device using upgraded computer technology and refined algorithms to calculate CO and get better results.
DisaDvantage:
•Reliability in critically ill patients still not very clear.•Other report poor agreement in those haemodynamically unstable and post cardiac surgery.
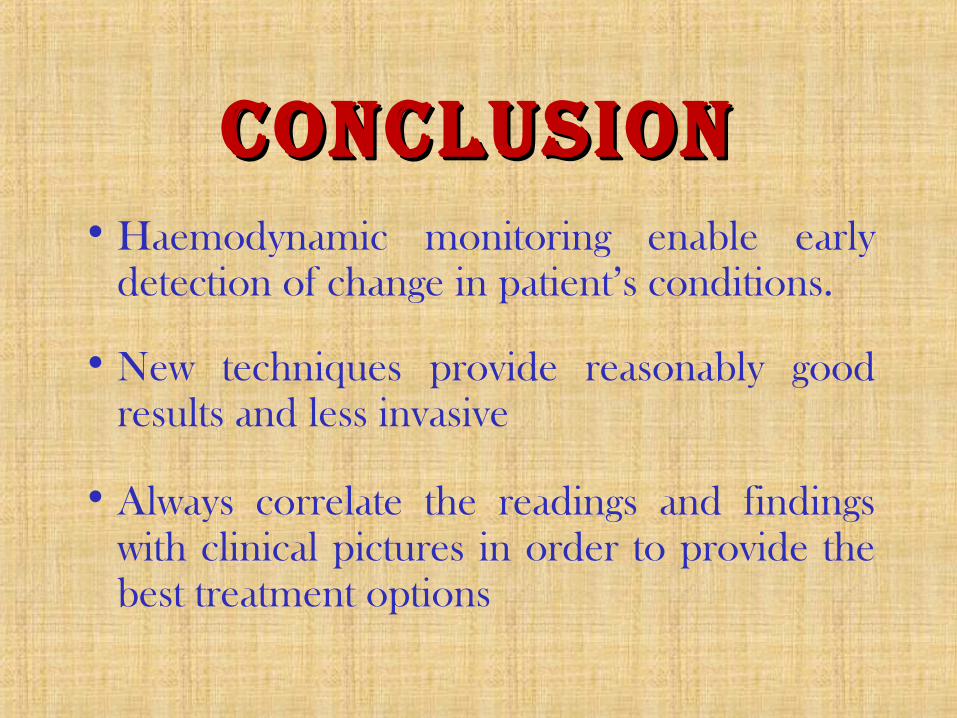
conclusionconclusion• Haemodynamic monitoring enable early
detection of change in patient’s conditions.
• New techniques provide reasonably good results and less invasive
• Always correlate the readings and findings with clinical pictures in order to provide the best treatment options