air quality monitoring in northern ireland, 2000-2001 · aeat/env/r/1260 issue 1 air quality...
TRANSCRIPT

AEAT/ENV/R/1260 Issue 1
Air Quality Monitoring in Northern Ireland, 2000-2001
A report produced for the Department of the Environment in Northern Ireland in partnership with the Chief Environmental Health Officers Group.

AEAT/ENV/R/1260 Issue 1
Air Quality Monitoring in Northern Ireland, 2000-2001
A report produced for the Department of the Environment in Northern Ireland in partnership with the Chief Environmental Health Officers Group.
November 2002

AEAT/ENV/R/1260 Issue 1
netcen ii
Title Air Quality Monitoring in Northern Ireland, 2000-2001 Customer Department of the Environment in Northern Ireland Customer reference
Requisition No. 09B0011126
Confidentiality, copyright and reproduction
Copyright AEA Technology plc 2000 All rights reserved. Enquiries about copyright and reproduction should be addressed to the Commercial Manager, AEA Technology plc.
File reference ED48079001/001 Report number AEAT/ENV/R/1260
Report status Issue 1 Contact Details for netcen:
A Loader netcen Culham Science Park ABINGDON OX14 3ED Telephone 01235 463133 Facsimile 01235 463011
netcen is an operating division of AEA Technology plc netcen is certificated to ISO 9001 and ISO 14001
Contact Details for Environment and Heritage Service: Environment and Heritage Service Air and Environmental Quality Unit Calvert House 23 Castle Place BELFAST BT1 1FY Telephone: 02890 254758 Facsimile: 02890 254793 Web site: www.ehsni.gov.uk
Name Signature Date
Author A Loader P Willis J Lampert
21/11/02
Reviewed by K Stevenson 21/11/02
Approved by P Willis 21/11/02

AEAT/ENV/R/1260 Issue 1
netcen iii
“Our aim is to protect and conserve the natural and built environment and to promote its appreciation for the benefits of present and future generations.”

AEAT/ENV/R/1260 Issue 1
netcen iv
Foreword The link between clean air and good health is well-known. High levels of air pollution can help to make people ill and it can contribute to the premature death of those already seriously ill. Clean air is therefore essential to the health and well-being of us all. Implementing the Air Quality Strategy is a vital part of the Department of the Environment’s commitment to improving air quality. Local air quality management is central to the Strategy. Legislation will soon be introduced to enable Government Departments, District Councils and stakeholders to deliver their contribution to meeting air quality targets and objectives. In meeting these targets and objectives, we will also be fulfilling our commitment to 'Investing for Health', to reduce the levels of respiratory and heart disease. The Department has been most encouraged by the work already carried out by District Councils. All 26 Councils have completed the first stage of the review and assessment of air quality within their respective areas and are currently working to complete stage 2. Funding has been provided by the Department to assist Councils in this review and assessment process. This Report provides a comprehensive view of air quality in Northern Ireland in 2000 and 2001. It has been drawn up in partnership with the Chief Environmental Health Officers Group (CEHOG). CEHOG has welcomed the publication of this report and is pleased to have been involved in this important partnership in collating and providing air quality monitoring data from District Council sites. Since air quality is so important to our own health and our environment, we intend to publish annual Reports. We look forward to strengthening our close working relationship with CEHOG. The Report will be an invaluable reference point. Readers will be able to assess compliance with air quality standards and air quality trends over time. We commend this Report to you and would welcome any comments you may have.
Richard Rogers Chief Executive Environment and Heritage Service
John Michael Chairman of the Chief Environmental Health Officers Group
AEAT/ENV/R/1260 Issue 1
netcen v
Executive Summary
This report presents a summary of air quality in Northern Ireland over the calendar years 2000 and 2001. It is intended to bring together in one report, results from all the District Councils and other organisations who carried out air quality measurements in Northern Ireland over this period, both as part of larger monitoring networks and for other purposes. It aims to provide information on the main pollutants of concern, details of the air quality monitoring undertaken in 2000 – 2001, and a summary of results for each pollutant. On the basis of results from 2000 and 2001, the following pollutants appear not to present a problem with respect to meeting air quality objectives in Northern Ireland: carbon monoxide (CO), particulate matter (PM10), benzene, 1,3-butadiene, lead and other metals. Occasional exceedences may occur in the case of ozone, particularly in rural locations. However, these are likely to be infrequent, and related to meteorological conditions; ozone is, in any case, a transboundary pollutant and difficult to control by local action. The monitoring results indicate that the following pollutants may present a problem in meeting air quality objectives, in some parts of Northern Ireland:
• Sulphur dioxide: in residential areas where there is a high incidence of domestic solid fuel burning, there may be difficulty in meeting objectives relating to the 15-minute and 24-hour means.
• Benzo(a)pyrene and other polycyclic aromatic hydrocarbons (PAHs), again in solid-fuel burning residential areas.
• Possibly nitrogen dioxide (NO2) at a few urban roadside locations. Historically, there has been limited availability of natural gas in Northern Ireland, which has necessitated the widespread domestic use of solid fuels and oil. Inevitably, this has led to some residential areas having relatively high levels of pollutants associated with coal burning (sulphur dioxide, PAHs and in some cases smoke). Therefore, these remain the pollutants of concern for some parts of the region. However, as natural gas becomes more widely used in Northern Ireland, it is likely that ambient concentrations of these pollutants will decrease. Carbon monoxide was monitored using automatic techniques at two sites (Belfast and Londonderry). Both met the EC 2nd Daughter Directive limit value and UK Air Quality Strategy (AQS) objective for this pollutant in 2000 and 2001. Nitrogen dioxide was monitored using the automatic chemiluminescent technique at four sites: Belfast Centre, Londonderry and two in Newry. No sites exceeded the 1st Daughter Directive limit and AQS objective of 200 µg m-3 for the hourly mean, more than the permitted 18 times per year in 2000 or 2001. The annual mean was found to be below the limit value of 40 µg m-3
at all four sites. Nitrogen dioxide was also monitored on a monthly basis using passive diffusion tube samplers at 128 sites in 2000 and 155 sites in 2001. The EC 1st Daughter Directive limit value and AQS objective for the annual mean (40 µg m-3) was exceeded at four sites in 2000 (three Roadside and one Intermediate), and at six sites in 2001 (all Roadside). All these sites were either in urban centres close to busy main roads, or in smaller town centres at locations where traffic queues form. Annual average NO2 concentrations for 2000 and 2001 were comparable to those reported by the NO2 Network for Northern Ireland. Sulphur Dioxide (SO2) was monitored at five sites (central and eastern Belfast, Londonderry and two in Newry) using automatic techniques. All automatic sites except Belfast East met the 1st Daughter Directive limit values and AQS objectives. Belfast East exceeded the AQS objective for the 15-minute mean in both 2000 and 2001, and exceeded the EC 1st Daughter Directive limit value and AQS objective for the 24-hour mean in 2001. This site (and possibly similar locations) may have difficulty in meeting this EC limit value and these AQS objectives for sulphur dioxide by the required dates in 2004 and 2005.

AEAT/ENV/R/1260 Issue 1
netcen vi
A further 31 urban sites monitored sulphur dioxide using the non-automatic net acidity method. In 2000, one site in Dunmurry exceeded the 24-hour limit value for SO2 (125 µg m-3) on more than the permitted three days. In 2001, three sites in Belfast exceeded this limit value on more than three days. The 2001 exceedences were associated with episodes of high SO2 during January and February 2001. Particulate matter as PM10 was monitored at six sites (two in Belfast, one in Londonderry, two in Newry and one rural location, Lough Navar). All of these met the EC 1st Daughter Directive limits and Air Quality Strategy objectives relating to annual and daily averages, for PM10. Particulate matter was also measured using the older “black smoke” method, at 31 urban sites. The limits set for smoke by EC Directive 80/779/EEC (on sulphur dioxide and suspended particulates) remain in force until 2005, and require demonstration of compliance. No Northern Ireland sites have exceeded any of the limit values of Directive 80/779/EEC relating to smoke, since 1990. However, levels remain relatively high in residential areas where domestic solid fuel use is prevalent. Ozone was monitored at four sites: three using automatic techniques (Belfast, Londonderry and Lough Navar) and one using diffusion tubes (in Fermanagh). In 2000, one of the automatic monitoring sites (at Londonderry) exceeded the target value of the latest EC Ozone Directive (2002/3/EC) and the AQS objective, on more than the permitted ten days. Benzene and 1,3-butadiene were monitored at Belfast South until 2000, as part of a monitoring programme which concluded at the end of that year. Both pollutants were within AQS objectives in 2000. Polycyclic aromatic hydrocarbons were monitored at two sites: Lisburn and Belfast. Annual mean benzo(a)pyrene concentrations for 2000 and 2001 were above the new AQS objective (currently applicable only to England, Scotland and Wales) of 0.25 ngm-3. Those at Lisburn were very close to the proposed EC target value of 1.0 ngm-3 for this PAH. Benzo(a)pyrene concentrations at Lisburn were particularly high, with annual means of 0.93 ngm-3 in 2000, and 0.96 ngm-3 for 2001. These values are considerably higher than those measured at most urban sites in the UK, and closer to those typically found in industrial areas than in residential suburbs. The major source of PAH is the widespread use of domestic solid fuels in this area. The metals lead, cadmium, arsenic, nickel and mercury were monitored at three industrial sites (Campsey, Whitehead and Belfast Harbour) over a twelve-month period, December 1999 to November 2000. Annual mean concentrations of lead were well within EC and AQS limits. Annual means of cadmium, arsenic, and nickel were well within proposed EC Directive target values (which have not yet been finalised). These metallic pollutants are unlikely to constitute a serious problem in Northern Ireland. Trends in ambient concentrations were investigated for all pollutants where sufficient years’ data were available, and in some cases significant downward trends were identified. However, by contrast, average pollutant concentrations in 2001 were, in many cases, slightly higher than those recorded in 2000. Such fluctuations are likely to be due to variations in factors such as meteorology; however they highlight the need for continued monitoring of air quality. District Councils in Northern Ireland are currently engaged in the Local Air Quality Management Review and Assessment process. When complete, the results may highlight further areas of concern with respect to air quality. In addition, a substantial number of new automatic monitoring sites are being established throughout the region. These, too, will assist in identifying areas where action may be needed to improve air quality.

AEAT/ENV/R/1260 Issue 1
netcen vii
Contents
Executive Summary v
1 Introduction 1
1.1 BACKGROUND 1 1.2 OBJECTIVES 1
2 Air Quality Developments in 2000 and 2001 2
2.1 THE EUROPEAN UNION 2 2.2 THE AIR QUALITY STRATEGY 2 2.3 LOCAL AIR QUALITY MANAGEMENT REVIEW AND ASSESSMENT 3 2.4 MONITORING 3
3 Carbon Monoxide 4
3.1 MONITORING OF CARBON MONOXIDE 4 3.2 LIMIT VALUES AND OBJECTIVES FOR CARBON MONOXIDE 5 3.3 CARBON MONOXIDE RESULTS 5 3.4 CARBON MONOXIDE TRENDS 6
4 Nitrogen Dioxide 8
4.1 MONITORING OF NITROGEN DIOXIDE 8 4.2 LIMIT VALUES AND OBJECTIVES FOR NITROGEN DIOXIDE 11 4.3 AUTOMATIC NITROGEN DIOXIDE RESULTS 12 4.4 DIFFUSION TUBE NITROGEN DIOXIDE RESULTS 12 4.5 NITROGEN DIOXIDE TRENDS 13
4.5.1 Trends at Automatic Nitrogen Dioxide Sites 13 4.5.2 Trends at Diffusion Tube Nitrogen Dioxide Sites 14
5 Sulphur Dioxide 15
5.1 MONITORING OF SULPHUR DIOXIDE 15 5.2 LIMIT VALUES AND OBJECTIVES FOR SULPHUR DIOXIDE 20 5.3 AUTOMATIC SULPHUR DIOXIDE RESULTS 21 5.4 NON-AUTOMATIC SULPHUR DIOXIDE RESULTS 22 5.5 DIFFUSION TUBE SULPHUR DIOXIDE RESULTS 22 5.6 SULPHUR DIOXIDE TRENDS 23
5.6.1 Trends at Automatic Sulphur Dioxide Sites 23 5.6.2 Trends at Non-Automatic Sulphur Dioxide sites 24
6 Particulate Matter 26
6.1 MONITORING OF PARTICULATE MATTER 26 6.1.1 PM10 Monitoring 26 6.1.2 Smoke Monitoring 27
6.2 LIMIT VALUES AND OBJECTIVES FOR SUSPENDED PARTICULATE MATTER 28 6.2.1 Limit Values and Objectives for PM10 28 6.2.2 Limits and Guide Values for Black Smoke 28
6.3 PARTICULATE MATTER RESULTS 29 6.3.1 PM10 Results 29 6.3.2 Black Smoke Results 30
6.4 PARTICULATE MATTER TRENDS 30 6.4.1 PM10 Trends 31

AEAT/ENV/R/1260 Issue 1
netcen viii
6.4.2 Black Smoke Trends 31
7 Ozone 33
7.1 MONITORING OF OZONE 33 7.2 LIMIT VALUES AND OBJECTIVES FOR OZONE 34 7.3 OZONE RESULTS 35 7.4 OZONE TRENDS 36
8 Hydrocarbons 38
8.1 MONITORING OF HYDROCARBONS 38 8.2 LIMIT VALUES AND OBJECTIVES FOR HYDROCARBONS 39 8.3 HYDROCARBON RESULTS 40
8.3.1 Benzene and 1,3 Butadiene 40 8.3.2 Polycyclic Aromatic Hydrocarbons 41
8.4 HYDROCARBON TRENDS 42
9 Metals 44
9.1 MONITORING OF METALS 44 9.2 LIMIT VALUES AND OBJECTIVES FOR METALS 45
9.2.1 Lead 45 9.2.2 Other Metals 45
9.3 METALS RESULTS 46
10 Conclusions 47
11 Acknowledgements 48
12 References 48
Appendices
Appendix 1 Diffusion Tube Site Details and Data
Appendix 2 Data from Smoke and SO2 Sites

AEAT/ENV/R/1260 Issue 1
netcen ix

AEAT/ENV/R/1260 Issue 1
netcen 1
1 Introduction
1.1 BACKGROUND
This report on air quality monitoring in Northern Ireland has been produced for the Department of the Environment, by netcen (an operating division of AEA Technology Environment). It combines data from large-scale networks such as the Automatic Urban Network and Non-Automatic Networks, with data from the considerable number of other monitoring sites operated by Northern Ireland’s District Councils. The former data are provided by netcen: the latter have been collected and compiled by the Pollution Control Group of the Chief Environmental Health Officers Group (CEHOG) for Northern Ireland. The period covered is calendar years 2000 and 2001. The report follows on from the series of six previous reports produced by CEHOG. Long term, quality assured monitoring is an important feature of the assessment and control of air pollution. With appropriate analysis and interpretation, air quality monitoring data can be used for:
• Establishing a sound scientific basis for policy development; • Determining compliance with air quality objectives and guidance; • Assessing air quality trends; • Assessing the effectiveness of control policies; • Research needs; • Public information; and • National and local air quality management. Much of Northern Ireland is rural, and in such areas air quality is usually good. However, urban localities experience generally higher levels of pollution. Historically, there has been limited availability of natural gas in Northern Ireland; as a result, domestic use of coal, solid fuels and oil has remained relatively widespread. Therefore, levels of pollutants associated with domestic solid fuel burning, such as sulphur dioxide (SO2), and particulate matter (smoke and PM10) can be particularly high in parts of Northern Ireland. Oxides of nitrogen (NO and NO2) are also pollutants of concern in some urban areas; the dominant source of these pollutants is thought to be motor vehicles. This is an area over which District Councils currently have no regulatory control. The need for greater control over, or restrictions on emissions from vehicles will only become clear once District Councils complete their Review and Assessment of local air pollution.
1.2 OBJECTIVES
Air quality monitoring in Northern Ireland is carried out by various District Councils and other bodies. Techniques used range from simple passive samplers to sophisticated continuous analysers. Some monitoring sites are part of larger networks; others are not. This report aims to bring together all air quality monitoring data obtained for Northern Ireland in 2000 and 2001. It is intended to assist District Councils in their ongoing Review and Assessments of local air quality by:
• providing information on the main pollutants of concern, • setting out details of the air quality monitoring undertaken in 2000 and 2001, and • presenting a summary of results and trends from monitoring sites. It is not intended that this report will make specific comment or recommendations on air quality monitoring in Northern Ireland. The need for additional monitoring within individual District Council areas should be identified as part of the ongoing Review and Assessment process (referred to later). This report is intended to be primarily an update on developments in the field of air quality and a summary of air quality data across Northern Ireland for 2000 and 2001.
AEAT/ENV/R/1260 Issue 1
netcen 2
2 Air Quality Developments in 2000 and 2001
2.1 THE EUROPEAN UNION
The European Council Directive 96/62/EC on Ambient Air Quality Assessment and Management, (The Framework Directive), establishes a framework under which the EU will agree air quality limit values for specified pollutants in a series of ‘Daughter Directives’. These will supersede existing air quality legislation. It is envisaged that the structures established under the UK Air Quality Strategy and supporting legislation will provide the principal means of implementing the UK’s commitments under this Directive. So far, three Daughter Directives have been agreed:
• The first Daughter Directive (1999/30/EEC), covering sulphur dioxide (SO2), oxides of
nitrogen, particulate matter as PM10, and lead, came into force on 19 July 1999. This Directive contains limit values for these pollutants, aimed at protection of human health and of ecosystems. This Directive was transposed by The Air Quality Limit Values Regulations (Northern Ireland) 2002.
• The second Daughter Directive (2000/69/EC) covers carbon monoxide (CO) and benzene. It came into force on 13 December 2000. It is intended that this Directive will be transposed later this year by The Air Quality Limit Values (Amendment) Regulations (Northern Ireland) 2002.
• The third Daughter Directive (or EC Ozone Directive, 2002/3/EC) came into force in 2002 and is scheduled for transposition in 2003.
The remaining pollutants listed in the Framework Directive are polycyclic aromatic hydrocarbons (PAHs), and the metallic elements cadmium, arsenic, nickel and mercury. The European Commission is working on proposals for a fourth Air Quality Daughter Directive covering these. The aim is to set ambient air quality target values, from 2010, for arsenic, cadmium, nickel and polycyclic aromatic hydrocarbons (PAHs); some target values have been proposed but not yet agreed.
2.2 THE AIR QUALITY STRATEGY
The first Air Quality Strategy (AQS) was published in 1997, setting out policies for the management of ambient air quality and thus fulfilling the requirement of the Environment Act 1995 for a national air quality strategy. Pollutants originally covered by the strategy are: benzene, 1,3-butadiene, carbon monoxide, lead, oxides of nitrogen, particulate matter (as PM10) and sulphur dioxide. The strategy sets out a strategic framework within which air quality policies will be taken forward in the short to medium term, and sets objectives to be met by 2005 for the air pollutants covered. The Strategy was subsequently reviewed, and a revised Air Quality Strategy for England, Scotland, Wales and Northern Ireland was published in January 2000. Air Quality Strategy objectives are discussed in the subsequent sections of this report which deal with the individual pollutants. Following a recent consultation process on the revised Air Quality Strategy, it was announced by Defra, the Scottish Executive and the Welsh Assembly in 2002 that the AQS objectives for carbon monoxide and benzene are to be brought into line with those set by the 2nd Daughter Directive. In addition, further PM10 objectives have been set for 2010 and for the first time, an objective for polycyclic aromatic hydrocarbons (PAHs) has been added. These new Air Quality Strategy objectives at present only apply to England, Scotland and Wales. No policy decision has yet been taken on the inclusion of these objectives for Northern Ireland in the revised Air Quality Strategy addendum. Therefore, this report compares monitoring results only with the objectives currently applicable in Northern Ireland, except in the case of PAHs.

AEAT/ENV/R/1260 Issue 1
netcen 3
2.3 LOCAL AIR QUALITY MANAGEMENT REVIEW AND ASSESSMENT
Under the Environment Act 1995, Local Authorities in England, Scotland and Wales are required to carry out a Review and Assessment of their local air quality. The process involves a three stage phased approach. Stage 1 is an initial screening of industrial, transport and other sources, such as domestic emissions, which have a significant impact within the local authority area and the identification of pollutants of concern locally. Every Authority must carry out Stage 1. If this indicates a possible exceedence of any Air Quality objective, the Authority should proceed to Stage 2. Stage 2 is a more detailed screening assessment of all the pollutants identified as significant locally in the first stage; if this indicates that relevant objectives may not be met, it will be necessary to proceed to Stage 3. Stage 3 is an accurate detailed review of pollutants, using monitoring and computer modelling techniques to predict the likelihood of exceeding the AQS objectives. An Air Quality Management Area (AQMA) must be declared after this stage if the review establishes that AQS objectives are likely to be exceeded after the relevant target date. At the time of writing, almost all Local Authorities in England, Wales and Scotland have completed this process. The Review and Assessment process in Northern Ireland was to be given a statutory basis by the Local Air Quality Management Bill. This Bill was introduced in the Northern Ireland Assembly in June and was at Committee Stage in the legislative process when suspension of the Assembly occurred on 13 October. The provisions of the Bill are now contained in the draft Environment (Northern Ireland) Order, expected to receive Royal Assent by March 2003. In advance of the introduction of the legislative framework, District Councils in Northern Ireland have voluntarily completed Stage 1 reviews and assessments.
2.4 MONITORING
During 2000 and 2001, District Councils in Northern Ireland continued their own routine monitoring, and in many cases contributed to national networks including the Automatic Urban Network, the Nitrogen Dioxide Network and Smoke and Sulphur Dioxide Network. Information on these monitoring networks can be found on the Air Quality Archive, at www.airquality.co.uk . The year 2000 saw the conclusion of a twelve-month investigation of ambient concentrations of heavy metals around industrial emission sources1. Concentrations of the metals lead, cadmium, arsenic, nickel and mercury in the particulate phase were monitored at three sites near industrial emission sources over a twelve-month period, December 1999 to November 2000. The sites were located at Campsey, Whitehead and Belfast Harbour. A second monitoring site for polycyclic aromatic hydrocarbons (PAHs) was set up in 2000 at Clara Street, Belfast. Together with the existing site at Lisburn, these two sites contribute data to the Hazardous Air Pollutants (HAPS) network.

AEAT/ENV/R/1260 Issue 1
netcen 4
3 Carbon Monoxide
Carbon monoxide (CO) is a pollutant gas generated by combustion sources. At very high concentrations (such as may occur inside a building with a faulty heating appliance), it can be a dangerous asphyxiant. Whilst outdoor concentrations do not generally reach dangerous levels, they may still have adverse health effects for vulnerable people. CO is a component of vehicle emissions, and the highest outdoor concentrations occur near busy roads. In this report, concentrations of carbon monoxide are expressed as milligrammes (i.e. 10-3 grammes) per cubic metre (mgm-3). To convert to parts per million, if necessary, the following relationship should be used: 1 ppm = 1.16 mgm-3 for carbon monoxide at 293K (20°°°°C) and 1013mb.
3.1 MONITORING OF CARBON MONOXIDE
CO is monitored at two sites in Northern Ireland. They are part of the Automatic Urban Network (AUN) and use the Non-Dispersive Infra Red (NDIR) continuous monitoring technique. The sites are listed in Table 3.1, and shown in Figure 3.1.
Table 3.1 CO Monitoring Sites
Site Grid Reference Classification Network Belfast Centre J 339 744 Urban Centre AUN Londonderry C 429 172 Urban Background AUN

AEAT/ENV/R/1260 Issue 1
netcen 5
3.2 LIMIT VALUES AND OBJECTIVES FOR CARBON MONOXIDE
The World Health Organisation has established non-mandatory air quality guidelines for carbon monoxide. Within the European Community, CO is covered by EC Directive 2000/69/EC (the 2nd Daughter Directive). In the UK, the Air Quality Strategy contains an objective for CO, to be met by 31st December 2003.
Table 3.2 Limit Values and Objectives for Carbon Monoxide
Averaging period EC Limit or
AQS Objective
No. of Permitted exceedences
To be achieved by
WHO (non-mandatory) 15-minute 100 mgm-3 - - 30-minute 60 mgm-3 - - 1-hour 30 mgm-3 - - 8-hour 10 mgm-3 - - EC 2nd Daughter Directive (2000/69/EC) Max. Daily 8-hour Mean
10 mgm-3
(8.6 ppm) - 1st January 2005
Air Quality Strategy (as currently adopted in Northern Ireland) Running 8-hour mean
11.6 mgm-3 (10 ppm)
- 31st December 2003
3.3 CARBON MONOXIDE RESULTS
The results from the CO measuring sites are shown in Table 3.3 below. Annual data capture is at least 75% except where indicated.
Table 3.3 Results from Automatic CO Monitoring Sites
Calendar Year
Annual Mean mg m-3
Max 1 Hour Mean mg m-3
Daily Max Running 8- Hour Mean mg m-3
Number of Exceedences of EC Limit Value
Belfast Centre
1992 0.8 21.0 11.9 5
1993 0.8 16.8 12.3 1
1994 0.8 18.9 15.5 2
1995 0.7 18.9 16.2 4
1996 0.6 12.5 9.4 0
1997 0.8 10.8 8.1 0
1998 0.5 6.0 4.1 0
1999 0.5 5.2 4.3 0
2000 0.5 5.2 3.5 0
2001 a 0.5 7.2 5.5 0
Londonderry 1997 b 0.3 6.0 3.9 0
1998 0.5 9.5 4.9 0
1999 0.3 5.6 3.0 0
2000 0.3 3.9 2.3 0
2001 0.3 4.9 2.4 0 a) Limited data capture: Belfast Centre 2001 (60%) b) Limited data capture Londonderry 1997 (60%)

AEAT/ENV/R/1260 Issue 1
netcen 6
Both sites currently meet the EC 2nd Daughter Directive limit value and the Air Quality Strategy objective for this pollutant, with maximum daily running 8-hour mean below 10 mg m-3 since 1996.
3.4 CARBON MONOXIDE TRENDS
Figure 3.2 illustrates the falling trend in maximum 8-hour running mean CO concentration for the two sites. Peak CO concentrations at Belfast Centre have decreased since the mid 1990s. However, both sites showed a slight increase in 2001 compared to the previous year.
Figure 3.2 Maximum Running 8-hour Mean CO Concentration
Trends are often shown more clearly by statistics based on longer periods, such as the annual mean. Figure 3.3 shows how the annual mean CO concentrations at the same sites have decreased since the early and mid 1990s but remained stable in recent years. Based on a regression analysis (Theil’s non-parametric regression analysis), there is a significant downward trend in the annual mean carbon monoxide at Belfast Centre but not at Londonderry. However, despite the overall downward trend at Belfast Centre, it should be noted that annual mean carbon monoxide appears to have remained stable for the past four years. Annual mean CO concentrations for 2001 showed slight increases on the 2000 values at both sites. Future years’ monitoring will be important, to establish whether or not the downward trend resumes.
0.0
2.0
4.0
6.0
8.0
10.0
12.0
14.0
16.0
18.0
1992 1993 1994 1995 1996 1997 1998 1999 2000 2001
Year
Con
cent
ratio
n, m
g m
-3
Belfast CentreLondonderry
AEAT/ENV/R/1260 Issue 1
netcen 7
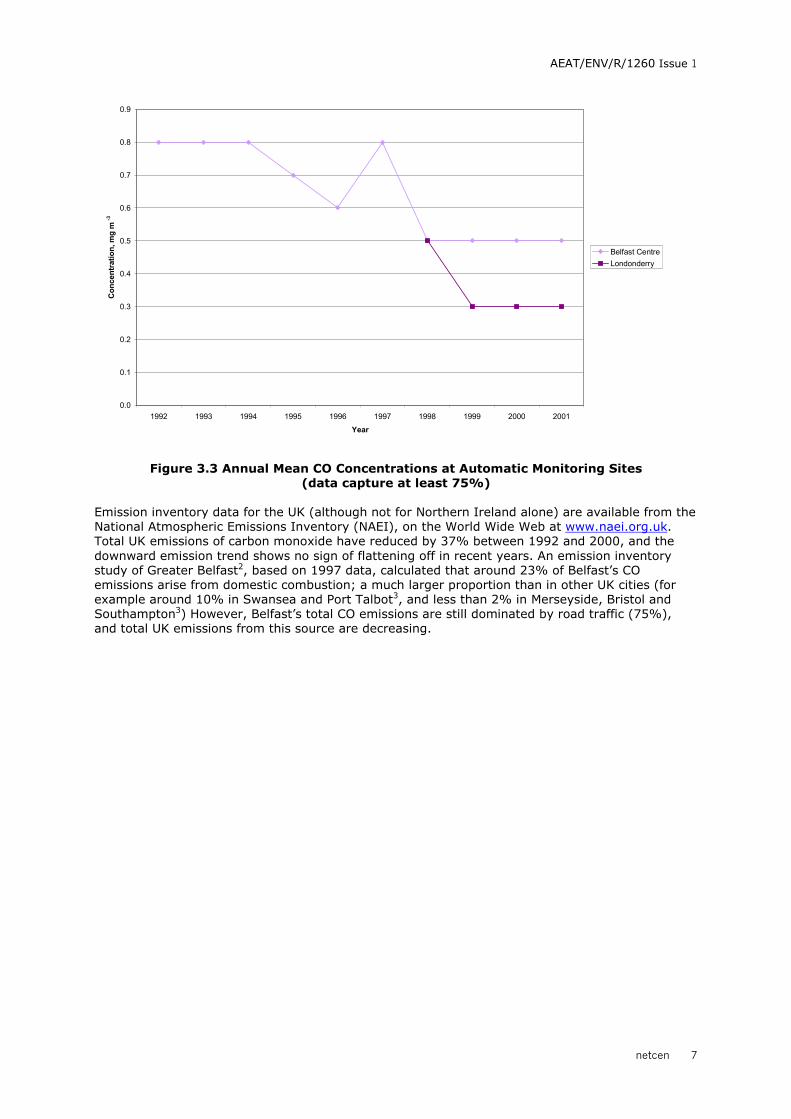
Figure 3.3 Annual Mean CO Concentrations at Automatic Monitoring Sites
(data capture at least 75%) Emission inventory data for the UK (although not for Northern Ireland alone) are available from the National Atmospheric Emissions Inventory (NAEI), on the World Wide Web at www.naei.org.uk. Total UK emissions of carbon monoxide have reduced by 37% between 1992 and 2000, and the downward emission trend shows no sign of flattening off in recent years. An emission inventory study of Greater Belfast2, based on 1997 data, calculated that around 23% of Belfast’s CO emissions arise from domestic combustion; a much larger proportion than in other UK cities (for example around 10% in Swansea and Port Talbot3, and less than 2% in Merseyside, Bristol and Southampton3) However, Belfast’s total CO emissions are still dominated by road traffic (75%), and total UK emissions from this source are decreasing.
0.0
0.1
0.2
0.3
0.4
0.5
0.6
0.7
0.8
0.9
1992 1993 1994 1995 1996 1997 1998 1999 2000 2001Year
Conc
entra
tion,
mg
m-3
Belfast CentreLondonderry
AEAT/ENV/R/1260 Issue 1
netcen 8
4 Nitrogen Dioxide
A mixture of nitrogen dioxide (NO2) and nitric oxide (NO) is emitted by combustion processes. This mixture of oxides of nitrogen is collectively termed NOX. NO is subsequently oxidised to NO2 in the atmosphere. NO2 is an irritant to the respiratory system, and can affect human health. Ambient concentrations of NO2 are likely to be highest in the most built-up areas, especially where traffic is congested, or buildings either side of the street create a “canyon” effect, impeding the dispersion of vehicle emissions. In this report, concentrations of nitrogen dioxide are expressed as microgrammes (i.e. 10-6 grammes) per cubic metre (µg m-3). To convert to parts per billion (ppb) if necessary, the following relationship should be used: 1 ppb = 1.91 µg m-3 for nitrogen dioxide at 293K (20°°°°C) and 1013mb.
4.1 MONITORING OF NITROGEN DIOXIDE
Monitoring of NO2 is mainly carried out by two methods; automatic NOx analysers and NO2
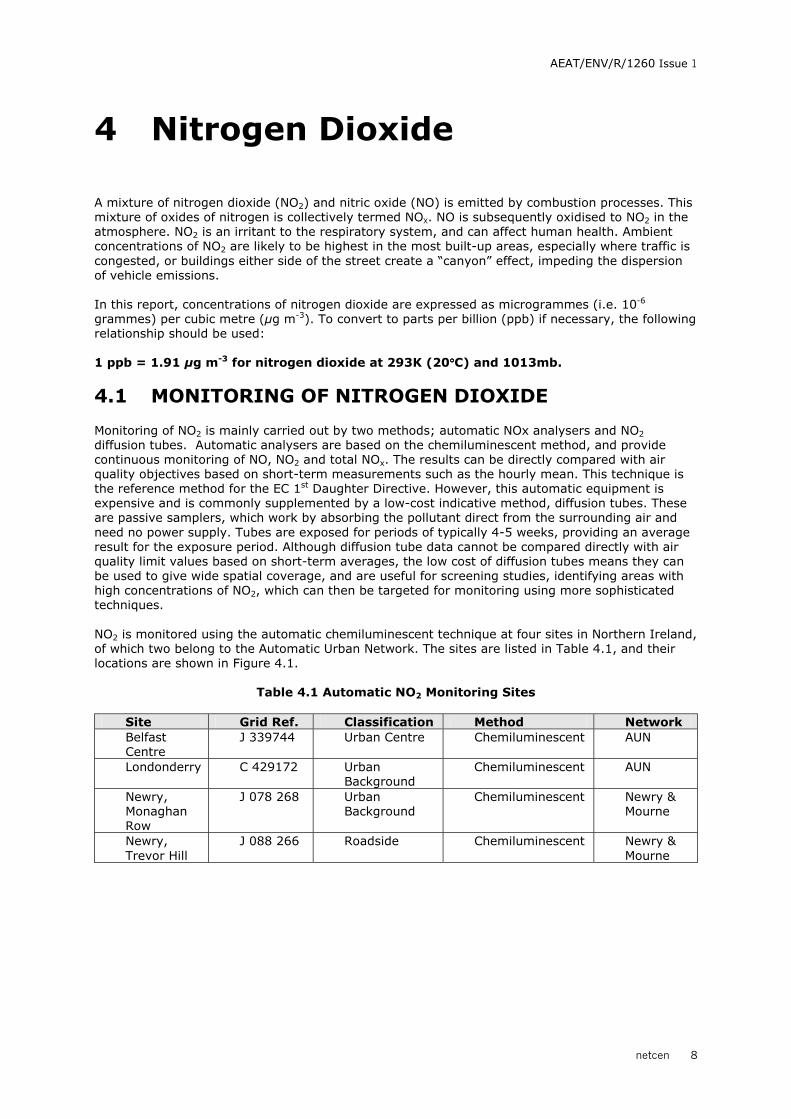
diffusion tubes. Automatic analysers are based on the chemiluminescent method, and provide continuous monitoring of NO, NO2 and total NOx. The results can be directly compared with air quality objectives based on short-term measurements such as the hourly mean. This technique is the reference method for the EC 1st Daughter Directive. However, this automatic equipment is expensive and is commonly supplemented by a low-cost indicative method, diffusion tubes. These are passive samplers, which work by absorbing the pollutant direct from the surrounding air and need no power supply. Tubes are exposed for periods of typically 4-5 weeks, providing an average result for the exposure period. Although diffusion tube data cannot be compared directly with air quality limit values based on short-term averages, the low cost of diffusion tubes means they can be used to give wide spatial coverage, and are useful for screening studies, identifying areas with high concentrations of NO2, which can then be targeted for monitoring using more sophisticated techniques. NO2 is monitored using the automatic chemiluminescent technique at four sites in Northern Ireland, of which two belong to the Automatic Urban Network. The sites are listed in Table 4.1, and their locations are shown in Figure 4.1.
Table 4.1 Automatic NO2 Monitoring Sites
Site Grid Ref. Classification Method Network Belfast Centre
J 339744 Urban Centre Chemiluminescent AUN
Londonderry C 429172 Urban Background
Chemiluminescent AUN
Newry, Monaghan Row
J 078 268 Urban Background
Chemiluminescent Newry & Mourne
Newry, Trevor Hill
J 088 266 Roadside Chemiluminescent Newry & Mourne
AEAT/ENV/R/1260 Issue 1
netcen 9
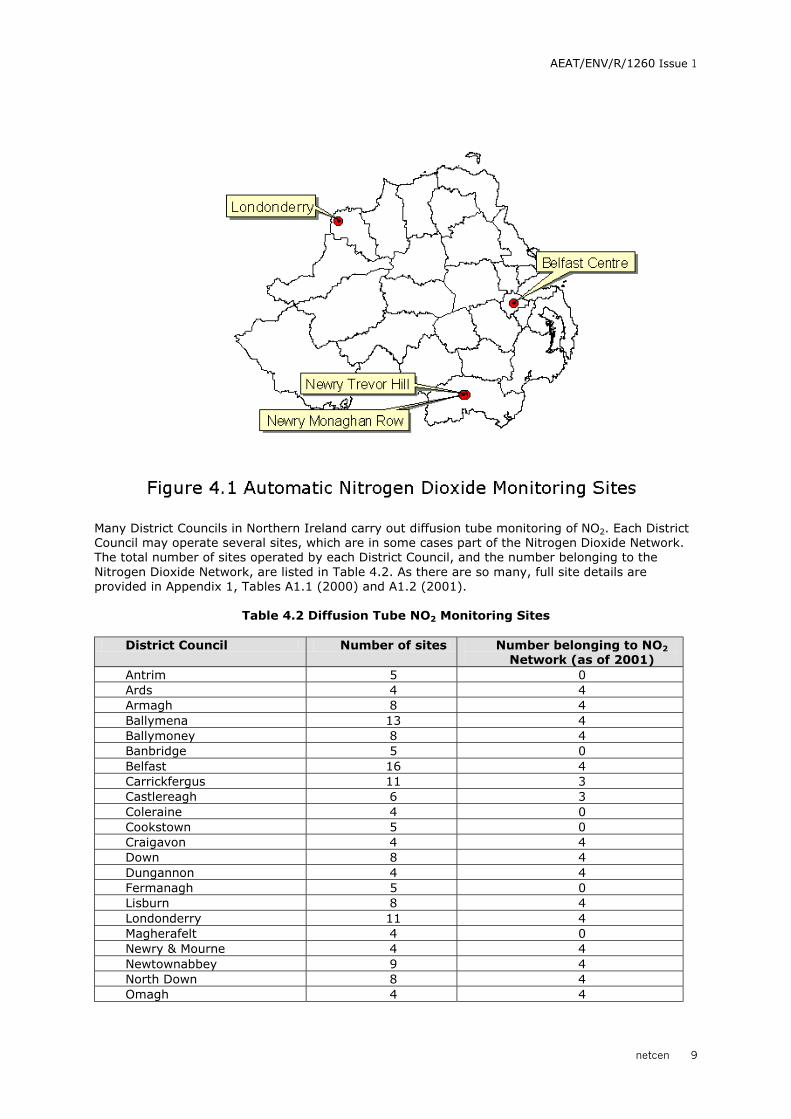
Many District Councils in Northern Ireland carry out diffusion tube monitoring of NO2. Each District Council may operate several sites, which are in some cases part of the Nitrogen Dioxide Network. The total number of sites operated by each District Council, and the number belonging to the Nitrogen Dioxide Network, are listed in Table 4.2. As there are so many, full site details are provided in Appendix 1, Tables A1.1 (2000) and A1.2 (2001).
Table 4.2 Diffusion Tube NO2 Monitoring Sites
District Council Number of sites Number belonging to NO2 Network (as of 2001)
Antrim 5 0 Ards 4 4 Armagh 8 4 Ballymena 13 4 Ballymoney 8 4 Banbridge 5 0 Belfast 16 4 Carrickfergus 11 3 Castlereagh 6 3 Coleraine 4 0 Cookstown 5 0 Craigavon 4 4 Down 8 4 Dungannon 4 4 Fermanagh 5 0 Lisburn 8 4 Londonderry 11 4 Magherafelt 4 0 Newry & Mourne 4 4 Newtownabbey 9 4 North Down 8 4 Omagh 4 4

AEAT/ENV/R/1260 Issue 1
netcen 10
NO2 diffusion tube monitoring sites in Northern Ireland are categorised as follows:
• (A) Roadside; 1-5m from the kerb of a busy road. • (B) Intermediate; 20-30m from the same or equivalent busy road. • (C )Urban Background; >50m from any busy road and typically in a residential area. • (D) Rural Background; sites > 50m from any busy road, in a rural area.
Locations of the NO2 diffusion tube monitoring sites in the Roadside category are shown in Figure 4.2, and NO2 diffusion tube monitoring sites in other categories are shown in Figure 4.3. These Figures show the locations of sites operating in 2001.
District Councils that participate in the Nitrogen Dioxide Network submit monthly measurements from typically four locations within their area: two Roadside and two Urban Background. (Prior to 2001, the Network included Intermediate sites. However, as from January 2001, most participating District Councils now submit data from two Roadside and two Urban Background sites, instead of one Roadside, one Intermediate and two Urban Background as previously).

AEAT/ENV/R/1260 Issue 1
netcen 11
4.2 LIMIT VALUES AND OBJECTIVES FOR NITROGEN DIOXIDE
The World Health Organisation has set non-mandatory guide values for NO2. Within Europe, NO2 is covered by the 1st Daughter Directive, 1999/30/EC. In the UK, the Air Quality Strategy sets objectives for this pollutant, for protection of human health and ecosystems. Limit values and objectives for NO2 are shown in Table 4.3.
Table 4.3 Limit Values and Objectives for Nitrogen Dioxide
Averaging period EC Limit or AQS
Objective
No. of Permitted exceedences
To be achieved by
WHO (non-mandatory) 1 hour 200 µg m-3 - - Annual Mean 40 µg m-3 - - EC 1st Daughter Directive (1999/30/EC) 1 hour 200 µg m-3 18 per year 1st January 2010 Annual Mean 40 µg m-3 - 1st January 2010 Annual Mean, for protection of vegetation
30 µg m-3
Total NOx - 19th July 2001
Air Quality Strategy 1 hour 200 µg m-3 18 per year 31st December
2005 Annual Mean 40 µg m-3 - 31st December
2005 Annual Mean, for protection of vegetation
30 µg m-3
Total NOx - 31st December
2000
AEAT/ENV/R/1260 Issue 1
netcen 12
4.3 AUTOMATIC NITROGEN DIOXIDE RESULTS
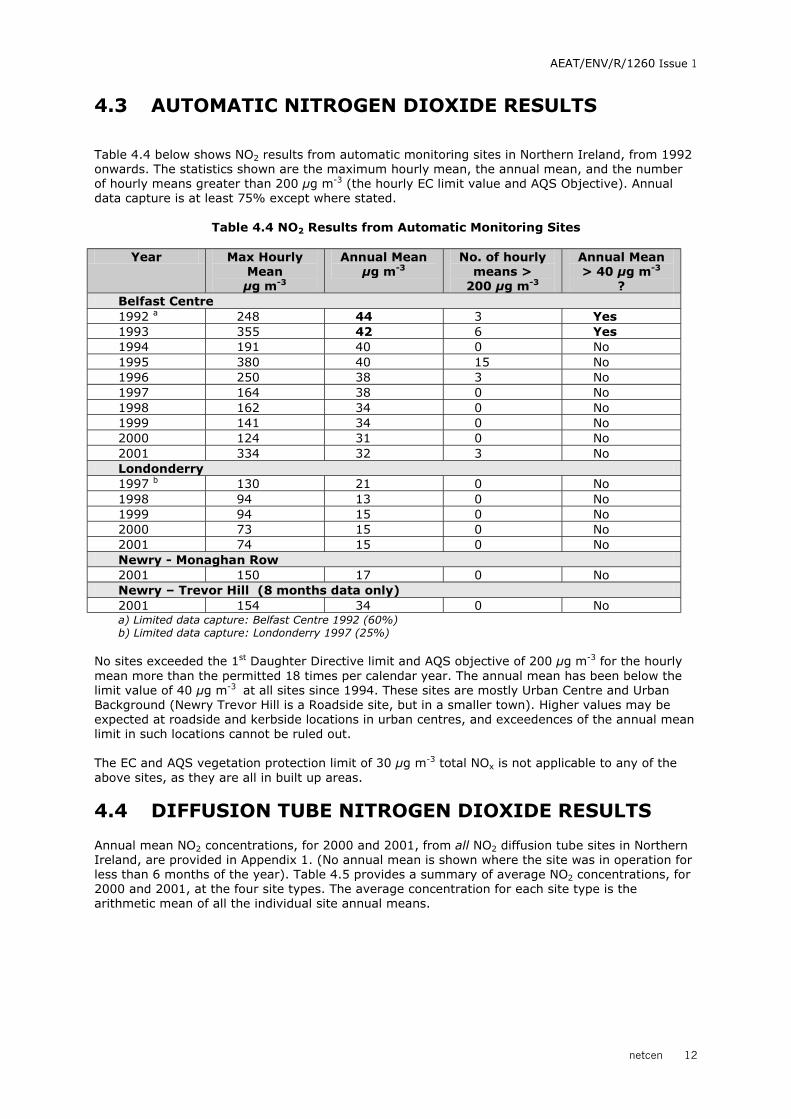
Table 4.4 below shows NO2 results from automatic monitoring sites in Northern Ireland, from 1992 onwards. The statistics shown are the maximum hourly mean, the annual mean, and the number of hourly means greater than 200 µg m-3 (the hourly EC limit value and AQS Objective). Annual data capture is at least 75% except where stated.
Table 4.4 NO2 Results from Automatic Monitoring Sites
Year Max Hourly Mean µg m-3
Annual Mean µg m-3
No. of hourly means >
200 µg m-3
Annual Mean > 40 µg m-3
? Belfast Centre 1992 a 248 44 3 Yes 1993 355 42 6 Yes 1994 191 40 0 No 1995 380 40 15 No 1996 250 38 3 No 1997 164 38 0 No 1998 162 34 0 No 1999 141 34 0 No 2000 124 31 0 No 2001 334 32 3 No Londonderry 1997 b 130 21 0 No 1998 94 13 0 No 1999 94 15 0 No 2000 73 15 0 No 2001 74 15 0 No Newry - Monaghan Row 2001 150 17 0 No Newry – Trevor Hill (8 months data only) 2001 154 34 0 No a) Limited data capture: Belfast Centre 1992 (60%) b) Limited data capture: Londonderry 1997 (25%)
No sites exceeded the 1st Daughter Directive limit and AQS objective of 200 µg m-3 for the hourly mean more than the permitted 18 times per calendar year. The annual mean has been below the limit value of 40 µg m-3 at all sites since 1994. These sites are mostly Urban Centre and Urban Background (Newry Trevor Hill is a Roadside site, but in a smaller town). Higher values may be expected at roadside and kerbside locations in urban centres, and exceedences of the annual mean limit in such locations cannot be ruled out.
The EC and AQS vegetation protection limit of 30 µg m-3 total NOx is not applicable to any of the above sites, as they are all in built up areas.
4.4 DIFFUSION TUBE NITROGEN DIOXIDE RESULTS
Annual mean NO2 concentrations, for 2000 and 2001, from all NO2 diffusion tube sites in Northern Ireland, are provided in Appendix 1. (No annual mean is shown where the site was in operation for less than 6 months of the year). Table 4.5 provides a summary of average NO2 concentrations, for 2000 and 2001, at the four site types. The average concentration for each site type is the arithmetic mean of all the individual site annual means.

AEAT/ENV/R/1260 Issue 1
netcen 13
Table 4.5 Average NO2 Concentrations in Northern Ireland Measured by Diffusion Tubes
Site Type Number of sites 2000
Average NO2, 2000 µg m-3
Number of sites 2001
Average NO2, 2001 µg m-3
A (Roadside) 58 26 96 27 B (Intermediate) 25 18 15 16 C (Urban Background)
39 12 39 14
D (Rural Background)
6
9 5 10
The averages in Table 4.5 are based upon all sites in Northern Ireland, whether or not they are part of the NO2 Network. The annual averages were found to be in most cases comparable with the averages reported by the NO2 Network for the Northern Ireland region, which are as follows: 2000: Roadside 29 µg m-3 , Intermediate 19 µg m-3 and Urban Background 13 µg m-3 . 2001: Roadside 27 µg m-3 , Urban Background 14 µg m-3 . During 2000, four sites had annual mean NO2 concentrations greater than the EC Directive limit and AQS objective of 40 µg m-3. These were as follows:
• Roadside (type A), Lisburn Road, Belfast – a main arterial route into the city centre. • An Intermediate (type B) site, Molyneaux Street, central Belfast. This is close to major
routes through the city, and near a motorway interchange. (However, it should be noted that the annual mean was based on only six months of data, January to June 2000).
• Roadside (type A), Dublin Road in Omagh. At this site, traffic on a main road into the town centre queues approaching traffic lights.
• Roadside (type A), Water Street, Newry. This site is on a main road in the city centre, where traffic queues form. Buildings on either side form a “canyon”.
In 2001, the following six sites, all Roadside, exceeded the annual mean limit value of 40 µg m-3.
• Great George’s Street, central Belfast. This is near an exit from the M3 motorway and not far from the Molyneaux Street site mentioned above).
• Creggan Road, Londonderry; near the city centre, on a busy road with a steep incline. • Strand Road, Londonderry; a dual carriageway 300m from the city centre, • Glendermot Road, Londonderry; at a crossroads on a main arterial route into the city • St Patrick’s Terrace, Londonderry; also at a junction on a main arterial route into the city. • Water Street in Newry, which is described above.
These findings indicate that exceedences of the annual mean limit for NO2 may occur not only in large urban centres, but also at roadside locations in smaller towns and cities with frequent heavy or waiting traffic, or street “canyon” effects.
4.5 NITROGEN DIOXIDE TRENDS
Emission inventory data for the UK are available from the National Atmospheric Emissions Inventory (NAEI), on the World Wide Web at www.naei.org.uk. Total estimated UK emissions of NOx have shown a steady, approximately linear decrease between 1990 and 2000, of around 5.4% per year. This is due to reduced emissions from two major sources: power generation, and road vehicles (the latter partly as a result of the introduction of catalytic converters). In greater Belfast, road traffic is the dominant source of NOx, accounting for 60% of the city’s total NOx emissions2; in this respect, Belfast might be expected to show a similar emission trend to the total UK. Hence, ambient NO2 should show some downward trend. 4.5.1 Trends at Automatic Nitrogen Dioxide Sites Figure 4.4 shows how annual mean NO2 concentrations have changed at the automatic sites in Northern Ireland. Only two sites have been in operation long enough to assess trends: the Belfast Centre and Londonderry AUN sites. Regression analysis (Theil’s non-parametric analysis) shows a significant downward trend (at the 95% confidence level) in annual mean NO2 concentration at Belfast Centre, but not at Londonderry.

AEAT/ENV/R/1260 Issue 1
netcen 14
Figure 4.4 Annual Mean NO2 Concentrations at Automatic Monitoring Sites (data capture at least 75%)
4.5.2 Trends at Diffusion Tube Nitrogen Dioxide Sites A substantial proportion (40%) of the NO2 diffusion tube sites operated by District Councils in Northern Ireland are also part of the NO2 Network. One of the objectives of this Network is to investigate long-term trends in concentrations of this pollutant. The Network has been in operation for nine years, thus it is possible to identify trends.
Table 4.6 shows annual mean NO2 concentrations for Northern Ireland, based on data from the NO2 Network. These statistics are based upon the Network sites only, as very few of the non-Network sites had long-term datasets available.
Table 4.6 Average NO2 Concentrations, NO2 Network Diffusion Tube sites in Northern Ireland
Year Average Roadside
µg m-3 Average
Intermediate µg m-3 Average Urban
Background µg m-3 1993 38 24 19 1994 40 25 19 1995 42 24 18 1996 40 21 18 1997 36 20 16 1998 36 20 13 1999 33 21 14 2000 29 19 13 2001 27 - 14 Average concentrations appear to have fallen slightly since the mid 1990s. Regression analysis shows that this downward trend in average NO2 concentration is significant (with 95% confidence limit) for all three site categories.
0
5
10
15
20
25
30
35
40
45
1992 1993 1994 1995 1996 1997 1998 1999 2000 2001
Year
Con
cent
ratio
n, µ
g m
-3
Belfast Centre
Londonderry
Newry -M.Row
Newry - T. Hill

AEAT/ENV/R/1260 Issue 1
netcen 15
5 Sulphur Dioxide
Sulphur dioxide (SO2) is formed during the combustion of fuels containing sulphur. The most significant source of this pollutant is fossil fuelled power generation, although diesel engines and a number of chemical processes also produce SO2. In Northern Ireland, domestic solid fuel and oil burning is a major source of SO2. Sulphur dioxide is a respiratory irritant, and is toxic at high concentrations. It is also damaging to ecosystems and a major precursor in the formation of acid rain. In this report, concentrations of sulphur dioxide are expressed as microgrammes per cubic metre (µg m-3). To convert to parts per billion (ppb) if necessary, the following relationship should be used: 1 ppb = 2.66 µg m-3 for sulphur dioxide at 293K (20°°°°C) and 1013mb.
5.1 MONITORING OF SULPHUR DIOXIDE
Monitoring of SO2 is carried out by three methods: continuous automatic analysers, the non-automatic Net Acidity method (using the 8-port sampler) and diffusion tubes. Automatic analysers (based on the UV Fluorescence method, which is the reference method for the EC 1st Daughter Directive, 1999/30/EC) provide continuous monitoring of SO2, and the data can be compared with air quality limit values and objectives based on short-term and longer averaging periods. Automatic SO2 monitoring sites in Northern Ireland are listed in Table 5.1 and shown in Figure 5.1:
Table 5.1 Automatic SO2 Monitoring Sites
Site Grid Reference Classification Network Belfast Centre (Lombard Street)
J 339744 Urban Centre AUN
Belfast East (Templemore Ave)
J 357 740 Urban Background AUN
Londonderry C 429172 Urban Background AUN Newry, Monaghan Row
J 078 268 Urban Background Newry & Mourne
Newry, Trevor Hill J 088 266 Roadside Newry & Mourne
AEAT/ENV/R/1260 Issue 1
netcen 16
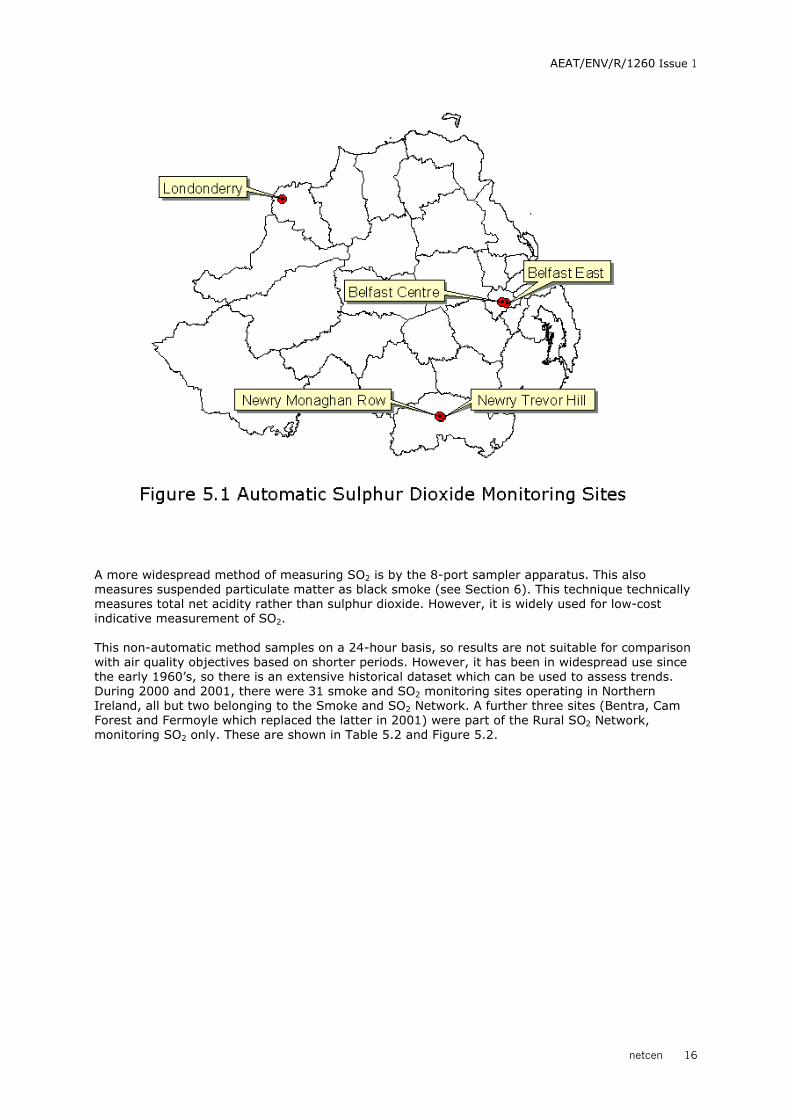
A more widespread method of measuring SO2 is by the 8-port sampler apparatus. This also measures suspended particulate matter as black smoke (see Section 6). This technique technically measures total net acidity rather than sulphur dioxide. However, it is widely used for low-cost indicative measurement of SO2. This non-automatic method samples on a 24-hour basis, so results are not suitable for comparison with air quality objectives based on shorter periods. However, it has been in widespread use since the early 1960’s, so there is an extensive historical dataset which can be used to assess trends. During 2000 and 2001, there were 31 smoke and SO2 monitoring sites operating in Northern Ireland, all but two belonging to the Smoke and SO2 Network. A further three sites (Bentra, Cam Forest and Fermoyle which replaced the latter in 2001) were part of the Rural SO2 Network, monitoring SO2 only. These are shown in Table 5.2 and Figure 5.2.

AEAT/ENV/R/1260 Issue 1
netcen 17
Table 5.2 Non-Automatic Smoke and SO2 Monitoring Sites
Site name Grid Ref. District Council Network ARMAGH 1 H 877 450 Armagh Smoke & SO2 KEADY 1 H 845 341 Armagh Smoke & SO2 BALLYMENA 3 D 103 029 Ballymena Smoke & SO2 BALLYMONEY 4 C 954 259 Ballymoney Smoke & SO2 BELFAST 12 J 324 737 Belfast CC Smoke & SO2 BELFAST 13 J 357 740 Belfast CC Smoke & SO2 BELFAST 33 J 346 755 Belfast CC Smoke & SO2 BELFAST 42 J 322 748 Belfast CC Smoke & SO2 BELFAST 44 J 338 740 Belfast CC Smoke & SO2 BELFAST 45 J 335 723 Belfast CC Smoke & SO2 BELFAST 46 J 803 334 Belfast CC Smoke & SO2 PORTADOWN 4 J 012 538 Craigavon Smoke & SO2 LONDONDERRY 11 C 431 170 Derry CC Smoke & SO2 LONDONDERRY 12 C 438 200 Derry CC Smoke & SO2 LONDONDERRY 14 C 443 174 Derry CC Smoke & SO2 DUNGANNON 1 H 802 629 Dungannon Smoke & SO2 LARNE 3 D 400 029 Larne Smoke & SO2 DUNMURRY 2 J 289 679 Lisburn CC Smoke & SO2 DUNMURRY 3 J 287 875 Lisburn CC Smoke & SO2 LISBURN 3 J 263 636 Lisburn CC Smoke & SO2 TWINBROOK 1 J 281 689 Lisburn CC Smoke & SO2 MAGHERAFELT 1 H 896 901 Magherafelt Smoke & SO2 NEWRY 3 J 078 268 Newry and Mourne Smoke & SO2 NEWTOWNABBEY 1 J 349 824 Newtownabbey Smoke & SO2 NEWTOWNABBEY 2 J 318 825 Newtownabbey Smoke & SO2 NEWTOWNABBEY 3 J 321 851 Newtownabbey Smoke & SO2 BANGOR (CO DOWN) 5 J 497 810 North Down Smoke & SO2 HOLYWOOD 1 J 397 784 North Down Smoke & SO2 STRABANE 2 H 351 972 Strabane Smoke & SO2 DOWNPATRICK J 490 459 Down Local Auth. NEWTOWNARDS J 480 736 Newtownards Local Auth. Bentra J 458 923 Defra Rural SO2 Cam Forest (to 2001) C766 221 Defra Rural SO2 Fermoyle(2001 onwd.) C767 291 Defra Rural SO2 (Rural SO2 sites monitor SO2 only, not smoke.)

AEAT/ENV/R/1260 Issue 1
netcen 18

AEAT/ENV/R/1260 Issue 1
netcen 19
Diffusion tubes are also used to monitor SO2. These passive samplers are similar to those used for NO2 and described in Section 4. However, it should be noted that SO2 diffusion tubes are considered less accurate than NO2 diffusion tubes, and they are considered unsuitable for use for Review and Assessment purposes. Table 5.3 and Figure 5.3 show the SO2 diffusion tube monitoring sites in use during 2000 and 2001. Site details are given in Appendix 1.
Table 5.3 Diffusion Tube SO2 Monitoring Sites
District Council Number of sites
Active, 2000 Number of sites Active, 2001
Carrickfergus 2 2 Coleraine 3 3 Cookstown 2 2 Fermanagh 2 2 Lisburn 13 12 Newtownabbey - 10 (from Dec 2001 only)
AEAT/ENV/R/1260 Issue 1
netcen 20
5.2 LIMIT VALUES AND OBJECTIVES FOR SULPHUR DIOXIDE
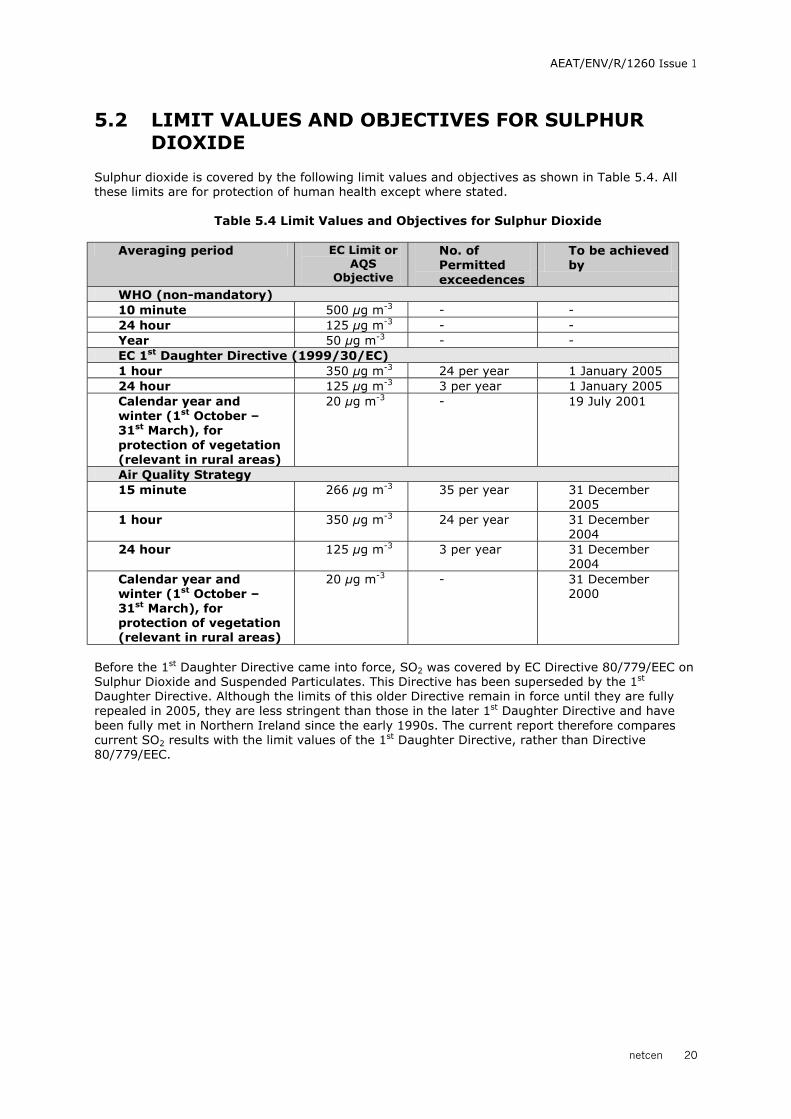
Sulphur dioxide is covered by the following limit values and objectives as shown in Table 5.4. All these limits are for protection of human health except where stated.
Table 5.4 Limit Values and Objectives for Sulphur Dioxide
Averaging period EC Limit or
AQS Objective
No. of Permitted exceedences
To be achieved by
WHO (non-mandatory) 10 minute 500 µg m-3 - - 24 hour 125 µg m-3 - - Year 50 µg m-3 - - EC 1st Daughter Directive (1999/30/EC) 1 hour 350 µg m-3 24 per year 1 January 2005 24 hour 125 µg m-3 3 per year 1 January 2005 Calendar year and winter (1st October – 31st March), for protection of vegetation (relevant in rural areas)
20 µg m-3 - 19 July 2001
Air Quality Strategy 15 minute 266 µg m-3 35 per year 31 December
2005 1 hour 350 µg m-3 24 per year 31 December
2004 24 hour 125 µg m-3 3 per year 31 December
2004 Calendar year and winter (1st October – 31st March), for protection of vegetation (relevant in rural areas)
20 µg m-3 - 31 December 2000
Before the 1st Daughter Directive came into force, SO2 was covered by EC Directive 80/779/EEC on Sulphur Dioxide and Suspended Particulates. This Directive has been superseded by the 1st Daughter Directive. Although the limits of this older Directive remain in force until they are fully repealed in 2005, they are less stringent than those in the later 1st Daughter Directive and have been fully met in Northern Ireland since the early 1990s. The current report therefore compares current SO2 results with the limit values of the 1st Daughter Directive, rather than Directive 80/779/EEC.

AEAT/ENV/R/1260 Issue 1
netcen 21
5.3 AUTOMATIC SULPHUR DIOXIDE RESULTS
Table 5 shows results from the automatic SO2 monitoring sites. Annual data capture is at least 75% except where stated. Figures in bold italics indicate more than the permitted number of exceedences of the relevant limit value.
Table 5.5 SO2 Results from Automatic Monitoring Sites
Max 15-minute mean, µµµµg m-3
No. of 15-minute means > 266 µµµµg m-3
Max 1-hr mean µµµµg m-3
No. of 1-hr means > 350 µµµµg m-3
Max 24-hr mean µµµµg m-3
No. of 24-hour means > 125 µµµµg m-3
Belfast Centre
1992 1256 316 1024 43 306 12
1993 867 436 766 53 354 13
1994 1045 388 934 52 388 8
1995 1317 346 963 54 407 9
1996 944 326 739 45 301 10
1997 606 141 426 8 170 4
1998 471 47 394 3 136 2
1999 378 5 338 0 90 0
2000 436 16 322 0 67 0
2001 301 2 253 0 69 0
Belfast East
1992 1649 1176 1447 179 489 50
1993 1266 824 1149 125 412 35
1994 1069 453 958 59 545 18
1995 1514 579 1402 106 705 14
1996 1176 656 1069 108 362 22
1997 774 500 636 58 245 20
1998 833 199 636 19 218 9
1999 601 98 487 5 152 5
2000 479 38 466 2 112 0
2001 450 139 399 13 226 5
Londonderry
1997 a 197 0 149 0 51 0
1998 1088 31 734 3 130 1
1999 258 0 218 0 45 0
2000 649 19 383 1 74 0
2001 197 0 136 0 43 0
Newry, Monaghan Row *
2001 505 1 138 0 37 0
Newry, Trevor Hill *
2001 128 0 74 0 29 0 a) Limited data capture: Londonderry 1997 (26%) * Data from these two Newry sites are awaiting full ratification. In most cases, the requirements of the 1st Daughter Directive and the objectives of the Air Quality Strategy are met at these sites. However, at Belfast East the objective for the 15-minute average is still consistently exceeded more than the permitted 35 times per year. Also, in 2001, the 24-hour limit value was exceeded more than the permitted three times. It would appear that the area

AEAT/ENV/R/1260 Issue 1
netcen 22
in the vicinity of this site (a residential suburb where domestic solid fuel use is prevalent) is likely to have difficulty in meeting the AQS objectives for sulphur dioxide. The same is likely to be true of similar locations.
5.4 NON-AUTOMATIC SULPHUR DIOXIDE RESULTS
A summary of results from all Smoke and SO2 Network sites in Northern Ireland is provided in Appendix 2, for years 2000 and 2001. Relatively high concentrations of SO2 have been measured in Northern Ireland, particularly Belfast, for many years. The limited availability of natural gas in previous years has led to greater domestic use of solid fuels and oil. This has led to higher concentrations of pollutants such as SO2, particularly in residential areas. Data from 8-port samplers (i.e. daily 24-hour averages) cannot be directly compared with air quality limits based on shorter averaging periods. Nor is it relevant to compare data from urban sites with the annual and winter mean limit values set for the protection of ecosystems. However, both the EC 1st Daughter Directive, and the Air Quality Strategy, set an objective of 125 µg m-3 for the 24-hour mean, not to be exceeded more than 3 times per calendar year. In 2000, the overall average SO2 concentration for all Smoke and SO2 sites in Northern Ireland was 27 µg m-3; considerably higher than the annual mean of 15 µg m-3 obtained for the whole UK. Only one Smoke and SO2 site in Northern Ireland recorded more than three days when the 24-hour average for SO2 was greater than the limit of 125 µg m-3: DUNMURRY 2. However, DUNMURRY 2 was suspected to be directly affected by emissions from a nearby boiler chimney, and has since been replaced by DUNMURRY 3. The annual mean SO2 concentration at DUNMURRY 2 was unusually high (82µg m-3) for the same reason. At other sites, annual mean SO2 concentrations ranged from 8µg m-3 in Portadown, to 42µg m-3 at BELFAST 33, a site in an industrial area of Belfast. In 2001, the overall annual mean SO2 for all sites in Northern Ireland was 20 µg m-3. This value is lower than the previous year but still considerably higher than the annual mean for the whole UK, which was again 15 µg m-3. Three Smoke and SO2 sites in Northern Ireland exceeded the 24-hour limit value of 125 µg m-3 on more than three days; BELFAST 13, BELFAST 33 and BELFAST 42. These exceedences related to episodes of high SO2 during January and February 2001. Annual mean SO2 concentrations for 2001 ranged from 3µg m-3 at the small town of Keady near Armagh, to 43 µgm-3 at BELFAST 33. Annual mean SO2 concentrations at the two non-network sites, Downpatrick and Newtownards, were as follows: Downpatrick, 10.7 µg m-3 in both 2000 and 2001: Newtownards, 8.6 µg m-3 in 2000. Annual and winter mean sulphur dioxide concentrations at the three Rural SO2 Network sites (Bentra, Cam Forest and Fermoyle) were less than 5 µg m-3 : well within the limit of 20 µg m-3 set for protection of vegetation in rural areas.
5.5 DIFFUSION TUBE SULPHUR DIOXIDE RESULTS
As stated above, SO2 diffusion tubes produce data of limited accuracy and are considered unsuitable for use for Review and Assessment purposes. However, some limited SO2 diffusion tube data are available for years 2000–01. Where annual means are available, these are shown in Table 5.6. Annual mean SO2 concentrations, as measured using diffusion tubes, ranged from 2 µg m-3 to 15 µg m-3. These values appear typically lower than those measured using other techniques.

AEAT/ENV/R/1260 Issue 1
netcen 23
Table 5.6 Annual Mean Sulphur Dioxide as Measured at Diffusion Tube Sites Site District Council Annual Mean
2000 µg m-3
Annual Mean 2001 µg m-3
Town Hall, Carrickfergus Carrickfergus 6.6 nm Lough Road, Loughmourne Carrickfergus 2.3 nm 30 Daneshill, Coleraine Coleraine nm 9.0 11 Laurel Avenue, Coleraine Coleraine nm 5.5 6/8 Ganimore Avenue, Portrush
Coleraine nm 2.9
Queens Avenue, Cookstown Cookstown nm 15
Greenvale Drive, Cookstown Cookstown nm 14.7
Everglades, Tempo Road, Enniskillen
Fermanagh 2.5 2.1
Rossole Park, Enniskillen Fermanagh 3.1 3.4 nm = not measured.
5.6 SULPHUR DIOXIDE TRENDS
For reasons outlined in Sections 1.1 and 5.4, widespread reliance on solid fuels and oil for domestic heating has continued throughout the 1970s, 1980s and 1990s. Domestic combustion accounts for an estimated 28% of total annual SO2
emission in the Belfast area2, compared with 4% of total annual SO2
emission in the UK as a whole. Sulphur dioxide emissions and source distribution have therefore been different in Northern Ireland than in other parts of the UK for many years, and it cannot be assumed that UK trends in either emissions or ambient concentrations are necessarily representative of Northern Ireland. However, UK emission data from the NAEI shows two interesting features: (i) a decrease of almost 70% between 1990 and 2000, and (ii) a levelling-off of the downward trend in the most recent years 1999 and 2000.
5.6.1 Trends at Automatic Sulphur Dioxide Sites
Trends in SO2 concentration, as monitored at the automatic sites, are illustrated by Figure 5.4. Regression analysis (Theil’s non-parametric regression analysis) identified a significant downward trend (with 95% confidence limit) in the annual mean SO2 concentrations at Belfast Centre and Belfast East, though not at Londonderry. It is interesting to note the apparent levelling-off of the downward trend in 2000-2001: it is possible that this may reflect a levelling-off in total emissions, similar to that evident in the UK data.
AEAT/ENV/R/1260 Issue 1
netcen 24
Figure 5.4 Annual Mean SO2 concentration at Automatic Sites (data capture at least 75%)
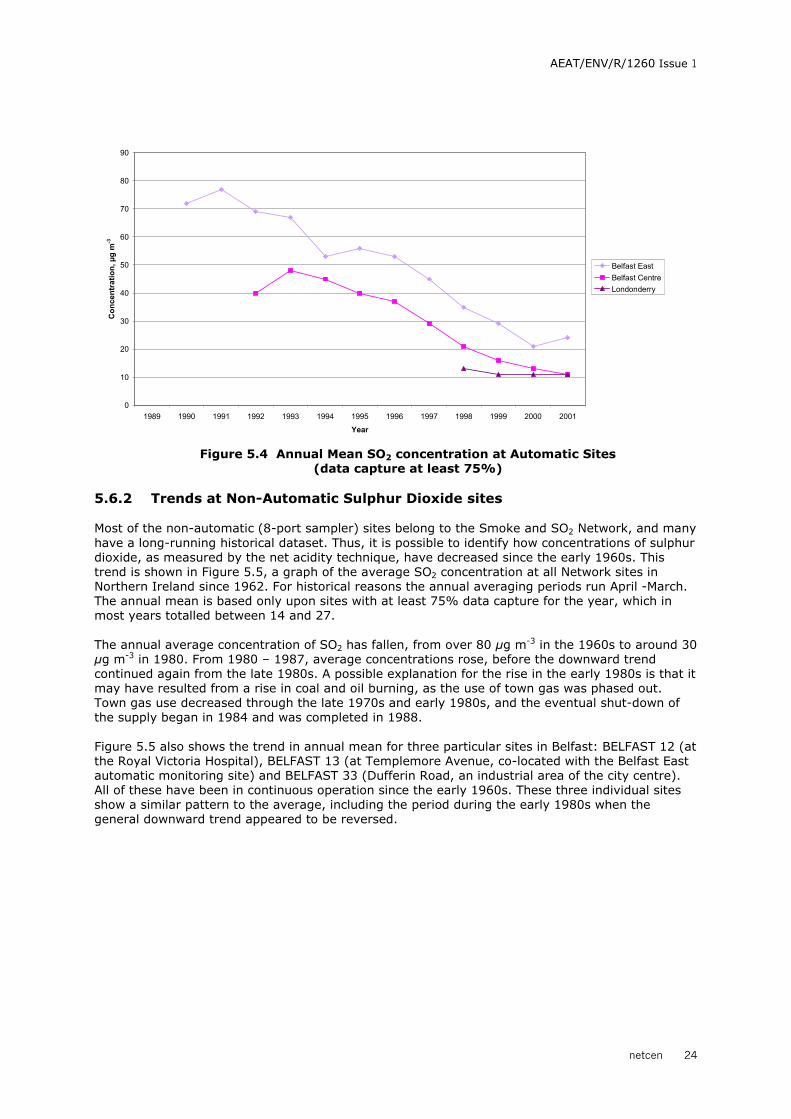
5.6.2 Trends at Non-Automatic Sulphur Dioxide sites
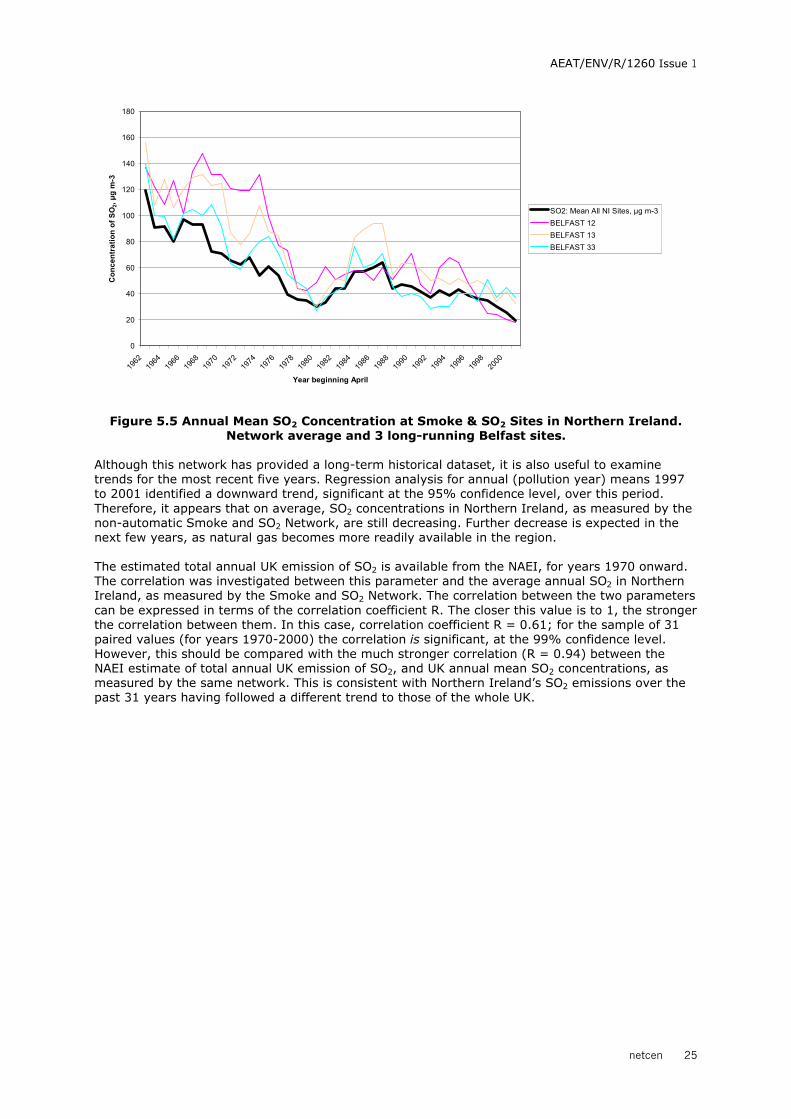
Most of the non-automatic (8-port sampler) sites belong to the Smoke and SO2 Network, and many have a long-running historical dataset. Thus, it is possible to identify how concentrations of sulphur dioxide, as measured by the net acidity technique, have decreased since the early 1960s. This trend is shown in Figure 5.5, a graph of the average SO2 concentration at all Network sites in Northern Ireland since 1962. For historical reasons the annual averaging periods run April -March. The annual mean is based only upon sites with at least 75% data capture for the year, which in most years totalled between 14 and 27. The annual average concentration of SO2 has fallen, from over 80 µg m-3 in the 1960s to around 30 µg m-3 in 1980. From 1980 – 1987, average concentrations rose, before the downward trend continued again from the late 1980s. A possible explanation for the rise in the early 1980s is that it may have resulted from a rise in coal and oil burning, as the use of town gas was phased out. Town gas use decreased through the late 1970s and early 1980s, and the eventual shut-down of the supply began in 1984 and was completed in 1988. Figure 5.5 also shows the trend in annual mean for three particular sites in Belfast: BELFAST 12 (at the Royal Victoria Hospital), BELFAST 13 (at Templemore Avenue, co-located with the Belfast East automatic monitoring site) and BELFAST 33 (Dufferin Road, an industrial area of the city centre). All of these have been in continuous operation since the early 1960s. These three individual sites show a similar pattern to the average, including the period during the early 1980s when the general downward trend appeared to be reversed.
0
10
20
30
40
50
60
70
80
90
1989 1990 1991 1992 1993 1994 1995 1996 1997 1998 1999 2000 2001Year
Con
cent
ratio
n, µ
g m
-3
Belfast EastBelfast CentreLondonderry
AEAT/ENV/R/1260 Issue 1
netcen 25
Figure 5.5 Annual Mean SO2 Concentration at Smoke & SO2 Sites in Northern Ireland.
Network average and 3 long-running Belfast sites.
Although this network has provided a long-term historical dataset, it is also useful to examine trends for the most recent five years. Regression analysis for annual (pollution year) means 1997 to 2001 identified a downward trend, significant at the 95% confidence level, over this period. Therefore, it appears that on average, SO2 concentrations in Northern Ireland, as measured by the non-automatic Smoke and SO2 Network, are still decreasing. Further decrease is expected in the next few years, as natural gas becomes more readily available in the region. The estimated total annual UK emission of SO2 is available from the NAEI, for years 1970 onward. The correlation was investigated between this parameter and the average annual SO2 in Northern Ireland, as measured by the Smoke and SO2 Network. The correlation between the two parameters can be expressed in terms of the correlation coefficient R. The closer this value is to 1, the stronger the correlation between them. In this case, correlation coefficient R = 0.61; for the sample of 31 paired values (for years 1970-2000) the correlation is significant, at the 99% confidence level. However, this should be compared with the much stronger correlation (R = 0.94) between the NAEI estimate of total annual UK emission of SO2, and UK annual mean SO2 concentrations, as measured by the same network. This is consistent with Northern Ireland’s SO2 emissions over the past 31 years having followed a different trend to those of the whole UK.
0
20
40
60
80
100
120
140
160
180
1962
1964
1966
1968
1970
1972
1974
1976
1978
1980
1982
1984
1986
1988
1990
1992
1994
1996
1998
2000
Year beginning April
Con
cent
ratio
n of
SO
2, µg
m-3
SO2: Mean All NI Sites, µg m-3BELFAST 12BELFAST 13BELFAST 33

AEAT/ENV/R/1260 Issue 1
netcen 26
6 Particulate Matter
Ambient suspended particulate matter consists of a “primary” component (ie. emitted directly into the atmosphere and therefore usually local to source), and a “secondary” component (formed in the atmosphere by chemical reactions, and therefore often a long-range pollutant). The primary component mostly consists of combustion related particles (emitted from sources such as vehicles, domestic and industrial coal and fuel oil burning), but includes other material such as entrained dust, and salt from sea spray. The secondary material consists mostly of sulphate and nitrate particles formed by oxidation of sulphur dioxide and oxides of nitrogen, and ammonium salts. Ambient particulate matter, when inhaled, can affect human health, particularly in sensitive individuals. The two particulate metrics most widely used in the UK are PM10 and Black Smoke. The term “PM10” refers to the mass fraction of particles collected by a sampler with a 50% cut-off at aerodynamic diameter 10 µm. PM10 is measured by automatic techniques, such as the Tapered Element Oscillating Microbalance (TEOM), gravimetric samplers and beta attenuation monitors. The term “black smoke” refers to any fine dark suspended particulate which can be measured by the smoke stain technique, not necessarily particulate resulting from combustion sources. Black smoke is defined by the ISO standard for the method (ISO 9835) as “strongly light absorbing particulate material suspended in the ambient atmosphere.... The major contributor to black smoke is soot particles; i.e. particles containing carbon in its elemental form”. Concentrations of particulate matter are expressed as microgrammes per cubic metre (µg m-3).
6.1 MONITORING OF PARTICULATE MATTER
6.1.1 PM10 Monitoring Particulate matter as PM10 is currently monitored at six sites in Northern Ireland using the techniques shown in Table 6.1 and Figure 6.1. The AUN sites at Belfast Centre and Londonderry, also the two Newry sites, use the Tapered Element Oscillating Microbalance (TEOM). A Beta Attenuation Monitor is located at Clara Street. Two gravimetric PM10 monitors (the KFG and Partisol) are also in use at Belfast Centre, as part of an investigation comparing PM10 monitoring techniques: however no ratified data are yet available from these. The reference method for PM10 is the gravimetric technique, in which the ambient concentration of PM10 is calculated from the mass of particulate matter collected on a filter. The more widely-used TEOM has been found to underestimate relative to this reference method. Therefore, by convention PM10 concentrations measured using the TEOM (or using a Beta Attenuation Monitor, if it has a heated inlet) must be multiplied by a factor of 1.3 to convert to gravimetric equivalent, before comparison with EC Directive or AQS limit values. All TEOM measurements in this report have been converted to gravimetric equivalent.
Table 6.1 Automatic PM10 Monitoring Sites, 2000 and 2001
Site Grid Ref. Classification Technique Network Belfast Centre (Lombard Street)
J 339 744 Urban Centre TEOM, KFG Gravimetric, Partisol Gravimetric
AUN
Belfast Clara Street
J 360 734 Suburban Beta Attenuation Monitor
AUN
Londonderry C 429 172 Urban Background
TEOM AUN
Newry, Monaghan Row
J 078 268 Urban Background
TEOM Newry & Mourne
Newry, Trevor Hill J 088 266 Roadside TEOM Newry & Mourne
Lough Navar H 065 545 Rural TEOM Rural

AEAT/ENV/R/1260 Issue 1
netcen 27
In earlier years, PM10 monitoring has also been carried out at the Shambles Market, Armagh (1999) and Dungannon (1998) using a TEOM housed in a mobile monitoring station.
6.1.2 Smoke Monitoring
The principle of the smoke stain method involves drawing air at a constant, measured flowrate through a paper filter. Suspended particulate matter is collected on the filter, forming a dark stain. An instrument known as a reflectometer is used to measure the darkness of the stain, and this reflectometer measurement is then used to calculate the concentration of particulate matter in the sampled air from a standard calibration. The sampler inlet funnel has a 50% cut-off at around 4.5 µm; thus black smoke can be considered an approximation to dark PM5. During 2000-2001, there were 31 sites measuring particulate as black smoke, 29 of which were part of the Smoke and SO2 Network. Black smoke is monitored using the same 8-port sampler apparatus as non-automatic SO2: site details are therefore identical to those presented in Table 5.2 and Figure 5.2 (for SO2) in Section 5.1. Many of these smoke monitoring sites have been in operation since the 1960s or 1970s: hence there is an extensive historical dataset for smoke.

AEAT/ENV/R/1260 Issue 1
netcen 28
6.2 LIMIT VALUES AND OBJECTIVES FOR SUSPENDED PARTICULATE MATTER
6.2.1 Limit Values and Objectives for PM10
Particulate matter, when measured as PM10, is covered by the EC 1st Daughter Directive (1999/30/EC), which contains a two-stage set of limit values. The UK Air Quality Strategy sets objectives for PM10 that are almost identical to the first stage limit values set by the EC Daughter Directive. These are outlined in Table 6.2.
Table 6.2 Limit Values and Objectives for Particulate Matter as PM10
Averaging period EC Limit
or AQS Objective
Number of Permitted exceedences
To be achieved by
EC 1st Daughter Directive (1999/30/EC) Stage 1 24 hour 50 µg m-3 35 per year 1st January 2005 Annual Mean 40 µg m-3 - 1st January 2005 EC 1st Daughter Directive (1999/30/EC) Stage 2 (to be confirmed) 24 hour 50 µg m-3 7 per year 1st January 2010 Annual Mean 20 µg m-3 - 1st January 2010 Air Quality Strategy (as currently adopted in Northern Ireland) 24 hour 50 µg m-3 35 per year 31st December 2004 Annual Mean 40 µg m-3 - 31st December 2004 All limit values refer to gravimetric equivalent measurements.
6.2.2 Limits and Guide Values for Black Smoke
Before the 1st Daughter Directive and Air Quality Strategy set objectives for PM10, smoke was covered by EC Directive 80/779/EEC on sulphur dioxide and suspended particulates. This Directive has been superseded by the 1st Daughter Directive; however, the limits relating to smoke remain in force until 2005, and the new Daughter Directive deals only with PM10. The current report therefore compares results with the smoke limits and guidelines of Directive 80/779/EEC. The limit values are presented in Table 6.3 below, along with the non-mandatory guide values.
Table 6.3 EC Directive 80/779/EEC Limit Values For Smoke (To be fully repealed in 2005)
Reference Period Smoke µg m-3 BS
Limit Values for Sulphur Dioxide
YEAR (median of daily values)
68 if smoke ≤ 34:120 if smoke > 34: 80
WINTER (median of daily values October-March)
111 if smoke ≤ 51: 180 if smoke > 51: 130
YEAR (Peak) (98th Percentile of daily values)
213 if smoke ≤ 128: 350 if smoke > 128: 250
Guide Values (advisory only)
Reference Period Smoke µg m-3 BS
Guide Values for Sulphur Dioxide
YEAR (arithmetic mean of daily values)
34 to 51 40 to 60
24 HOURS (daily mean value)
85 to 128 100 to 150
NOTE: The Limit and Guide Values given above for smoke according to the BS calibration are calculated from the original OECD calibration figures given in the EC Directive using the relationship: BS concentration = OECD concentration multiplied by 0.85

AEAT/ENV/R/1260 Issue 1
netcen 29
6.3 PARTICULATE MATTER RESULTS
6.3.1 PM10 Results Table 6.4 presents data from automatic PM10 monitoring sites. TEOM data have been converted to gravimetric equivalent by multiplying by the appropriate factor of 1.3. Figures in bold italics indicate more than the permitted number of exceedences of the relevant limit or objective.
Table 6.4 Results from Automatic PM10 Monitoring Sites
Calendar Year
Annual Mean µg m-3
Max Daily Mean µg m-3
Daily means > 50 µg m-3
Belfast Centre (TEOM, converted to gravimetric equivalent)
1992 35 322 44 1993 41 156 86 1994 34 248 38 1995 32 190 35 1996 31 145 44 1997 32 110 41 1998 27 87 20 1999 26 84 15 2000 25 69 8 2001 25 108 15
Belfast Clara Street (Beta Attenuation Monitor)
1999 22 71 12 2000 16 69 2 2001 19 128 14
Londonderry (TEOM, converted to gravimetric equivalent)
1997 a 28 90 13 1998 26 157 18 1999 25 111 11 2000 20 84 6 2001 23 130 15
Lough Navar (TEOM, converted to gravimetric equivalent)
1996 b 13 27 0 1997 13 38 0 1998 12 44 0 1999 12 38 0 2000 12 35 0 2001 13 41 0
Newry, Monaghan Row (TEOM, converted to gravimetric equivalent)
1998 24 90 9 1999 23 76 8 2000 22 114 5 2001 20 68 4
Newry , Trevor Hill (TEOM, converted to gravimetric equivalent)
2001 34 86 26 Armagh (TEOM, converted to gravimetric equivalent)
1999 25 64 8 Dungannon (TEOM, converted to gravimetric equivalent)
1998 21 83 29 a) Limited data capture: Londonderry 1997(60%) b) Limited data capture: Lough Navar 1996 (22%)

AEAT/ENV/R/1260 Issue 1
netcen 30
All the sites for which data are available currently meet the EC Directive Stage 1 limits and AQS Objectives. Only one site, Lough Navar, currently meets the EC Directive Stage 2 limit values: however, if confirmed, these need not be met until January 2010. 6.3.2 Black Smoke Results A summary of smoke data for calendar years 2000 and 2001 for all Smoke and SO2 Network sites in Northern Ireland is shown in Appendix 2. Smoke in 2000: Annual mean smoke concentrations in Northern Ireland for calendar year 2000 ranged from 5µg m-3 to 17µg m-3 with one exception. An unusually high concentration of 27 µg m-3 was measured at STRABANE 2. This was investigated, and appears to be genuine; the site is located on a housing estate with considerable domestic coal and oil burning, and local topography may impede dispersion. The average for Northern Ireland was 11 µg m-3, compared with the average for the UK as a whole of 7.4 µg m-3. Maximum daily smoke concentrations at the majority of sites were less than 100 µg m-3. Smoke in 2001: Smoke concentrations in Northern Ireland were similar to those measured in the previous year, with all except one annual mean in the range of 5 µg m-3 to 17 µg m-3 . Again, the exception was STRABANE 2, with an annual mean smoke concentration of 34 µgm-3, substantially higher than at any other site. The average for all Network sites in Northern Ireland was again 11 µg m-3; slightly higher than the UK average of 8.2 µg m-3. Maximum daily smoke concentrations exceeded 100 µg m-3 at a large proportion of sites in 2001, with one site (BALLYMENA 3) recording a maximum daily value of 303 µg m-3. However, such high values only occur during short-term “episodes” of particularly high pollution and are rare: the 98th percentile of daily values was below 100 µg m-3 at all but one site. Two such episodes occurred in Northern Ireland during 2001: one during 18th-19th January 2001 and (in some areas) another around 11th-16th December 2001. The former also affected northern parts of England, the latter also affected Scotland. The two non-network sites, Downpatrick and Newtownards, recorded annual mean smoke concentrations of 4.5 µg m-3 and 10.8 µg m-3 respectively in 2001. Smoke concentrations, historically, have been higher in Northern Ireland than in most other parts of England, Wales and Scotland. This is because the limited availability of natural gas for domestic heating has necessitated greater use of coal and oil for this purpose. All the sites in Northern Ireland meet the limit values of 80/779/EEC for smoke. The last occasion on which any of the limit values for smoke were exceeded in Northern Ireland was in 1990. During 2000 and 2001, the annual arithmetic mean was well below the lower guide value of 34 µg m-3 at all sites in Northern Ireland with the exception of STRABANE 2. However, the maximum daily mean exceeded both the upper and lower 24-hour guide values at many sites in the UK, including several in Northern Ireland.
6.4 PARTICULATE MATTER TRENDS
In the Belfast area, the contribution to primary PM10 emissions from domestic contribution is around 26%2, a substantially higher proportion than in most UK cities. Therefore, trends in PM10 and black smoke emissions for Northern Ireland will not necessarily be the same as for other regions. However, NAEI data show a substantial decrease (of around 45%) in total UK PM10 emissions between 1990 and 2000, so it is not unreasonable to expect a decreasing trend for Northern Ireland.
AEAT/ENV/R/1260 Issue 1
netcen 31
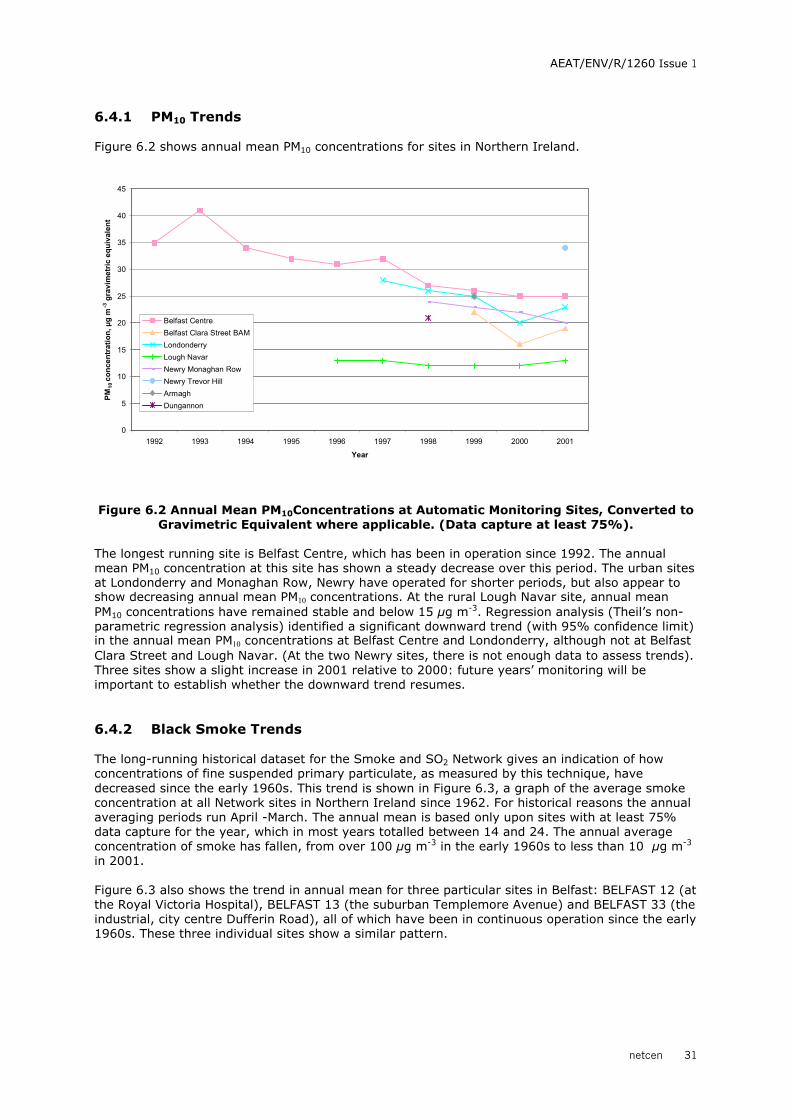
6.4.1 PM10 Trends Figure 6.2 shows annual mean PM10 concentrations for sites in Northern Ireland.
Figure 6.2 Annual Mean PM10Concentrations at Automatic Monitoring Sites, Converted to
Gravimetric Equivalent where applicable. (Data capture at least 75%).
The longest running site is Belfast Centre, which has been in operation since 1992. The annual mean PM10 concentration at this site has shown a steady decrease over this period. The urban sites at Londonderry and Monaghan Row, Newry have operated for shorter periods, but also appear to show decreasing annual mean PM10 concentrations. At the rural Lough Navar site, annual mean PM10 concentrations have remained stable and below 15 µg m-3. Regression analysis (Theil’s non-parametric regression analysis) identified a significant downward trend (with 95% confidence limit) in the annual mean PM10 concentrations at Belfast Centre and Londonderry, although not at Belfast Clara Street and Lough Navar. (At the two Newry sites, there is not enough data to assess trends). Three sites show a slight increase in 2001 relative to 2000: future years’ monitoring will be important to establish whether the downward trend resumes. 6.4.2 Black Smoke Trends The long-running historical dataset for the Smoke and SO2 Network gives an indication of how concentrations of fine suspended primary particulate, as measured by this technique, have decreased since the early 1960s. This trend is shown in Figure 6.3, a graph of the average smoke concentration at all Network sites in Northern Ireland since 1962. For historical reasons the annual averaging periods run April -March. The annual mean is based only upon sites with at least 75% data capture for the year, which in most years totalled between 14 and 24. The annual average concentration of smoke has fallen, from over 100 µg m-3 in the early 1960s to less than 10 µg m-3 in 2001. Figure 6.3 also shows the trend in annual mean for three particular sites in Belfast: BELFAST 12 (at the Royal Victoria Hospital), BELFAST 13 (the suburban Templemore Avenue) and BELFAST 33 (the industrial, city centre Dufferin Road), all of which have been in continuous operation since the early 1960s. These three individual sites show a similar pattern.
0
5
10
15
20
25
30
35
40
45
1992 1993 1994 1995 1996 1997 1998 1999 2000 2001
Year
PM10
con
cent
ratio
n, µ
g m
-3 g
ravi
met
ric e
quiv
alen
t
Belfast CentreBelfast Clara Street BAMLondonderryLough NavarNewry Monaghan RowNewry Trevor HillArmaghDungannon

AEAT/ENV/R/1260 Issue 1
netcen 32
Figure 6.3 Trends in Black Smoke Concentration, Northern Ireland. Network average and 3 long-running Belfast sites.
As well as the long-term trends it is also interesting to investigate the trend over the past five years. Regression analysis of the average annual mean smoke concentration based on all sites in Northern Ireland shows that there is a small downward trend for the period 1997 – 2001, which is not significant at the 95% confidence limit. However, further decrease in smoke concentration in Northern Ireland is expected in the next few years, as natural gas becomes more readily available in the region, and domestic solid fuel use declines. Estimated annual total UK emission data for black smoke are available from the NAEI, for years 1970 to 2000. The correlation was investigated between the total annual UK emission of black smoke, and the average annual smoke concentration in Northern Ireland, as measured by the Smoke and SO2 Network. The correlation between the two parameters can be expressed in terms of the correlation coefficient R; the closer this value is to 1, the stronger the correlation between them. In this case, the correlation was found to be strong: R = 0.93. For the sample of 31 paired values (for years 1970-2000) this is significant at the 99% confidence level. The correlation is almost as strong as that found between total annual UK emission of smoke, and the average UK annual smoke concentration as measured by the Smoke and SO2 Network (R = 0.96). This is consistent with black smoke emission trends for Northern Ireland over the past 31 years being similar to those calculated for the whole UK. This is in contrast to the findings for SO2 (Section 5.6.2).
0
50
100
150
200
250
1962
1964
1966
1968
1970
1972
1974
1976
1978
1980
1982
1984
1986
1988
1990
1992
1994
1996
1998
2000
Year Beginning April
Smok
e C
once
ntra
tion,
µg
m-3
BS
Smoke: Mean All NI Sites, µg m-3BELFAST 12 BELFAST 13 BELFAST 33

AEAT/ENV/R/1260 Issue 1
netcen 33
7 Ozone
Ozone (O3) is a form of oxygen, with three atoms per molecule (unlike normal oxygen, O2, which has two). In the upper atmosphere it is beneficial, forming the “ozone layer” which protects living things from harmful UV radiation. However, at ground level it is a pollutant, having an irritant effect on the respiratory system.
Ground level ozone is not emitted directly from source, but formed by chemical reactions involving the action of sunlight, where NO2 and volatile organic compounds (VOCs) are present. These reactions may happen over several hours, so the highest ozone concentrations may occur a long distance downwind of the sources of the primary pollutants. Also, O3 may persist for several days. Ozone pollution can therefore be a transboundary problem, and difficult to control by local action.
O3 concentrations are usually therefore lowest in towns, and highest in the rural areas downwind of them. Because ozone formation requires sunlight, concentrations are highest in the summer, and during daylight hours.
In this report, concentrations of ozone are expressed as microgrammes per cubic metre (µg m-3). To convert to parts per billion (ppb) if necessary, the following relationship should be used:
1 ppb = 2.0 µg m-3 for ozone at 293K (20°°°°C) and 1013mb.
7.1 MONITORING OF OZONE
Monitoring of O3 in Northern Ireland is carried out largely using continuous automatic analysers. Diffusion tubes are also available for this pollutant, but are used routinely at only one site, which is operated by Fermanagh District Council. Monitoring of ozone is carried out at the sites shown in Table 7.1 below, and in Figure 7.1.
Table 7.1 Automatic O3 Monitoring Sites
Site Method Grid Ref. Classification Network Belfast Centre Automatic J 339 744 Urban Centre AUN Londonderry Automatic C 429 172 Urban Background AUN Lough Navar Automatic H 065 545 Rural Rural Fermanagh Diff. tube H 232 429 Urban Background District
Council

AEAT/ENV/R/1260 Issue 1
netcen 34
7.2 LIMIT VALUES AND OBJECTIVES FOR OZONE
Ozone is covered by the target values and objectives in Table 7.2. EC Directive 92/72/EC on air pollution by ozone will be superseded by a third Daughter Directive, 2002/3/EC. This Directive, which sets “target values” rather than limits, has not yet been transposed into Northern Ireland’s legislation. However, as this transposition is scheduled for 2003, this report compares ozone measurements with the 3rd Daughter Directive rather than the older Directive. The AQS objective is more stringent than the EC target value for protection of human health.
Table 7.2 Target Values and Objectives for Ozone
Averaging period Target or
Objective Number of Permitted exceedences
To be achieved by
WHO (non-mandatory guide) Day O3 concentrations not to exceed 120 µg m-3 for more than
eight hours per day. EC Ozone Directive (2002/3/EC) Max. daily 8-hour mean. Compliance assessment to be based on the average number of days exceedence over 3 consecutive years.
120 µg m-3 25 days per calendar year
3-year period beginning 2010.
AOT40a, calculated from 1h values May- July. For protection of vegetation.
18,000 µg m-3 h
- Averaged over 5 years, beginning 2010
Air Quality Strategy b Max. daily running 8-hour mean
100 µg m-3 10 days per year
31 December 2005
a) AOT 40 is the sum of the differences between hourly concentrations greater than 80 µg m-3 (=40ppb) and 80 µg m-3, over a given period using only the 1-hour averages measured between 0800 and 2000.
b) Not included in the Air Quality Regulations.

AEAT/ENV/R/1260 Issue 1
netcen 35
7.3 OZONE RESULTS
Table 7.3 shows the annual maximum daily 8-hour running mean ozone concentration for each site, and also the number of days per year on which this parameter exceeded 100 µg m-3. Years in which the AQS objective was exceeded on more than 10 days are highlighted in bold italics. Annual mean ozone concentrations are also included in Table 7.3: although no limit values apply to this statistic, the annual mean may show long-term trends more clearly than short-term statistics. Annual data capture is at least 75% except where indicated.
Table 7.3 O3 Results from Automatic Monitoring Sites
Calendar
Year Max Daily 8 Hour Mean µg m-3
Days with max. daily 8hr mean > 100 µg m-3
Annual Mean µg m-3
Belfast Centre
1992 108 2 36 1993 88 0 32
1994 106 2 36 1995 136 5 38 1996 130 5 34 1997 124 6 34 1998 112 3 42 1999 126 7 44 2000 130 2 42 2001 130 2 38
Londonderry
1997 a 152 6 44 1998 108 2 52 1999 154 4 52 2000 120 11 54 2001 104 2 46
Lough Navar
1987 b 156 8 44 1988 144 11 50 1989 196 15 46 1990 170 21 52 1991 158 14 46 1992 160 19 52 1993 112 5 48 1994 132 7 52 1995 148 20 48 1996 118 6 46 1997 140 5 42 1998 112 3 46 1999 118 6 50 2000 124 7 48 2001 130 9 46
a) Limited data capture: Londonderry 1997 (59%) b) Limited data capture: Lough Navar 1987 (66%)

AEAT/ENV/R/1260 Issue 1
netcen 36
The 2001 annual mean ozone concentration at the Fermanagh diffusion tube site was 83 µg m-3. This is very high compared with the automatic analyser results. Table 7.3 shows that:
• In earlier years, peak concentrations of ozone were typically higher at the rural Lough Navar site than at the two urban sites. However, since the mid 1990s all three sites have had similar maximum daily 8-hour running mean.
• In recent years, the AQS objective for ozone has been met at most sites. The exceptions are Lough Navar, 1995 and Londonderry, 2000.
Ozone data from the rural Lough Navar site, for the five years 1997 to 2001, was compared with the EC 3rd Daughter Directive target value for protection of vegetation (based on the AOT40 statistic). This site currently meets the target value.
7.4 OZONE TRENDS
Figure 7.2 shows a timeseries plot of the annual maximum daily 8-hour running mean for ozone. There appear to be no clear trends, although at Lough Navar this statistic appears slightly lower in recent years than in the late 1980s and early 1990s. If ozone concentrations remain at their current levels, occasional exceedences of the AQS objective may continue to occur at rural locations.
Figure 7.2 Maximum Daily 8-hour Running Mean Ozone Concentration, µg m-3
Trends are sometimes more clearly identifiable in statistics based on longer sampling periods, such as the annual mean. Figure 7.3 shows a similar plot for the annual mean. Regression analysis (Theil’s non-parametric analysis) of the annual mean showed no statistically significant trends in the case of Londonderry or Lough Navar. However, in the case of Belfast Centre there was a positive trend in the annual mean ozone concentration from 1992 to 2001, significant at the 95% confidence level. Average ozone levels at Belfast Centre therefore appear to be increasing. However, it is possible that this is caused by decreasing concentrations of other pollutants (such as oxides of nitrogen), which “scavenge” ozone from the air, keeping levels low in urban areas.
0
50
100
150
200
250
1987 1988 1989 1990 1991 1992 1993 1994 1995 1996 1997 1998 1999 2000 2001Year
Con
cent
ratio
n, µ
g m
-3
Belfast CentreLondonderryLough Navar

AEAT/ENV/R/1260 Issue 1
netcen 37
Figure 7.3 Annual Mean Ozone Concentrations (data capture at least 75%)
0
10
20
30
40
50
60
1987 1988 1989 1990 1991 1992 1993 1994 1995 1996 1997 1998 1999 2000 2001Year
Con
cent
ratio
n, µ
g m
-3
Belfast CentreLondonderryLough Navar

AEAT/ENV/R/1260 Issue 1
netcen 38
8 Hydrocarbons
There are many hydrocarbon compounds which have the potential to be pollutants when released into the atmosphere. Some occur naturally, others are man-made. (i) Benzene and 1,3-butadiene A range of hydrocarbons are found in vehicle fuel, and occur in vehicle emissions. In most urban areas, vehicle emissions constitute a major source of hydrocarbons, including benzene and 1,3-butadiene. Also, there is the potential that they may be released to the air from facilities where fuels are stored or handled. Benzene is of most concern, as it is a known human carcinogen; long-term exposure can cause leukaemia. It is found in petrol and other liquid fuels, in small concentrations. In urban areas, the major source is vehicle emissions. 1,3-butadiene is also found in vehicle emissions: although not actually present in petrol or diesel, it is formed as these fuels undergo combustion. 1,3-butadiene is a suspected human carcinogen and therefore an air quality objective has been set for it.
In this report, concentrations of benzene and 1,3-butadiene are expressed as microgrammes per cubic metre (µg m-3). To convert to parts per billion (ppb) if necessary, the following relationships should be used:
1 ppb = 3.25 µg m-3 for benzene at 293K (20°°°°C) and 1013mb. 1 ppb = 2.25 µg m-3 for 1,3-butadiene at 293K (20°°°°C) and 1013mb.
(ii) Polycyclic Aromatic Hydrocarbons Another class of organic pollutants is the polycyclic aromatic hydrocarbons, (PAHs). These include the following compounds: Acenapthene, Acenapthylene, Anthracene, Benz(a)anthracene, Benzo(a)pyrene, Benzo(b)fluoranthene, Benzo(ghi)perylene, Benzo(k)fluoranthene, Chrysene, Dibenz(ah)anthracene, Fluoranthene, Fluorene, Indeno(1,2,3-cd)pyrene, Napthalene, Phenanthrene, Pyrene. They are all, to varying degrees, toxic or carcinogenic, and are therefore classified as Hazardous Air Pollutants. Concentrations of these hazardous compounds in ambient air are usually very small, and are reported as nanogrammes (i.e. 10-9 grammes) per cubic metre (ngm-3). The largest source of PAHs in the UK at present is road transport, which in 2000 contributed 53% to the total UK emissions. Non-ferrous metal processes such as aluminium smelting can also be a significant source, although there are no aluminium smelting plant in Northern Ireland at present. However, there is one significant source particularly relevant to parts of Northern Ireland: domestic solid fuel combustion. For this reason, it is important to continue monitoring PAH in areas where domestic solid fuel use is widespread. PAHs can be adsorbed onto the surface of fine particulate: therefore they are monitored in the particulate phase, by sampling the PM10 fraction and analysing for the compounds of concern.
8.1 MONITORING OF HYDROCARBONS
A range of 27 hydrocarbons including benzene and 1,3-butadiene were monitored at the Belfast South site from 1993 to 2000. This site ceased operation at the end of 2000; there are plans to replace it with an instrument monitoring a more limited range of compounds. A range of polycyclic aromatic hydrocarbons (PAHs) in the particulate phase are monitored at two sites in Northern Ireland as part of Defra’s Hazardous Air Pollutants (HAPS) Network. These are Belfast (at Clara
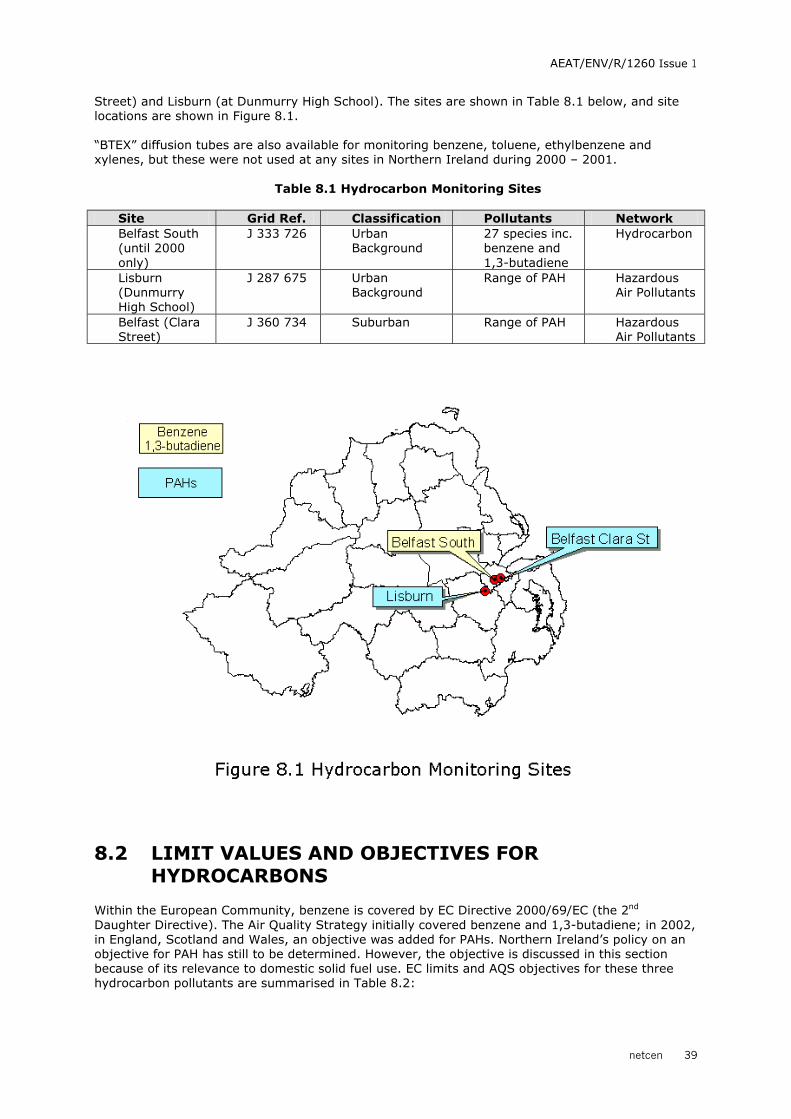
AEAT/ENV/R/1260 Issue 1
netcen 39
Street) and Lisburn (at Dunmurry High School). The sites are shown in Table 8.1 below, and site locations are shown in Figure 8.1. “BTEX” diffusion tubes are also available for monitoring benzene, toluene, ethylbenzene and xylenes, but these were not used at any sites in Northern Ireland during 2000 – 2001.
Table 8.1 Hydrocarbon Monitoring Sites Site Grid Ref. Classification Pollutants Network Belfast South (until 2000 only)
J 333 726 Urban Background
27 species inc. benzene and 1,3-butadiene
Hydrocarbon
Lisburn (Dunmurry High School)
J 287 675 Urban Background
Range of PAH Hazardous Air Pollutants
Belfast (Clara Street)
J 360 734 Suburban Range of PAH Hazardous Air Pollutants
8.2 LIMIT VALUES AND OBJECTIVES FOR HYDROCARBONS
Within the European Community, benzene is covered by EC Directive 2000/69/EC (the 2nd Daughter Directive). The Air Quality Strategy initially covered benzene and 1,3-butadiene; in 2002, in England, Scotland and Wales, an objective was added for PAHs. Northern Ireland’s policy on an objective for PAH has still to be determined. However, the objective is discussed in this section because of its relevance to domestic solid fuel use. EC limits and AQS objectives for these three hydrocarbon pollutants are summarised in Table 8.2:
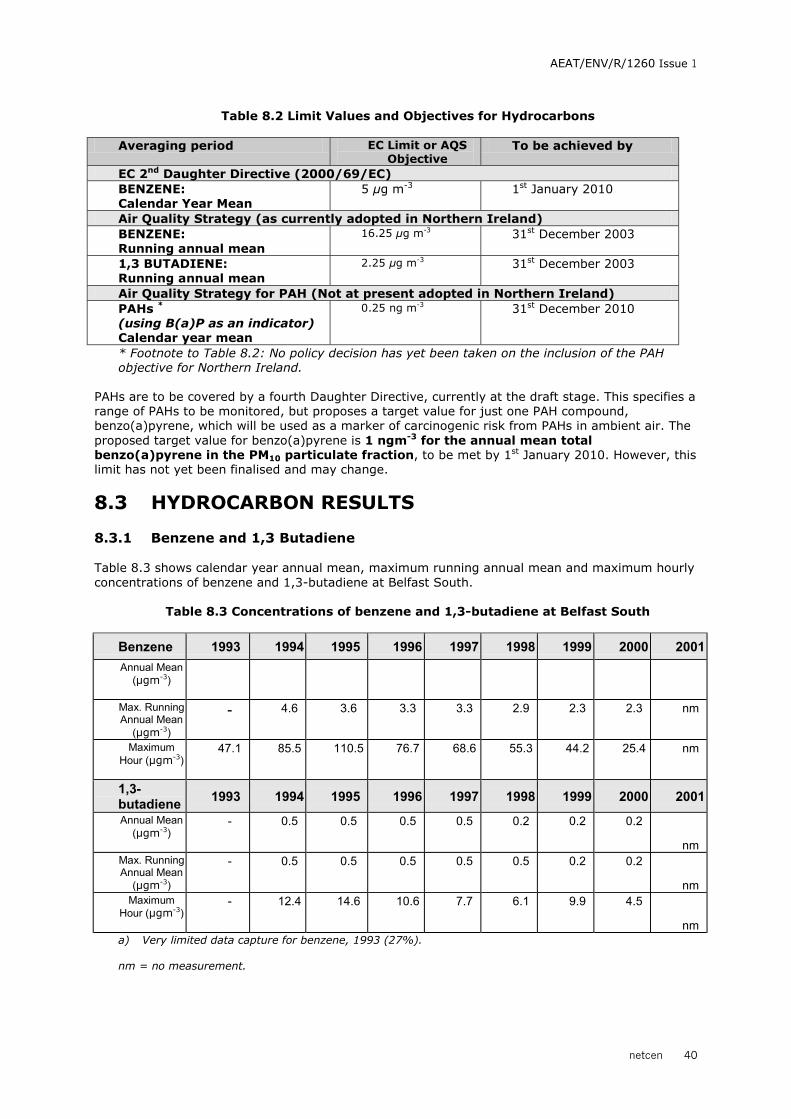
AEAT/ENV/R/1260 Issue 1
netcen 40
Table 8.2 Limit Values and Objectives for Hydrocarbons
Averaging period EC Limit or AQS
Objective To be achieved by
EC 2nd Daughter Directive (2000/69/EC) BENZENE: Calendar Year Mean
5 µg m-3 1st January 2010
Air Quality Strategy (as currently adopted in Northern Ireland) BENZENE: Running annual mean
16.25 µg m-3
31st December 2003
1,3 BUTADIENE: Running annual mean
2.25 µg m-3 31st December 2003
Air Quality Strategy for PAH (Not at present adopted in Northern Ireland) PAHs * (using B(a)P as an indicator) Calendar year mean
0.25 ng m-3
31st December 2010
* Footnote to Table 8.2: No policy decision has yet been taken on the inclusion of the PAH objective for Northern Ireland.
PAHs are to be covered by a fourth Daughter Directive, currently at the draft stage. This specifies a range of PAHs to be monitored, but proposes a target value for just one PAH compound, benzo(a)pyrene, which will be used as a marker of carcinogenic risk from PAHs in ambient air. The proposed target value for benzo(a)pyrene is 1 ngm-3 for the annual mean total benzo(a)pyrene in the PM10 particulate fraction, to be met by 1st January 2010. However, this limit has not yet been finalised and may change.
8.3 HYDROCARBON RESULTS
8.3.1 Benzene and 1,3 Butadiene
Table 8.3 shows calendar year annual mean, maximum running annual mean and maximum hourly concentrations of benzene and 1,3-butadiene at Belfast South.
Table 8.3 Concentrations of benzene and 1,3-butadiene at Belfast South
Benzene 1993 1994 1995 1996 1997 1998 1999 2000 2001 Annual Mean
(µgm-3)
Max. Running Annual Mean
(µgm-3)
- 4.6 3.6 3.3 3.3 2.9 2.3 2.3 nm
Maximum Hour (µgm-3)
47.1 85.5 110.5 76.7 68.6 55.3 44.2 25.4 nm
1,3-butadiene 1993 1994 1995 1996 1997 1998 1999 2000 2001 Annual Mean
(µgm-3) - 0.5 0.5 0.5 0.5 0.2 0.2 0.2
nm Max. Running Annual Mean
(µgm-3)
- 0.5 0.5 0.5 0.5 0.5 0.2 0.2
nm Maximum
Hour (µgm-3) - 12.4 14.6 10.6 7.7 6.1 9.9 4.5
nm a) Very limited data capture for benzene, 1993 (27%). nm = no measurement.

AEAT/ENV/R/1260 Issue 1
netcen 41
Annual mean benzene concentration has been below 5 µg m-3 since 1994: hence the EC 2nd Daughter Directive limit value for this pollutant is currently met at this site. Also, the maximum running annual means for this site show that neither benzene nor 1,3-butadiene has exceeded the applicable Air Quality Strategy objective (16.25 µg m-3 and 2.25 µg m-3 for benzene and 1,3-butadiene respectively) during the period 1994 – 2000. The Air Quality Strategy objectives for benzene and 1,3-butadiene have therefore been met at this site throughout its operational period.
8.3.2 Polycyclic Aromatic Hydrocarbons
Annual mean benzo(a)pyrene concentrations at Lisburn were 0.93 ngm-3 in 2000, and 0.96 ngm-3 for 2001. Annual mean benzo(a)pyrene concentration at Belfast Clara Street was 0.37 ngm-3 in 2001. Both sites are therefore within the proposed EC target value of 1.0 ngm-3 for this PAH (although in the case of Lisburn by a very small margin). The new AQS objective of 0.25 ngm-3 for benzo(a)pyrene does not apply to Northern Ireland at the present time. However, both sites currently exceed this value; in the case of Lisburn, the exceedence is substantial. To put these values into context, they should be compared with results from other sites in the HAPS Network in England, Wales and Scotland – see Table 8.4 and Figure 8.2. The two sites in Northern Ireland are shown in bold italics.
Table 8.4 Annual Mean Benzo(a)pyrene Concentrations at all HAPS Network Sites Site Type Annual Mean
2000 ng m-3
Annual Mean 2001 ng m-3
Ashington Urban 0.17 0.20 Belfast Urban - 0.37 Birmingham Urban - 0.16 Bolsover Urban 0.25 0.28 Glasgow Urban 0.12 0.12 Hazelrigg Semi-Rural 0.06 0.08 High Muffles Rural 0.04 0.05 Holyhead Urban 0.11 0.15 Kinlochleven * Urban 2.28 0.34 Leeds Urban - 0.16 Lisburn Urban 0.93 0.96 London 2a Urban 0.14 0.14 Manchester Urban 0.24 0.34 Middlesbrough Urban 0.28 0.37 Newcastle Urban - 0.11 Newport Urban 0.35 0.36 Port Talbot Urban 0.59 0.40 Scunthorpe Urban 1.18 0.34 Stoke Ferry Rural 0.09 0.09
*Kinlochleven site (Scotland) was near an aluminium smelter, which closed in July 2000.
Annual mean benzo(a)pyrene concentration for 2000-2001 at rural sites (Hazelrigg, High Muffles, Stoke Ferry), ranged from 0.04 to 0.09 ngm-3, well within the Air Quality Strategy’s new 2010 objective of 0.25 ngm-3. Urban sites typically had higher annual mean benzo(a)pyrene concentrations for 2000 and 2001 ranging from 0.11 to 2.28 ngm-3: nine of the 19 sites exceeded the AQS objective of 0.25 ngm-3 in 2000 or 2001. Typically, the highest values were measured at sites near industrial areas, such as Kinlochleven, Scunthorpe, Middlesbrough, and Port Talbot. Only three sites approached or exceeded the proposed EC limit value for benzo(a)pyrene of 1.0 ngm-3 : Kinlochleven (2000 annual mean 2.28 ng m-3), Lisburn (annual means 0.93 ng m-3 and 0.96 ng m-3 in 2000 and 2001 respectively) and Scunthorpe (2000 annual mean 1.18 ng-3). Kinlochleven was near an aluminium smelter, which closed in June 2000 (hence the much lower 2001 annual mean). The Scunthorpe site is near a major steel works and a coal tar processing plant. The Lisburn site, by contrast, is in a non-industrial residential area. In the case of Lisburn, it is likely that domestic fuel burning is the dominant source of PAHs.
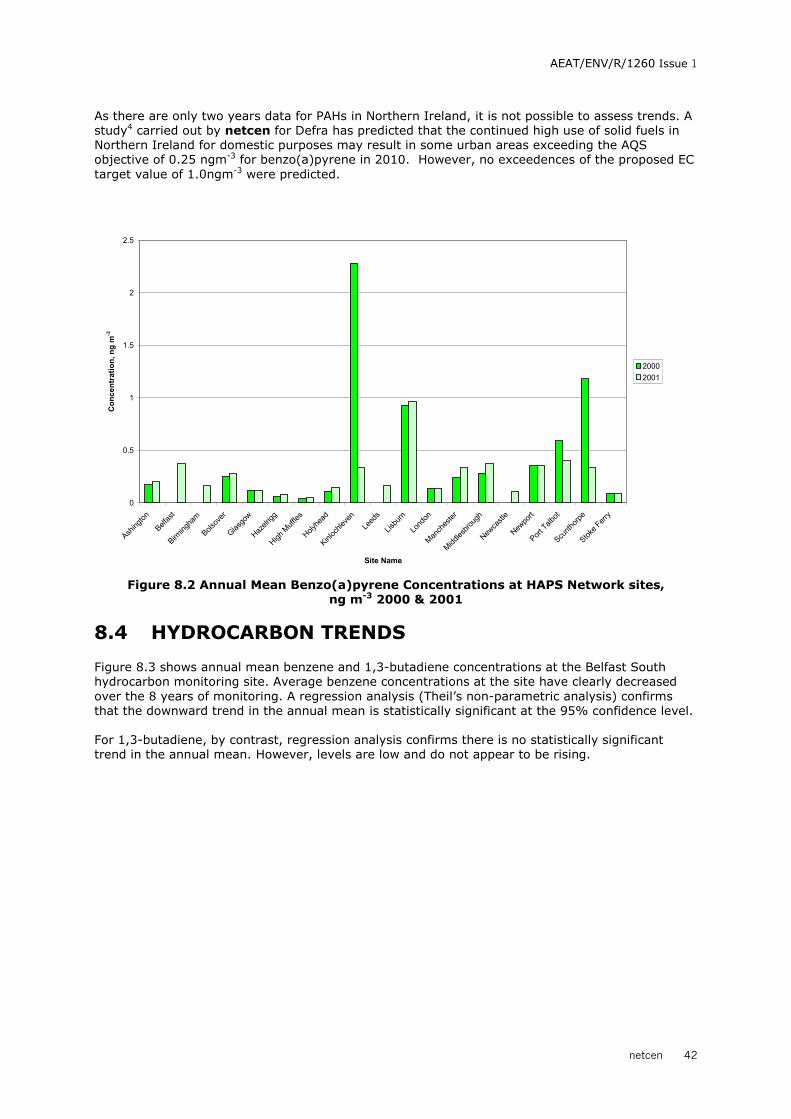
AEAT/ENV/R/1260 Issue 1
netcen 42
As there are only two years data for PAHs in Northern Ireland, it is not possible to assess trends. A study4 carried out by netcen for Defra has predicted that the continued high use of solid fuels in Northern Ireland for domestic purposes may result in some urban areas exceeding the AQS objective of 0.25 ngm-3 for benzo(a)pyrene in 2010. However, no exceedences of the proposed EC target value of 1.0ngm-3 were predicted.
Figure 8.2 Annual Mean Benzo(a)pyrene Concentrations at HAPS Network sites, ng m-3 2000 & 2001
8.4 HYDROCARBON TRENDS
Figure 8.3 shows annual mean benzene and 1,3-butadiene concentrations at the Belfast South hydrocarbon monitoring site. Average benzene concentrations at the site have clearly decreased over the 8 years of monitoring. A regression analysis (Theil’s non-parametric analysis) confirms that the downward trend in the annual mean is statistically significant at the 95% confidence level. For 1,3-butadiene, by contrast, regression analysis confirms there is no statistically significant trend in the annual mean. However, levels are low and do not appear to be rising.
0
0.5
1
1.5
2
2.5
Ashing
ton
Belfas
t
Birming
ham
Bolsov
er
Glasgo
w
Hazelr
igg
High M
uffles
Holyhe
ad
Kinloc
hleve
nLe
eds
Lisbu
rn
Lond
on
Manch
ester
Middles
broug
h
Newca
stle
Newpo
rt
Port Talb
ot
Scunth
orpe
Stoke F
erry
Site Name
Con
cent
ratio
n, n
g m
-3
20002001
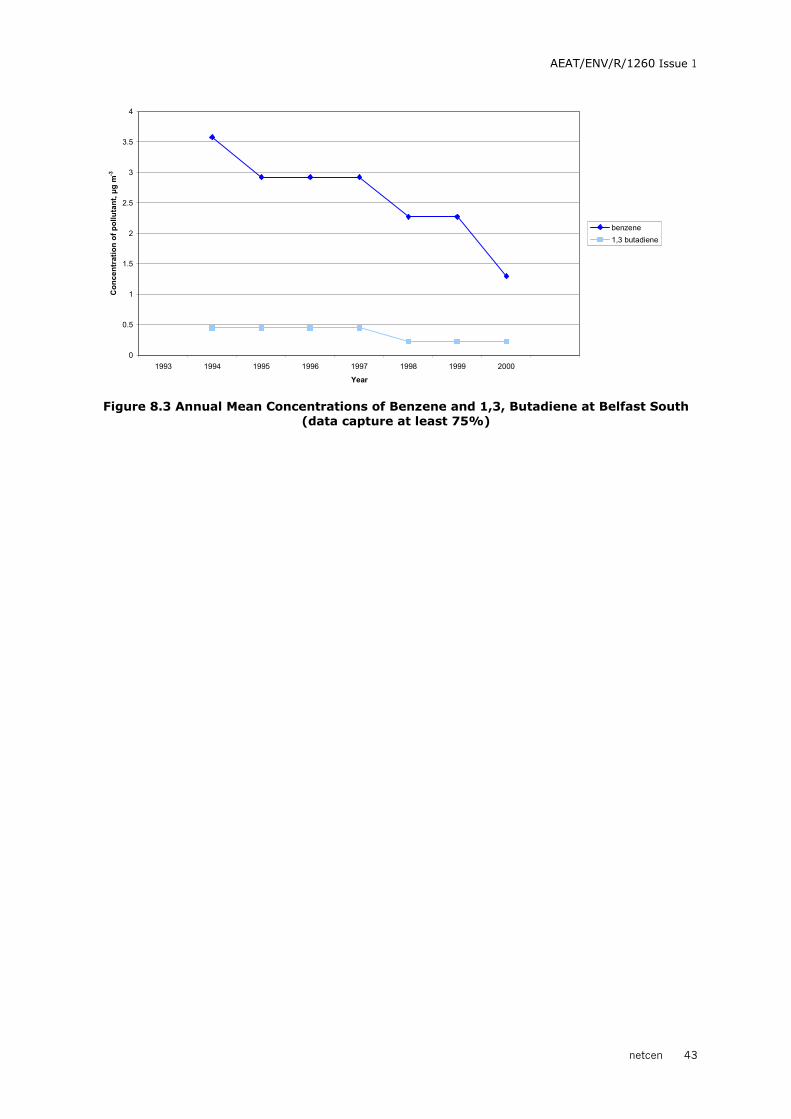
AEAT/ENV/R/1260 Issue 1
netcen 43
Figure 8.3 Annual Mean Concentrations of Benzene and 1,3, Butadiene at Belfast South (data capture at least 75%)
0
0.5
1
1.5
2
2.5
3
3.5
4
1993 1994 1995 1996 1997 1998 1999 2000
Year
Con
cent
ratio
n of
pol
luta
nt, µ
g m
-3
benzene1,3 butadiene

AEAT/ENV/R/1260 Issue 1
netcen 44
9 Metals
The metallic elements lead (Pb), cadmium (Cd), arsenic (As), nickel (Ni) and mercury (Hg) have the potential to cause adverse health effects in humans. Cadmium, arsenic, and nickel occur as pollutant emissions from coal burning, heavy fuel oil burning, waste incineration and some industrial processes. Mercury is emitted from waste incineration, industrial processes using mercury cells, some non-ferrous metal processes and coal combustion. The major source of ambient lead is vehicles using lead-containing fuel. Emissions of cadmium, arsenic, nickel and mercury in the UK have all fallen by more than 80% since 1970, as a result of reduced coal and oil combustion, and better emission controls on industrial processes and waste incineration plant. Emissions of lead have been reduced by 93% since 1970, by a substantial reduction of the permitted lead content of petrol in 1986, followed by the phasing out of leaded petrol in 1999.
Concentrations of these metallic elements in ambient air are expressed in microgrammes (i.e. 10-6 grammes) per cubic metre (µg m-3 ) or nanogrammes (i.e. 10-9 grammes) per cubic metre (ngm-3).
9.1 MONITORING OF METALS
The metals lead (Pb), cadmium (Cd), arsenic (As), nickel (Ni), and mercury (Hg) were monitored at three sites in Northern Ireland over a twelve month period, December 1999 to November 2000. This monitoring was carried out by Casella Stanger on behalf of the Department of Environment, Transport and the Regions (now Defra), as part of a study investigating ambient concentrations of these metals around industrial emission sources. The three sites were all located near to power stations or large industrial plant. Table 9.1 shows the locations of these monitoring sites. At these sites, particulate phase ambient concentrations were measured using gravimetric PM10 measurement apparatus. The duration of each sample period was one week. One site, Whitehead, also monitored the metal vanadium.
Table 9.1 Metals Monitoring Sites Site Grid reference Description Technique Donnybrewer Road, Campsey
C 486 208 1km to the NE of Coolkeeragh Power station (oil fired)
Gravimetric PM10
Bentra Road, Whitehead
J 450 911 1km to NE of Kilroot Power Station (oil fired )
Gravimetric PM10
Victoria Park, Belfast J 364 754 800m from Belfast Harbour Estate (mixed industrial area)
Gravimetric PM10
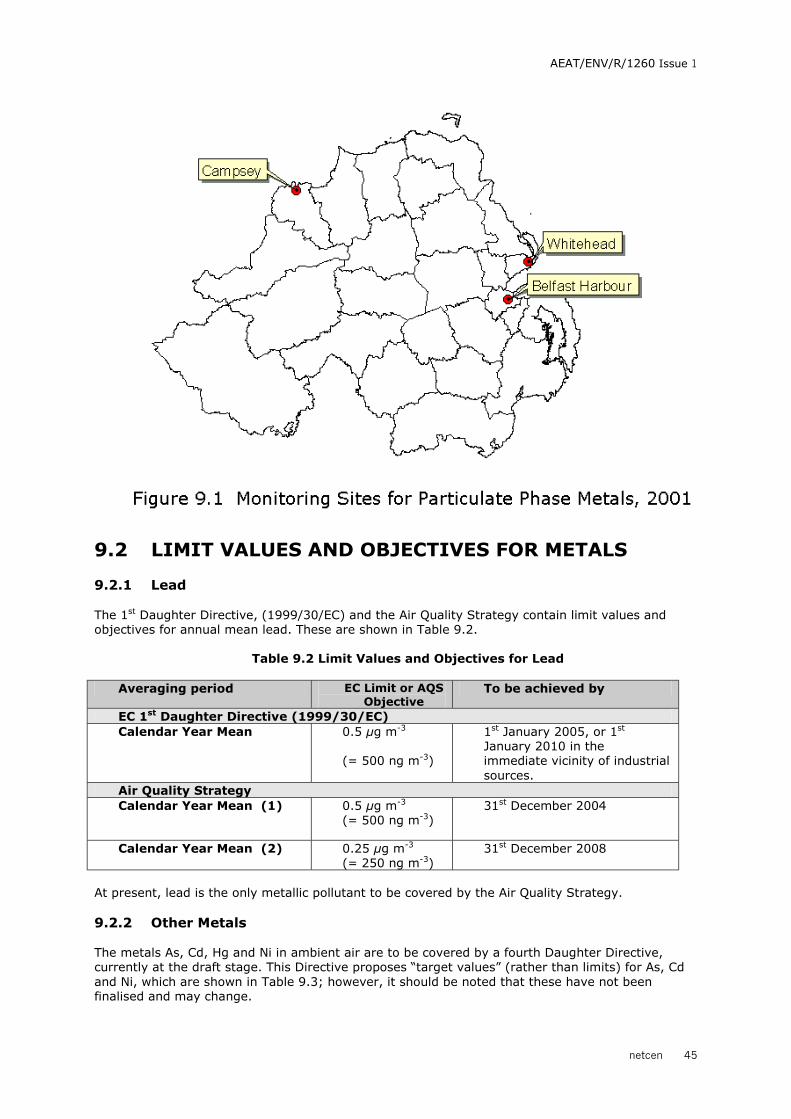
AEAT/ENV/R/1260 Issue 1
netcen 45
9.2 LIMIT VALUES AND OBJECTIVES FOR METALS
9.2.1 Lead
The 1st Daughter Directive, (1999/30/EC) and the Air Quality Strategy contain limit values and objectives for annual mean lead. These are shown in Table 9.2.
Table 9.2 Limit Values and Objectives for Lead Averaging period EC Limit or AQS
Objective To be achieved by
EC 1st Daughter Directive (1999/30/EC) Calendar Year Mean 0.5 µg m-3
(= 500 ng m-3)
1st January 2005, or 1st January 2010 in the immediate vicinity of industrial sources.
Air Quality Strategy Calendar Year Mean (1) 0.5 µg m-3
(= 500 ng m-3)
31st December 2004
Calendar Year Mean (2) 0.25 µg m-3
(= 250 ng m-3) 31st December 2008
At present, lead is the only metallic pollutant to be covered by the Air Quality Strategy. 9.2.2 Other Metals
The metals As, Cd, Hg and Ni in ambient air are to be covered by a fourth Daughter Directive, currently at the draft stage. This Directive proposes “target values” (rather than limits) for As, Cd and Ni, which are shown in Table 9.3; however, it should be noted that these have not been finalised and may change.

AEAT/ENV/R/1260 Issue 1
netcen 46
Table 9.3 Proposed EC Directive Target Values for As, Cd and Ni. Element Averaging period Target Value As Calendar year 6 ng m-3 Cd Calendar year 5 ng m-3 Ni Calendar year 20 ng m-3
For As, Cd and Ni the target values apply to the total As, Cd or Ni concentration in the PM10
fraction. No target value has been set for Hg.
9.3 METALS RESULTS
Table 9.4 shows the metals monitoring results for all three sites in Northern Ireland, from the study1 carried out over the 12 months December 1999 to November 2000. Annual mean Pb concentrations at all three sites were well within the EC Directive limit value 0.5 µg m-3 (500 ng m-3). They were also well within the lower AQS objective of 0.25 µg m-3
(250 ng m-3): thus all three sites already meet the AQS objective for this metal, set for the end of 2008. Annual means of As, Cd and Ni were well within the proposed EC Directive target values at all three sites.
Table 9.4 Results of Metals Monitoring Study
Annual mean ng m-3
Min. weekly ng m-3
Max weekly ng m-3
Limit of detection ng m-3
Lead
Campsey 3 1 10 1
Whitehead 4 1 10 1
Belfast 12 3 40 1
Arsenic
Campsey 0.72 0.06 14.92 0.06
Whitehead 0.47 0.06 1.48 0.06
Belfast 1.01 0.24 2.26 0.06
Cadmium
Campsey 0.13 0.14 0.77 0.14
Whitehead 0.14 0.14 1.59 0.14
Belfast 0.14 0.14 0.45 0.14
Mercury
Campsey 0.06 0.06 0.44 0.06
Whitehead 0.047 0.06 0.23 0.06
Belfast 0.08 0.06 0.63 0.06
Nickel
Campsey 2.05 0.29 8.27 0.29
Whitehead 1.25 0.29 5.96 0.29
Belfast 3.59 0.29 11.38 0.29
Vanadium
Whitehead 2.6 0.44 5.37 0.44
On the basis of this one-year study, it was concluded that levels of metallic pollutants at these three sites in Northern Ireland were low. As the duration of this study was just one year, it is not possible to assess trends. Overall UK trends for all these metals are decreasing.

AEAT/ENV/R/1260 Issue 1
netcen 47
10 Conclusions
1. Carbon Monoxide is measured at two sites: Belfast Centre and Londonderry. Both currently meet the EC limit value and the Air Quality Strategy objective for CO. There is a significant downward trend in the annual mean CO at Belfast Centre but not at Londonderry.
2. Nitrogen Dioxide is monitored at four automatic sites, and over 150 diffusion tube sites. The
four automatic sites meet the EC limit values and the Air Quality Strategy objectives for NO2. A small number of diffusion tube sites (four in 2000, six in 2001) had annual mean NO2 concentrations greater than the EC Directive and AQS objective of 40 µg m-3. In all but one case, these were Type A (Roadside) sites.
3. Two automatic sites (Belfast Centre and Londonderry) have sufficient NO2 data to assess
trends: there is a significant downward trend in annual mean NO2 concentration at Belfast Centre only. Diffusion tube data show a significant downward trend for Roadside, Intermediate and Urban Background site types, for the period 1993 to 2001.
4. Sulphur Dioxide is monitored at five automatic sites, and 34 non-automatic sites. The
requirements of the 1st Daughter Directive and the objectives of the Air Quality Strategy are met at all automatic sites, except Belfast East. This site exceeded the AQS objective for the 15-minute mean on more than 35 permitted occasions in 2000 and 2001, and the EC limit value and AQS objective for the 24-hour mean on more than three occasions in 2001.
5. Significant downward trends in annual mean SO2 concentration were identified at Belfast
Centre and Belfast East, but not Londonderry. 6. In calendar year 2001, three non-automatic SO2 (8-port sampler) sites in Belfast exceeded the
EC limit value and AQS objective for the 24-hour mean on more than the permitted three occasions. The historical dataset from this network show a clear decrease in annual mean SO2 concentrations since the 1960s, which is also evident in recent years’ data.
7. Particulate matter as PM10 is measured at six automatic monitoring sites in Northern Ireland.
All these sites meet the EC Directive limits and Air Quality Strategy objectives for this pollutant. There is a significant downward trend in annual mean PM10 concentrations at Belfast Centre and Londonderry, although not at Belfast East and Lough Navar. (At the two Newry sites, there is as yet insufficient data to assess trends).
8. Particulate matter as black smoke is measured at 31 sites, of which 29 are part of a long-
running network. The historical dataset from this network show a clear and consistent decrease in annual mean smoke concentrations from the 1960s to the mid 1990s; however the downward trend has levelled off in the past five years.
9. Ozone is measured at three automatic sites in Northern Ireland: the AUN sites Belfast Centre
and Londonderry and the rural site Lough Navar. In recent years, the new EC Directive target and the more stringent AQS objective, for ozone have been met at these sites, except for Lough Navar in 1995 and Londonderry in 2000. Ozone concentrations at Belfast Centre show an increasing trend; this may be due to decreasing concentrations of other pollutants which can act as “scavengers” of ozone, keeping levels low in urban areas.
10. Hydrocarbons were measured from 1993 to 2000 at the Belfast South site. Concentrations of
both benzene and 1,3-butadiene were within the limits set by the Air Quality Strategy at this site throughout its operational period. Annual mean benzene showed a significant downward trend over this period; annual mean 1,3, butadiene showed no significant trend.
11. Polycyclic aromatic hydrocarbons (PAHs) have been measured since 2000 at Lisburn, and since
2001 at Belfast Clara Street, as part of the Hazardous Air Pollutants (HAPs) Network. At Lisburn, annual mean concentrations of benzo(a)pyrene in 2000 and 2001 were substantially

AEAT/ENV/R/1260 Issue 1
netcen 48
above the new AQS objective of 0.25 ngm-3 (which at the present time does not apply to Northern Ireland) and very close to the proposed EC limit value of 1.0 ngm-3. Lower concentrations of benzo(a)pyrene (2001 annual mean 0.37 ngm-3) were measured at Belfast Clara Street. Benzo(a)pyrene concentrations at Lisburn in particular were high compared with most other urban sites in the UK. This is believed to be due to the widespread domestic use of solid fuels in this area. A study by netcen has predicted that continued use of such fuels may cause parts of Northern Ireland to fail to meet the AQS objective in 2010.
12. A one-year study, carried out on behalf of Defra, monitored ambient levels of the metallic
elements lead, arsenic, cadmium, mercury and nickel at three sites near to industrial sources. Annual mean concentrations of lead were well within applicable air quality limits and guidelines. Annual mean concentrations of arsenic, cadmium and nickel were well within proposed EC target values.
11 Acknowledgements
Netcen would like to thank the District Councils and other organisations who carried out the air quality measurements detailed in this report, and CEHOG for collating their data.
12 References
1. R. Maggs “Monitoring of Lead, cadmium, Arsenic, Nickel and Mercury around Industrial Sites” Casella Stanger report. SSE/AQ/A30160109/RM/1718 , Sep 2001. Available from http://www.aeat.co.uk/netcen/airqual/reports/strategicpolicy/Final_Report_rev4.pdf.
2. C Buckingham et al “Greater Belfast Atmospheric Emissions Inventory” report produced for DETR by London Research Centre & RSK Environment, April 1999.
3. C Buckingham et al “Atmospheric Emissions Inventories for Four Urban Areas” report produced for DETR by London Research Centre & RSK Environment, December 1997.
4. P Coleman et al “Assessment of benzo(a)pyrene concentrations in the UK to support the establishment of a national PAH objective” AEAT/ENV/R/0620, August 2001. Available from http://www.aeat.co.uk/netcen/airqual/reports/naqs2001/aeat-env-r-0620.pdf.

AEAT/ENV/R/1260 Issue 1
netcen
Appendices
CONTENTS Appendix 1 Diffusion Tube Site Details and Data Appendix 2 Smoke and Sulphur Dioxide Network Site Data

AEAT/ENV/R/1260 Issue 1
netcen
Appendix 1 Diffusion Tube Site Details and Data
CONTENTS Table A1.1 NO2 Diffusion tube sites (2000) Table A1.2 NO2 Diffusion tube sites (2001) Table A1.3 SO2 Diffusion tube sites (2000 & 2001)

AEAT/ENV/R/1260 Issue 1
netcen
Table A1.1 NO2 Diffusion Tube Data for 2000 (page 1 of 2)
Local Authority Location of Sampler Irish Grid E
Irish Grid N
Site Classification
Part of NO2
Network?
NO2 Network number if applicable
NO2 Network classification
Annual mean 2000 (µ g m-3)
Antrim Main Street, Templepatrick 3225 3856 A NO 33.0
Antrim Background - Templepatrick 3232 3857 D NOAntrim Moneyrod Road, Randalstown 3075 3905 D NO 8.6Ards 8 Court Street, Newtownards 3485 3735 A YES 1N R 29.0Ards Council Offices, 2 Church Street, Newtownards 3485 3740 B YES 2N I 11.0Ards 7 Ashgrove, Newtownards 3485 3745 C YES 3N B 9.0Ards 19 Islandmore Avenue, Newtownards 3495 3750 C YES 6N B 9.0Armagh 25 Railway Street, Armagh 2875 3458 A YES 1N R 36.3Armagh Bridge House, Barrack Street, Armagh 2879 3450 A YES 5N R 17.2Armagh St Patrick's Fold, Scotch Street, Armagh 2877 3451 A YES 19.9Armagh Tourist Information Office, English Street, Armagh 2876 3455 A YES 26.9Armagh Portadown Road, Armagh 2887 3459 A NO 29.8Armagh Lower Irish Street, Armagh 2873 3477 A NO 29.2Armagh 7 Desart Lane, Armagh 2856 3457 C YES 3N B 14.9Armagh 17 Folly Lane, Armagh 2882 3458 C YES 4N B 19.1Ballymena 29 Galgorm Road, Ballymena 3103 4032 A YES 2N R 26.7Ballymena Ballymoney Street, Ballymena 3108 4035 A NO 5N R 26.2Ballymena Queen Street, Ballymena 3108 4022 A NO 24.4Ballymena 9 Princes Street, Ballymena 3103 4033 B YES 3N I 21.6Ballymena Greenvale Street, Ballymena 3108 4035 B NO 17.8Ballymena Patrick Place, Ballymena B NO 14.9Ballymena Leighmore Avenue, Ballymena 3102 4025 C YES 1N B 9.4Ballymena 8 Ballyloughan Avenue, Ballymena 3096 4044 C YES 4N B 11.3Ballymoney 19 Linenhall Street, Ballymoney 2948 4259 A YES 1N R 18.5Ballymoney 6 Church Street, Ballymoney 2948 4258 A NO 20.8Ballymoney 31 Charles Street, Ballymoney 2946 4261 A NO 19.1Ballymoney Opposite 51 Queen Street, Ballymoney 2952 4258 A NO 19.9Ballymoney 14/16 Ozone Avenue, Ballymoney 2954 4257 B YES 2N I 17.2Ballymoney Opposite 16 Armour Avenue, Ballymoney 2954 4257 C YES 3N B 10.1Ballymoney 2/4 Semicock Avenue, Ballymoney 2948 4259 C YES 4N B 13.4Banbridge Dromore Street, Banbridge 3128 3462 A NO 22.9Banbridge 10 Reilly Court, Banbridge 3122 3461 B NO 15.3Banbridge 17 Springfields, Banbridge 3121 3444 C NO 11.5Banbridge 9 Fortfield, Dromore 3199 3535 D NO 11.5Belfast Belfast City Hall, Donegal Square South 3338 3739 A Yes 1N R 38.2Belfast Black's Road, Belfast 3297 3695 A Yes 36.3Belfast 228 Antrim Road 3334 3757 A Yes 11.5Belfast 181 Lisburn Road 3327 3723 A Yes 43.9Belfast 5-11 Cromac Street 3341 3753 A Yes 36.3Belfast 301 Ormeau Road 3345 3722 A Yes 36.3Belfast 400 Ormeau Road 3350 3710 A Yes 32.5Belfast 59 Saintfield Road 3353 3698 A Yes 34.4Belfast Belfast City Hall, Donegal Square East 3339 3739 B Yes 2N I 34.0Belfast 9 Molyneaux Street 3339 3752 B Yes 43.9Belfast St. Patrick's School 3340 3752 B Yes 24.8Belfast Royal Victoria Hospital, 12 Grosvenor Road Belfast 3324 3735 C Yes 3N B 24.0Belfast Primary School, North Road 3375 3743 C Yes 4N B 19.1Carrickfergus 59 Shore Road, Greenisland 3379 3849 A YES 1N R 16.2Carrickfergus 27 Upper Road, Greenisland 3362 3857 A 14.7Carrickfergus Islandmagee Road, Whitehead 3476 3923 A 8.8Carrickfergus Railway Station, Fergus Avenue, Carrickfergus 3412 3878 B YES 2N I 11.3Carrickfergus 32 Mullaghmore Park, Greenisland 3369 3856 C YES 3N B 6.5Carrickfergus College North Road, Carrickfergus 3411 3889 C YES 4N B 10.5Carrickfergus 28 Bentra Road, Whitehead 3454 3919 D 5.7Carrickfergus Lough Road, Loughmourne 3412 3921 D
Castlereagh Council Offices, 368 Cregagh Road, BT6 9EZ 3362 3713 A YES 1N R 18.0
Castlereagh 3 Downshire Road, Cregagh, Belfast, BT6 9 EZ 3360 3713 B YES 2N I 14.0
Castlereagh Lamp post, 17/19 Everton Drive, Castlereagh 3361 3711 C YES 5N B 13.0Castlereagh 74 Downshire Park East 3365 3714 D YES 6N B 11.0
Coleraine Lower Union Street, Coleraine 2848 4328 A NO
Coleraine Upper Union Street, Coleraine 2852 4328 A NO
Coleraine Lodge Road, Roundabout, Coleraine 2859 4314 A NO
Coleraine Bridge Street, Coleraine 2847 4325 A NO
Coleraine Lansdowne Crescent Car Park, Portrush 2856 4412 A YES 3.6
Coleraine Main Street, Portrush 2858 4408 A YES 9.0
Coleraine Dunluce Centre, Dunluce Avenue, Portrush 2860 4401 B YES 4.6Coleraine Kelly's Caravan Site, Dunluce Road, Portrush 2871 4398 C YES 3.1

AEAT/ENV/R/1260 Issue 1
netcen
Table A1.1 NO2 Diffusion Tube Data for 2000 –continued; (page 2 of 2)
All grid references are to nearest 100m. Site classifications:
A = kerbside, 1-5m from the kerb of a busy road
B = intermediate site, 20-30m from the same or an equivalent road
C = urban background site, greater than 50m from any busy road
D = rural background site
E = special site; monitoring air pollution from some industrial process, etc. Annual means shown only where there are at least 6 months’ valid data.
Local Authority Location of Sampler Irish Grid E
Irish Grid N
Site Classification
Part of NO2
Network?
NO2 Network number if applicable
NO2 Network classification
Annual mean 2000 (µ g m-3)
Cookstown Westland Road, Cookstown 2803 3784 A 20.6
Cookstown Chapel Street, Cookstown 2811 3777 A 27.7Cookstown Parochial House, Cookstown C 13.8Cookstown Rathmore, Cookstown 2809 3774 C 16.4
Cookstown Westland Rd OPH C 14.9
Craigavon Town Hall, Union Street, Lurgan 3083 3583 A YES 5N R 18.0
Craigavon 17 Derrylodge Manor, Lurgan 3076 3592 B YES 6N I 26.0Craigavon 36 Ardboe Drive, Lurgan 3081 3578 C YES 7N B 12.0Craigavon 21 Ballyhannon Road, Portadown 3031 3533 C YES 8N B 10.0Derry No 3 Creggan Road, Londonderry 2429 4172 A YES 8N RDerry St Columbs Park, Limavady Road, Londonderry 2445 4173 B YES 7N IDerry 3 Silverbirch Crescent, Londonderry 2453 4166 C YES 5N/11N BDerry 29 Argyle Street, Londonderry 2432 4179 C YES 6N BDown 9 Irish Street, Downpatrick, BT30 6BN 3487 3446 A YES 1N R 29.4
Down High Street, Ballynahinch 3366 3523 A NO 8N R 25.2Down Link Road, Downpatrick 3488 3448 A NO 11.5
Down 2 Belfast Road, Saintfield 3406 3591 A NO 20.6Down 4 main Street, Newcastle 3378 3316 A NO 14.5Down 5 Market Lane, Downpatrick, BT30 6TH 3486 3445 B YES 2N I 11.7Down 11 Orchard Way, Strangford Road, Downpatrick, BT30 3489 3459 C YES 4N B 6.5Down 7 St Patrick's Drive, Downpatrick, BT30 6NR 3486 3422 C YES 3N B 8.8Dungannon Market Square, Dungannon 2798 3625 A YES 1N R 20.0Dungannon Thomas Street, Dungannon 2797 3626 B YES 2N I 18.0Dungannon 4 Ardgammon, Dungannon 2796 3630 B YES 3N B 11.0Dungannon 11 Bushvale, Dungannon 2811 3623 C YES 4N B 12.0Fermanagh Belmore Street, Enniskillen 2239 3440 A NO 22.5
Fermanagh Lower Celtic Park, Enniskillen 2244 3435 B NO 8.2Fermanagh Everglades, Tempo Road, Enniskillen 2256 3447 B NO 4.6
Fermanagh Rossole Park, Enniskillen 2230 3432 C NO 5.7Lisburn Northern Bank, 62 Bow Street, Lisburn, BT28 1BN 3265 3644 A YES 1N R 27.0Lisburn 18 Kingsway, Dunmurry 3295 3689 A YES 7N RLisburn 2 Llewellyn Avenue, Lisburn 3273 3648 B YES 5N I 17.0Lisburn 10 Beechlawn Park, Dunmurry 3296 3691 B NOLisburn 75 Edgewater, Lisburn 3272 3637 C YES 6N B 11.0Lisburn 22 Ventnor Park, Lambeg 3269 3620 C YES 3N B 10.0Lisburn 38 Ballynahinch Road, Lisburn 3274 3636 C YES 4N BLisburn Dunmurry High School, River Road, Dunmurry 3287 3675 C NOMagherafelt Queen Street, Magherafelt 2896 3905 A NO 36.3Magherafelt Church Street, Magherafelt 2897 3909 A NO 28.7Magherafelt Main Street, Magherafelt 2853 4004 A NO 22.9Newry and Mourne 20a Water Street, Newry 3087 3266 A YES 6N R 43.0Newry and Mourne Monaghan Row, Newry 3078 3268 C YES 3N I 16.0Newry and Mourne Edward St, Newry 3084 3268 C YES 7N B 16.0Newry and Mourne 19 Balmoral Park, Newry 3084 3268 C YES 9N B 14.0Newtownabbey Opposite 229 Jordanstown Road, Newtownabbey 3347 3804 A NO 26.9Newtownabbey 49 Main Street, Ballyclare 3288 3911 A YES 1N? 39.0Newtownabbey McMillan House, 323 Antrim Road, Glengormley 3313 3825 A NO 35.0Newtownabbey Doagh Road, Abbots Cross, Newtownabbey 3346 3824 A NO 30.0Newtownabbey Safeway Pole, lane off Main St., Ballyclare 3129 3591 B YES 5N I 26.0Newtownabbey Church/Lenamore Avenue, Jordanstown 3357 3844 B NO 18.0Newtownabbey 1251 Doagh Road, Newtownabbey 3335 3845 B NO 20.1Newtownabbey 19a Newtown Gardens, Newtownabbey 3288 3911 C YES 4N B 25.0Newtownabbey 202 Carnmoney Road, Glengormley 3121 3833 C YES 3N B 18.9
North Down 52 Bingham Street, Bangor 3507 3819 A YES 7N, 1N? R 17.0
North Down 132 Main Street, Bangor 3504 3815 A YES 2N I 19.0
North Down 68 Groomsport Road, Bangor 3520 3819 C YES 4N B 8.0
North Down 1 Rathmore Road, Bangor 3483 3815 C YES 5N B 7.0Omagh Adjacent to 41 Dublin Road, Omagh 2456 3724 A YES 1N R 53.0Omagh 9 Dergmoney Place, Omagh 2458 3722 B YES 2N I 19.0Omagh 2 Ardmore Heights, Omagh 2442 3722 C YES 5N B 10.0Omagh 16 Gortmore Gdns, Omagh 2444 3733 C YES 6N B

AEAT/ENV/R/1260 Issue 1
netcen
Table A1.2 NO2 Diffusion Tube Data for 2001 (page 1 of 3)
Local Authority Location of Sampler Irish Grid E Irish Grid N Site Classification
Part of NO2
Network? NO2 Network number if applicable
NO2 Network classification
Annual mean 2001 (µ g m-3)
Antrim Main Street, Templepatrick 3225 3856 A NO 31.6Antrim Moneyrod Road, Randalstown 3075 3905 A NO 17.0Antrim Fountain Street, Antrim 3153 3865 A NO 24.1Antrim At Donegore Bridge, Antrim 3202 3874 B NO 19.7Antrim Background - Templepatrick 3232 3857 D NO 10.9Ards 8 Court Street, Newtownards 3485 3735 A YES IN R 30.0Ards Rear of Town Hall opposite 18 Frances Street, Ne 3481 3741 A YES 7N R 26.0Ards 7 Ashgrove, Newtownards 3485 3745 C YES 3N B 9.0Ards 19 Islandmore Avenue, Newtownards 3495 3750 C YES 6N B 10.0Armagh 25 Railway Street, Armagh 2875 3458 A YES 1N R 37.0Armagh Bridge House, Barrack Street, Armagh 2879 3450 A YES 5N? R 40.0Armagh St Patrick's Fold, Scotch Street, Armagh 2877 3450 A YES 24.3Armagh 19 Victoria Street, Armagh 2882 3455 A NO 35.5Armagh Portadown Road, Armagh 2887 3459 A NO 35.7Armagh Lower Irish Street, Armagh 2873 3477 A NO 33.6Armagh 7 Desart Lane, Armagh 2865 3457 C YES 3N B 16.0Armagh 17 Folly Lane, Armagh 2882 3448 C YES 4N B 20.0Ballymena 29 Galgorm Road, Ballymena 3103 4032 A YES 2N R 27.9Ballymena Ballymoney Street, Ballymena 3102 4035 A YES 5N R 20.8Ballymena Queen Street, Ballymena 3108 4022 A NO 26.0Ballymena Broughshane Street, Ballymena 3110 4039 A NO 22.3Ballymena Lisnevenagh Road, Ballymena 3119 3970 A NO 18.3Ballymena Main Street, Cullybackey 3058 4057 A NO 17.4Ballymena Cullybackey Road, Ballymena 3103 4034 A NO 21.4Ballymena North Road, Ballymena 3106 4030 A NO 25.0Ballymena Ballymoney Road, Ballymena 3099 4044 A NO 23.2Ballymena George Street, Ballymena 3106 4032 A NO 39.7Ballymena Wellington Street, Ballymena 3108 4033 A NO 20.1Ballymena Leighmore avenue, Ballymena 3102 4025 C YES 1N B 12.0Ballymena 8 Ballyloughan Avenue, Ballymena 3095 4044 C YES 4N B 15.3Ballymoney 19 Linenhall Street, Ballymoney 2948 4259 A YES 1N R 21.4Ballymoney Adjacent 8 Ballybogey Road, Ballymoney 2942 4269 A YES 5N R 11.1Ballymoney 6 Church Street, Ballymoney 2948 4258 A NO 13.8Ballymoney 31 Charles Street, Ballymoney 2946 4261 A NO 20.1Ballymoney Opposite 51 Queen Street, Ballymoney 2952 4258 A NO 20.8Ballymoney 14/16 Ozone Avenue, Ballymoney 2954 4257 B YES 2N I 17.0Ballymoney Opposite 16 Armour Avenue, Ballymoney 2954 4257 C YES 3N B 16.8Ballymoney 2/4 Semicock Avenue, Ballymoney 2948 4259 C YES 4N B 13.2Banbridge Dromore Street, Banbridge 3128 3462 A NO 24.8Banbridge Fortfield Dromore (side of dual carriageway) 3199 3536 A 32.5Banbridge 10 Reilly Court, Banbridge 3122 3461 B NO Banbridge 17 Springfield's, Banbridge 3121 3444 C NO 13.4Banbridge 9 Fortfield, Dromore 3199 3535 D NO 17.2

AEAT/ENV/R/1260 Issue 1
netcen
Table A1.2 NO2 Diffusion Tube Data for 2001 – continued; (page 2 of 3)
Local Authority Location of Sampler Irish Grid E Irish Grid N Site Classification
Part of NO2
Network? NO2 Network number if applicable
NO2 Network classification
Annual mean 2001 (µ g m-3)
Belfast Belfast City Hall, Donegal Square South 3338 3739 A Yes 1N R 36.3Belfast Milner Street 3324 3734 A Yes 5N? R 28.7Belfast Black's Road 3297 3695 A Yes 34.4Belfast Cromac Street (A) 3341 3735 A Yes 28.7Belfast Bridge End 3346 3743 A Yes 34.4Belfast Upper Newtownards Road 3372 3740 A Yes 38.2Belfast Cromac Street (B) 3342 3737 A Yes 36.3Belfast 301 Ormeau Road 3345 3722 A Yes 38.2Belfast 400 Ormeau Road 3350 3709 A Yes 30.6Belfast Saintfield Road 3353 3698 A Yes 36.3Belfast Great George's Street 3339 3750 A Yes 45.8Belfast Ormeau Road, Galwally 3350 3702 A Yes 32.5Belfast Stockman's Lane 3312 3710 A Yes 34.4
Belfast Primary School, North Road 3375 3741 B Yes 4N B 21.0Belfast Royal Victoria Hospital, 12 Grosvenor Road Belfas3324 3735 C Yes 3N B 26.7Belfast Lombard Street 3339 3743 C Yes 32.5
Carrickfergus 59 Shore Road, Greenisland 3379 3849 A YES 1N R 16.6Carrickfergus 27 Upper Road, Greenisland 3362 3857 A 14.7Carrickfergus Islandmagee Road, Whitehead 3476 3923 A 8.6Carrickfergus 42 Albert Road Carrickfergus 3413 3876 A 14.3Carrickfergus Model PS 4 Belfast Road Carrickfergus 3408 3871 A 21.8Carrickfergus 93 Belfast Road Carrickfergus 3399 3867 A 16.8Carrickfergus Railway Station, Fergus Avenue, Carrickfergus 3412 3878 B YES 2N I 10.7Carrickfergus 32 Mullaghmore Park, Greenisland 3369 3856 C YES 3N B 6.9Carrickfergus College North Road, Carrickfergus 3411 3889 C YES 4N? B 9.7Carrickfergus 28 Bentra Road, Whitehead 3454 3919 D 6.3Carrickfergus Lough Road, Loughmourne 3412 3921 D 5.9Castlereagh Council Offices, 368 Cregagh Road, BT6 9EZ 3362 3713 A YES 1N R 16.0Castlereagh 985 Upper Newtownards Road, Dundonald 3420 3740 A NO Castlereagh 2 Newtownards Road 3352 3701 A NO Castlereagh 3 Downshire Road, Cregagh, Belfast, BT6 9 EZ 3360 3713 B YES 2N I Castlereagh Lamp Post, 17/19 Everton Drive, Castlereagh 3361 3711 C YES Castlereagh 74 Downshire Park East 3365 3714 D YES 6N B 10.0Coleraine Lower Union Street, Coleraine 2848 4328 A NO 39.7Coleraine Upper Union Street, Coleraine 2852 4328 A NO 27.9Coleraine Lodge Road, Roundabout, Coleraine 2859 4314 A NO 25.8Coleraine Bridge Street, Coleraine 2847 4325 A NO 35.3Cookstown High Street, Moneymore 2857 3834 A NO 28.7Cookstown Magherafelt Road, Moneymore 2860 3837 A NO 23.7Cookstown William Street, Cookstown 2810 3784 A NO 26.9Cookstown Drum Road, Cookstown 2806 3770 A NO 24.4Cookstown Smith Court, Moneymore 2858 3835 B NO 17.2Craigavon Castle Hardware, 7 Market Street, Portadown 3011 3537 A YES 9N R 24.0Craigavon Town Hall, Union Street, Lurgan 3083 3583 A YES 5N R 17.0Craigavon 36 Ardboe Drive, Lurgan 3081 3578 C YES 7N B 13.0Craigavon 27 Ballyhannon Road, Portadown 3031 3533 C YES 8N B 12.0Derry No 3 Creggan Road, Londonderry 2429 4172 A YES 8N R 62.0Derry 3 Glendermot Road, Londonderry 2443 4168 A YES 9N R 48.0Derry 7 Harberton Park, Londonderry 2451 4156 A NO 23.9Derry 3 Simpson Brae, Londonderry 2442 4164 A NO 31.1Derry 132a Strand Road, Londonderry 2436 4183 A NO 47.2Derry 2 Farren Park, Londonderry 2448 4188 A NO 26.7Derry 19 St Patricks Terrace, Londonderry 2435 4189 A NO 42.4Derry 34 Northland Terrace, Londonderry 2432 4188 A NO 30.9Derry 1 Temple Road, Londonderry 2476 4195 A NO 19.3Derry St Columbs Park, Limavady Road, Londonderry 2445 4173 C YES 7N I Derry Brooke Park, Infirmary Road, Londonderry 2429 4172 C YES 10N B 24.0

AEAT/ENV/R/1260 Issue 1
netcen
Table A1.2 NO2 Diffusion Tube Data for 2001 – continued; (page 3 of 3)
All grid references are to nearest 100m. Site classifications:
A = kerbside, 1-5m from the kerb of a busy road
B = intermediate site, 20-30m from the same or an equivalent road
C = urban background site, greater than 50m from any busy road
D = rural background site
E = special site; monitoring air pollution from some industrial process, etc. Annual means shown only where there are at least 6 months’ valid data.
Local Authority Location of Sampler Irish Grid E Irish Grid N Site Classification
Part of NO2
Network? NO2 Network number if applicable
NO2 Network classification
Annual mean 2001 (µ g m-3)
Derry 3 Silverbirch Crescent, Londonderry 2453 4166 C YES 11N B Down 9 Irish Street, Downpatrick, BT30 6BN 3487 3446 A YES 1N R 26.9Down High Street, Ballynahinch 3366 3523 A NO R 22.0Down Link Road, Downpatrick 3488 3448 A NO 10.9Down 2 Belfast Road, Saintfield 3406 3591 A NO 20.8Down 4 Main Street, Newcastle 3378 3316 A NO 15.5Down 5 Market Lane, Downpatrick, BT30 6TH 3486 3445 B NO 2N I 9.7Down 11 Orchard Way, Strangford Road, Downpatrick, B3489 3459 C YES 4N B 5.3Down 7 St Patrick's Drive, Downpatrick, BT30 6NR 3486 3422 C YES 3N B 7.1Dungannon Market Square, Dungannon 2798 3625 A YES 1N R 17.2Dungannon Howard Primary School, Moy Road, Dungannon 2812 3607 A YES 5N R 17.2Dungannon 4 Ardgammon, Dungannon 2796 3630 C YES 3N B 11.5Dungannon 11 Bushvale, Dungannon 2811 3623 C YES 4N B 11.5Fermanagh Town Hall, Enniskillen BT74 7BA 2235 3441 A NO Fermanagh Belmore Street, Enniskillen 2239 3440 A NO 20.4Fermanagh Lower Celtic Park, Enniskillen 2244 3435 B NO 6.9Fermanagh Everglades, Tempo Road, Enniskillen 2256 3447 B NO 5.0Fermanagh Rossole Park, Enniskillen 2230 3432 C NO 5.5Lisburn Northern Bank, 62 Bow Street, Lisburn, BT28 1BN3265 3644 A YES 1N R 24.0Lisburn 18 Kingsway, Dunmurry 3295 3689 A YES 7N R 17.0Lisburn 10 Beechlawn Park, Dunmurry 3296 3691 B NO Lisburn Antrim Road, Lisburn 3263 3646 B YES Lisburn 75 Edgewater, Lisburn 3272 3637 C YES 6N B 9.0Lisburn 22 Ventnor Park, Lambeg 3269 3620 C YES 3N B 10.0Lisburn Dunmurry High School, River Road, Dunmurry 3287 675 C NO Lisburn Main Street, Moira 3151 3606 C YES Magherafelt Queen Street, Magherafelt 2896 3905 A NO 36.3Magherafelt Church Street, Magherafelt 2897 3909 A NO 28.7Magherafelt Church Street, Magherafelt, Wesleyan Mews 2899 3907 A NO 17.2Magherafelt Main Street, Magherafelt 2853 4004 A NO 30.6Newry & Mourne 20a Water Street, Newry 3087 3266 A YES 6N R 42.0Newry & Mourne St Colmans Parochial Hall, Trevor Hill, Newry 3088 3266 A YES 10N R 36.3Newry & Mourne Monaghan Row, Newry 3078 3268 C YES 11N B 15.3Newry & Mourne 19 Balmoral Park, Newry 3084 3268 C YES 9N B 13.4Newtownabbey 49 Main Street, Ballyclare 3288 3911 A YES 32.9Newtownabbey McMillan House, 323 Antrim Road, Glengormley 3313 3825 A NO 34.0Newtownabbey Doagh Road, Abbots Cross, Newtownabbey 3346 3824 A NO 23.9Newtownabbey 168 Shore Road, Jordanstown 3347 3804 A NO 29.0Newtownabbey 168 Shore Rd, Whiteabbey 3347 3804 B YES 10N R 29.0Newtownabbey Church/Lenamore Avenue, Jordanstown 3357 3844 B NO 19.1Newtownabbey 1251 Doagh Road, Newtownabbey 3335 3845 B NO 23.9Newtownabbey 19a Newtown Gardens, Newtownabbey 3343 3800 C YES 4N B 21.0Newtownabbey 202 Carnmoney Road, Glengormley 3121 3833 C YES 17.2North Down 52 Bingham Street, Bangor 3507 3819 A YES 7N R 16.0North Down 132 Main Street, Bangor 3504 3815 A YES 6N R 16.0North Down Marine Parade, Holywood 3400 3793 A YES North Down 68 Groomsport Road, Bangor 3520 3819 C YES 4N B 10.0North Down 1 Rathmore Road, Bangor 3483 3815 C YES 8N B 11.0North Down Station Road, Cultra 3416 3800 C YES North Down Bangor Road, Seahill 3433 3808 C YES North Down Bangor Road, Ballyrobert 3450 3808 C YES Omagh 41 Dublin Road, Omagh, BT78 5EP 2456 3724 A YES 1N R Omagh Hoggs Head, 1 O'Connell Place, Omagh 2445 3725 A YES 7N R Omagh 2 Ardmore Heights, Omagh 2442 3722 C YES 5N B Omagh 16 Gortmore Gdns, Omagh 2444 3733 C YES 6N B

AEAT/ENV/R/1260 Issue 1
netcen
Table A1.3 SO2 Diffusion Tube Monitoring Sites
Site District Council Easting Northing Town Hall, Carrickfergus Carrickfergus 3415 3876
Lough Road, Loughmourne Carrickfergus 3412 3921
Castleton Park, Portstewart Coleraine * 2382 4820
Lyttlesdale, Garvagh Coleraine * 2859 4338
Drumkil Gdns., Kilrea Coleraine * 2930 4326
30 Daneshill, Coleraine Coleraine 2838 4358
11 Laurel Avenue, Coleraine Coleraine 2832 4344
6/8 Ganimore Avenue, Portrush Coleraine 2897 4364
Queens Avenue, Cookstown Cookstown 2806 3789
Greenvale Drive, Cookstown Cookstown 2806 3775 Tempo Road, Enniskillen Fermanagh 2256 3447 Rossole Park, Enniskillen Fermanagh 2230 3431
Barleyhill, Dunmurry Lisburn + 3272 3644
Ballyknockan Park, Knockmore Lisburn + 3248 3639
22 Ventnor Park, Lisburn Lisburn + 3269 3670 22 Lawnbrook Drive, Low Road, Lisburn Lisburn + 3228 3653
75 Edgewater, Lisburn Lisburn + 3272 3637
36 Credenhill Park, Dunmurry Lisburn + 3285 3696
2 Beattie Park North, Dunmurry Lisburn + 3295 3675 25a Lilac Walk, Seymour Hill, Dunmurry Lisburn + 3292 3678 8 Pine Cross, Seymour Hill, Dunmurry Lisburn + 3286 3672 4 Hornbeam Road, Seymour Hill, Dunmurry Lisburn + 3286 3674 66 Larch Grove, Seymour Hill, Dunmurry Lisburn + 3293 3678 36/38 Elm Corner, Seymour Hill, Dunmurry Lisburn + 3291 3678
Anderson Park, Doagh, Ballyclare Newtownabbey 3263 3895
Ravelston, Carnmoney Newtownabbey 3328 3841 2 Mountainvale Crescent, Glengormley Newtownabbey 3313 3823 15 Carwood Avenue, Glengormley Newtownabbey 3313 3835
57 Burnthill Crescent, Carnmoney Newtownabbey 3317 3834 13 Waverley Road, Newtownabbey Newtownabbey 3322 3842 9 Mountpleasant Road, Jordanstown Newtownabbey 3353 3845
7 Glenbroome Park, Jordanstown Newtownabbey 3361 3835
15/16 Burnside Park, Ballyclare Newtownabbey 3256 3918
22 Osterley Park, Newtownabbey Newtownabbey 3324 3825 Grid references are in 8-figure format, to nearest 100m
• * =2000 only, + = 2001 only. • All Newtownabbey sites began Dec 2001.

AEAT/ENV/R/1260 Issue 1
netcen
Appendix 2 Data from Smoke and SO2 Sites
CONTENTS Table A2.1 2000 Data Table A2.2 2001 Data The following two tables contain smoke and SO2 data from Smoke and SO2 Network sites in Northern Ireland. These pollutants are monitored simultaneously on a daily basis, using the 8-port sampler apparatus. All the sites shown are part of the Smoke and SO2 Network. Grid references are in 8-figure format, to the nearest 100m. There are a further two sites of this type which are not part of the Network: annual mean smoke and SO2 concentrations for these are presented in the main report.

AEAT/ENV/R/1260 Issue 1
netcen
Table A2.1 Summary of Smoke and SO2 Results for Northern Ireland, Calendar Year 2000. All concentrations in µµµµg m-3.
Data Arith. Max. Data Arith. Max.Code Site Name Authority East North Capt. % Mean Median 98th%ile Day Capt. % Mean Median 98th%ile Day
NORTHERN IRELAND69701 ARMAGH 1 Armagh 2877 3450 84 7 4 27 67 84 11 13 21 28160003 BALLYMENA 3 Ballymena 3103 4029 92 7 5 45 118 90 30 24 74 89161504 BALLYMONEY 4 Ballymoney 2954 4259 5 15 10 44 49 4 0270012 BELFAST 12 Belfast 3324 3737 99 9 6 37 50 99 19 18 47 55270013 BELFAST 13 Belfast 3357 3740 100 9 8 33 48 100 40 38 83 166270033 BELFAST 33 Belfast 3346 3755 100 12 9 40 68 100 42 38 85 115270042 BELFAST 42 Belfast 3322 3748 100 10 8 36 88 100 42 38 81 172270044 BELFAST 44 Belfast 3338 3740 100 9 7 28 68 100 39 38 81 153270045 BELFAST 45 Belfast 3335 3723 100 8 7 31 51 100 37 32 77 128270046 BELFAST 46 Belfast 3803 3334 100 6 4 19 79 100 31 26 64 1402551504 PORTADOWN 4 Craigavon 3012 3538 64 6 4 21 25 64 8 6 18 242190011 LONDONDERRY 11 Derry 2431 4170 17 17 13 56 72 17 35 32 50 552190012 LONDONDERRY 12 Derry 2438 4200 67 5 4 15 39 86 36 38 51 582190014 LONDONDERRY 14 Derry 2443 4174 70 6 4 19 41 90 36 33 66 1201025001 DUNGANNON 1 Dungannon 2802 3629 46 5 4 12 40 40 16 14 35 351757703 LARNE 3 Larne 3400 4029 96 11 9 34 59 96 17 18 25 251032502 DUNMURRY 2 Lisburn 3289 3679 90 8 6 34 76 86 82 74 188 2501032503 DUNMURRY 3 Lisburn 3287 3875 79 11 7 47 81 74 19 18 49 551845003 LISBURN 3 Lisburn 3263 3636 90 11 7 62 118 87 17 14 49 702233501 MAGHERAFELT 1 Magherafelt 2896 3901 98 11 8 42 62 98 12 13 20 332410003 NEWRY 3 Newry and Mourne 3078 3268 96 10 6 62 142 96 10 6 30 332412501 NEWTOWNABBEY 1 Newtownabbey 3349 3824 88 14 9 46 70 88 13 12 24 422412502 NEWTOWNABBEY 2 Newtownabbey 3318 3825 99 15 11 50 96 99 12 13 25 383111502 STRABANE 2 Strabane 2351 3972 88 27 23 76 129 87 12 13 21 28
Grid Ref. To100m
Irish Summary of Smoke Data 2000 Summary of SO2 Data 2000

AEAT/ENV/R/1260 Issue 1
netcen
Table A2.2 Summary of Smoke and SO2 Results for Northern Ireland, Calendar Year 2001. All concentrations in µµµµg m-3.
Data Arith. 98th Max. Data Arith. 98th Max.Code Site name Authority East North Capt. % Mean Median %ile Day Capt. % Mean Median %ile Day
NORTHERN IRELAND69701 ARMAGH 1 Armagh 2877 3450 61 9 7 38 55 60 16 14 25 28
1637001 KEADY 1 Armagh 2845 3341 73 8 7 27 71 71 3 0 12 19160003 BALLYMENA 3 Ballymena 3103 4029 70 8 4 40 64 69 28 30 60 78161504 BALLYMONEY 4 Ballymoney 2954 4259 100 17 11 70 303 100 13 13 20 40270012 BELFAST 12 Belfast 3324 3737 96 10 6 62 113 96 18 13 63 87270013 BELFAST 13 Belfast 3357 3740 100 10 7 43 112 100 38 38 96 160270033 BELFAST 33 Belfast 3346 3755 98 13 9 49 124 98 43 38 120 160270042 BELFAST 42 Belfast 3322 3748 100 10 7 43 92 100 41 38 102 160270044 BELFAST 44 Belfast 3338 3740 98 6 4 19 55 98 33 32 58 141270045 BELFAST 45 Belfast 3335 3723 100 9 7 33 113 100 36 32 70 134270046 BELFAST 46 Belfast 3803 3334 100 6 4 23 43 100 29 26 58 134
2551504 PORTADOWN 4 Craigavon 3012 3538 86 8 5 37 67 79 9 6 24 242190012 LONDONDERRY 12 Derry 2438 4200 34 8 5 34 42 31 26 25 71 1182190014 LONDONDERRY 14 Derry 2443 4174 32 9 6 29 58 29 18 13 47 671025001 DUNGANNON 1 Dungannon 2802 3629 60 5 4 11 13 59 15 13 30 491757703 LARNE 3 Larne 3400 4029 96 9 6 34 79 96 18 19 25 321032502 DUNMURRY 2 Lisburn 3289 3679 10 15 13 44 49 10 27 27 50 581032503 DUNMURRY 3 Lisburn 3287 3875 80 11 6 61 185 79 20 20 50 581845003 LISBURN 3 Lisburn 3263 3636 93 16 8 87 221 93 17 13 41 633325001 TWINBROOK 1 Lisburn 3281 3689 94 11 6 49 209 92 20 20 50 742233501 MAGHERAFELT 1 Magherafelt 2896 3901 94 9 5 56 76 96 13 13 26 322410003 NEWRY 3 Newry and Mourne 3078 3268 83 11 5 74 164 85 8 6 20 252412501 NEWTOWNABBEY 1 Newtownabbey 3349 3824 94 9 5 40 68 94 13 12 25 492412502 NEWTOWNABBEY 2 Newtownabbey 3318 3825 96 10 6 45 91 96 15 13 25 442412503 NEWTOWNABBEY 3 Newtownabbey 3321 3851 5 8 5 23 25 5 7 6 13 13165005 BANGOR (CO DOWN) 5 North Down 3497 3810 59 16 8 77 158 59 11 12 23 48
1517501 HOLYWOOD 1 North Down 3397 3784 59 6 4 23 30 59 11 12 19 253111502 STRABANE 2 Strabane 2351 3972 89 34 26 114 249 89 12 13 26 67
100mIrish Grid Ref to Summary of Smoke Data 2001 Summary of SO2 Data 2001