air quality progress report 2013 - manchester.gov.uk
TRANSCRIPT
2013/14 Air Quality Progress Report for Greater Manchester In fulfillment of Part IV of the Environment Act 1995 Local Air Quality Management Date: December 2014
Greater Manchester Combined Authority
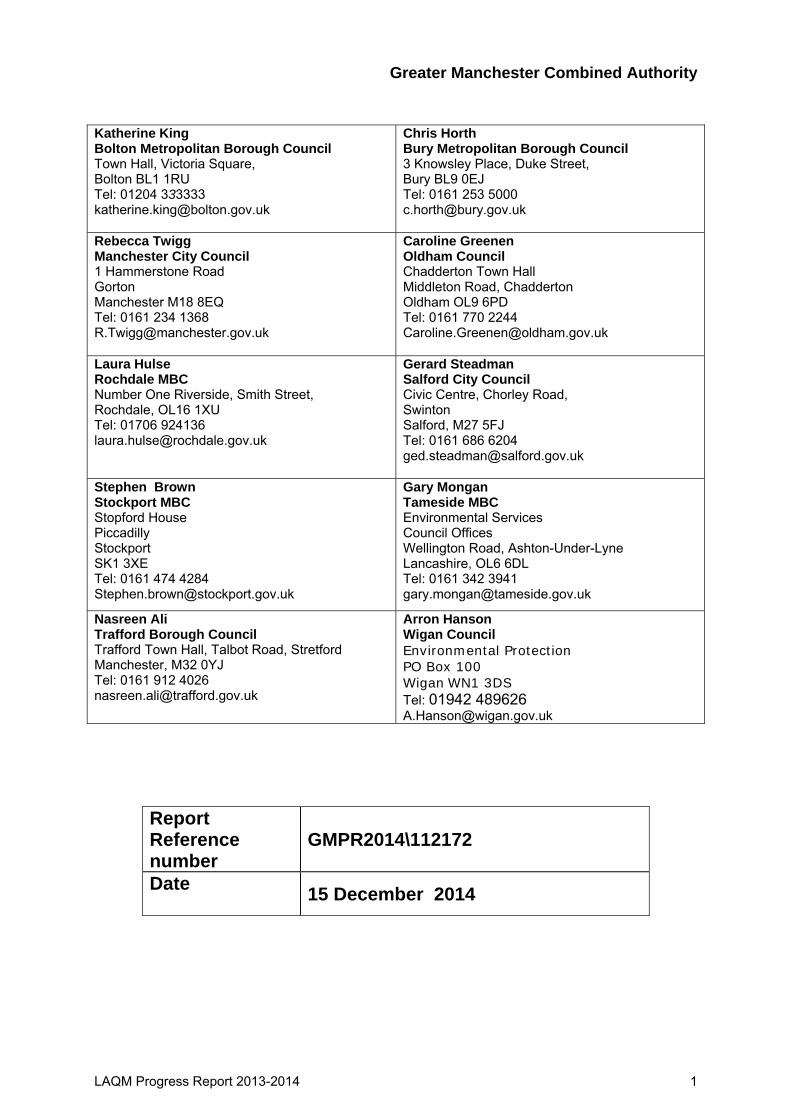
Katherine King Bolton Metropolitan Borough Council Town Hall, Victoria Square, Bolton BL1 1RU Tel: 01204 333333 [email protected]
Chris Horth Bury Metropolitan Borough Council 3 Knowsley Place, Duke Street, Bury BL9 0EJ Tel: 0161 253 5000 [email protected]
Rebecca Twigg Manchester City Council 1 Hammerstone Road Gorton Manchester M18 8EQ Tel: 0161 234 1368 [email protected]
Caroline Greenen Oldham Council Chadderton Town Hall Middleton Road, Chadderton Oldham OL9 6PD Tel: 0161 770 2244 [email protected]
Laura Hulse Rochdale MBC Number One Riverside, Smith Street, Rochdale, OL16 1XU Tel: 01706 924136 [email protected]
Gerard Steadman Salford City Council Civic Centre, Chorley Road, Swinton Salford, M27 5FJ Tel: 0161 686 6204 [email protected]
Stephen Brown Stockport MBC Stopford House Piccadilly Stockport SK1 3XE Tel: 0161 474 4284 [email protected]
Gary Mongan Tameside MBC Environmental Services Council Offices Wellington Road, Ashton-Under-Lyne Lancashire, OL6 6DL Tel: 0161 342 3941 [email protected]
Nasreen Ali Trafford Borough Council Trafford Town Hall, Talbot Road, Stretford Manchester, M32 0YJ Tel: 0161 912 4026 [email protected]
Arron Hanson Wigan Council Environmental Protection PO Box 100 Wigan WN1 3DS Tel: 01942 489626 [email protected]
Report Reference number
GMPR2014\112172
Date 15 December 2014
LAQM Progress Report 2013-2014 1

Greater Manchester Combined Authority
Executive Summary
This report is for the Greater Manchester districts Bury, Bolton, Manchester, Oldham,
Rochdale, Salford, Stockport, Tameside, Trafford and Wigan.
It is the second report for the ten districts. Previous progress reports were prepared
and submitted separately by the constituent authorities, although these authorities
have successfully worked closely together drafting previous district reports.
Long term trends shown that there has been an improvement in air quality but areas
still remain above the air quality objective for the annual mean nitrogen dioxide
The assessment of monitoring data shows that real time monitoring data for the
nitrogen dioxide annual mean objective broadly confirms the existing AQMA
boundaries. Exceedences were noted at several roadside monitoring sites.
Measurements from the Greater Manchester’s diffusion tube network confirms there
are locations that continue to be above the annual mean nitrogen dioxide. There are
no exceedences of the hourly nitrogen dioxide objective.
Real time monitoring data for particulate matter (less than 10 microns) shows that
annual average objectives are not exceeded and are following a downward trend. No
sites had more than 35 occurrences of the daily mean particulate objective and
therefore this objective is met.
Reporting of pollutants, sulphur dioxide, carbon monoxide and benzene, has been
discontinued as previous assessments, indicated no exceedences.
LAQM Progress Report 2013-2014 2
Greater Manchester Combined Authority
Table of Contents
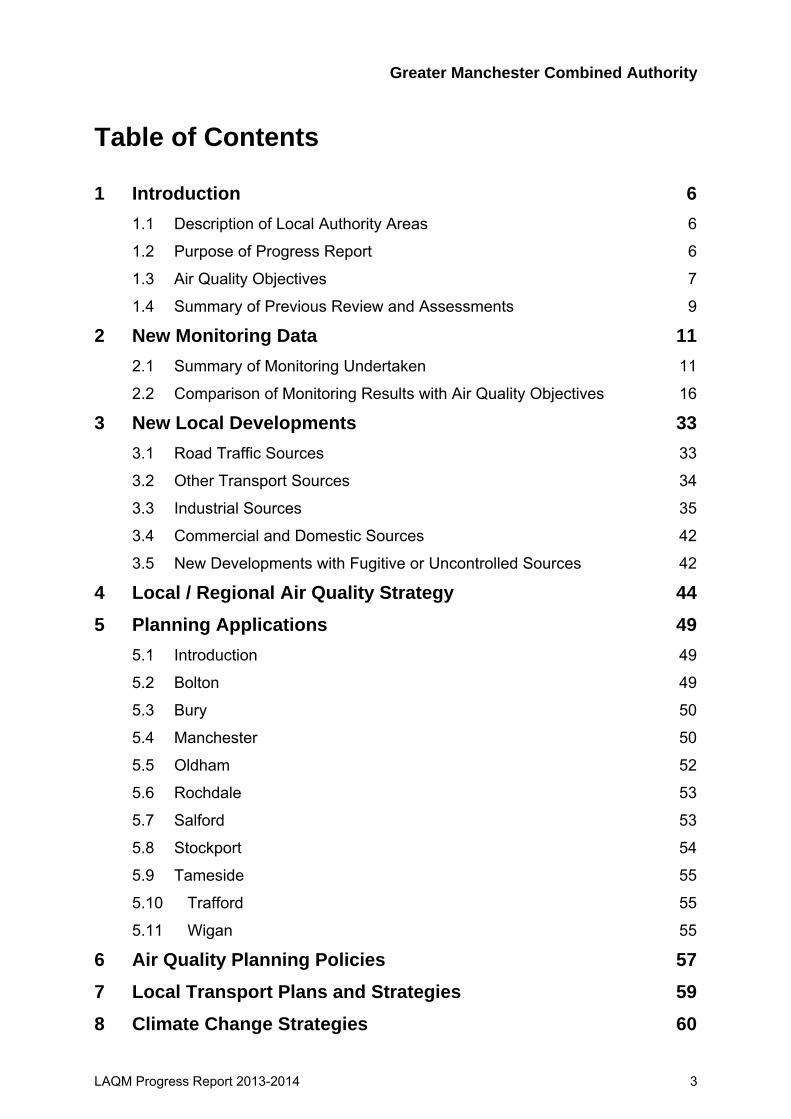
1 Introduction 6
1.1 Description of Local Authority Areas 6
1.2 Purpose of Progress Report 6
1.3 Air Quality Objectives 7
1.4 Summary of Previous Review and Assessments 9
2 New Monitoring Data 11
2.1 Summary of Monitoring Undertaken 11
2.2 Comparison of Monitoring Results with Air Quality Objectives 16
3 New Local Developments 33
3.1 Road Traffic Sources 33
3.2 Other Transport Sources 34
3.3 Industrial Sources 35
3.4 Commercial and Domestic Sources 42
3.5 New Developments with Fugitive or Uncontrolled Sources 42
4 Local / Regional Air Quality Strategy 44
5 Planning Applications 49
5.1 Introduction 49
5.2 Bolton 49
5.3 Bury 50
5.4 Manchester 50
5.5 Oldham 52
5.6 Rochdale 53
5.7 Salford 53
5.8 Stockport 54
5.9 Tameside 55
5.10 Trafford 55
5.11 Wigan 55
6 Air Quality Planning Policies 57
7 Local Transport Plans and Strategies 59
8 Climate Change Strategies 60
LAQM Progress Report 2013-2014 3
Greater Manchester Combined Authority
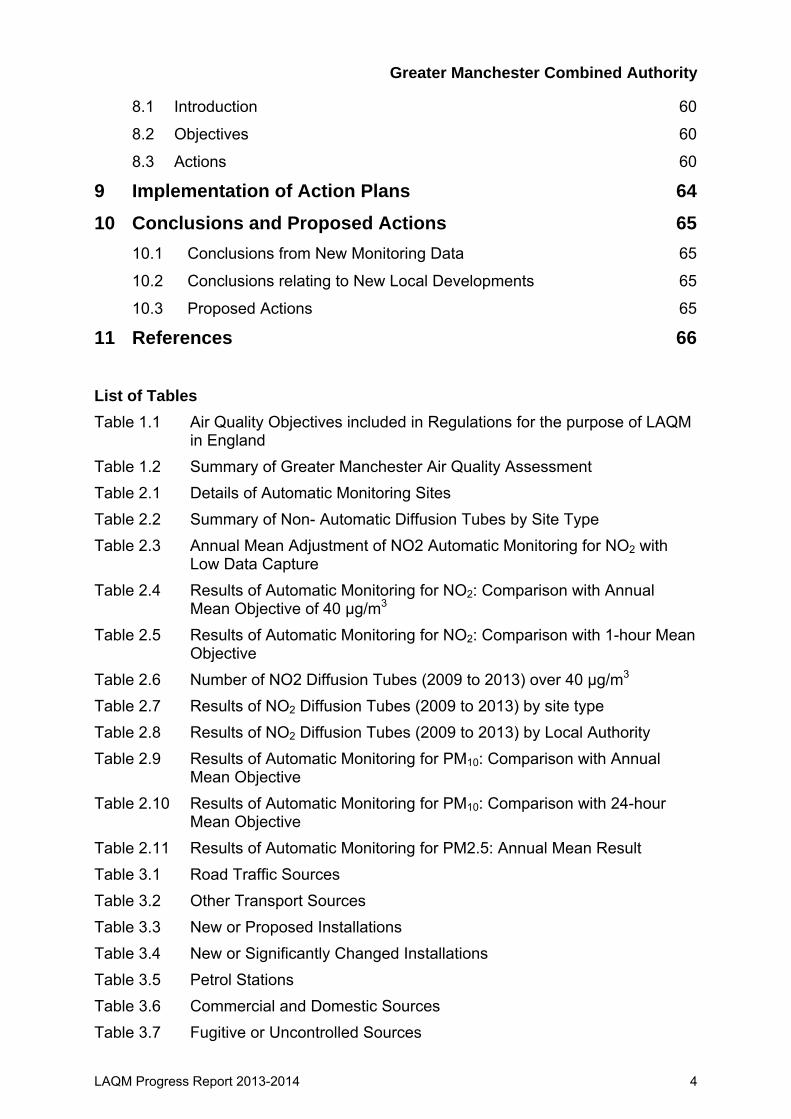
8.1 Introduction 60
8.2 Objectives 60
8.3 Actions 60
9 Implementation of Action Plans 64
10 Conclusions and Proposed Actions 65
10.1 Conclusions from New Monitoring Data 65
10.2 Conclusions relating to New Local Developments 65
10.3 Proposed Actions 65
11 References 66
List of Tables Table 1.1 Air Quality Objectives included in Regulations for the purpose of LAQM
in England Table 1.2 Summary of Greater Manchester Air Quality Assessment Table 2.1 Details of Automatic Monitoring Sites Table 2.2 Summary of Non- Automatic Diffusion Tubes by Site Type Table 2.3 Annual Mean Adjustment of NO2 Automatic Monitoring for NO2 with
Low Data Capture Table 2.4 Results of Automatic Monitoring for NO2: Comparison with Annual
Mean Objective of 40 µg/m3 Table 2.5 Results of Automatic Monitoring for NO2: Comparison with 1-hour Mean
Objective Table 2.6 Number of NO2 Diffusion Tubes (2009 to 2013) over 40 µg/m3
Table 2.7 Results of NO2 Diffusion Tubes (2009 to 2013) by site type Table 2.8 Results of NO2 Diffusion Tubes (2009 to 2013) by Local Authority Table 2.9 Results of Automatic Monitoring for PM10: Comparison with Annual
Mean Objective Table 2.10 Results of Automatic Monitoring for PM10: Comparison with 24-hour
Mean Objective Table 2.11 Results of Automatic Monitoring for PM2.5: Annual Mean Result Table 3.1 Road Traffic Sources Table 3.2 Other Transport Sources Table 3.3 New or Proposed Installations Table 3.4 New or Significantly Changed Installations Table 3.5 Petrol Stations Table 3.6 Commercial and Domestic Sources Table 3.7 Fugitive or Uncontrolled Sources
LAQM Progress Report 2013-2014 4
Greater Manchester Combined Authority
Table A1.1 2013 Summary of 2012 and 2013 Bias Factors Table A1.2 Network Monthly Means and Annual Mean Table A1.3 2013 Bias Adjustment - National & Local Factors Table A1.4 2012 Bias Adjustment - National & Local Factors Table A1.5 Bias Adjustment Factors 2007-2011 Table A1.6 AURN Sites used NO2 and PM10* Annual Adjustment of 2012 and
2013 Data Table A1.7 NO2 and PM10 Annual Adjustment Factors 2012 and 2013 Data Table A2.1 Monitoring Data Tables Table A2.2 Site Mapping Table A2.3 Site Classifications List of Figures Figure 1.1 Greater Manchester AQMA Boundaries (nitrogen dioxide, annual mean) Figure 2.1 Map of Automatic Monitoring Sites Figure 2.2 Map of Non-Automatic Monitoring Sites Figure 2.3 Trends in Annual Mean NO2 Concentrations Measured at Automatic
Monitoring Sites Figure 2.4 Trends in Annual Mean NO2 Concentrations Measured at Automatic
Monitoring by Site Classification Figure 2.5 Trends in Annual Mean Nitrogen Dioxide Concentrations Measured at
Diffusion Tube Monitoring Sites
Figure 2.6 Annual Mean Nitrogen Dioxide Concentrations Measured at Diffusion Tube Monitoring Sites for 2013
Figure 2.7 Trends in Annual Mean PM10 Concentrations Figure A1.1 Comparison of Annual Factors Figure A1.2 2013 Annual plots of Background Sites AURN used for Annual Factor
(BGS13) Figure A1.2b 2012 Annual plots of AURN Background Sites used for Annual Factor
(BGS12) Appendices
Appendix 1 QA/QC Appendix 2 Monitoring Data Appendix 3 Local Authority Air Quality Planning Policies
LAQM Progress Report 2013-2014 5
Greater Manchester Combined Authority
1 Introduction
1.1
1.2
Description of Local Authority Areas The Greater Manchester regional pollution group represents the ten authorities that
constitute the Greater Manchester Combined Authority (GMCA). These authorities
are Bolton, Bury, Manchester, Oldham, Rochdale, Salford, Stockport, Tameside,
Trafford, and Wigan. These are also the main members of the Association of Greater
Manchester Authorities (AGMA). The Combined Authority, shares the same statutory
powers for Local Air Quality Management (LAQM) Sections 82 to 84 of the
Environment Act 1995 as the districts.
Greater Manchester has a population of over 2.5 million residents over an area of
approximately 500 square miles. Within the conurbation there is a mix of high-density
urban areas, suburbs, semi-rural and rural locations, and the area is characterised by
the strong regional centre of Manchester, The Quays and Trafford Park.
Greater Manchester is the largest and strongest economic area in the North of the
country, with over 40% of the North West’s total productivity. However despite this, it
contains some of the most deprived areas in the country.
There are over 9,000 km of roads, carrying annual traffic of 13,000 vehicle kilometres
on the motorways and A and B roads. Manchester Airport is the largest regional
centre outside London. The M62 sits on the edge of the conurbation as it forms the
East – West main route, serving Liverpool and Hull. The M60 orbital route
encompasses Greater Manchester is over 36 miles in length, annual average
weekday traffic flows are over 200,000 and the network is often congested at peak
times. Other major motorways are the M6, M56, M61, and M66.
Purpose of Progress Report This report fulfils the requirements of the Local Air Quality Management process as
set out in Part IV of the Environment Act (1995), the Air Quality Strategy for England,
LAQM Progress Report 2013-2014 6
Greater Manchester Combined Authority
Scotland, Wales and Northern Ireland 2007 and the relevant Policy and Technical
Guidance documents. The LAQM process places an obligation on all local authorities
to regularly review and assess air quality in their areas, and to determine whether or
not the air quality objectives are likely to be achieved. Where exceedences are
considered likely, the local authority must then declare an Air Quality Management
Area (AQMA) and prepare an Air Quality Action Plan (AQAP) setting out the
measures it intends to put in place in pursuit of the objectives.
Progress Reports are required in the intervening years between the three-yearly
Updating and Screening Assessment reports. Their purpose is to maintain continuity
in the Local Air Quality Management process.
They are not intended to be as detailed as Updating and Screening Assessment
Reports, or to require as much effort. However, if the Progress Report identifies the
risk of exceedence of an Air Quality Objective, the Local Authority (LA) should
undertake a Detailed Assessment immediately, and not wait until the next round of
Review and Assessment.
1.3 Air Quality Objectives The air quality objectives applicable to LAQM in England are set out in the Air
Quality (England) Regulations 2000 (SI 928), The Air Quality (England) (Amendment)
Regulations 2002 (SI 3043), and are shown in Table 1.1. This table shows the
objectives in units of microgrammes per cubic metre µg/m3 (milligrammes per cubic
metre, mg/m3 for carbon monoxide) with the number of exceedences in each year
that are permitted (where applicable).
LAQM Progress Report 2013-2014 7

Greater Manchester Combined Authority
Table 1.1 Air Quality Objectives included in Regulations for the purpose of LAQM in England
Air Quality Objective Pollutant Concentration Measured as Date to be
achieved by
16.25 µg/m3 Running annual mean 31.12.2003
Benzene 5.00 µg/m3 Annual mean 31.12.2010
1,3-Butadiene 2.25 µg/m3 Running annual mean 31.12.2003
Carbon monoxide 10 mg/m3 Running 8-hour mean 31.12.2003
0.50 µg/m3 Annual mean 31.12.2004 Lead
0.25 µg/m3 Annual mean 31.12.2008 200 µg/m3 not to be
exceeded more than 18 times a
year
1-hour mean 31.12.2005 Nitrogen dioxide
40 µg/m3 Annual mean 31.12.2005 50 µg/m3, not to be
exceeded more than 35 times a
year
24-hour mean 31.12.2004 Particulate Matter (PM10)
(gravimetric) 40 µg/m3 Annual mean 31.12.2004
350 µg/m3, not to be exceeded more
than 24 times a year
1-hour mean 31.12.2004
125 µg/m3, not to be exceeded more than 3 times a year
24-hour mean 31.12.2004 Sulphur dioxide
266 µg/m3, not to be exceeded more
than 35 times a year
15-minute mean 31.12.2005
LAQM Progress Report 2013-2014 8
Greater Manchester Combined Authority
LAQM Progress Report 2013-2014 9
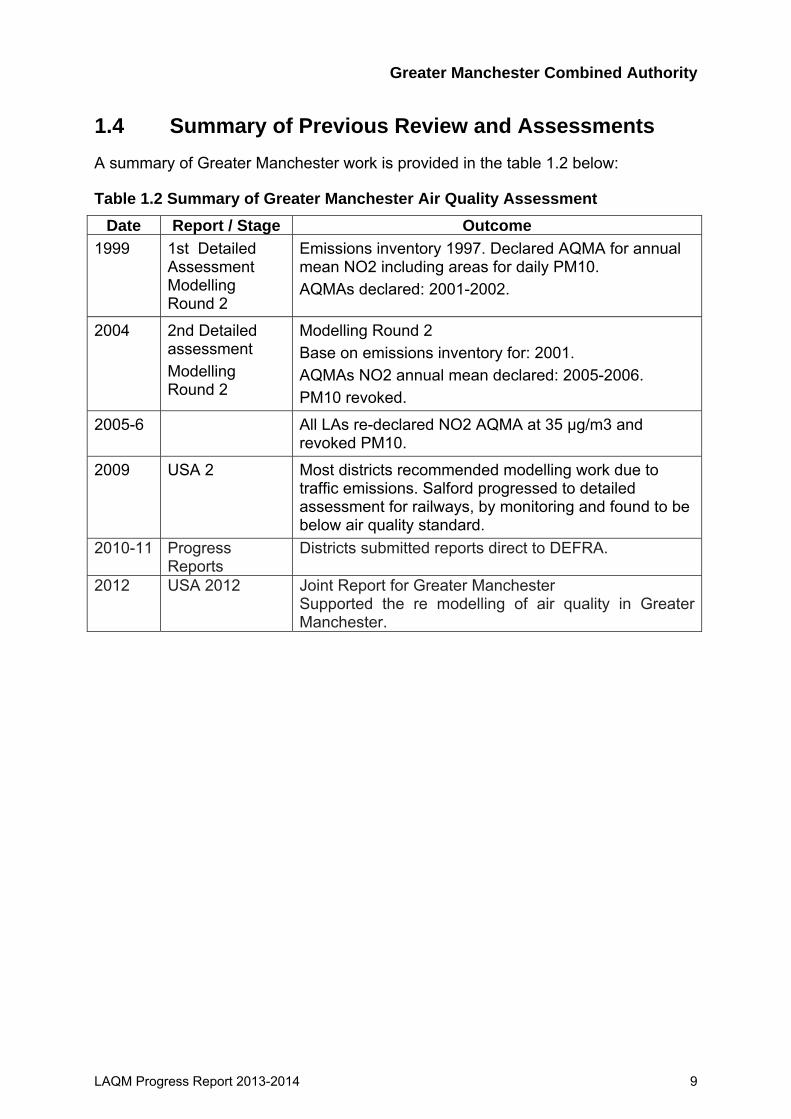
1.4 Summary of Previous Review and Assessments A summary of Greater Manchester work is provided in the table 1.2 below:
Table 1.2 Summary of Greater Manchester Air Quality Assessment Date Report / Stage Outcome
1999 1st Detailed Assessment Modelling Round 2
Emissions inventory 1997. Declared AQMA for annual mean NO2 including areas for daily PM10. AQMAs declared: 2001-2002.
2004 2nd Detailed assessment Modelling Round 2
Modelling Round 2 Base on emissions inventory for: 2001. AQMAs NO2 annual mean declared: 2005-2006. PM10 revoked.
2005-6 All LAs re-declared NO2 AQMA at 35 µg/m3 and revoked PM10.
2009 USA 2 Most districts recommended modelling work due to traffic emissions. Salford progressed to detailed assessment for railways, by monitoring and found to be below air quality standard.
2010-11 Progress Reports
Districts submitted reports direct to DEFRA.
2012 USA 2012 Joint Report for Greater Manchester Supported the re modelling of air quality in Greater Manchester.

Greater Manchester Combined Authority
LAQM Progress Report 2013-2014 10
Figure 1.1 Greater Manchester AQMA Boundaries (nitrogen dioxide, annual mean)
Greater Manchester Combined Authority
LAQM Progress Report 2013-2014 11
2.1
2 New Monitoring Data Summary of Monitoring Undertaken
2.1.1 Automatic Monitoring Sites
Local Authorities carry out air quality monitoring programmes as part of their local air
quality management responsibilities under the Environment Act 1995. The Greater
Manchester Air Quality Network (GMAQN) was formed in 2013 to manage and
provide a cost effective platform for the service, maintenance and data management
of the monitoring equipment in the Greater Manchester Area. The network costs are
shared equally among the 10 local authorities. DEFRA supports monitoring of some
stations as part of the Automatic and Urban Rural Network (AURN).
The Greater Manchester authorities reviewed the automatic monitoring program in
2011 to ensure the network met future monitoring needs, to provide best value and
help maintain key sites in the network. The review resulted in the decommissioning of
a number of sulphur dioxide and carbon monoxide instruments. It also recommended
a station for nitrogen dioxide and particulates to the north eastern side of Greater
Manchester, which was commissioned in early 2014.
GMAQN and DEFRA, ensure that QA/QC checks and data validation of sites in the
network are undertaken by external contractors to ensure that the objectives in the
European Union’s Air Quality Directive (2008/50/EC) are fulfilled. Ricardo–AEA
provide data management and auditing for sites in the GMAQN. Data management
at the AURN sites is undertaken by Bureau Veritas with Ricardo-AEA undertaking
QA/QC audits. Prior to the formation of GMAQN some site data management was
undertaken by Casella and then Bureau Veritas.
The results for the automatic sites in this report are based on the Ricardo-AEA
spreadsheet, with additional data from districts, which is available on the
Greatairmanchester website. Further details of data management are provided in
Appendix 1. Table 2.1 and Figure 2.1 summarise the details of automatic sites in
Greater Manchester operational during the period of the report.

Greater Manchester Combined Authority
LAQM Progress Report 2013-2014 12
Table 2.1 Details of Automatic Monitoring Sites Site Code Site Name Pollutants Type X(TfGM) Y(TfGM) AQMA Open Closed Map BOLT Bolton College CO NO2 O3 PM10 SO2 UB 371000 408496 N 03/02/1998 22/03/2011 Link
BURY Bury Roadside CO NO2 PM10(F) PM25(F) RS 380906 404757 Y 20/01/1997 06/09/2012 Link
BUWF Bury Roadside 2 (See note) NO2 PM10 (F) PM2.5(F) RS 380637 406976 Y Oct-14 Link
BUR2 Bury Prestwich NO2 PM10 RS 381650 403222 Y 19/09/2002 Link
BUR1 Bury Radcliffe NO2 PM10 RO 378190 407480 Y 01/09/2002 Link
GLAZ Glazebury NO2 O3 RU 368759 396028 N 26/01/2004 Link
MAN3 MAN7 Manchester Piccadilly NO2 O3 PM10(B) PM25(F) SO2 UC 384310 398337 Y 18/12/1995 Link
MAN4 MAN8 Manchester South NO2 O3 SO2 PM10(P) PM2.5(P) SU 383904 385818 N 06/12/1996 Link
ECCL Salford Eccles NO2 O3 PM10(F) PM25(F) UI 377926 398728 Y 20/03/1997 Link
WIG5 WIG7 Wigan Centre NO2 O3 PM25; PM10 UB 357815 406022 N 08/10/2004 Link
MAN1 Manchester Oxford Rd NO2 PM10 (B) KS 384233 397287 Y 08/03/2010 Link
OLDH Oldham West End Huse CO NO2 O3 PM10 SO2 UC 391860 405514 Y 04/12/1998 05/07/2011 Link
CW Oldham Crompton Way NO2 PM10(B) RS 393887 409191 Y Feb-14 Link
M60 Salford M60 CO NO2 O3 PM10 RS 374810 400855 Y 01/01/1999 Link
STK5 Stockport Hazel Grv NO2 PM10 RS 391481 387637 Y 12/04/2005 Link
STK4 STK6 Stockport Shaw Health NO2 PM10 UB 389384 389605 Y 09/10/2002 06/02/2011 Link
TAM1 Tameside Mottram M’r NO2 PM10 RS 399719 395804 Y Link
TAME Tameside Two Trees Sch NO2 O3 PM10 UB 393454 394330 N 09/12/1998 Link
TRAF Trafford NO2 PM10 SO2 UB 378783 394726 N 01/11/1998 Link
TRF2 Trafford A56 NO2 PM10 RS 379413 394014 Y 30/09/2004 Link
WIG6 Wigan Leigh 2 NO2 PM10 UB 366290 399861 N 01/01/2006 10/08/2012 Link
Notes: F: FDMS, P:Partisol; Roadside (RS), Kerbside (KS), Rural (RU), Urban Background(UB), Suburban, (SU), Urban industrial (UI), Urban Background (UB )and Urban Centre (UC) Source: GMAQN\Automatic\GIS\GMAQNSites.xlsx

Greater Manchester Combined Authority
LAQM Progress Report 2013-2014 13
Figure 2.1 Map of Automatic Monitoring Sites

Greater Manchester Combined Authority
LAQM Progress Report 2013-2014 14
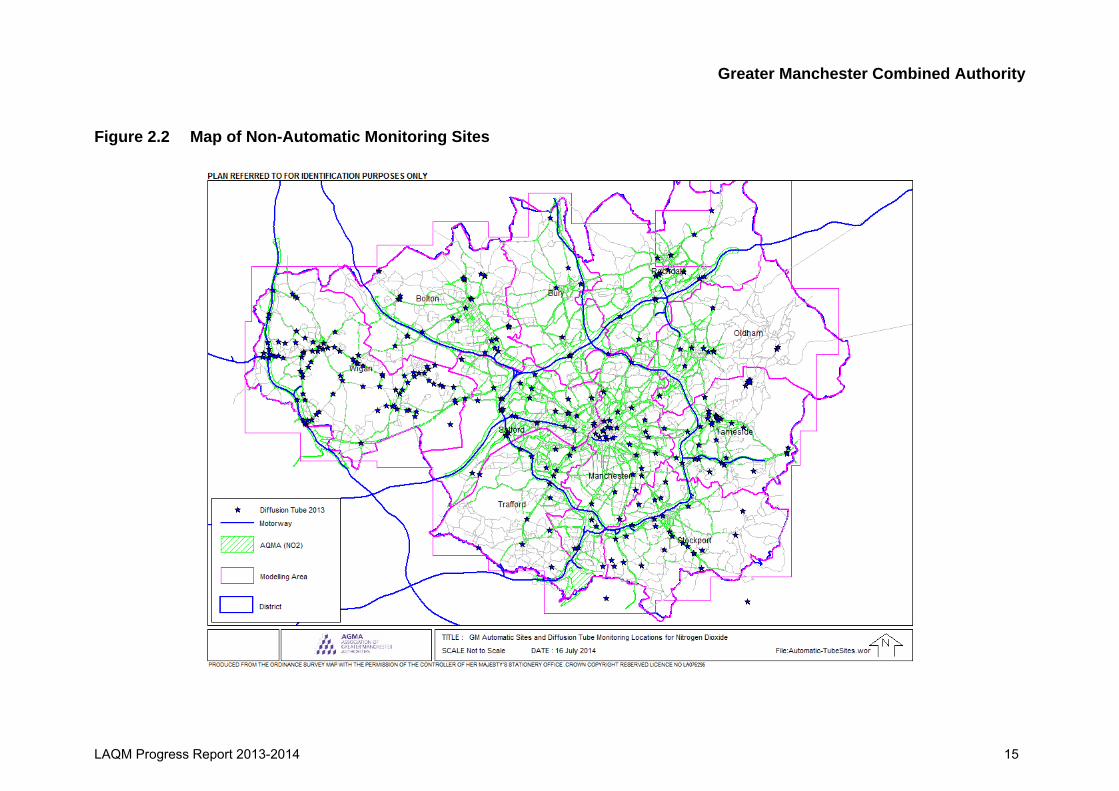
2.1.2 Non-Automatic Monitoring Sites
Details of Non-Automatic Monitoring Sites are listed in Appendix 2. Non automatic
monitoring network using nitrogen dioxide diffusion tubes supports the information
from automatic stations providing annual means and a larger data set for trend
analysis across various site environments. The following information has been
collated from the 10 districts using previous reports from their own data sets for the
period 2007 to 2010. If you require further information about specific aspects of
diffusion tube monitoring please contact the local authority directly. From 2011 the
diffusion tube data are processed as a single data set with single bias factor for each
year.
Table 2.2 summarises the site types in the Greater Manchester by district. The site
classification types are summarised using the DEFRA site criteria Roadside (Rs),
Kerbside (Ks), Rural (RU), Urban Background (UB), Suburban, (Su), and Urban
Centre (UC). See Technical Guidance LAQM.TG(09) page 160. Figure 2.2 shows the
monitoring locations in Greater Manchester for tubes reported in 2013.
Table 2.2 Summary of Non- Automatic Diffusion Tubes by Site Type
District Kerbside Roadside Rural Suburban Urban Background
Urban Centre Total
Bolton 2 7 12 1 22Bury 2 3 3 8Manchester 9 7 2 9 4 31Oldham 1 2 4 7Rochdale 9 1 4 2 16Salford 2 19 8 29Stockport 9 2 15 1 27Tameside 5 24 3 8 40Trafford 2 4 1 3 6 16Wigan 70 3 1 74Total 23 154 4 5 69 15 270
Greater Manchester Combined Authority
LAQM Progress Report 2013-2014 15
Figure 2.2 Map of Non-Automatic Monitoring Sites
Greater Manchester Combined Authority
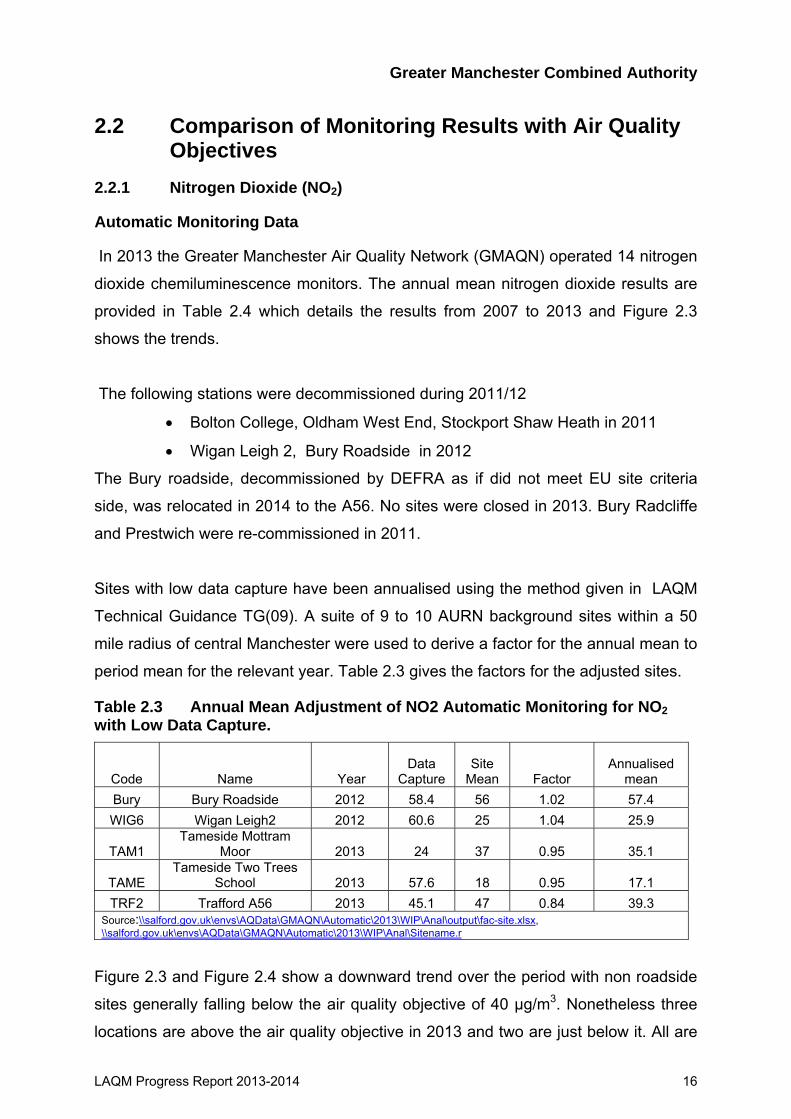
2.2 Comparison of Monitoring Results with Air Quality Objectives
2.2.1 Nitrogen Dioxide (NO2)
Automatic Monitoring Data
In 2013 the Greater Manchester Air Quality Network (GMAQN) operated 14 nitrogen
dioxide chemiluminescence monitors. The annual mean nitrogen dioxide results are
provided in Table 2.4 which details the results from 2007 to 2013 and Figure 2.3
shows the trends.
The following stations were decommissioned during 2011/12
• Bolton College, Oldham West End, Stockport Shaw Heath in 2011
• Wigan Leigh 2, Bury Roadside in 2012
The Bury roadside, decommissioned by DEFRA as if did not meet EU site criteria
side, was relocated in 2014 to the A56. No sites were closed in 2013. Bury Radcliffe
and Prestwich were re-commissioned in 2011.
Sites with low data capture have been annualised using the method given in LAQM
Technical Guidance TG(09). A suite of 9 to 10 AURN background sites within a 50
mile radius of central Manchester were used to derive a factor for the annual mean to
period mean for the relevant year. Table 2.3 gives the factors for the adjusted sites.
Table 2.3 Annual Mean Adjustment of NO2 Automatic Monitoring for NO2 with Low Data Capture.
Code Name Year Data
Capture Site
Mean Factor Annualised
mean Bury Bury Roadside 2012 58.4 56 1.02 57.4 WIG6 Wigan Leigh2 2012 60.6 25 1.04 25.9
TAM1 Tameside Mottram
Moor 2013 24 37 0.95 35.1
TAME Tameside Two Trees
School 2013 57.6 18 0.95 17.1 TRF2 Trafford A56 2013 45.1 47 0.84 39.3
Source:\\salford.gov.uk\envs\AQData\GMAQN\Automatic\2013\WIP\Anal\output\fac-site.xlsx, \\salford.gov.uk\envs\AQData\GMAQN\Automatic\2013\WIP\Anal\Sitename.r
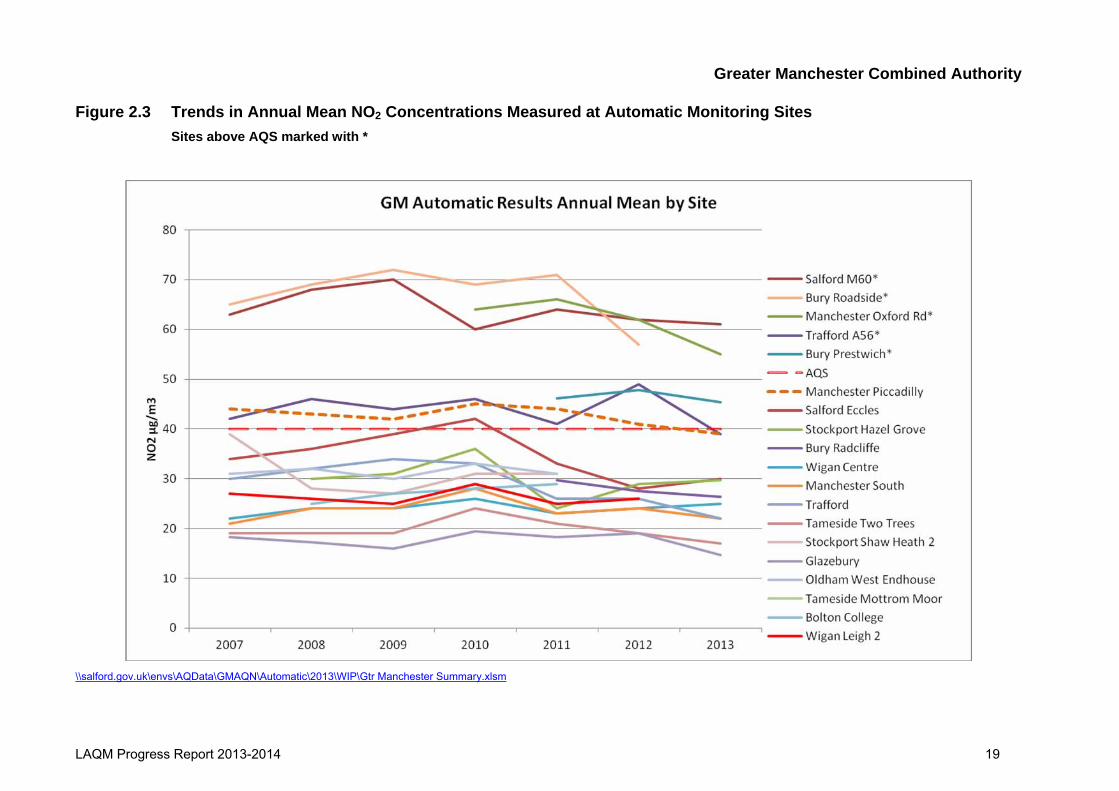
Figure 2.3 and Figure 2.4 show a downward trend over the period with non roadside
sites generally falling below the air quality objective of 40 µg/m3. Nonetheless three
locations are above the air quality objective in 2013 and two are just below it. All are
LAQM Progress Report 2013-2014 16
Greater Manchester Combined Authority
LAQM Progress Report 2013-2014 17
in the AQMA. Salford M60 recorded the highest concentration at 61 µg/m3 (88%
data capture) and has remained fairly constant from 2010. The air quality station is a
motorway site with some of the highest traffic flows on the M60 carrying traffic
between Liverpool and Hull. Manchester Oxford Road is the second highest site with
55µg/m3; compared to 2012 there has been a fall of 7 µg/m3 in the roadside levels.
Oxford road is one of the main corridors from south Manchester in to the city centre
with two major Universities, student accommodation and a teaching hospital making
it one of the busiest commuter routes in Europe with a high proportion of buses.
Four automatic sites are in the AQMA with concentrations ranges between 26 µg/m3
to 35 µg/m3. For sites outside the AQMA, concentrations range from 15 µg/m3 to 25
µg/m3.
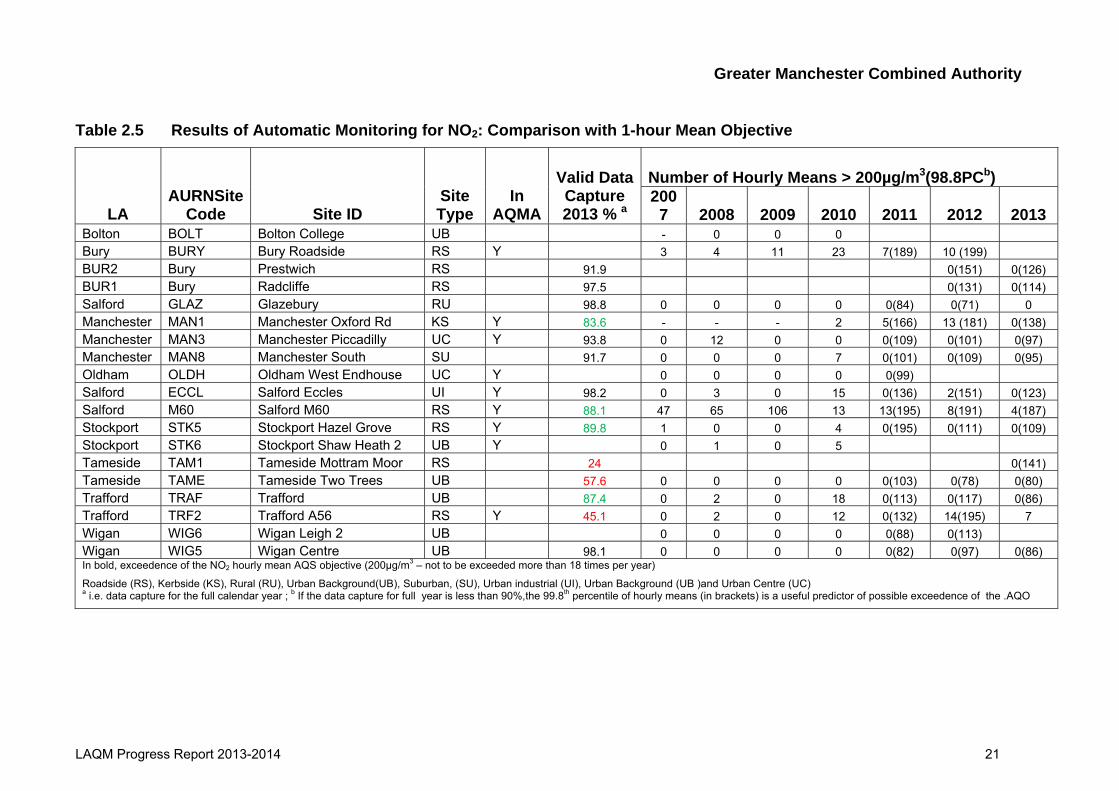
Table 2.5 shows the number of hourly exceedences above 200 µg/m3 with 99.8
percentile in brackets for some years. The hourly air quality objective was not
exceeded as no site had more than 18 exceedences in 2012 or 2013. The number of
exceedences across the network has fallen considerably compared to 2012 with the
greatest number of exceedences recorded by the two roadside sites, M60 and A56
with 4 and 7 hourly exceedences respectively.
The 99.8 percentile is a useful indicator to compare against the 200 µg/m3 for sites
with low data capture. If the 99.8 percentile is above 200 µg/m3, then the hourly
standard is likely to be exceeded. No sites have a 99.8 percentile above 200 µg/m3
in 2012 and 2013 supporting the above finding that the hourly standard is not
exceeded in Greater Manchester.

Greater Manchester Combined Authority
Table 2.4 Results of Automatic Monitoring for NO2: Comparison with Annual Mean Objective of 40 µg/m3 Unit: µg/m3
2007 2008 2009 2010 2011 2012 2013
AURN Code Site ID
Site Type
In AQMA Conc % Conc % Conc % Conc % Conc % Conc % Conc %
BOLT Bolton College UB - - 25 75 27 84 28 91 29 23 - - BURY Bury Roadside RO Y 65 81 69 96 72 83 69 99 71 89 57 58 - BUR2 Bury Prestwich RO 46 99 48 89 45 92 BUR1 Bury Radcliffe RO 30 99 28 88 26 98 GLAZ Glazebury RU 18 97 17 49 16 94 19 99 18 97 19 76 15 99 MAN1 Manch Oxford Rd KE Y - - - - - - 64 77 66 94 62 95 55 84 MAN3 Manch. Piccadilly UC Y 44 96 43 78 42 92 45 95 44 97 41 89 39 94 MAN8 Manchester South SU 21 86 24 92 24 96 28 99 23 99 24 97 22 92 OLDH Oldh’m West End UC Y 31 99 32 89 30 98 33 89 31 50 - - - ECCL Salford Eccles UI Y 34 91 36 92 39 65 42 86 33 87 28 89 30 98 M60 Salford M60 RO Y 63 96 68 70 70 97 60 98 64 99 62 99 61 88 STK5 Stockp’t Hazel Grv RO Y 29 61 30 46 31 78 36 55 24 79 29 94 30 90 STK6 Stockp’t Shaw H’th 2 UB Y 39 24 28 98 27 99 31 93 31 10 - - - - TAM1 Tameside Mott’m M’r RO - - 35 24 TAME Tameside Two T’s UB 19 94 19 95 19 89 24 68 21 90 19 100 17 58 TRAF Trafford UB 30 100 32 81 34 98 33 99 26 99 26 87 22 87 TRF2 Trafford A56 RO Y 42 89 46 93 44 96 46 99 41 90 49 99 39 45 WIG6 Wigan Leigh 2 UB 27 93 26 100 25 95 29 92 25 96 26 61 - - WIG5 Wigan Centre UB 22 96 24 99 24 99 26 99 23 98 24 100 25 98 Annual means annualised where data capture falls below 75 % (grey shading) see Box 3.2 TG(09). Bold standard exceeded, Orange 75 – 90%, Red < 75% data capture Closures: Stockport Shaw Health 6/2/11; Oldham 5/7/11. Included in report for 2013 Tameside Mottram Moor Roadside (RS), Kerbside (KS), Rural (RU), Urban Background(UB), Suburban, (SU), Urban industrial (UI), Urban Background (UB )and Urban Centre (UC) Source: \\salford.gov.uk\envs\AQData\GMAQN\Automatic\2013\WIP\Gtr Manchester Summary.xlsm
LAQM Progress Report 2013-2014 18
Greater Manchester Combined Authority
Figure 2.3 Trends in Annual Mean NO2 Concentrations Measured at Automatic Monitoring Sites Sites above AQS marked with *
\\salford.gov.uk\envs\AQData\GMAQN\Automatic\2013\WIP\Gtr Manchester Summary.xlsm
LAQM Progress Report 2013-2014 19

Greater Manchester Combined Authority
Figure 2.4 Trends in Annual Mean NO2 Concentrations Measured at Automatic Monitoring by Site Classification
\\salford.gov.uk\envs\AQData\GMAQN\Automatic\2013\WIP\Gtr Manchester Summary.xlsm
LAQM Progress Report 2013-2014 20
Greater Manchester Combined Authority
LAQM Progress Report 2013-2014 21
Table 2.5 Results of Automatic Monitoring for NO2: Comparison with 1-hour Mean Objective
Number of Hourly Means > 200µg/m3(98.8PCb)
LA AURNSite
Code Site ID Site Type
In AQMA
Valid Data Capture 2013 % a
2007 2008 2009 2010 2011 2012 2013
Bolton BOLT Bolton College UB - 0 0 0 Bury BURY Bury Roadside RS Y 3 4 11 23 7(189) 10 (199) BUR2 Bury Prestwich RS 91.9 0(151) 0(126) BUR1 Bury Radcliffe RS 97.5 0(131) 0(114) Salford GLAZ Glazebury RU 98.8 0 0 0 0 0(84) 0(71) 0 Manchester MAN1 Manchester Oxford Rd KS Y 83.6 - - - 2 5(166) 13 (181) 0(138) Manchester MAN3 Manchester Piccadilly UC Y 93.8 0 12 0 0 0(109) 0(101) 0(97) Manchester MAN8 Manchester South SU 91.7 0 0 0 7 0(101) 0(109) 0(95) Oldham OLDH Oldham West Endhouse UC Y 0 0 0 0 0(99) Salford ECCL Salford Eccles UI Y 98.2 0 3 0 15 0(136) 2(151) 0(123) Salford M60 Salford M60 RS Y 88.1 47 65 106 13 13(195) 8(191) 4(187) Stockport STK5 Stockport Hazel Grove RS Y 89.8 1 0 0 4 0(195) 0(111) 0(109) Stockport STK6 Stockport Shaw Heath 2 UB Y 0 1 0 5 Tameside TAM1 Tameside Mottram Moor RS 24 0(141) Tameside TAME Tameside Two Trees UB 57.6 0 0 0 0 0(103) 0(78) 0(80) Trafford TRAF Trafford UB 87.4 0 2 0 18 0(113) 0(117) 0(86) Trafford TRF2 Trafford A56 RS Y 45.1 0 2 0 12 0(132) 14(195) 7 Wigan WIG6 Wigan Leigh 2 UB 0 0 0 0 0(88) 0(113) Wigan WIG5 Wigan Centre UB 98.1 0 0 0 0 0(82) 0(97) 0(86) In bold, exceedence of the NO2 hourly mean AQS objective (200µg/m3 – not to be exceeded more than 18 times per year)
Roadside (RS), Kerbside (KS), Rural (RU), Urban Background(UB), Suburban, (SU), Urban industrial (UI), Urban Background (UB )and Urban Centre (UC) a i.e. data capture for the full calendar year ; b If the data capture for full year is less than 90%,the 99.8th percentile of hourly means (in brackets) is a useful predictor of possible exceedence of the .AQO
Greater Manchester Combined Authority
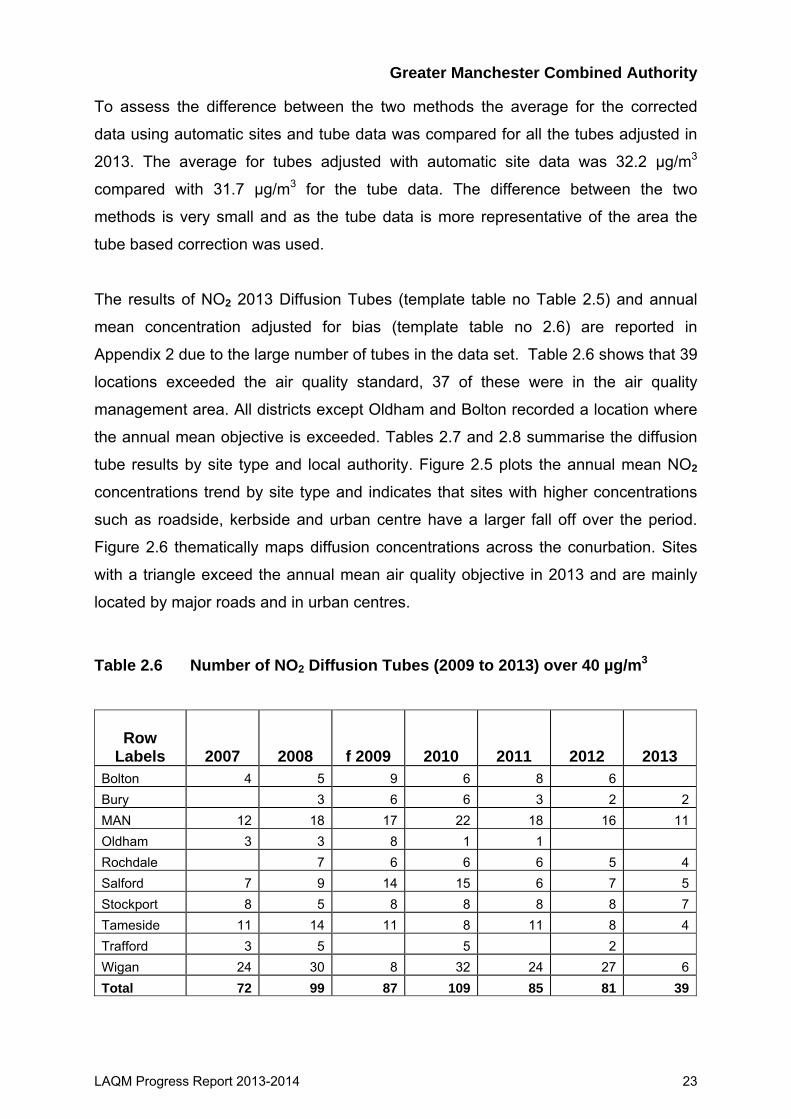
Diffusion Tube Monitoring Data
A summary of the diffusion tube results for 2007 to 2013, above 40 µg/m3 by site type
and by local authority, are presented in Tables 2.6, 2.7 and 2.8. A full data set is
presented for all tubes in Appendix 2 and attached spreadsheets.
Diffusion tube monitoring is affected by several factors and the NO2 concentrations
are adjusted by comparing results from collocated tubes to a reference using a NO2
continuous analyser. A bias factor is calculated using a spreadsheet provided by
Ricardo–AEA. Bias factors are collated in a national database enabling a large
number of factors at a range of different site locations using the same laboratory and
analysis method. There is a choice of using a locally derived bias factor based on
local data or using the national dataset. For 2012 and 2013 the national bias factor
was selected as it is based on a larger number of studies, is compatible with results
in 2011 and as shown below there is minimal difference between the two sets.
National and locally derived factors are compared below:
National Factor
2013: 0.87 (from national database11 studies, Version: 03/14)
2012: 0.86 (from national database 13 studies, Version: 03/13)
Greater Manchester (local factor)
2013: 0.896 (from national database 6 studies, Version: 03/14)
2012: 0.869 (from national database 6 studies, Version: 03/13)
Although the local factor for 2013 is slightly higher at 0.896, the national factor was
preferred as more studies are used and it was also used in 2012.
Where the data capture was less than 9 months the results were annualised using
non roadside/ kerbside sites with 100% data capture by deriving a factor based on
period means from either diffusion tubes or background automatic stations with good
data capture to 12 month mean. In 2013, 37 tubes with less than 9 months were
corrected using the diffusion tube approach.
LAQM Progress Report 2013-2014 22
Greater Manchester Combined Authority
To assess the difference between the two methods the average for the corrected
data using automatic sites and tube data was compared for all the tubes adjusted in
2013. The average for tubes adjusted with automatic site data was 32.2 µg/m3
compared with 31.7 µg/m3 for the tube data. The difference between the two
methods is very small and as the tube data is more representative of the area the
tube based correction was used.
The results of NO2 2013 Diffusion Tubes (template table no Table 2.5) and annual
mean concentration adjusted for bias (template table no 2.6) are reported in
Appendix 2 due to the large number of tubes in the data set. Table 2.6 shows that 39
locations exceeded the air quality standard, 37 of these were in the air quality
management area. All districts except Oldham and Bolton recorded a location where
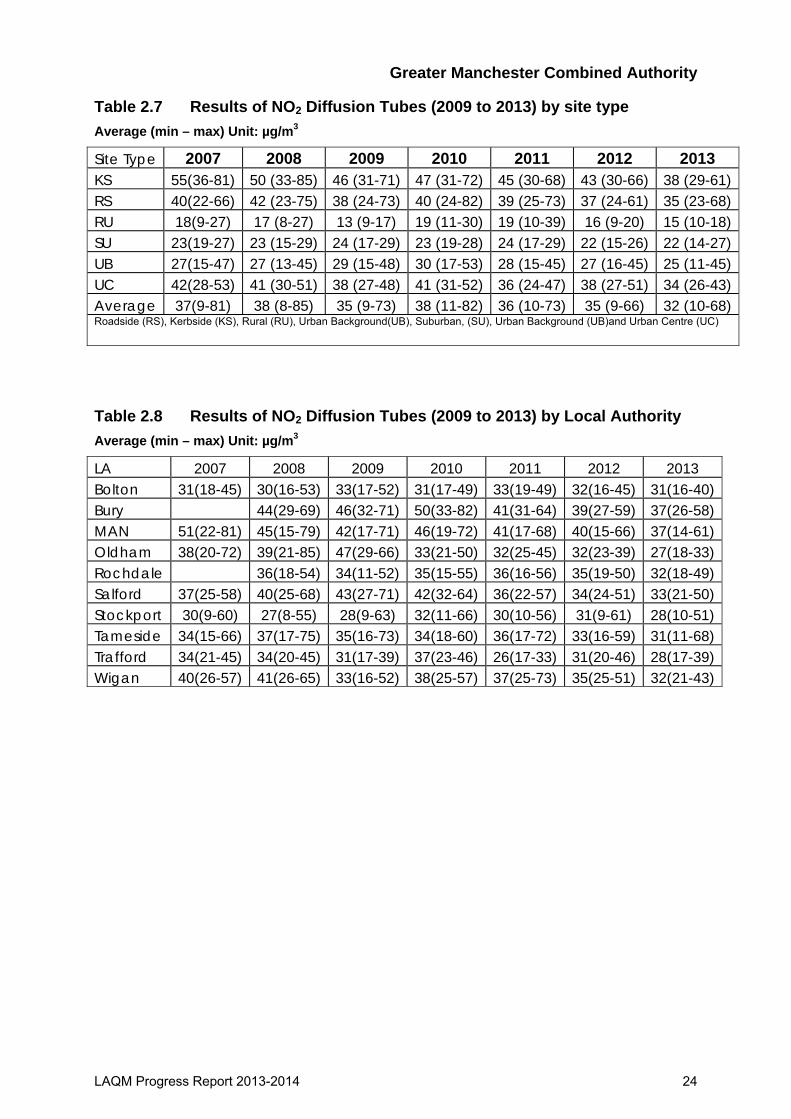
the annual mean objective is exceeded. Tables 2.7 and 2.8 summarise the diffusion
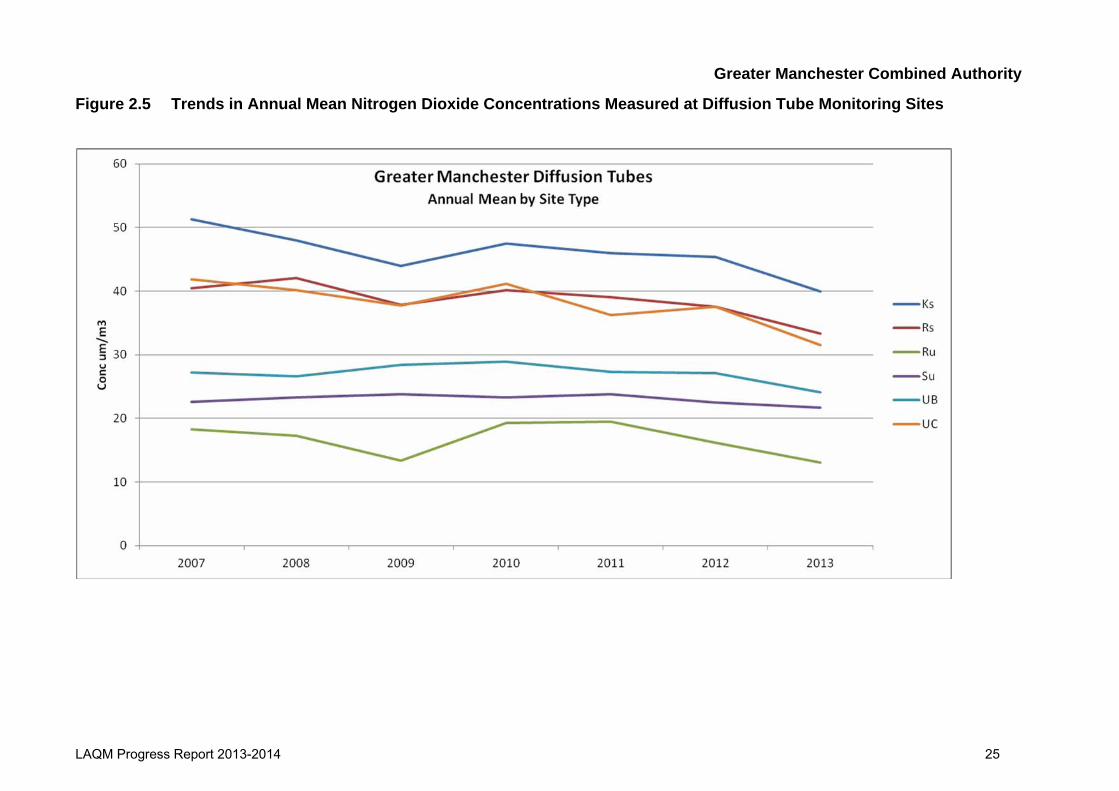
tube results by site type and local authority. Figure 2.5 plots the annual mean NO2
concentrations trend by site type and indicates that sites with higher concentrations
such as roadside, kerbside and urban centre have a larger fall off over the period.
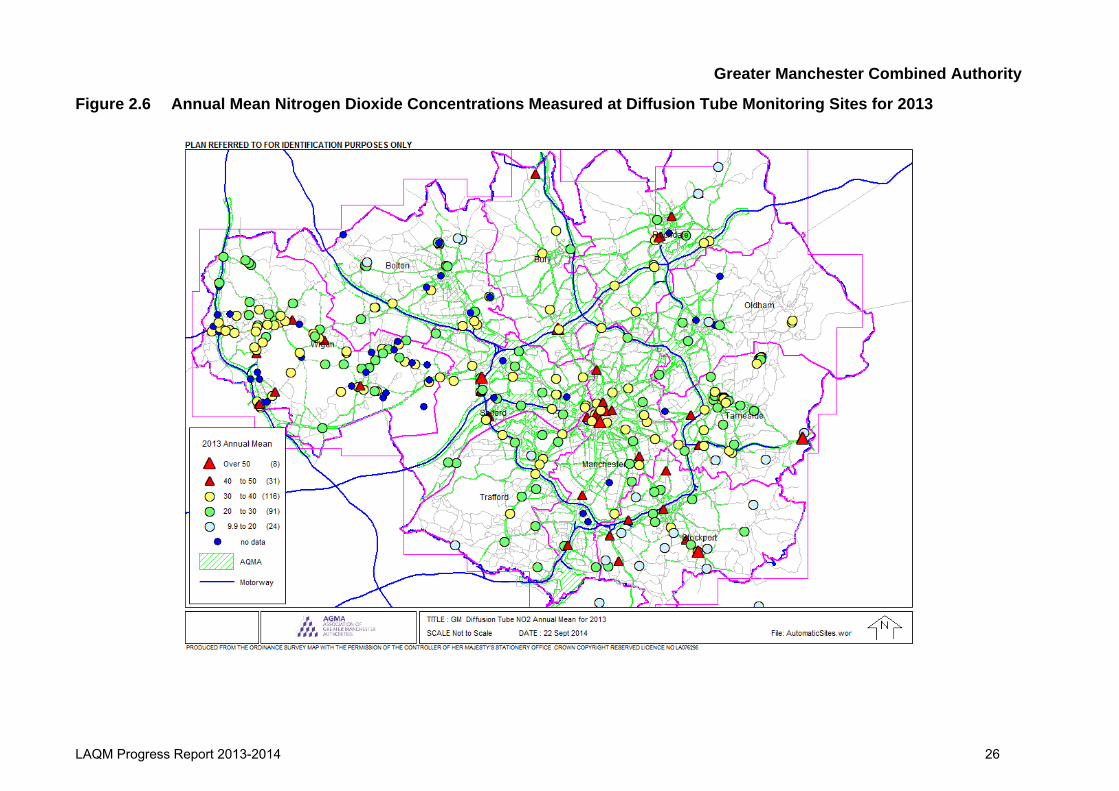
Figure 2.6 thematically maps diffusion concentrations across the conurbation. Sites
with a triangle exceed the annual mean air quality objective in 2013 and are mainly
located by major roads and in urban centres.
Table 2.6 Number of NO2 Diffusion Tubes (2009 to 2013) over 40 µg/m3
Row Labels 2007 2008 f 2009 2010 2011 2012 2013
Bolton 4 5 9 6 8 6 Bury 3 6 6 3 2 2MAN 12 18 17 22 18 16 11Oldham 3 3 8 1 1 Rochdale 7 6 6 6 5 4Salford 7 9 14 15 6 7 5Stockport 8 5 8 8 8 8 7Tameside 11 14 11 8 11 8 4Trafford 3 5 5 2 Wigan 24 30 8 32 24 27 6Total 72 99 87 109 85 81 39
LAQM Progress Report 2013-2014 23
Greater Manchester Combined Authority
LAQM Progress Report 2013-2014 24
Table 2.7 Results of NO2 Diffusion Tubes (2009 to 2013) by site type Average (min – max) Unit: µg/m3
Site Type 2007 2008 2009 2010 2011 2012 2013 KS 55(36-81) 50 (33-85) 46 (31-71) 47 (31-72) 45 (30-68) 43 (30-66) 38 (29-61) RS 40(22-66) 42 (23-75) 38 (24-73) 40 (24-82) 39 (25-73) 37 (24-61) 35 (23-68) RU 18(9-27) 17 (8-27) 13 (9-17) 19 (11-30) 19 (10-39) 16 (9-20) 15 (10-18) SU 23(19-27) 23 (15-29) 24 (17-29) 23 (19-28) 24 (17-29) 22 (15-26) 22 (14-27) UB 27(15-47) 27 (13-45) 29 (15-48) 30 (17-53) 28 (15-45) 27 (16-45) 25 (11-45) UC 42(28-53) 41 (30-51) 38 (27-48) 41 (31-52) 36 (24-47) 38 (27-51) 34 (26-43) Average 37(9-81) 38 (8-85) 35 (9-73) 38 (11-82) 36 (10-73) 35 (9-66) 32 (10-68) Roadside (RS), Kerbside (KS), Rural (RU), Urban Background(UB), Suburban, (SU), Urban Background (UB)and Urban Centre (UC)
Table 2.8 Results of NO2 Diffusion Tubes (2009 to 2013) by Local Authority Average (min – max) Unit: µg/m3
LA 2007 2008 2009 2010 2011 2012 2013 Bolton 31(18-45) 30(16-53) 33(17-52) 31(17-49) 33(19-49) 32(16-45) 31(16-40) Bury 44(29-69) 46(32-71) 50(33-82) 41(31-64) 39(27-59) 37(26-58) MAN 51(22-81) 45(15-79) 42(17-71) 46(19-72) 41(17-68) 40(15-66) 37(14-61) Oldham 38(20-72) 39(21-85) 47(29-66) 33(21-50) 32(25-45) 32(23-39) 27(18-33) Rochdale 36(18-54) 34(11-52) 35(15-55) 36(16-56) 35(19-50) 32(18-49) Salford 37(25-58) 40(25-68) 43(27-71) 42(32-64) 36(22-57) 34(24-51) 33(21-50) Stockport 30(9-60) 27(8-55) 28(9-63) 32(11-66) 30(10-56) 31(9-61) 28(10-51) Tameside 34(15-66) 37(17-75) 35(16-73) 34(18-60) 36(17-72) 33(16-59) 31(11-68) Trafford 34(21-45) 34(20-45) 31(17-39) 37(23-46) 26(17-33) 31(20-46) 28(17-39) Wigan 40(26-57) 41(26-65) 33(16-52) 38(25-57) 37(25-73) 35(25-51) 32(21-43)
Greater Manchester Combined Authority
Figure 2.5 Trends in Annual Mean Nitrogen Dioxide Concentrations Measured at Diffusion Tube Monitoring Sites
LAQM Progress Report 2013-2014 25
Greater Manchester Combined Authority
LAQM Progress Report 2013-2014 26
Figure 2.6 Annual Mean Nitrogen Dioxide Concentrations Measured at Diffusion Tube Monitoring Sites for 2013
Greater Manchester Combined Authority
LAQM Progress Report 2013-2014 27
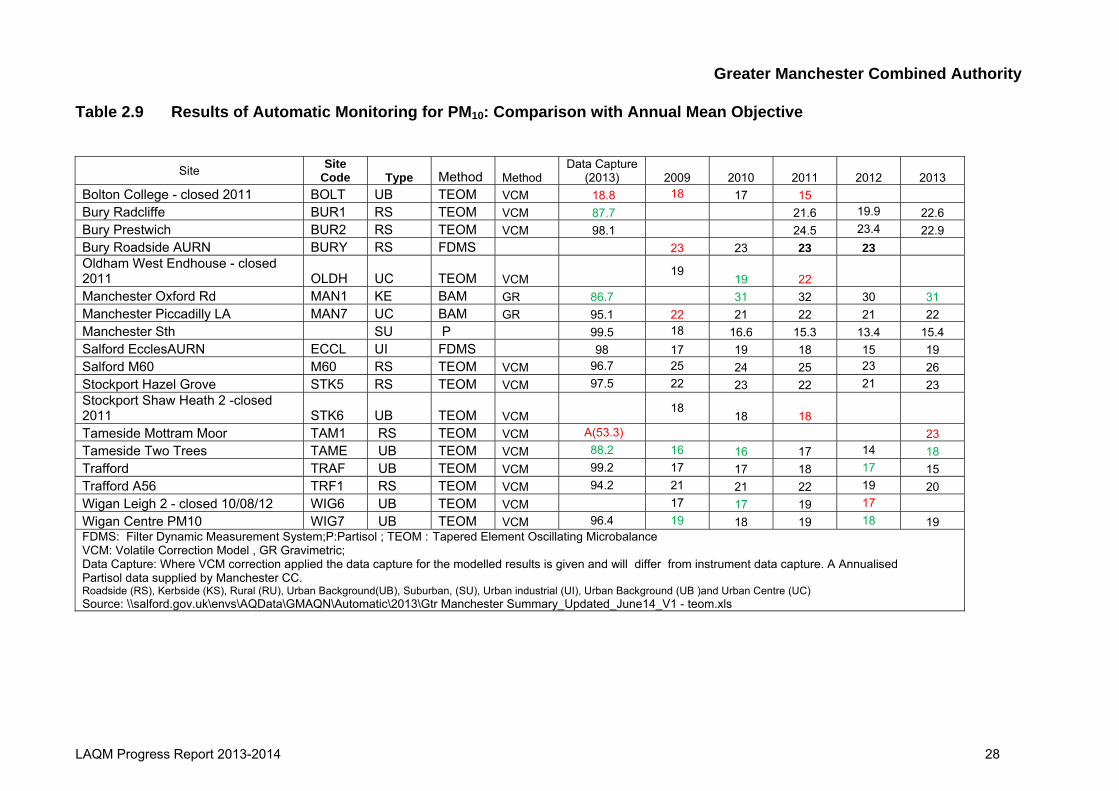
2.2.2 Particulate Matter (PM10)
Table 2.9 shows the annual mean PM10 for sites in Greater Manchester, as can be
seen in Figure 2.7 there have been long term improvements but concentrations have
remained consistent over the last few years. There are no sites that exceed the
annual mean air quality objective.
Ricardo-AEA corrected the TEOM data using the volatile correction model provide by
King’s College London (KCL) and the BAM data by dividing by 1.2. TEOM data in the
Ricardo-AEA spreadsheet prior to 2009 is corrected by 1.3 unless otherwise stated.
FDMS and Partisol data does not required to be corrected.
Tameside Mottram Moor was with a data capture of 53% in 2013 was annualised
using TEOM data at using four background sites as set out in LAQM Technical
Guidance TG(09).
As expected, the roadside and kerbside sites remain higher than other sites in the
network. The two highest sites record 26 µg/m3 and 31 µg/m3 at roadside locations,
compared with 15 µg/m3 seen at the site with the lowest concentration.
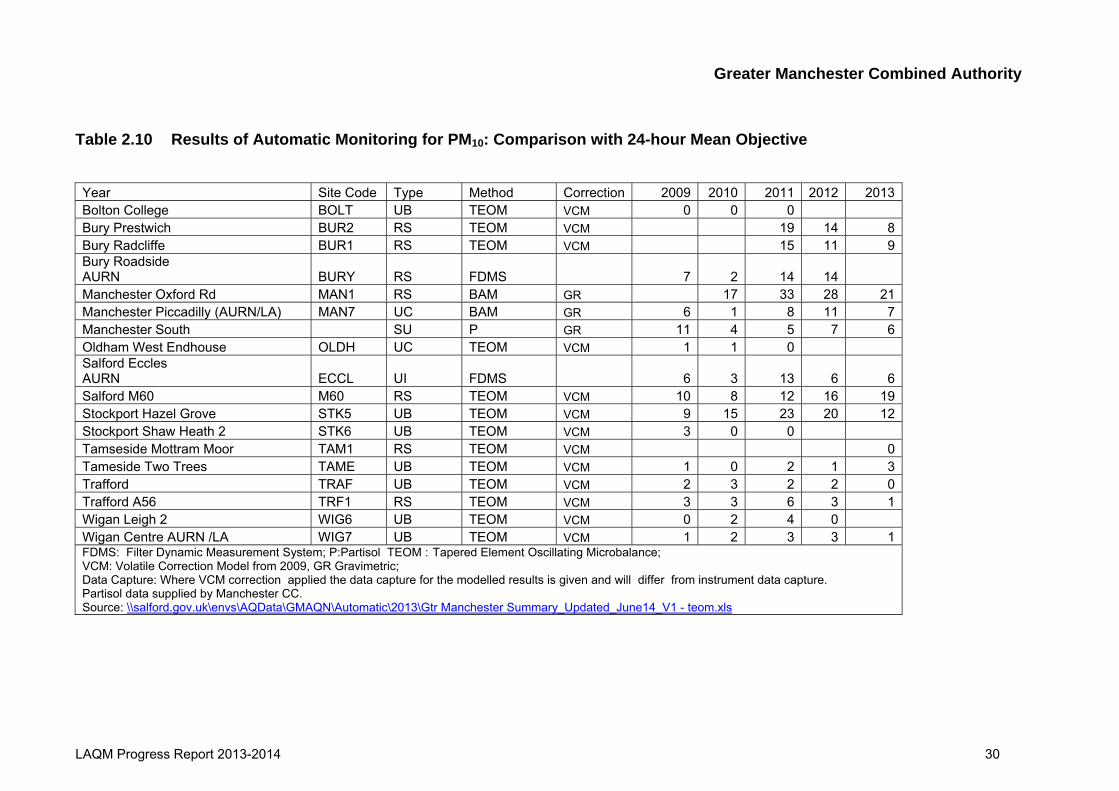
Table 2.10 summaries the results for the PM10 daily mean air quality objective; no
site exceeds this objective.
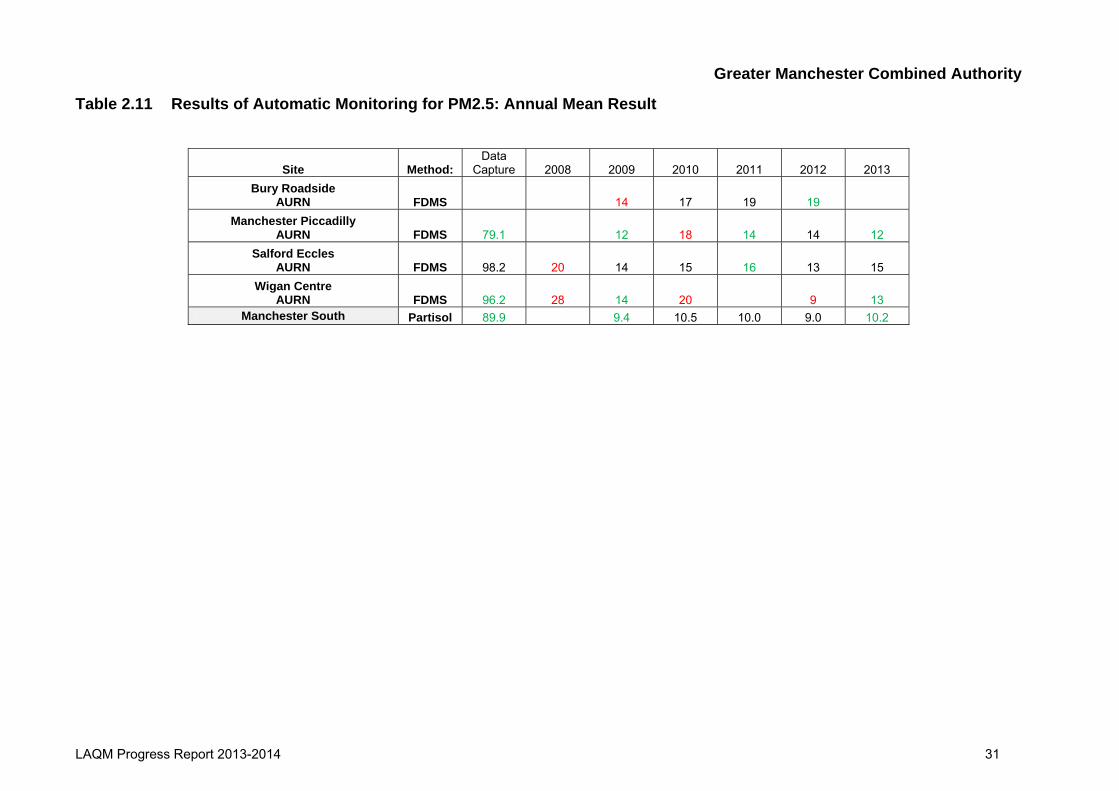
2.2.3 Particulate Matter (PM2.5)
The results of the air quality measurements for PM2.5 for five sites in Greater
Manchester are summarised in Table 2-9. PM2.5 is monitored using FDMS at four
sites and a Partisol. No corrections are required. All results are within the Stage 2
limit value (20 μg m-3 to be achieved by 1st Jan 2020).
Greater Manchester Combined Authority
Table 2.9 Results of Automatic Monitoring for PM10: Comparison with Annual Mean Objective
Site Site Code Type Method Method
Data Capture (2013) 2009 2010 2011 2012 2013
Bolton College - closed 2011 BOLT UB TEOM VCM 18.8 18 17 15 Bury Radcliffe BUR1 RS TEOM VCM 87.7 21.6 19.9 22.6 Bury Prestwich BUR2 RS TEOM VCM 98.1 24.5 23.4 22.9 Bury Roadside AURN BURY RS FDMS 23 23 23 23 Oldham West Endhouse - closed 2011 OLDH UC TEOM VCM
19 19 22
Manchester Oxford Rd MAN1 KE BAM GR 86.7 31 32 30 31 Manchester Piccadilly LA MAN7 UC BAM GR 95.1 22 21 22 21 22 Manchester Sth SU P 99.5 18 16.6 15.3 13.4 15.4 Salford EcclesAURN ECCL UI FDMS 98 17 19 18 15 19 Salford M60 M60 RS TEOM VCM 96.7 25 24 25 23 26 Stockport Hazel Grove STK5 RS TEOM VCM 97.5 22 23 22 21 23 Stockport Shaw Heath 2 -closed 2011 STK6 UB TEOM VCM
18 18 18
Tameside Mottram Moor TAM1 RS TEOM VCM A(53.3) 23 Tameside Two Trees TAME UB TEOM VCM 88.2 16 16 17 14 18 Trafford TRAF UB TEOM VCM 99.2 17 17 18 17 15 Trafford A56 TRF1 RS TEOM VCM 94.2 21 21 22 19 20 Wigan Leigh 2 - closed 10/08/12 WIG6 UB TEOM VCM 17 17 19 17 Wigan Centre PM10 WIG7 UB TEOM VCM 96.4 19 18 19 18 19 FDMS: Filter Dynamic Measurement System;P:Partisol ; TEOM : Tapered Element Oscillating Microbalance VCM: Volatile Correction Model , GR Gravimetric; Data Capture: Where VCM correction applied the data capture for the modelled results is given and will differ from instrument data capture. A Annualised Partisol data supplied by Manchester CC. Roadside (RS), Kerbside (KS), Rural (RU), Urban Background(UB), Suburban, (SU), Urban industrial (UI), Urban Background (UB )and Urban Centre (UC) Source: \\salford.gov.uk\envs\AQData\GMAQN\Automatic\2013\Gtr Manchester Summary_Updated_June14_V1 - teom.xls
LAQM Progress Report 2013-2014 28

Greater Manchester Combined Authority
Figure 2.7 Trends in Annual Mean PM10 Concentrations (Teom (gravimetric) and FDMS data)
\\salford.gov.uk\envs\AQData\GMAQN\Automatic\2013\Gtr Manchester Summary_Updated_June14_V1 - teom.xls
LAQM Progress Report 2013-2014 29
Greater Manchester Combined Authority
Table 2.10 Results of Automatic Monitoring for PM10: Comparison with 24-hour Mean Objective Year Site Code Type Method Correction 2009 2010 2011 2012 2013Bolton College BOLT UB TEOM VCM 0 0 0 Bury Prestwich BUR2 RS TEOM VCM 19 14 8Bury Radcliffe BUR1 RS TEOM VCM 15 11 9Bury Roadside AURN BURY RS FDMS 7 2 14 14 Manchester Oxford Rd MAN1 RS BAM GR 17 33 28 21Manchester Piccadilly (AURN/LA) MAN7 UC BAM GR 6 1 8 11 7Manchester South SU P GR 11 4 5 7 6Oldham West Endhouse OLDH UC TEOM VCM 1 1 0 Salford Eccles AURN ECCL UI FDMS 6 3 13 6 6Salford M60 M60 RS TEOM VCM 10 8 12 16 19Stockport Hazel Grove STK5 UB TEOM VCM 9 15 23 20 12Stockport Shaw Heath 2 STK6 UB TEOM VCM 3 0 0 Tamseside Mottram Moor TAM1 RS TEOM VCM 0Tameside Two Trees TAME UB TEOM VCM 1 0 2 1 3Trafford TRAF UB TEOM VCM 2 3 2 2 0Trafford A56 TRF1 RS TEOM VCM 3 3 6 3 1Wigan Leigh 2 WIG6 UB TEOM VCM 0 2 4 0 Wigan Centre AURN /LA WIG7 UB TEOM VCM 1 2 3 13FDMS: Filter Dynamic Measurement System; P:Partisol TEOM : Tapered Element Oscillating Microbalance; VCM: Volatile Correction Model from 2009, GR Gravimetric; Data Capture: Where VCM correction applied the data capture for the modelled results is given and will differ from instrument data capture. Partisol data supplied by Manchester CC. Source: \\salford.gov.uk\envs\AQData\GMAQN\Automatic\2013\Gtr Manchester Summary_Updated_June14_V1 - teom.xls
LAQM Progress Report 2013-2014 30
Greater Manchester Combined Authority
LAQM Progress Report 2013-2014 31
Table 2.11 Results of Automatic Monitoring for PM2.5: Annual Mean Result
Site Method: Data
Capture 2008 2009 2010 2011 2012 2013 Bury Roadside
AURN FDMS 14 17 19 19 Manchester Piccadilly
AURN FDMS 79.1 12 18 14 14 12 Salford Eccles
AURN FDMS 98.2 20 14 15 16 13 15 Wigan Centre
AURN FDMS 96.2 28 14 20 9 13 Manchester South Partisol 89.9 9.4 10.5 10.0 9.0 10.2
Greater Manchester Combined Authority
2.2.4 Other Pollutants
Previous monitoring results for the following pollutants have shown that concentration
levels in Greater Manchester are consistently below the relevant air quality objective.
Therefore reporting of these pollutants has been discontinued. Data is available on
request from the local authority.
• Sulphur Dioxide
• Benzene
• 1,3 Butadiene
• Lead
• Carbon Monoxide
2.2.5 Summary of Compliance with AQS Objectives
This report has examined the results from monitoring in the 10 districts of Bury,
Bolton, Manchester, Oldham, Rochdale, Salford, Stockport, Tameside, Trafford, and
Wigan. Annual mean nitrogen dioxide in the AQMA remain above the air quality
objective and therefore the AQMA should remain.
Assessments of the hourly mean nitrogen dioxide objective and the PM10, annual
and daily objectives are not exceeded.
LAQM Progress Report 2013-2014 32

Greater Manchester Combined Authority
3 New Local Developments 3.1 Road Traffic Sources Each of the 10 Greater Manchester authorities committed to undertaking a detailed
air quality review and assessment in relation to road traffic following the last updating
and screening assessment in 2009. The dispersion modelling has been delayed due
to difficulties in obtaining accurate emissions data, particularly for some point sources
and also because new road transport emission factors were due to be published,
which are expected to be more representative of real world .
The detailed assessment is currently being completed and will be submitted later in
2015. Road traffic emissions will be considered as part of the detailed assessment.
For the Progress Report authorities in Greater Manchester have been asked to
identify and roads traffic sources that have not previously been assessed either in
reports that have been submitted previously or in the detailed assessment that is
currently being written. This has been based on local knowledge of any major
changes to road traffic flows and any significant developments (e.g. new road or bus
stations) which have been constructed since the last report was submitted.
Table 3.1 Road Traffic Sources
Source Type Local Authority
New or Previously not Assessed
Sources Identified?
Air Quality Assessment Carried Out as Part of
Environmental Statement?
Outcome of the Environmental
Statement
Narrow Congested Streets with Residential Properties
Close to the Kerb
All 10 Greater
Manchester Authorities
No No N/A
Busy Streets Where People May Spend 1 hour or More
Close to Traffic
All 10 Greater
Manchester Authorities
No No N/A
Roads with a High Flow of Buses and/or
HGVs
All 10 Greater
Manchester Authorities
No No N/A
LAQM Progress Report 2013-2014 33

Greater Manchester Combined Authority
Source Type Local Authority
New or Previously not Assessed
Sources Identified?
Air Quality Assessment Carried Out as Part of
Environmental Statement?
Outcome of the Environmental
Statement
Junctions
All 10 Greater
Manchester Authorities
No No N/A
Bolton Bury
Oldham Manchester Rochdale Trafford
Tameside Salford
Stockport
No No N/A New Roads
Constructed or Proposed Since
the Last USA
Wigan Yes (Southgate) No N/A Roads with Significantly
Changed Traffic Flows
All 10 Greater
Manchester Authorities
No No N/A
Bus and Coach Stations
All 10 Greater
Manchester Authorities
No No N/A
3.2 Other Transport Sources Each of the 10 Greater Manchester authorities have identified any new other
transport sources that have not previously been assessed either in reports that have
been submitted previously or in the detailed assessment that is currently being
written. This has been based on local knowledge of any major changes to airports,
railways (diesel and steam trains - stationary and moving) and ports (shipping) since
the last report was submitted. The results are presented in Table 3.2.
LAQM Progress Report 2013-2014 34
Greater Manchester Combined Authority
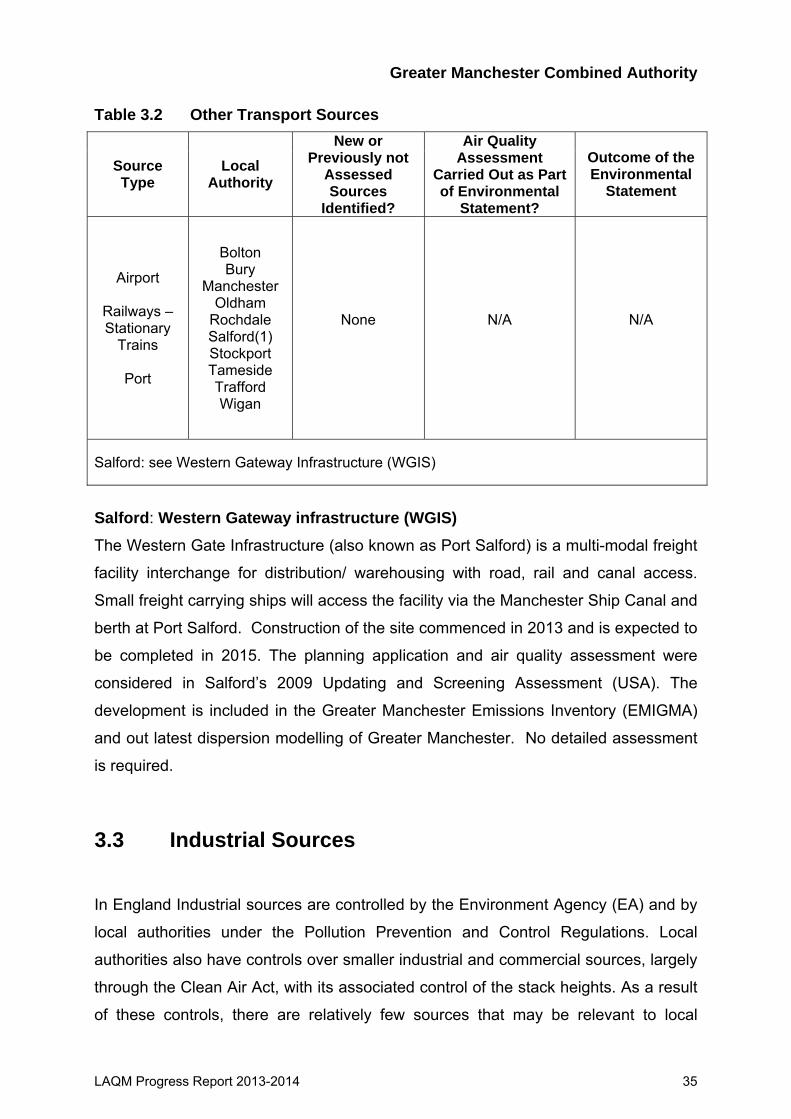
Table 3.2 Other Transport Sources
Source Type
Local Authority
New or Previously not
Assessed Sources
Identified?
Air Quality Assessment
Carried Out as Part of Environmental
Statement?
Outcome of the Environmental
Statement
Airport
Railways – Stationary
Trains
Port
Bolton Bury
Manchester Oldham
Rochdale Salford(1) Stockport Tameside Trafford Wigan
None
N/A
N/A
Salford: see Western Gateway Infrastructure (WGIS)
Salford: Western Gateway infrastructure (WGIS) The Western Gate Infrastructure (also known as Port Salford) is a multi-modal freight
facility interchange for distribution/ warehousing with road, rail and canal access.
Small freight carrying ships will access the facility via the Manchester Ship Canal and
berth at Port Salford. Construction of the site commenced in 2013 and is expected to
be completed in 2015. The planning application and air quality assessment were
considered in Salford’s 2009 Updating and Screening Assessment (USA). The
development is included in the Greater Manchester Emissions Inventory (EMIGMA)
and out latest dispersion modelling of Greater Manchester. No detailed assessment
is required.
3.3 Industrial Sources
In England Industrial sources are controlled by the Environment Agency (EA) and by
local authorities under the Pollution Prevention and Control Regulations. Local
authorities also have controls over smaller industrial and commercial sources, largely
through the Clean Air Act, with its associated control of the stack heights. As a result
of these controls, there are relatively few sources that may be relevant to local
LAQM Progress Report 2013-2014 35

Greater Manchester Combined Authority
authorities under the Local Air Quality Management (LAQM) regime. Many of these
sources will have been addressed during previous rounds of Review and
Assessment. The focus should thus be on new installations and those with
significantly changed emissions.
While the number of sources that may be significant is limited, there is a wider range
of pollutants to be considered.
For the purpose of this report we will divide industrial sources into four sections:
• Industrial installations;
• Major fuel (petrol) storage depots;
• Petrol stations; and
• Poultry farms. Industrial sources are unlikely to make a significant local contribution to annual mean
concentrations, but could be significant in terms of the short-term objectives. The
approach to the assessment will depend on whether an assessment has been
carried out as part of the planning or permitting process. The assessment should
consider all of the regulated pollutants although those most at risk of requiring further
work are SO2, NO2, PM10 and benzene.
3.3.1 New or Proposed Installations for which an Air Quality Assessment has been Carried Out
A review of industrial processes in Greater Manchester has produced the following
table 3.3.
LAQM Progress Report 2013-2014 36
Greater Manchester Combined Authority
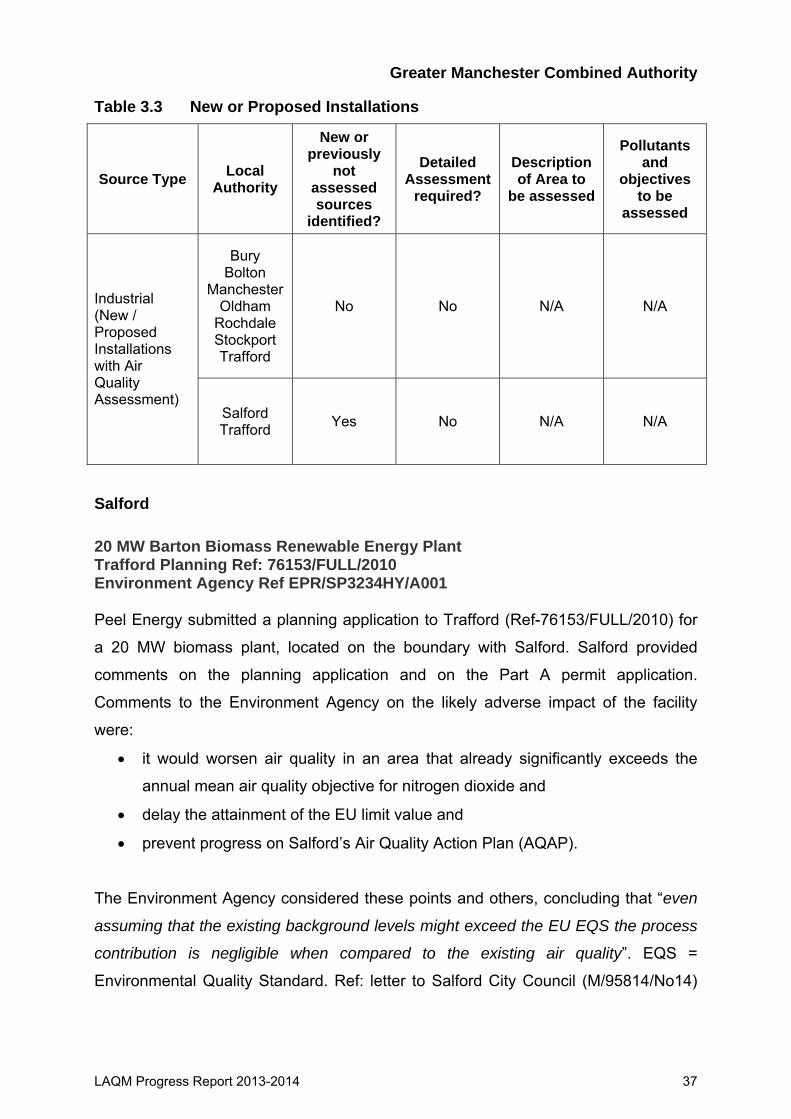
Table 3.3 New or Proposed Installations
Source Type Local Authority
New or previously
not assessed sources
identified?
Detailed Assessment
required?
Description of Area to
be assessed
Pollutants and
objectives to be
assessed
Bury Bolton
Manchester Oldham
Rochdale Stockport Trafford
No No N/A N/A Industrial (New / Proposed Installations with Air Quality Assessment)
Salford Trafford Yes No N/A N/A
Salford 20 MW Barton Biomass Renewable Energy Plant Trafford Planning Ref: 76153/FULL/2010 Environment Agency Ref EPR/SP3234HY/A001 Peel Energy submitted a planning application to Trafford (Ref-76153/FULL/2010) for
a 20 MW biomass plant, located on the boundary with Salford. Salford provided
comments on the planning application and on the Part A permit application.
Comments to the Environment Agency on the likely adverse impact of the facility
were:
• it would worsen air quality in an area that already significantly exceeds the
annual mean air quality objective for nitrogen dioxide and
• delay the attainment of the EU limit value and
• prevent progress on Salford’s Air Quality Action Plan (AQAP).
The Environment Agency considered these points and others, concluding that “even
assuming that the existing background levels might exceed the EU EQS the process
contribution is negligible when compared to the existing air quality”. EQS =
Environmental Quality Standard. Ref: letter to Salford City Council (M/95814/No14)
LAQM Progress Report 2013-2014 37
Greater Manchester Combined Authority
dated 25 July 2012 EPR/SP3234HY/A001. Approval was given for the operation of
the plant.
Island Gas Exploratory Shale Gas Exploratory Well Environment Agency Ref EPR/AB3709LD/A001 The application was for a license to drill two exploratory wells to evaluate the
potential resources of methane in the locality over a short period. The application
included an air quality assessment of the likely impact of the operations on the
surrounding environment and found no significant effect.
Trafford 20 megawatt biomass fuelled renewable energy plant Planning Ref-76153/FULL/2010 Planning permission for the development was granted by the Secretary of State. This
followed a planning appeal after the original application by Peel Energy was
dismissed by the Council. The site is a Part A permitted process regulated by the
Environment Agency. Site for exploration, production testing and extraction of coal bed methane Planning ref-81446/RENEWAL/2013 This application included a combined heat and power facility, erection of temporary
34m high drilling rig and formation of two exploratory boreholes. No decision has yet
been made on this application. Carrington Power Station, Carrington Combined Cycle Gas Turbine (CCGT) Power Station. The power station is located on Manchester Road, Carrington, Trafford. The Section 36 consent for the project was granted in 2008. The site is currently
being developed with first firing hoped to be in 2015.
The impact of the proposed development on nitrogen dioxide concentrations at the
most affected residential receptors near roads within the Air Quality Management
Area was assessed as “slight adverse”. This is likely to be acceptable provided that
other measures in the Greater Manchester Air Quality Action Plan are sufficient to
reduce the nitrogen dioxide concentration to levels below the air quality objective
irrespective of the operation of the power plant.
LAQM Progress Report 2013-2014 38
Greater Manchester Combined Authority
There are several new or proposed industrial developments that may affect air quality
in the area. These include the SAICA paper mill, the Barton biomass plant and the
Carrington II power station.
3.3.2 Existing Installations where Emissions have Increased Substantially or New Relevant Exposure has been Introduced
The review and assessment process recommends that Local Authorities determine
whether any industrial sources identified during previous rounds of review and
assessment have either:
a) experienced substantially increased emissions (greater than 30%); or
b) received new relevant exposure in their vicinity.
A review of industrial process in Greater Manchester has found no installations that
increased emissions substantially or introduced new relevant exposure.
3.3.3 New or Significantly Changed Installations with No Previous Air Quality Assessment
A review of new or significantly changed installations in Greater Manchester with no
previous air quality assessment has produced the following table:-
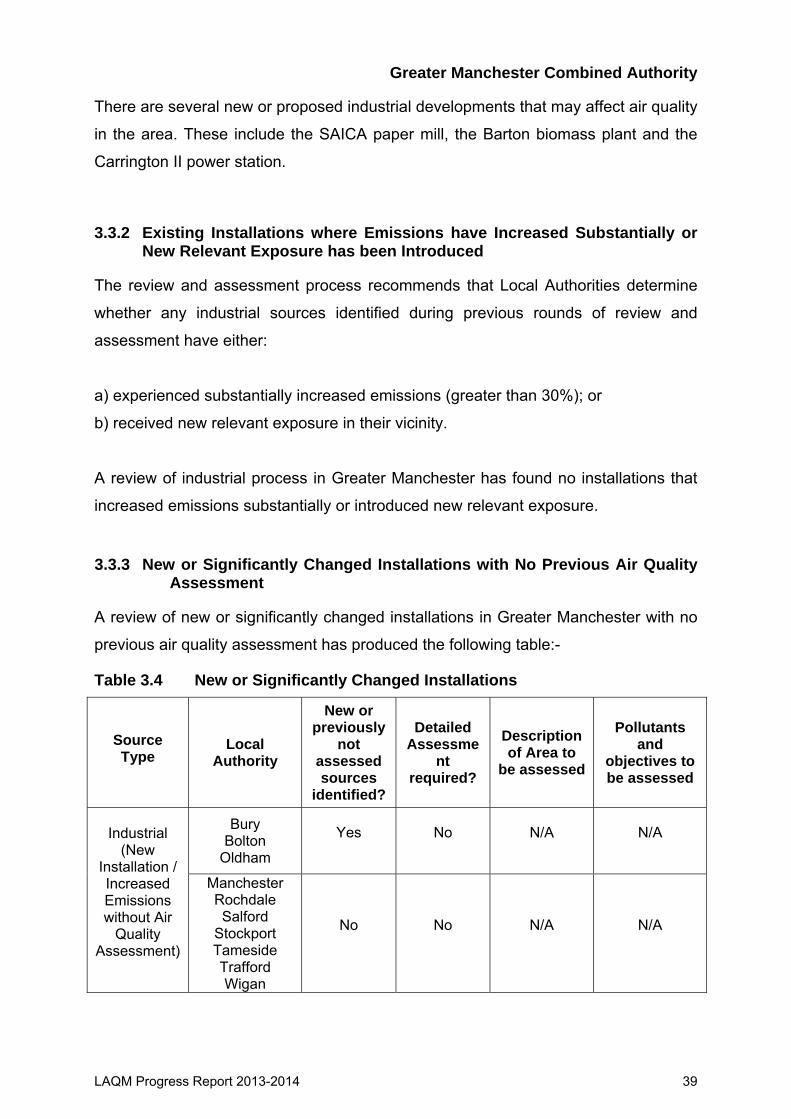
Table 3.4 New or Significantly Changed Installations
Source Type
Local Authority
New or previously
not assessed sources
identified?
Detailed Assessme
nt required?
Description of Area to
be assessed
Pollutants and
objectives to be assessed
Bury Bolton
Oldham
Yes
No
N/A
N/A
Industrial
(New Installation / Increased Emissions without Air
Quality Assessment)
Manchester Rochdale Salford
Stockport Tameside Trafford Wigan
No
No
N/A
N/A
LAQM Progress Report 2013-2014 39
Greater Manchester Combined Authority
Bolton The following processes were identified. Approach 3 in Section C.1 of box 5.5 of
TG(09) was followed, and none of the new industrial installations are associated with
air pollutant emissions which are potentially significant in terms of air quality.
• Tumble Dwyers and Farnworth Dry Cleaners,, new processes - no
exceedence predicted
Bury There are five new or changed processes since 2012 and none of these have
significant emissions to air. Oldham
• Axiom Displays, Mersey Road North, Failsworth, M35 9LT. An application for
a permit for a timber manufacturing installation was received in May 2014.
This has not been determined yet. No air quality assessment has been
provided as part of the application, if approved emissions from the site will be
controlled by the use, and if necessary enforcement, of permit conditions.
• Neild Street Garage, Neild Street, Oldham, OL8 1QG. A permit was issued for
a waste oil burner (<0.4 mW) at this site in January 2014. An air quality
assessment was not included as part of the application. Controls are in place
through the site permit, which was issued using the Process Guidance Note
for this type of installation.
• DC Cook, Middleton Road, Chadderton, Oldham. A permit was issued for a
waste oil burner (< 0.4 mW) at this site in January 2014. An air quality
assessment was not included as part of the application. Controls are in place
through the site permit, which was issued using the Process Guidance Note
for this type of installation.
• Ferguson Polycom, Drury Lane, Chadderton, Oldham. A permit was issued
for a rubber and textile coating installation at the site in August 2012. The site
is not yet fully operational. An air quality assessment was not carried out, but
measures are in place through the environmental permit for the site to control
air quality from the site.
LAQM Progress Report 2013-2014 40

Greater Manchester Combined Authority
3.3.4 Major Fuel (Petrol) Storage Depots
Since the last report there are no new or previously not assessed storage depots.
3.3.5 Petrol Stations
An assessment of appropriate petrol stations in Greater Manchester has produced
the following table:-
Table 3.5 Petrol Stations
Source Type
Local Authority
New or previously
not assessed sources
identified?
Detailed Assessment
required?
Description of Area to
be assessed
Pollutants and
objectives to be assessed
Bolton Yes No N/A N/A
Petrol Stations
Bury Manchester
Oldham Rochdale Stockport Tameside Trafford Wigan
No
No
N/A
N/A
Bolton The following processes were identified. Section C.3 of TG(09) was followed, and none of the new industrial installations are associated with air pollutant emissions which are potentially significant in terms of air quality.
• Bolton (Dawes) Petrol Station new processes - no exceedence predicted.
3.3.6 Poultry Farms
An assessment of poultry farms in Greater Manchester has found no there are no
new or identified sources.
LAQM Progress Report 2013-2014 41
Greater Manchester Combined Authority
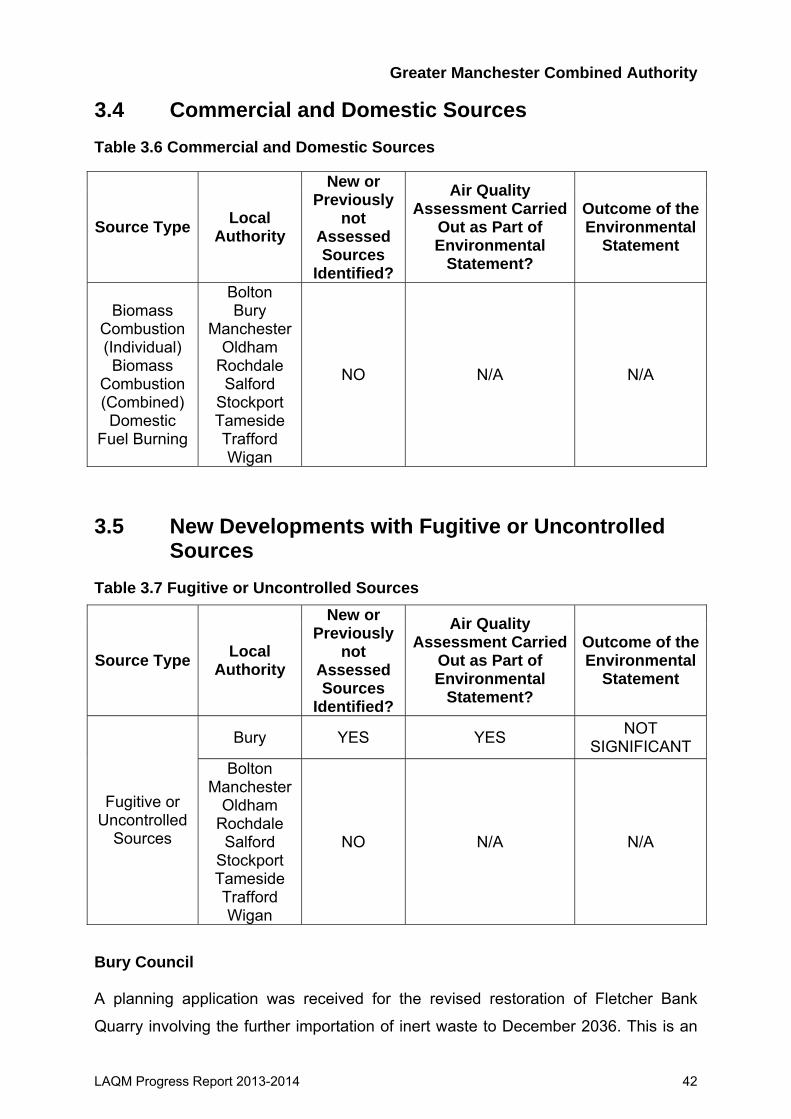
3.4 Commercial and Domestic Sources Table 3.6 Commercial and Domestic Sources
Source Type Local Authority
New or Previously
not Assessed Sources
Identified?
Air Quality Assessment Carried
Out as Part of Environmental
Statement?
Outcome of the Environmental
Statement
Biomass Combustion (Individual) Biomass
Combustion (Combined) Domestic
Fuel Burning
Bolton Bury
Manchester Oldham
Rochdale Salford
Stockport Tameside Trafford Wigan
NO N/A N/A
3.5 New Developments with Fugitive or Uncontrolled Sources
Table 3.7 Fugitive or Uncontrolled Sources
Source Type Local Authority
New or Previously
not Assessed Sources
Identified?
Air Quality Assessment Carried
Out as Part of Environmental
Statement?
Outcome of the Environmental
Statement
Bury YES YES NOT SIGNIFICANT
Fugitive or Uncontrolled
Sources
Bolton Manchester
Oldham Rochdale Salford
Stockport Tameside Trafford Wigan
NO N/A N/A
Bury Council A planning application was received for the revised restoration of Fletcher Bank
Quarry involving the further importation of inert waste to December 2036. This is an
LAQM Progress Report 2013-2014 42
Greater Manchester Combined Authority
extension to existing activities and the air quality assessment submitted with the
planning application indicated that the impact would be insignificant. These
conclusions were accepted by the council.
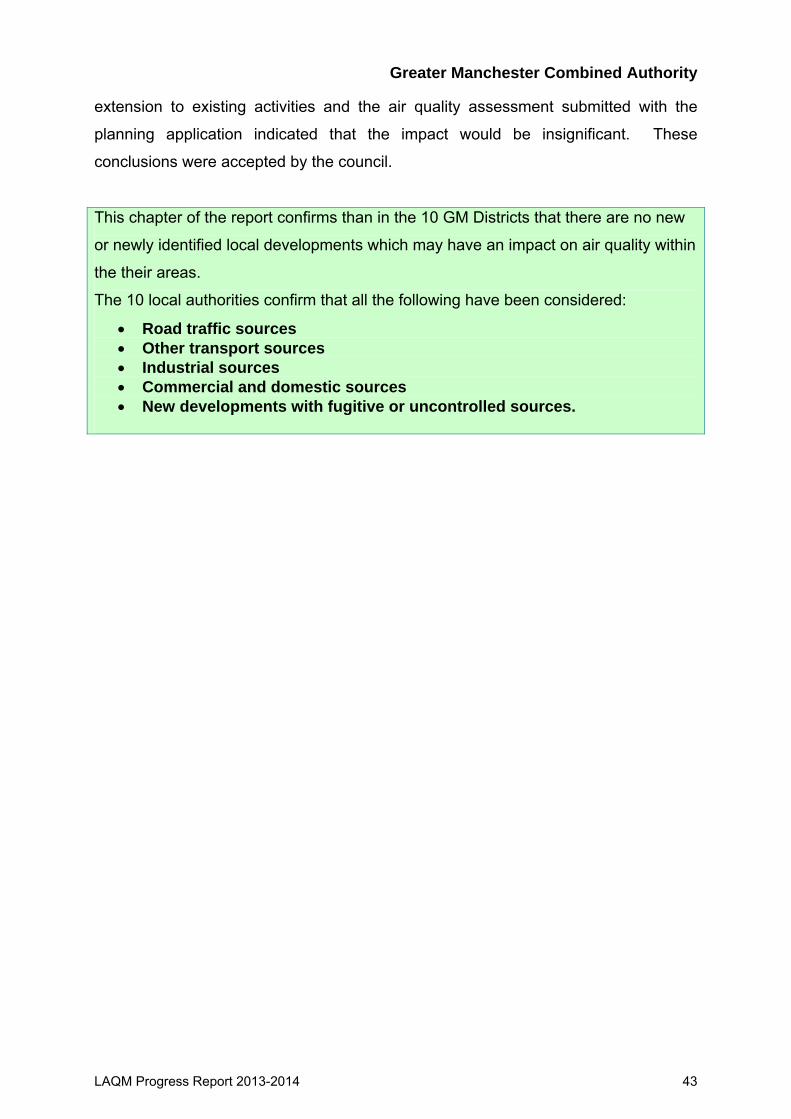
This chapter of the report confirms than in the 10 GM Districts that there are no new
or newly identified local developments which may have an impact on air quality within
the their areas.
The 10 local authorities confirm that all the following have been considered:
• Road traffic sources • Other transport sources • Industrial sources • Commercial and domestic sources • New developments with fugitive or uncontrolled sources.
LAQM Progress Report 2013-2014 43
Greater Manchester Combined Authority
4 Local / Regional Air Quality Strategy
Local \ Regional air quality strategies provide an opportunity for local authorities to
set out the key air quality issues in the region and the principles for improving air
quality while taking into account regional and national policies. Local authorities are
responsible for a number of functions that may affect air quality and are therefore in a
position to influence local measures to improve air quality.
The 10 Greater Manchester Authorities have formed a combined authority to improve
governance on policies and strategies for the city region. The Greater Manchester
Combined Authority (GMCA) has the same powers as the local authorities in respect
of the air quality powers under Section 82 to 84 of the Environment Act 1995 to
review, and access air quality and declares and undertake duties in an air quality
management area.
The Greater Manchester Officers continue to work under the auspices of the Public
Protection Managers as they develop and promote polices for reporting and
improving air quality in the region. The group is well established and meets at regular
intervals. The GMCA will take an increasing lead in co-ordaining air quality polices
with transport and the low carbon economy.
The first Greater Manchester Air Quality strategy was set out in 2002 with the Greater
Manchester Air Quality Management Strategy ‘Clearing the Air’. This set the scene
for developing the Greater Manchester Air Quality Action Plan, which was published
in 2004. Following guidance to link air quality strategies with Local Transport Plans,
where transport was the main contributor, key air quality objectives were transposed
into Local Transport Plan 2011-2016 (LTP3). The Air Quality Local Transport strategy
sets out the steps to reduce emissions associated with local transportation in Greater
Manchester.
The air quality strategy is embedded in the LTP cycle, is reviewed in five yearly
cycles and the current LTP plan is available on line at:
LAQM Progress Report 2013-2014 44
Greater Manchester Combined Authority
http://www.tfgm.com/ltp3/documents/Greater_Manchester_Local_
transport_Plan_Core_Strategy.pdf
Poor air quality has a real and significant effect on people’s lives and on the economy
as a whole. Across the UK, current estimates are that up to 35,000-50,000 people die
prematurely from exposure to air pollution. Our principal aim is substantially to reduce
the negative impacts of air pollution on health and the environment in Greater
Manchester. Whilst in the short and medium term the priority is to meet statutory
limits for major pollutants in all areas, the longer term aims are to promote the image
of Greater Manchester as a progressive city region with a high quality environment
and to reduce the contribution of air pollution to poor health in deprived areas (which
can compound and propagate the problems of deprivation). The encouragement of
active travel modes will assist in reducing emissions whilst simultaneously improving
air quality and the health and productivity of our residents.
Currently many areas within the conurbation, as in many other urban areas across
the UK, exceed EU thresholds for nitrogen dioxide (NO2) concentrations and the
requirement to meet these limits in all areas by 2010 has not been met. Current
forecasts commissioned by Department for Environment, Food and Rural Affairs
indicate that many parts of Greater Manchester and other urban areas will continue
to exceed the limit values in 2015.
The Greater Manchester Air Quality Strategy and Action Plan (2006) set’s out a wide
reaching package of measures to address air pollution from road transport,
accounting for more than 70% of all emissions of NO2 and PM10 (particulate matter)
according to the 2010 EMissions Inventory for Greater MAnchester (EMIGMA). A
particular focus of the strategy was to ensure that all areas of Greater Manchester
would meet EU limits for NO2 in 2010. However, it is apparent that the action plan
has made very little difference to NO2 concentrations at most road side locations,
since the impact of the individual measures was dispersed across the conurbation.
We therefore need to focus activity on the most beneficial options and to concentrate
initiatives geographically.
LAQM Progress Report 2013-2014 45
Greater Manchester Combined Authority
Different modes contribute differently to emissions of NOx, carbon dioxide and
particulates. Whilst cars constitute half of road transport emissions of carbon dioxide,
‘other goods vehicles’ (OGVs), including rigid and articulated HGVs, are the major
contributors to NOx. The potential impact of measures targeted at OGVs is high,
given that they represent only 6.5% of the total vehicle distance travelled on major
roads (including motorways) in Greater Manchester. Although buses are responsible
for a far smaller proportion of NOx emissions, these emissions are concentrated on
congested urban corridors where the exposure of the population is high, which adds
to their significance. The need to reduce NO2 concentrations in the short term will
therefore require a focus on HGV and bus emissions.
In the longer term the approach will be to influence and integrate air quality strategy
with parallel climate change strategy. The contribution of each mode to particulate
emissions is similar to that for carbon, which means that measures to reduce carbon
emissions will also reduce emissions of particulates.
The Greater Manchester overall strategy to improving air quality will be based on:
1. Increasing travel by sustainable modes,
2. Reducing acute pollution incidents from traffic,
3. Improving vehicle efficiency including vehicle and fuel technology and efficient
driving techniques,
4. Encouraging smarter travel through improved fares, ticketing and information,
management of demand for car travel and promotional campaigns,
5. Better integration of transport and new development,
6. Reducing trips by motor vehicles by improvements to public transport and to
infrastructure for walking and cycling; and
7. Improving network efficiency.
The impact on air quality of a mode shift to public transport will be greatest on the
main corridors to the Regional Centre, where passengers have access to newer
buses, introduced through Quality Bus Corridor schemes, and Metrolink, which is
pollution free at the point of usage. Elsewhere, the picture is complicated by the fact
that many buses perform poorly in environmental terms, but our proposals to raise
the quality of bus vehicles, in partnership with operators, will be beneficial in terms of
LAQM Progress Report 2013-2014 46
Greater Manchester Combined Authority
air quality. Different types of diesel train use different quantities of fuel, and the better
quality diesel trains we are seeking in order to improve passenger comfort will use
more fuel per passenger mile. Electrification is always better in air quality terms, and
we will continue to support, and lobby for, further electrification of the rail network.
The Manchester - Liverpool line will be electrified by December 2014 as part of
northern hub to improve the network infrastructure supporting the economy and low
carbon strategies. The approach to managing the highway network aims to reduce
the variability of journey times and maximise efficiency of the network. Reducing
congestion will cut emissions by reducing the need for excessive acceleration and
deceleration or for travelling at slow speeds, at which engine performance is sub-
optimal. However, this may not be the case in all instances and so impacts on air
quality need to be understood in the context of local conditions.
In the short term, options to reduce acute pollution incidents from traffic and to
improve vehicle efficiency are or have included:
- an annual programme of vehicle emissions testing on major transport corridors;
- extending the enforcement of idling vehicles, which is already carried out in the
Regional Centre, to town and district centres;
- targeted renewal of buses on routes into the Regional Centre and in adjacent
areas where permitted levels of pollutants are exceeded;
- support/lobby central government for a national HGV scrappage scheme and
work with the government on complementary regulation measures; and
- co-ordinate the uptake of Safe and Fuel Efficient Driving (SAFED) training for
smaller freight and bus operators and promote continued updates to driving skills
through a best practice scheme.
Through these policies a switch away from car use will contribute to improved air
quality, reduced carbon emissions and the protection of biodiversity.
Despite good progress on these local actions, local air quality has not improved as
anticipated by the use of cleaner vehicles. The reasons are complex but increases in
the number diesel cars in the fleet and higher nitrogen dioxide emissions from
vehicles have hindered air quality improvements. DEFRA are reviewing how to
reshape local air quality management to address these issues by undertaking a
review in England with a consultation in 2013, focussing on greater use of action plan
LAQM Progress Report 2013-2014 47
Greater Manchester Combined Authority
measures to tackle poor air quality. DEFRA expect to publish further guidance in
2014.
LAQM Progress Report 2013-2014 48
Greater Manchester Combined Authority
5 Planning Applications
5.1
5.2
Introduction The impact of new developments on air quality is taken into account where local
assessments have shown that national and European targets are exceeded or are
near the limit or where there is an air quality management area. Local authorities in
Greater Manchester will require the applicant to make a local assessment of the
impact of the development where there is a likely impact. Each district sets it own
policies and procedures for the assessment of planning applications. The
assessment will include the impact of the development on the local area, potential
new exposure and cumulative effects taking in to account existing and proposed
developments. The sections below provide information on local planning applications
with a significant impact on air quality in each district.
Bolton 87582/12 Waste Recycling Centre and Waste Transfer Station
Former Xcide Batteries, Salford Road
Change of use of car park to household waste recycling centre, erection of waste
transfer loading station, site office and formation of new vehicular access
6999/12
Former Bradley Mill, Lever Street. Little Lever
Erection of supermarket together with car parking, access, landscaping and
associated works
87438/12
Land bounded by Bollings Yard/ Johnson Street/Newport Street/ Great Moor Street
(including the railway triangle), Bolton
LAQM Progress Report 2013-2014 49
Greater Manchester Combined Authority
Part A - Demolition of Unity Centre, New bus station and ancillary facilities,
Pedestrian Bridge to rail station, 2 Detached operators buildings, cycle centre, public
realm, landscaping, highway works and amendments to the Bolton interchange on
Newport St
Part B – Future commercial development approved under outline application
83971/10 which will be the subject of a future reserved matters planning application
90539/13
Former Cutacre Opencast Mining Site, Land to the south of the A6 (Salford Road /
Manchester Road West)
Part A : Outline application(access details only) for phased employment development
scheme comprising up to 102Ha of storage and distribution use (class B8), industrial
use (calss B2 ), associated / ancillary uses including business (classB1). Hotel (class
C1), shops services and food and drink (class A1-A5) with associated access,
utilities, ground works and sustainable drainage system.
Part B Full application for access and drainage infrastructure to serve initial
phases(s) of development
5.3
5.4
Bury A number of planning applications have been received for developments that have
the potential to have a significant impact on air quality. The air quality assessments
received with these applications have satisfactorily demonstrated that the
developments will have a negligible or slight adverse impact on air quality. Although
impacts were predicted to be small the developers were asked to take all reasonably
practicable steps to mitigate any negative impacts on air quality.
Manchester Sainsburys Supermarket Ltd
Heaton Park Road,
Blackley,
Manchester,
LAQM Progress Report 2013-2014 50
Greater Manchester Combined Authority
M9 0QS.
Erection of replacement Use Class A1 superstore and 1 no. new non-food shop unit
(total gross internal floorspace of 14,306 sq. m, including 400 sq. m net for the non-
food unit), with associated car parking area, relocated servicing road, landscaping
and recycling facilities.
Gateway House,
Station Approach,
Ducie Street,
Manchester.
The refurbishment of Gateway House to create a 270 bedroom hotel with restaurant,
bar and meeting rooms above a ground floor retail space for use for Class A1 (Shop)
use or Class A2 (Financial and Professional Services) Use or Class A3 (Restaurant
and Cafe) Use or Class A4 (Drinking Establishment) Use or Class A5 (Hot Food Take
Away) Use, erection of new 7 storey office connected to Gateway House by bridge
link, erection of new 3 storey gym and demolition of existing single storey building on
Ducie Street.
Land Bounded By Ashton New Road, Score Street, Ashton Canal, Clayton Lane,
Wilson Street And Alan Turing Way
Openshaw West,
Manchester.
Outline application for development comprising football training facilities, a 7,000-
capacity Arena and ancillary Offices and Media Centre, 12 full-size and 2 half-size
football training pitches, detached building forming accommodation for Youth
Development and First Teams and incorporating two full size football pitches, a
grounds maintenance building, Energy centre, pedestrian bridge across Ashton New
Road linking to the Etihad Stadium, associated parking, landscaping, boundary
treatments and other infrastructure works with all matters to be considered: and,
Outline application for an Institute for Sports Medicine (a medical assessment,
diagnosis and treatment centre, and research and product development facility in the
fields of physiotherapy and sports science) and new Sixth Form College in the South
West corner of the site with all matters reserved; following the demolition of all
existing on site structures.
LAQM Progress Report 2013-2014 51

Greater Manchester Combined Authority
Elisabeth House,
2 - 14 St Peters Square,
Manchester,
M2 3DE
Redevelopment to create a 14 storey plus basement building incorporating Class B1
offices on upper floors, ground floor cafe, restaurant and bar uses (Class A3 and A4)
and basement car parking with related highways, access, servicing and landscaping
works, following demolition of existing building.
Howells Railway Products Ltd,
Sharston Industrial Area,
Longley Lane,
Northenden,
Manchester,
M22 4SS.
Erection of a two storey side extension to existing industrial building (B2) following
demolition of detached single storey building.
Units 2-6,
Cheetwood Road,
Cheetham Hill,
Manchester,
M8 8AT.
Change of use to 7 ground floor and 1 basement wholesale cash and carry units (sui
generis), with associated elevational alterations
5.5 Oldham The following air quality assessments have been submitted in relation to planning
applications in the Oldham area:
PA/335177/13 – Land at the junction of Henshaw Street and Lord Street. This is a
planning application for the installation of a replacement boiler. The air quality
assessment identified that there would be a slight adverse to negligible impact for
LAQM Progress Report 2013-2014 52
Greater Manchester Combined Authority
nitrogen dioxide and a negligible impact for PM10. Predicted air quality
concentrations were all below the air quality limit values at all relevant locations.
There are therefore no proposals to undertake further air quality assessments in
relation to this development.
PA/334355/13 – Foxdenton Strategic site, Broadway/Foxdenton Lane, Chadderton,
Oldham, OL9 9QR. This application is for a large mixed use development including a
new road, offices, industrial use, residential and public open space. A decision on the
application is pending. The air quality report submitted with the application identified
a slight adverse at some receptor locations and a negligible impact at other locations.
The impact on PM10 concentrations is negligible / not significant. If approved the
development will be considered in future air quality reports.
PA/335177/14 – Land bound by Radcliffe Street, Park Street and Cardigan Street,
Royton. This application is for the demolition of an existing pool and police station
and the construction of a new leisure centre. The air quality impact identified that the
development would have a negligible impact on air quality and that concentrations
would all be below the air quality standards.
PA/335065/14 – Land bounded by Middleton Road, St. Domingo Street and Booth
Street. This application is for the demolition of two public houses and the erection of
a new leisure centre. The site was previously used as a food store, health centre
and clinic. The air quality assessment identified that there would be a decrease in
pollution concentrations as a result of the development. No exceedances of the air
quality objectives have been identified.
5.6
5.7
Rochdale NO INFORMATION RECEIVED
Salford Urban Vision assess all major planning applications for Salford City Council. If
necessary the Council will require the developer to put in place mitigation measures
to reduce the impact of a development to protect new or existing residents in the
LAQM Progress Report 2013-2014 53

Greater Manchester Combined Authority
locality. Dust Management Plans are required on large schemes during construction
and complaints are monitored by our Environmental Protection Team.
Major applications, meeting our validation criteria will require air quality assessments.
Salford also provided comments to Trafford on impact of a 20 MW Biomass Plant at
the planning stage (2011/12) and permitting stage (2012). The application was
approved on appeal. Other applications had no significant air quality impacts in
Salford. Monitoring programmes and review and assessment reports ensure that
changes in local exposure are captured.
5.8 Stockport Proposal: Construction of the A6 to Manchester Airport Relief Road (whole route),
incorporating: Seven new road junctions;
Modification to four existing road junctions;
Four new rail bridge crossings;
Three new public rights of way/accommodation bridges;
Four new road bridges;
A pedestrian & cycle route;
Six balancing ponds; and
Associated landscaping, lighting and infrastructure works.
Within Stockport: Six new road junctions;
Modification to three existing road junctions;
Three new rail bridge crossings;
One new public right of way/accommodation bridge;
Three new road bridges;
A pedestrian cycle route;
Four balancing ponds; and
Associated landscaping, lighting, engineering and infrastructure works.
Location: Land to the south of Stockport, adjacent to and between the A6 (Buxton
Road) and land to the east of the Styal railway line, north of Styal Golf Course.
LAQM Progress Report 2013-2014 54
Greater Manchester Combined Authority
5.9
5.10
5.11
Tameside Tameside’s Environmental Protection Unit reviews all planning applications
submitted to the authority. Where necessary, they will require the developer to
implement measures to reduce any adverse impact the development will have on
local air quality, protecting both existing and future residents in the area.
In 2012/13 there were no developments that had significant impacts on air quality.
Trafford The Trafford Core Strategy, as part of the Local Development Framework, contains
the relevant planning policy to protect and improve air quality in the borough. In this
reporting period there were no new developments that had significant impacts on air
quality.
Wigan Business compliance and Improvement at Wigan Council review all planning
applications, and where required condition the planning application so that a full
assessment is undertaken and measure implemented to reduce or negate the
impacts, including Air Quality.
Tesco retail and petrol station and cinema complex:
Barlo House,
Spinning Jenny Way,
Leigh.
Redevelopment of former radiator site to provide supermarket (Class A1), a seven sc
reen cinema (Class D2), four restaurant units (Class A3), a petrol filling station and a
ssociated kiosk, alterations to the access arrangements, associated servicing, car.
Morrisons Food Store and Petrol Station:
Leigh Sports Village,
Atherleigh Way,
Leigh.
Leigh Sports Village Phase III commercial and related works, comprising alterations
LAQM Progress Report 2013-2014 55
Greater Manchester Combined Authority
in the floor space composition and positioning of planning permission A/03/58535 to
provide for a food store and ancillary petrol filling station, class A1 - A5 units
Bickershaw South,
Bickershaw Colliery Site,
Plank lane,
Leigh.
Mixed use development comprising 471 residential units (437 dwellings and 34 apart
ments), 644 square metres of office space, a community centre and cafe, together
with associated public open space and landscaping.
Parsonage Retail - Sainsburys Food store and petrol station
Sainsburys,
Parsonage Retail Park,
Parsonage Way,
Leigh. Demolition of existing retail unit to create customer car park, new access point from Atherleigh Way and associated works.
LAQM Progress Report 2013-2014 56

Greater Manchester Combined Authority
6 Air Quality Planning Policies
Air quality is a material consideration when a development is planned. Each council
will require an air quality assessment where it considers impacts from the
development may affect air quality or be detrimental to the environment or people’s
health. Districts will provide guidance and advice using local and national polices to
assist developers, consultants, on air quality issues regarding developments in their
area. Appendix 3 contains the individual policies of the Greater Manchester
Authorities.
Nationally policy is set by the National Planning Policy Framework which replaced
the previous guidance on air quality and pollution set in PPS 23. The document
states that the planning system should contribute and enhance the natural and local
environment by preventing new and existing development from contributing to or
being put at an unacceptable risk from, or being adversely affected by unacceptable
levels of soil, air, water or noise pollution. It also states that planning decisions
should take into account the presence of AQMAs, and that any new development is
consistent with the air quality action plan.
The 10 Greater Manchester Authorities have formed a Combined Authority (CA) to
improve governance on policies and strategies for the city region. Together with the
Association of Greater Manchester Authorities (AGMA) the Combined Authority will
develop a range of sub-regional planning documents including the Greater
Manchester Strategy 2013-2020 Stronger Together. The CA also shares the same
powers as the local authorities in respect of the air quality powers under Section 82
to 84 of the Environment Act 1995 to review, and access air quality and declares and
undertakes duties in an air quality management area.
The Greater Manchester Strategy (GMS) sets our direction of travel and priority
actions to 2020. Among its key priorities, are a low carbon economy and sustainable
development to underpin future prosperity and economic development for the city
region. Optimising the low carbon economy to reduce air quality emissions though
LAQM Progress Report 2013-2014 57
Greater Manchester Combined Authority
the LTP can yield additional benefits to the economy such as reducing health costs,
while also making more effective use of limited funds.
The first Greater Manchester Air Quality strategy was set out in 2002 with the Greater
Manchester Air Quality Management Strategy ‘Clearing the Air’. This set the scene
for developing the Greater Manchester Air Quality Action Plan, which was published
in 2004. Following guidance to link air quality strategies with Local Transport Plans,
where transport was the main contributor, key air quality objectives were transposed
into the Local Transport Plan 2011-2016 (LTP3). The Air Quality Local Transport
strategy sets out the steps to reduce emissions associated with local transportation in
Greater Manchester. The air quality strategy is embedded in the LTP cycle, is
reviewed in five yearly cycles and the current LTP plan is available on line at:
http://www.tfgm.com/ltp3/Pages/Local-Transport-Plan.aspx
LAQM Progress Report 2013-2014 58
Greater Manchester Combined Authority
7 Local Transport Plans and Strategies
Greater Manchester published its third Local Transport Plan in April 2011, setting out
the plans and spending priorities of Transport for Greater Manchester. The Greater
Manchester Air quality Strategy is in the LTP aims to substantially reduce the
negative impacts of transport on heath and the environment by modal shift away from
vehicles and integrating with measures with the low carbon economy. The Plan
includes a Long-Term Strategy outlining our transport vision for the next fifteen years;
together with a series of detailed Local Area Implementation Plans which set out our
collective spending plans for the next four years, up to 2025. This plans cover all
modes of travel, including buses, heavy rail, Metrolink, walking, cycling, cars and
freight, as well as the other issues which affect people's travel choices - fares,
ticketing, passenger information, accessibility and safety
The current levels of poor air quality and concerns over general health have
highlighted the need to increase the walking or cycling for shorter journeys. At the
time of writing the plan, 15 per cent of people commuting by car travel less than 2km
(just over 1 mile) and more than 30 per cent of car commuters travel less than 5km
(around 3 miles). The aim is to encourage more people to make shorter journeys on
foot or by bicycle to reduce local car traffic and emissions while also promoting an
active lifestyle to promote healthier living.
LAQM Progress Report 2013-2014 59
Greater Manchester Combined Authority
8 Climate Change Strategies
8.1
8.2
8.3
Introduction Although aimed primarily at carbon emissions one of the principle outcomes of this
strategy will be a significant reduction in fossil fuel use, which in most cases will lead
to a corresponding reduction in the release of nitrogen dioxide and particulates. It is
envisaged that this strategy and the momentum that it builds in our communities will
contribute immensely to the improvement of air quality in the Greater Manchester
Area.
Objectives This strategy sets out 4 main objectives and these are outlined as follows:-
- To make a rapid transition to a low carbon economy
- To reduce carbon emissions by 48% (from a 1990 baseline) by 2050
- To be prepared for and actively adapt to a rapidly changing climate
- To embed carbon literacy into the culture of organisations, lifestyles and
behaviours.
A number of actions are described which will help Greater Manchester to pursue
these objectives and are divided into specific themes.
Actions The following action themes from the Greater Manchester Climate Change Strategy
are likely to have a positive impact on air quality.
8.3.1 Transport Transport accounts for 30% of our total emissions and future growth patterns suggest
that this is likely to increase if no action is taken. This area of activity is likely to have
the biggest impact on air quality and actions include:-
- Setting targets for reducing carbon emissions from transport
- Reducing congestion
- Manage freight including the introduction of consolidation centres
LAQM Progress Report 2013-2014 60
Greater Manchester Combined Authority
- Continue investment in bus rail and Metrolink services to encourage modal shift
and manage the impact of transport emissions from new developments.
- Improving passenger information/communication re public transport along with
pricing improvements to encourage large scale behavioural change.
- Introduce smart ticketing across Greater Manchester to encourage use of public
transport
- Encourage flexible and home working policies to reduce the need to travel at
peak times.
- Support community initiatives that encourage behavioural change e.g. cycle
training, cycle loan agreements improved cycle infrastructure.
- Establish Greater Manchester as a centre for car clubs and car sharing
- Market and promote cycling.
- Partnership contracts with bus operators to improve performance, reliability,
affordability and accessibility on the bus network.
- Work with all Greater Manchester councils to tackle emissions relating to
commuting into Manchester centre.
- Develop new approaches to reduce emissions from freight- looking specifically at
logistics, technology, driving styles and fuels.
- Support the uptake of low carbon vehicles and fuels.
- Utilise intelligent traffic management systems to relieve congestion and reduce
emissions.
8.3.2 Buildings Buildings account for 36% of carbon emissions and therefore this is a key area of
activity. Actions include:-
- Retrofitting energy efficiency and micro generation technologies to existing
buildings both domestic and commercial.
- Improving the low carbon performance of new build.
- Promoting Green Deal.
- Adapting to climate change.
- Improving carbon literacy.
- Promoting low carbon businesses.
- Supporting research and technological development.
LAQM Progress Report 2013-2014 61
Greater Manchester Combined Authority
8.3.3 Energy Distribution, Generation and Use. Greater Manchester is powered by a mix of gas, electricity, transport fuels and a
small amount of oil, solid fuel and biomass. Only a small percentage of our energy
comes from renewable energy sources. This area of the strategy aims to address this
by promoting renewables and reducing our dependency on fossil fuels. Actions
include:-
- Create market conditions which promote low and zero carbon energy generation
and distribution.
- Develop understanding of the need to decarbonise energy supplies.
- Support and invest in renewable and low carbon generation.
- Integrate development of new heating/generation networks with major retrofitting
programmes.
- To be early adopters of smart grids and smart technologies.
8.3.4 Sustainable Consumption Everything we consume has a carbon impact. The goods and services we purchase,
the food we eat, the way we use buildings and the way we choose to travel all result
in what we call embedded emissions in their production, use and disposal. This
strategy recognises the importance of embedded emissions and the need for a
“consumption based” approach to emissions reduction. Although aimed at carbon,
the reduction of embedded carbon emissions is likely to lead to an associated
reduction in other air pollutants such as nitrogen dioxide and particulates.
Actions include:-
- Developed understanding of embedded emissions.
- Continue and extend business pledge and ENWORKS programmes to identify,
engage and nurture the next generation of low carbon business leaders.
- Improve waste and resource management.
- Develop innovative approaches to increase local manufacture, assembly and
repair of low carbon products.
- Promote sustainable procurement with local business partners.
- Enable and promote a sustainable framework of local food production to connect
local producers and consumers.
LAQM Progress Report 2013-2014 62
Greater Manchester Combined Authority
8.3.5 Enabling and Cross Cutting Actions In addition the clearly identified areas of action above the GM strategy includes a
number of actions that cut across these themes and these can be outlined as follows.
- Creating Green Jobs- to create a thriving low carbon economy.
- Working across spatial levels – ensuring collaboration of all appropriate agencies
to deliver objectives.
- Developing a common measurement methodology – to ensure a robust common
approach to carbon accounting.
- Co-ordinating business and organisation networks – to ensure businesses realise
their full potential in contributing to and benefiting from the low carbon economy.
- Recognising inequality, health and wellbeing – to address the risk that people and
places facing poverty are likely to be disproportionately affected by climate
change.
- Embedding action on climate change within the spatial strategy - to ensure that
local planning frameworks will help to deliver the Greater Manchester objectives.
8.4 Conclusions The Greater Manchester Climate Change Strategy is an ambitious strategy to reduce
carbon emissions and to embed carbon management into business, economic and
training activities in our region. Although aimed at carbon the strategy will seek to set
up robust systems to reduce fossil fuel use into the future and this will also have a
positive impact on the reduction of emissions of nitrogen dioxide and particulates.
LAQM Progress Report 2013-2014 63

Greater Manchester Combined Authority
9 Implementation of Action Plans
The progress report on the Air Quality Action Plan will be submitted separately.
LAQM Progress Report 2013-2014 64
Greater Manchester Combined Authority
10 Conclusions and Proposed Actions
10.1
10.2
10.3
Conclusions from New Monitoring Data
The annual mean air quality objective for nitrogen dioxide is exceeded at some
automatic sites and diffusion tube locations in Greater Manchester and the Air
Quality Management Area (AQMA) should remain in place.
There are some sites in the AQMA that are below the threshold of it’s declaration at
35 µg/m3 and Greater Manchester has recently re-modelled the area to update the
area of likely exceedences. A modelling report will be submitted to DEFRA on the
proposed changes to the AQMA.
There are no exceedences of the hourly nitrogen dioxide standard.
Particulate matter (less than 10 microns) annual averages are not exceeded and
have a downward trend. No sites had more than 35 occurrences of the daily mean
and therefore the air quality objective was met.
Conclusions relating to New Local Developments The assessment of new local developments has not identified any significant impacts
on air quality. It is concluded that it will not be necessary to proceed to Detailed
Assessment.
Proposed Actions The Progress Report shows an improvement in local air quality and but area remain
above the air quality objective. Greater Manchester has completed a modelling
assessment and will submit a report on proposed changes to the air quality
management area to DEFRA..
LAQM Progress Report 2013-2014 65
Greater Manchester Combined Authority
11 References Abbot, J. 2008. Technical Guidance: Screening assessment for biomass boilers [online], AEA Energy & Environment. Available Internet: http://uk-air.defra.gov.uk/reports/cat18/0806261519_methods.pdf AEA Technology. 2012. UNECE Emission Estimates to 2010 - Sulphur dioxide, National Atmospheric Emissions Inventory. Available Internet: http://naei.defra.gov.uk/emissions/emissions_2010/summary_tables.php?action=unece&page_name=SO210.html Association of Greater Manchester Authorities http://www.agma.gov.uk/ Association of Greater Manchester Authorities (AGMA). 1997. Greater Manchester Air Quality Management Strategy - 'Clearing the Air', AGMA. Association of Greater Manchester Authorities (AGMA). 2004. The Greater Manchester Air Quality Action Plan (online), AGMA. Available Internet: http://www.manchester.gov.uk/download/downloads/id/14851/greater_manchester_air_quality_action_plan_-_2004 Department for Environment, Food and Rural Affairs (Defra). 2009. Technical Guidance LAQM.TG (09), Defra publications. https://www.gov.uk/government/uploads/system/uploads/attachment_data/file/69334/pb13081-tech-guidance-laqm-tg-09-090218.pdf Department for Environment, Food and Rural Affairs (Defra). 2010. FAQ - How can I identify areas in my district where burning of solid fuels such as coal, smokeless fuel or wood (i.e. biomass) might be leading to exceedances of the 2004 daily mean PM10 air quality objective (and the 2010 annual mean objective in Scotland)? [online], DEFRA. Available Internet: http://laqm.defra.gov.uk/laqm-faqs/faq36.html Department for Environment, Food and Rural Affairs (Defra). 2011. QA QC Framework (online), Defra. Available Internet: http://laqm.defra.gov.uk/diffusion-tubes/qa-qc-framework.html Department for Environment, Food and Rural Affairs (Defra). 2012. National bias adjustment factors (online), Defra. Available Internet: http://laqm.defra.gov.uk/bias-adjustment-factors/national-bias.html Department for Environment, Food and Rural Affairs (Defra). 2012. Defra National Statistics Release: Air quality statistics in the UK, 1987 to 2011 – Final (online), Defra. Available Internet: http://www.defra.gov.uk/statistics/files/Air-Qual-Statistics-final-release-2011.pdf EMissions Inventory for Greater MAnchester (EMIGMA) Reports page hosted by Transport for Greater Manchester (TfGM) formerly Greater Manchester Transportation Unit http://www.gmtu.gov.uk/reports/emigma.htm
LAQM Progress Report 2013-2014 66
Greater Manchester Combined Authority
2007 Update published Feb 12 http://www.gmtu.gov.uk/reports/emigma/HFASReport1679v1.0.pdf 2008 Update published March 2013 http://www.gmtu.gov.uk/reports/emigma/HFASReport1692v1.0.pdf 2010 Update published May 2014 http://www.gmtu.gov.uk/reports/emigma/HFASReport1750v1.0.pdf Greater Manchester Air Quality Action Plan (2004) http://www.manchester.gov.uk/download/downloads/id/14851/greater_manchester_air_quality_action_plan_-_2004 Greater Manchester Combined Authority and Transport for Greater Manchester. 2011. Greater Manchester’s third Local Transport Plan 2011/12 – 2015/16 (online), Transport for Greater Manchester. Available Internet: http://www.tfgm.com/ltp3/ Local Transport Plan (LTP) http://www.tfgm.com/ltp3/Pages/Local-Transport-Plan.aspx Local_ transport_Plan_Core_Strategy.pdf http://www.tfgm.com/ltp3/documents/Greater_Manchester_Local_ Local transport_Plan_Core_Strategy.pdf Local Transport Plan (Ltp3) Air Quality Strategy http://www.tfgm.com/journey_planning/LTP3/Documents/Air-Quality-Strategy-and-Action-Plan.pdf Manchester Strategy 2013-2020 Stronger Together http://www.agma.gov.uk/gmca/gms_2013/index.html Low Carbon Benefits to the Economy http://europeanclimate.org/wp-content/uploads/2014/06/EY_ECF_Macro-economic-impacts-of-the-low-carbon-transition_Report_2014-06-05.pdf http://laqm.defra.gov.uk/laqm-faqs/faq36.html http://laqm.defra.gov.uk/diffusion-tubes/qa-qc-framework.html
http://laqm.defra.gov.uk/bias-adjustment-factors/national-bias.html
The Air Quality Strategy for England, Scotland, Wales and Northern Ireland, Defra. The Air Quality (England) (Amendment) Regulations, 2002, Statutory Instrument 3043 (2002), HMSO. Defra (2007) The Air Quality Regulations, 2000, Statutory Instrument 928 (2000), HMSO, London
LAQM Progress Report 2013-2014 67
Greater Manchester Combined Authority
Appendices
Appendix 1: QA:QC Data Appendix 2: Monitoring Data Appendix 3: Local Authority Air Quality Planning Policies
LAQM Progress Report 2013-2014 68
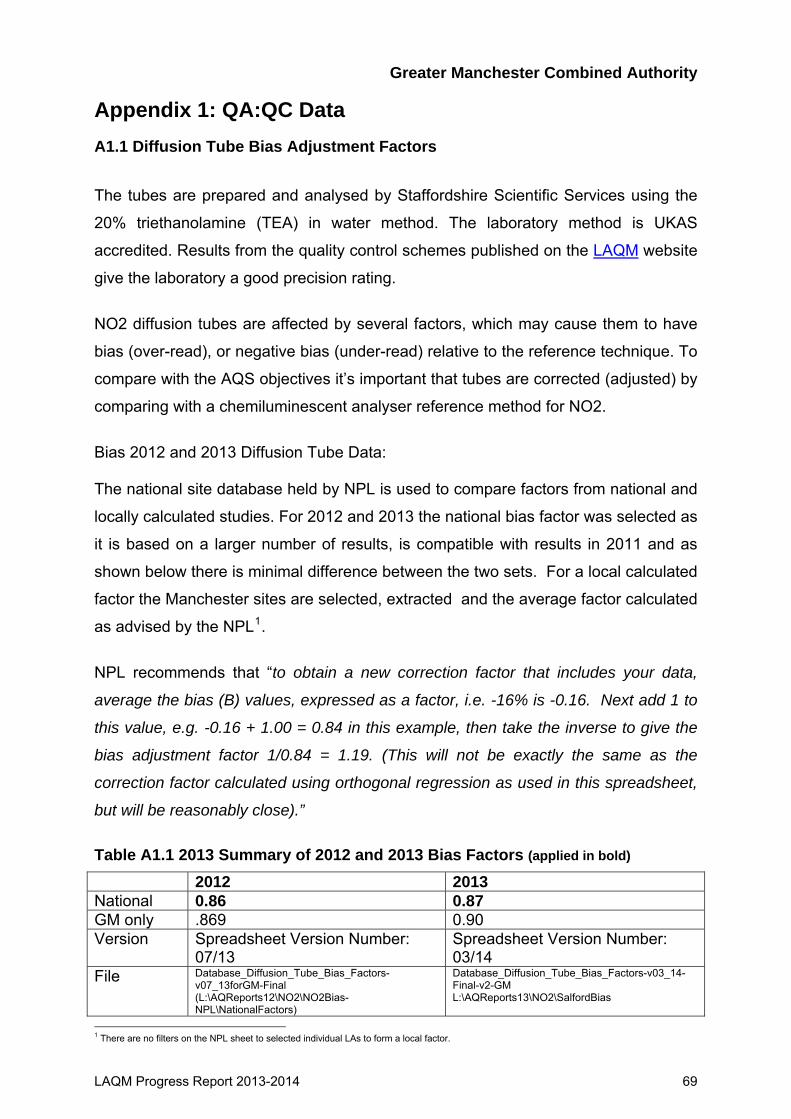
Greater Manchester Combined Authority
Appendix 1: QA:QC Data A1.1 Diffusion Tube Bias Adjustment Factors The tubes are prepared and analysed by Staffordshire Scientific Services using the
20% triethanolamine (TEA) in water method. The laboratory method is UKAS
accredited. Results from the quality control schemes published on the LAQM website
give the laboratory a good precision rating.
NO2 diffusion tubes are affected by several factors, which may cause them to have
bias (over-read), or negative bias (under-read) relative to the reference technique. To
compare with the AQS objectives it’s important that tubes are corrected (adjusted) by
comparing with a chemiluminescent analyser reference method for NO2.
Bias 2012 and 2013 Diffusion Tube Data: The national site database held by NPL is used to compare factors from national and
locally calculated studies. For 2012 and 2013 the national bias factor was selected as
it is based on a larger number of results, is compatible with results in 2011 and as
shown below there is minimal difference between the two sets. For a local calculated
factor the Manchester sites are selected, extracted and the average factor calculated
as advised by the NPL1.
NPL recommends that “to obtain a new correction factor that includes your data,
average the bias (B) values, expressed as a factor, i.e. -16% is -0.16. Next add 1 to
this value, e.g. -0.16 + 1.00 = 0.84 in this example, then take the inverse to give the
bias adjustment factor 1/0.84 = 1.19. (This will not be exactly the same as the
correction factor calculated using orthogonal regression as used in this spreadsheet,
but will be reasonably close).”
Table A1.1 2013 Summary of 2012 and 2013 Bias Factors (applied in bold) 2012 2013 National 0.86 0.87 GM only .869 0.90 Version Spreadsheet Version Number:
07/13 Spreadsheet Version Number: 03/14
File Database_Diffusion_Tube_Bias_Factors-v07_13forGM-Final (L:\AQReports12\NO2\NO2Bias-NPL\NationalFactors)
Database_Diffusion_Tube_Bias_Factors-v03_14-Final-v2-GM L:\AQReports13\NO2\SalfordBias
1 There are no filters on the NPL sheet to selected individual LAs to form a local factor.
LAQM Progress Report 2013-2014 69
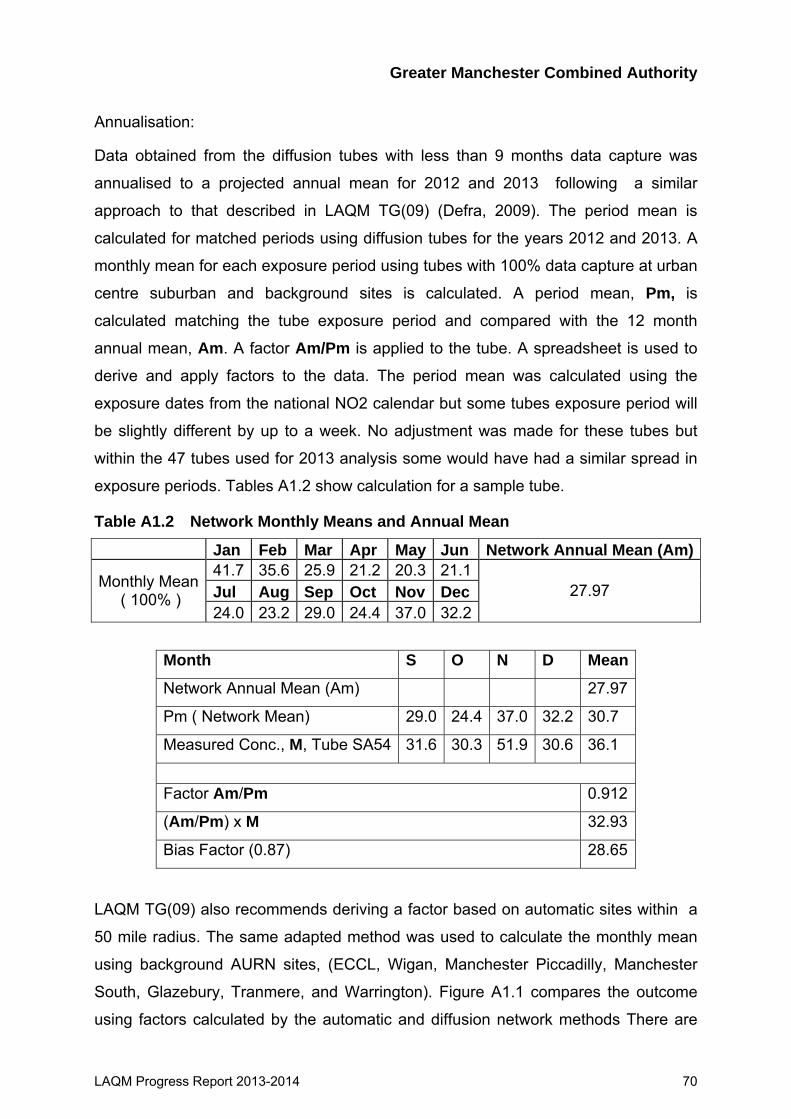
Greater Manchester Combined Authority
Annualisation: Data obtained from the diffusion tubes with less than 9 months data capture was
annualised to a projected annual mean for 2012 and 2013 following a similar
approach to that described in LAQM TG(09) (Defra, 2009). The period mean is
calculated for matched periods using diffusion tubes for the years 2012 and 2013. A
monthly mean for each exposure period using tubes with 100% data capture at urban
centre suburban and background sites is calculated. A period mean, Pm, is
calculated matching the tube exposure period and compared with the 12 month
annual mean, Am. A factor Am/Pm is applied to the tube. A spreadsheet is used to
derive and apply factors to the data. The period mean was calculated using the
exposure dates from the national NO2 calendar but some tubes exposure period will
be slightly different by up to a week. No adjustment was made for these tubes but
within the 47 tubes used for 2013 analysis some would have had a similar spread in
exposure periods. Tables A1.2 show calculation for a sample tube.
Table A1.2 Network Monthly Means and Annual Mean
Jan Feb Mar Apr May Jun Network Annual Mean (Am) 41.7 35.6 25.9 21.2 20.3 21.1Jul Aug Sep Oct Nov DecMonthly Mean
( 100% ) 24.0 23.2 29.0 24.4 37.0 32.2
27.97
Month S O N D Mean
Network Annual Mean (Am) 27.97
Pm ( Network Mean) 29.0 24.4 37.0 32.2 30.7
Measured Conc., M, Tube SA54 31.6 30.3 51.9 30.6 36.1
Factor Am/Pm 0.912
(Am/Pm) x M 32.93
Bias Factor (0.87) 28.65
LAQM TG(09) also recommends deriving a factor based on automatic sites within a
50 mile radius. The same adapted method was used to calculate the monthly mean
using background AURN sites, (ECCL, Wigan, Manchester Piccadilly, Manchester
South, Glazebury, Tranmere, and Warrington). Figure A1.1 compares the outcome
using factors calculated by the automatic and diffusion network methods There are
LAQM Progress Report 2013-2014 70
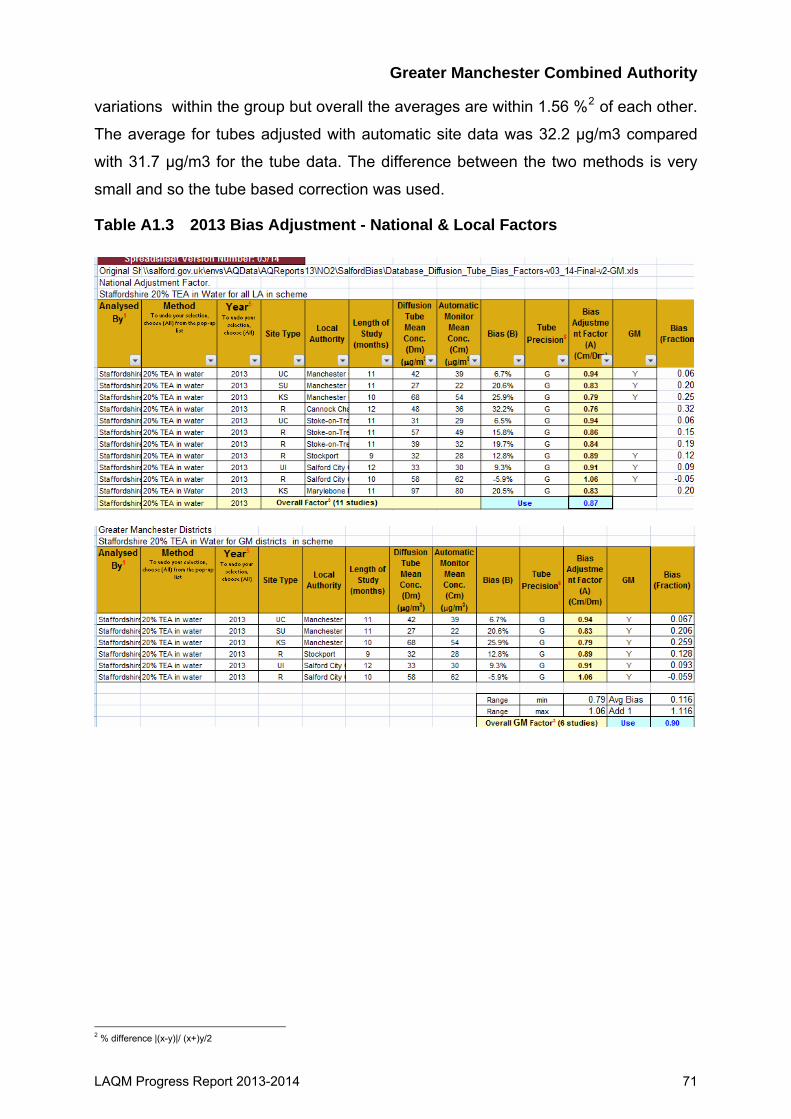
Greater Manchester Combined Authority
variations within the group but overall the averages are within 1.56 %2 of each other.
The average for tubes adjusted with automatic site data was 32.2 µg/m3 compared
with 31.7 µg/m3 for the tube data. The difference between the two methods is very
small and so the tube based correction was used.
Table A1.3 2013 Bias Adjustment - National & Local Factors
2 % difference |(x-y)|/ (x+)y/2
LAQM Progress Report 2013-2014 71
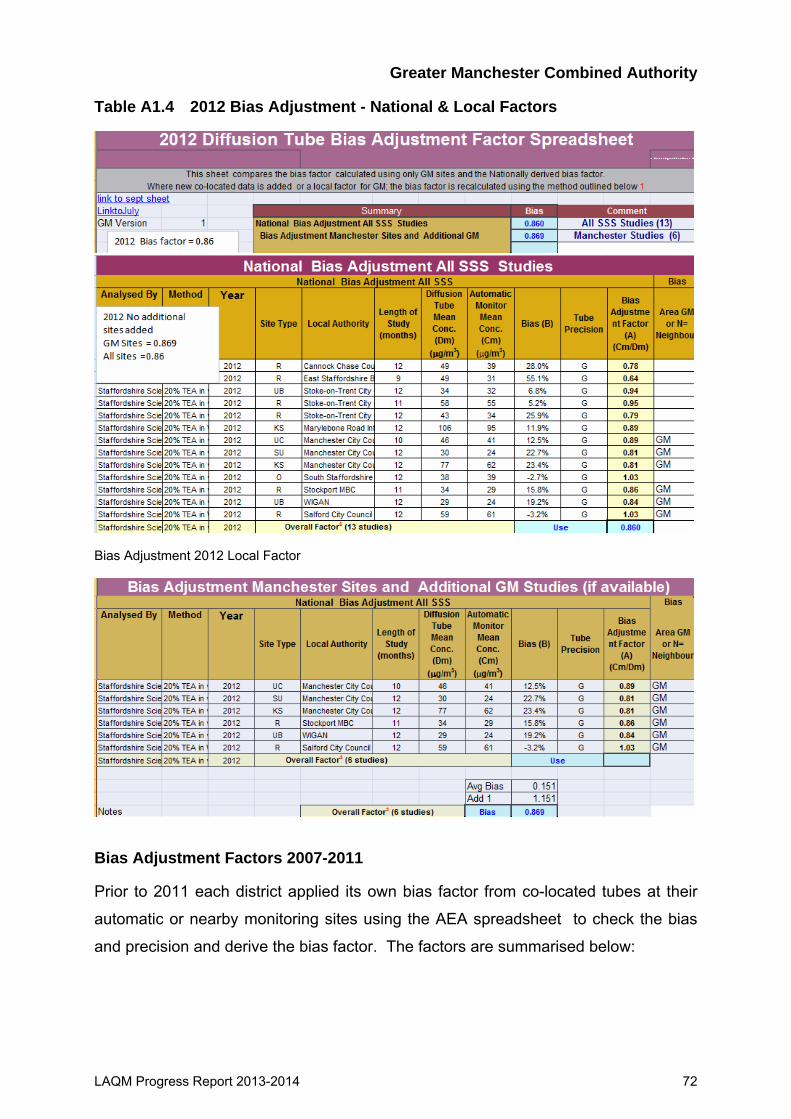
Greater Manchester Combined Authority
Table A1.4 2012 Bias Adjustment - National & Local Factors
Bias Adjustment 2012 Local Factor
Bias Adjustment Factors 2007-2011 Prior to 2011 each district applied its own bias factor from co-located tubes at their
automatic or nearby monitoring sites using the AEA spreadsheet to check the bias
and precision and derive the bias factor. The factors are summarised below:
LAQM Progress Report 2013-2014 72
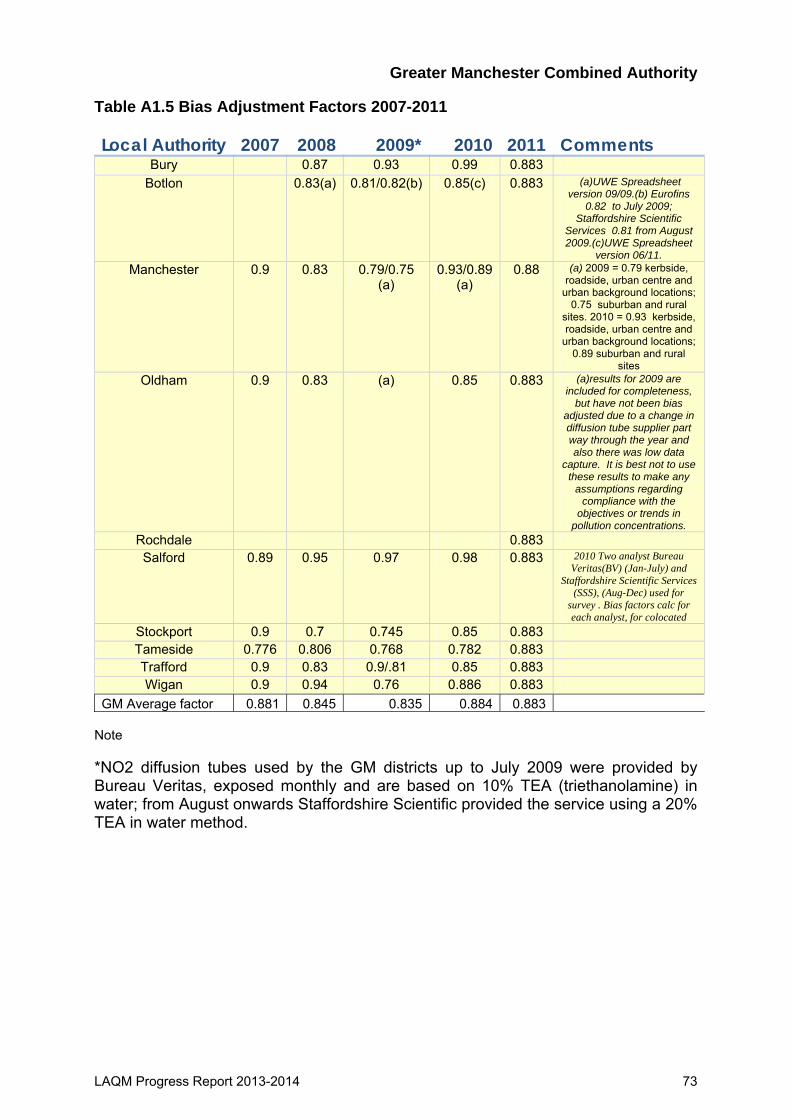
Greater Manchester Combined Authority
LAQM Progress Report 2013-2014 73
Table A1.5 Bias Adjustment Factors 2007-2011
Local Authority 2007 2008 2009* 2010 2011 Comments Bury 0.87 0.93 0.99 0.883
Botlon 0.83(a) 0.81/0.82(b) 0.85(c) 0.883 (a)UWE Spreadsheet version 09/09.(b) Eurofins
0.82 to July 2009; Staffordshire Scientific
Services 0.81 from August 2009.(c)UWE Spreadsheet
version 06/11. Manchester 0.9 0.83 0.79/0.75
(a) 0.93/0.89
(a) 0.88 (a) 2009 = 0.79 kerbside,
roadside, urban centre and urban background locations;
0.75 suburban and rural sites. 2010 = 0.93 kerbside, roadside, urban centre and
urban background locations; 0.89 suburban and rural
sites Oldham 0.9 0.83 (a) 0.85 0.883 (a)results for 2009 are
included for completeness, but have not been bias
adjusted due to a change in diffusion tube supplier part way through the year and also there was low data
capture. It is best not to use these results to make any
assumptions regarding compliance with the
objectives or trends in pollution concentrations.
Rochdale 0.883
Salford 0.89 0.95 0.97 0.98 0.883 2010 Two analyst Bureau Veritas(BV) (Jan-July) and
Staffordshire Scientific Services (SSS), (Aug-Dec) used for
survey . Bias factors calc for each analyst, for colocated
Stockport 0.9 0.7 0.745 0.85 0.883
Tameside 0.776 0.806 0.768 0.782 0.883
Trafford 0.9 0.83 0.9/.81 0.85 0.883
Wigan 0.9 0.94 0.76 0.886 0.883
GM Average factor 0.881 0.845 0.835 0.884 0.883 Note *NO2 diffusion tubes used by the GM districts up to July 2009 were provided by Bureau Veritas, exposed monthly and are based on 10% TEA (triethanolamine) in water; from August onwards Staffordshire Scientific provided the service using a 20% TEA in water method.
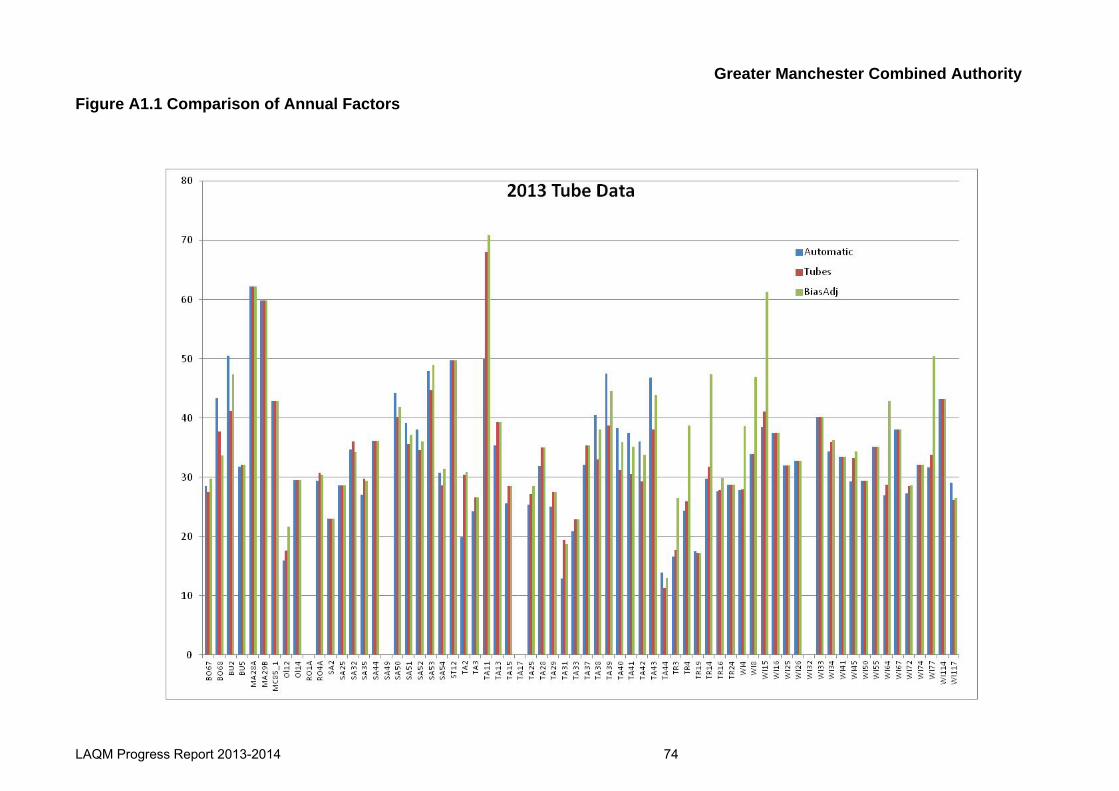
Greater Manchester Combined Authority
LAQM Progress Report 2013-2014 74
Figure A1.1 Comparison of Annual Factors
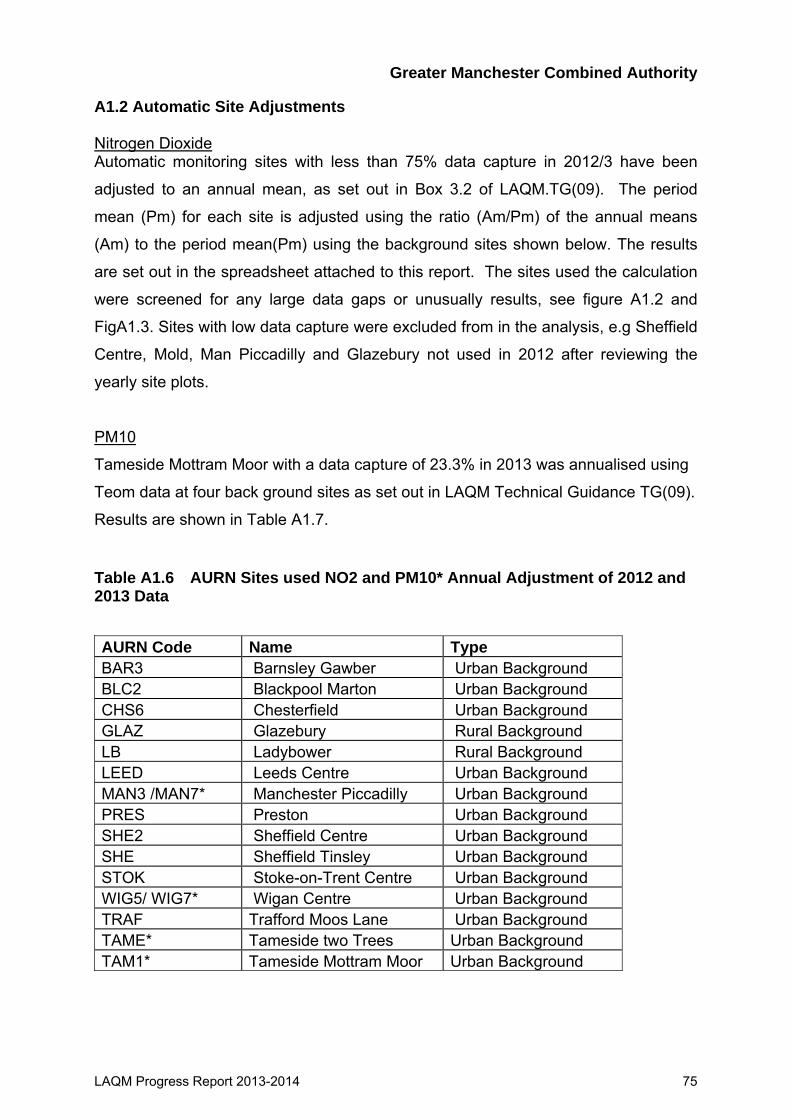
Greater Manchester Combined Authority
A1.2 Automatic Site Adjustments Nitrogen Dioxide Automatic monitoring sites with less than 75% data capture in 2012/3 have been
adjusted to an annual mean, as set out in Box 3.2 of LAQM.TG(09). The period
mean (Pm) for each site is adjusted using the ratio (Am/Pm) of the annual means
(Am) to the period mean(Pm) using the background sites shown below. The results
are set out in the spreadsheet attached to this report. The sites used the calculation
were screened for any large data gaps or unusually results, see figure A1.2 and
FigA1.3. Sites with low data capture were excluded from in the analysis, e.g Sheffield
Centre, Mold, Man Piccadilly and Glazebury not used in 2012 after reviewing the
yearly site plots.
PM10
Tameside Mottram Moor with a data capture of 23.3% in 2013 was annualised using
Teom data at four back ground sites as set out in LAQM Technical Guidance TG(09).
Results are shown in Table A1.7. Table A1.6 AURN Sites used NO2 and PM10* Annual Adjustment of 2012 and 2013 Data AURN Code Name Type BAR3 Barnsley Gawber Urban Background BLC2 Blackpool Marton Urban Background CHS6 Chesterfield Urban Background GLAZ Glazebury Rural Background LB Ladybower Rural Background LEED Leeds Centre Urban Background MAN3 /MAN7* Manchester Piccadilly Urban Background PRES Preston Urban Background SHE2 Sheffield Centre Urban Background SHE Sheffield Tinsley Urban Background STOK Stoke-on-Trent Centre Urban Background WIG5/ WIG7* Wigan Centre Urban Background TRAF Trafford Moos Lane Urban Background TAME* Tameside two Trees Urban Background TAM1* Tameside Mottram Moor Urban Background
LAQM Progress Report 2013-2014 75
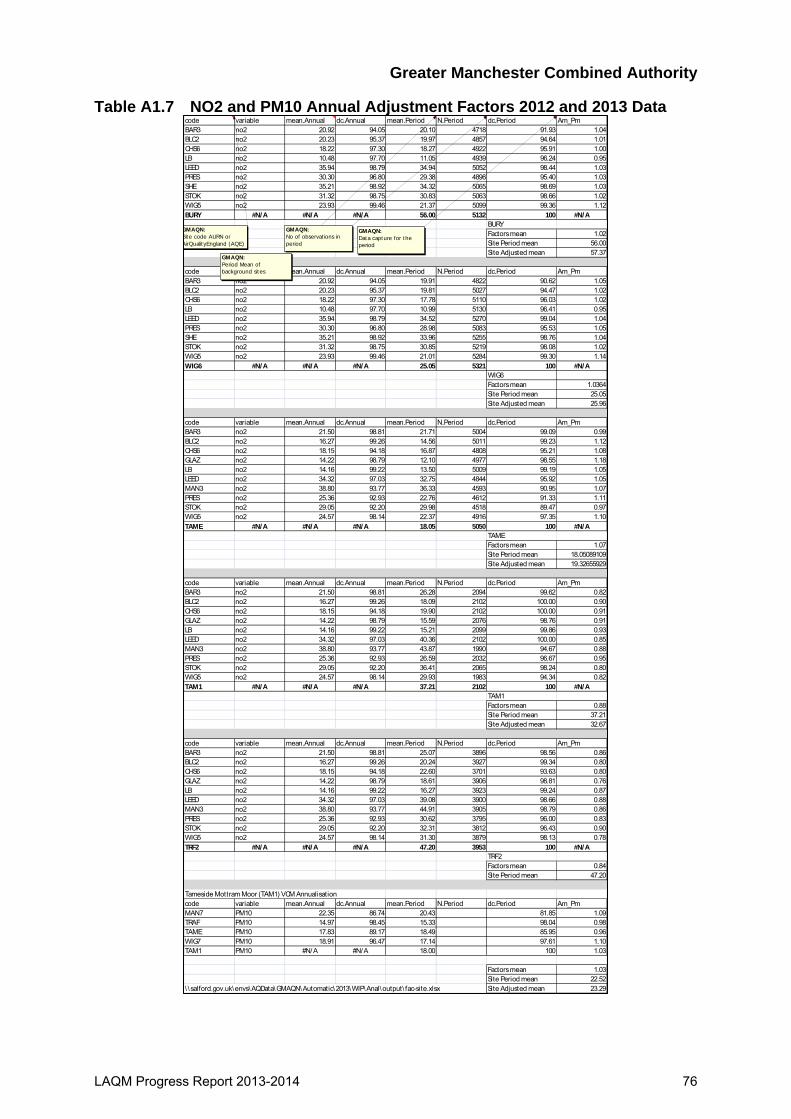
Greater Manchester Combined Authority
Table A1.7 NO2 and PM10 Annual Adjustment Factors 2012 and 2013 Data
code variable mean.Annual dc.Annual mean.Period N.Period dc.Period Am_PmBAR3 no2 20.92 94.05 20.10 4718 91.93 1.04BLC2 no2 20.23 95.37 19.97 4857 94.64 1.01CHS6 no2 18.22 97.30 18.27 4922 95.91 1.00LB no2 10.48 97.70 11.05 4939 96.24 0.95LEED no2 35.94 98.79 34.94 5052 98.44 1.03PRES no2 30.30 96.80 29.38 4896 95.40 1.03SHE no2 35.21 98.92 34.32 5065 98.69 1.03STOK no2 31.32 98.75 30.83 5063 98.66 1.02WIG5 no2 23.93 99.46 21.37 5099 99.36 1.12BURY #N/A #N/A #N/A 56.00 5132 100 #N/A
BURYFactors mean 1.02Site Period mean 56.00Site Adjusted mean 57.37
code variable mean.Annual dc.Annual mean.Period N.Period dc.Period Am_PmBAR3 no2 20.92 94.05 19.91 4822 90.62 1.05BLC2 no2 20.23 95.37 19.81 5027 94.47 1.02CHS6 no2 18.22 97.30 17.78 5110 96.03 1.02LB no2 10.48 97.70 10.99 5130 96.41 0.95LEED no2 35.94 98.79 34.52 5270 99.04 1.04PRES no2 30.30 96.80 28.98 5083 95.53 1.05SHE no2 35.21 98.92 33.96 5255 98.76 1.04STOK no2 31.32 98.75 30.85 5219 98.08 1.02WIG5 no2 23.93 99.46 21.01 5284 99.30 1.14WIG6 #N/A #N/A #N/A 25.05 5321 100 #N/A
WIG6Factors mean 1.0364Site Period mean 25.05Site Adjusted mean 25.96
code variable mean.Annual dc.Annual mean.Period N.Period dc.Period Am_PmBAR3 no2 21.50 98.81 21.71 5004 99.09 0.99BLC2 no2 16.27 99.26 14.56 5011 99.23 1.12CHS6 no2 18.15 94.18 16.87 4808 95.21 1.08GLAZ no2 14.22 98.79 12.10 4977 98.55 1.18LB no2 14.16 99.22 13.50 5009 99.19 1.05LEED no2 34.32 97.03 32.75 4844 95.92 1.05MAN3 no2 38.80 93.77 36.33 4593 90.95 1.07PRES no2 25.36 92.93 22.76 4612 91.33 1.11STOK no2 29.05 92.20 29.98 4518 89.47 0.97WIG5 no2 24.57 98.14 22.37 4916 97.35 1.10TAME #N/A #N/A #N/A 18.05 5050 100 #N/A
TAMEFactors mean 1.07Site Period mean 18.05089109Site Adjusted mean 19.32655929
code variable mean.Annual dc.Annual mean.Period N.Period dc.Period Am_PmBAR3 no2 21.50 98.81 26.28 2094 99.62 0.82BLC2 no2 16.27 99.26 18.09 2102 100.00 0.90CHS6 no2 18.15 94.18 19.90 2102 100.00 0.91GLAZ no2 14.22 98.79 15.59 2076 98.76 0.91LB no2 14.16 99.22 15.21 2099 99.86 0.93LEED no2 34.32 97.03 40.36 2102 100.00 0.85MAN3 no2 38.80 93.77 43.87 1990 94.67 0.88PRES no2 25.36 92.93 26.59 2032 96.67 0.95STOK no2 29.05 92.20 36.41 2065 98.24 0.80WIG5 no2 24.57 98.14 29.93 1983 94.34 0.82TAM1 #N/A #N/A #N/A 37.21 2102 100 #N/A
TAM1Factors mean 0.88Site Period mean 37.21Site Adjusted mean 32.67
code variable mean.Annual dc.Annual mean.Period N.Period dc.Period Am_PmBAR3 no2 21.50 98.81 25.07 3896 98.56 0.86BLC2 no2 16.27 99.26 20.24 3927 99.34 0.80CHS6 no2 18.15 94.18 22.60 3701 93.63 0.80GLAZ no2 14.22 98.79 18.61 3906 98.81 0.76LB no2 14.16 99.22 16.27 3923 99.24 0.87LEED no2 34.32 97.03 39.08 3900 98.66 0.88MAN3 no2 38.80 93.77 44.91 3905 98.79 0.86PRES no2 25.36 92.93 30.62 3795 96.00 0.83STOK no2 29.05 92.20 32.31 3812 96.43 0.90WIG5 no2 24.57 98.14 31.30 3879 98.13 0.78TRF2 #N/A #N/A #N/A 47.20 3953 100 #N/A
TRF2Factors mean 0.84Site Period mean 47.20
Tameside Mottram Moor (TAM1) VCM Annualisationcode variable mean.Annual dc.Annual mean.Period N.Period dc.Period Am_PmMAN7 PM10 22.35 86.74 20.43 81.85 1.09TRAF PM10 14.97 98.45 15.33 98.04 0.98TAME PM10 17.83 89.17 18.49 85.95 0.96WIG7 PM10 18.91 96.47 17.14 97.61 1.10TAM1 PM10 #N/A #N/A 18.00 100 1.03
Factors mean 1.03Site Period mean 22.52
\ \ salford.gov.uk\envs\AQData\GMAQN\Automatic\2013\WIP\Anal\output\ fac-site.xlsx Site Adjusted mean 23.29
GMAQN:Period Mean of background sites
GMAQN:No of observations in period
GMAQN:Data capture for the period
GMAQN:Site code AURN or AirQualityEngland (AQE)
LAQM Progress Report 2013-2014 76
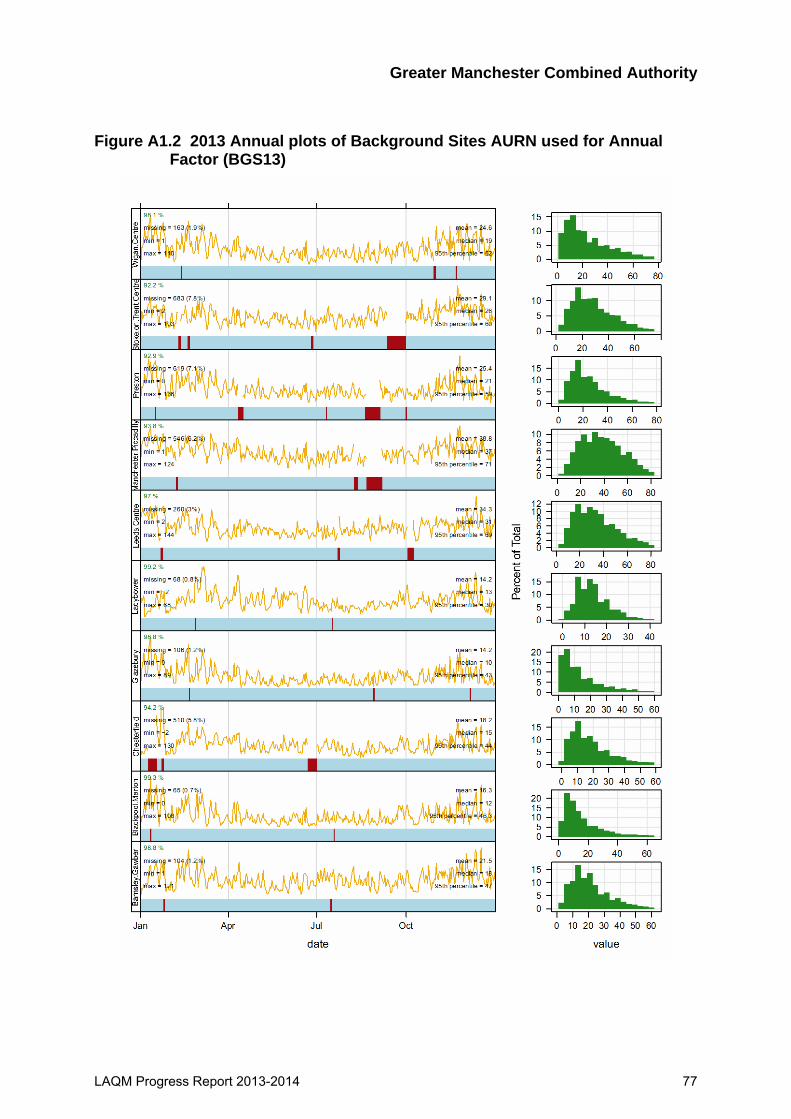
Greater Manchester Combined Authority
Figure A1.2 2013 Annual plots of Background Sites AURN used for Annual Factor (BGS13)
LAQM Progress Report 2013-2014 77

Greater Manchester Combined Authority
Figure A1.2b 2012 Annual plots of AURN Background Sites used for Annual Factor (BGS12)
LAQM Progress Report 2013-2014 78
Greater Manchester Combined Authority
A1.3 QA/QC of automatic monitoring Automatic air quality analysers in Greater Manchester area are subject to a high level
of quality assurance/ quality control. Most analysers are either operated as part of the
national Automatic Urban and Rural Network (AURN) or are part of the 'Calibration
Club' scheme run by Ricardo-AEA or similar schemes to provide accurate and robust
data.
The procedures are equivalent to the UK Automatic Urban and Rural Network
(AURN) the main features of the services being:-
Calibration Club
• Data screened daily for errors and final data ratified and published to same standard as AURN sites.
• Data checked twice daily for errors and faults reported to Local Site operators • Independent audits twice or once a year at Salford M60 • Final data set scaled and ratified to same standard as AURN.
Casella Data Management The Casella service is similar to the calibration club with the exception of the
independent audits. On site checks do include linearity test of analysers and gas
phase titration (GPT) to check converter efficiency on the NOx instruments. Data is
scaled to same standard as TG(09). TEOM data is corrected using the Volatile
Correction Method.
Greater Manchester Air Quality Network (GMAQN) Ricardo- AEA manages QA/QC and audit of the air quality stations to the same
standard as the AURN. The network officially started on 1 September 2013. Table
A1.7 list the Greater Manchester sites and their respective affiliation to the national
network or the GAMQN. A1.4 PM Monitoring & Adjustment Particulate Monitoring A number of different instruments are used in Greater Manchester for the
measurement of particles. Historically TEOM have been used, but DEFRA recently
LAQM Progress Report 2013-2014 79
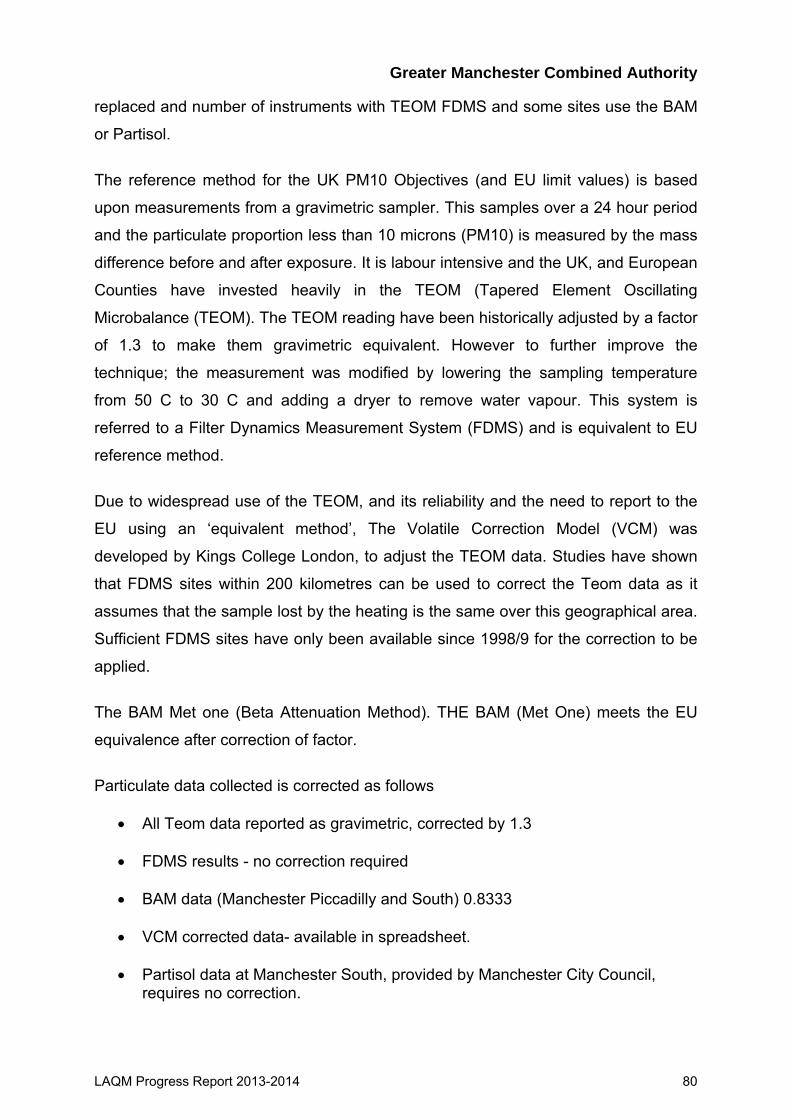
Greater Manchester Combined Authority
LAQM Progress Report 2013-2014 80
replaced and number of instruments with TEOM FDMS and some sites use the BAM
or Partisol.
The reference method for the UK PM10 Objectives (and EU limit values) is based
upon measurements from a gravimetric sampler. This samples over a 24 hour period
and the particulate proportion less than 10 microns (PM10) is measured by the mass
difference before and after exposure. It is labour intensive and the UK, and European
Counties have invested heavily in the TEOM (Tapered Element Oscillating
Microbalance (TEOM). The TEOM reading have been historically adjusted by a factor
of 1.3 to make them gravimetric equivalent. However to further improve the
technique; the measurement was modified by lowering the sampling temperature
from 50 C to 30 C and adding a dryer to remove water vapour. This system is
referred to a Filter Dynamics Measurement System (FDMS) and is equivalent to EU
reference method.
Due to widespread use of the TEOM, and its reliability and the need to report to the
EU using an ‘equivalent method’, The Volatile Correction Model (VCM) was
developed by Kings College London, to adjust the TEOM data. Studies have shown
that FDMS sites within 200 kilometres can be used to correct the Teom data as it
assumes that the sample lost by the heating is the same over this geographical area.
Sufficient FDMS sites have only been available since 1998/9 for the correction to be
applied.
The BAM Met one (Beta Attenuation Method). THE BAM (Met One) meets the EU
equivalence after correction of factor.
Particulate data collected is corrected as follows
• All Teom data reported as gravimetric, corrected by 1.3
• FDMS results - no correction required • BAM data (Manchester Piccadilly and South) 0.8333
• VCM corrected data- available in spreadsheet.
• Partisol data at Manchester South, provided by Manchester City Council,
requires no correction.
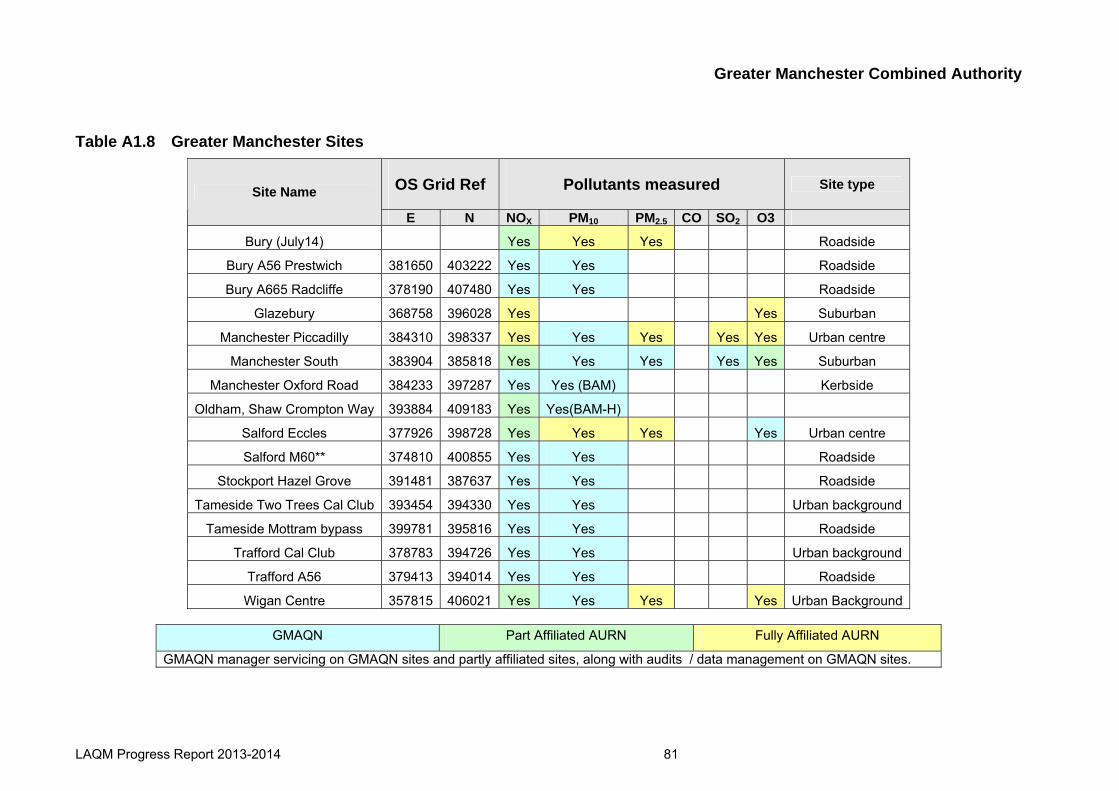
Greater Manchester Combined Authority
LAQM Progress Report 2013-2014 81
Table A1.8 Greater Manchester Sites
OS Grid Ref Pollutants measured Site type Site Name
E N NOX PM10 PM2.5 CO SO2 O3
Bury (July14) Yes Yes Yes Roadside
Bury A56 Prestwich 381650 403222 Yes Yes Roadside
Bury A665 Radcliffe 378190 407480 Yes Yes Roadside
Glazebury 368758 396028 Yes Yes Suburban
Manchester Piccadilly 384310 398337 Yes Yes Yes Yes Yes Urban centre
Manchester South 383904 385818 Yes Yes Yes Yes Yes Suburban
Manchester Oxford Road 384233 397287 Yes Yes (BAM) Kerbside
Oldham, Shaw Crompton Way 393884 409183 Yes Yes(BAM-H)
Salford Eccles 377926 398728 Yes Yes Yes Yes Urban centre
Salford M60** 374810 400855 Yes Yes Roadside
Stockport Hazel Grove 391481 387637 Yes Yes Roadside
Tameside Two Trees Cal Club 393454 394330 Yes Yes Urban background
Tameside Mottram bypass 399781 395816 Yes Yes Roadside
Trafford Cal Club 378783 394726 Yes Yes Urban background
Trafford A56 379413 394014 Yes Yes Roadside
Wigan Centre 357815 406021 Yes Yes Yes Yes Urban Background
GMAQN Part Affiliated AURN Fully Affiliated AURN
GMAQN manager servicing on GMAQN sites and partly affiliated sites, along with audits / data management on GMAQN sites.
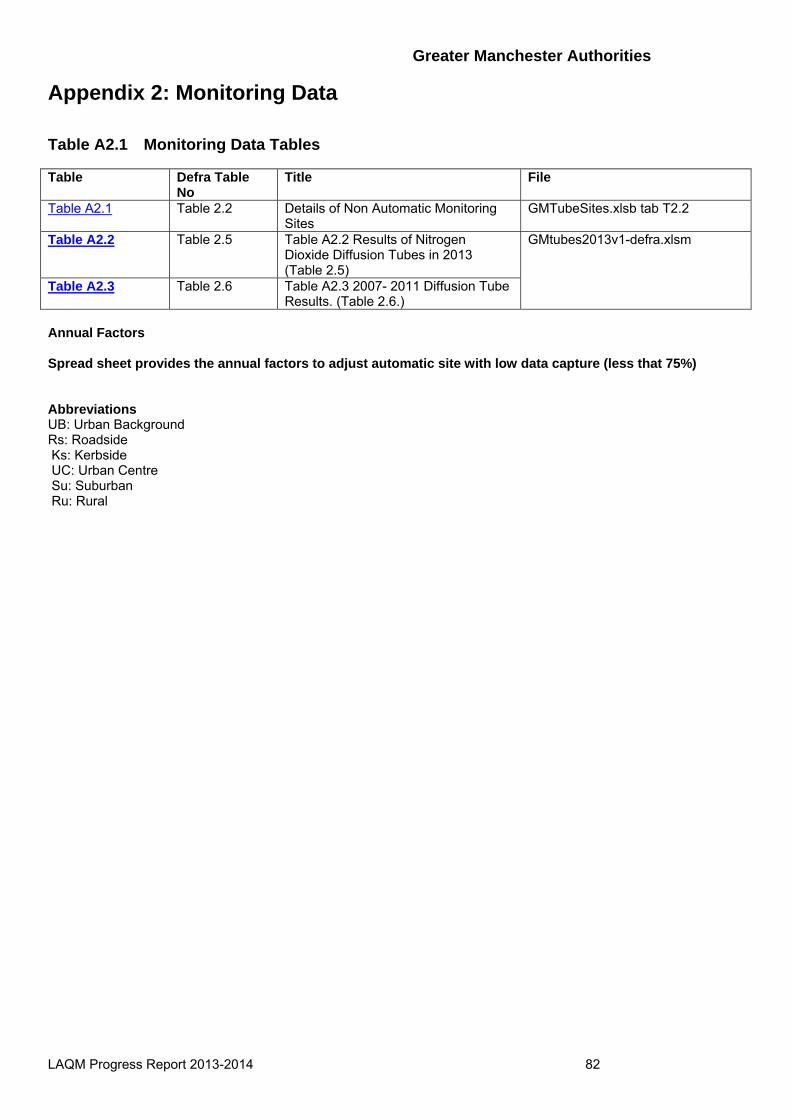
Greater Manchester Authorities
Appendix 2: Monitoring Data Table A2.1 Monitoring Data Tables Table Defra Table
No Title File
Table A2.1 Table 2.2 Details of Non Automatic Monitoring Sites
GMTubeSites.xlsb tab T2.2
Table A2.2 Table 2.5 Table A2.2 Results of Nitrogen Dioxide Diffusion Tubes in 2013 (Table 2.5)
Table A2.3 Table 2.6 Table A2.3 2007- 2011 Diffusion Tube Results. (Table 2.6.)
GMtubes2013v1-defra.xlsm
Annual Factors Spread sheet provides the annual factors to adjust automatic site with low data capture (less that 75%) Abbreviations UB: Urban Background Rs: Roadside Ks: Kerbside UC: Urban Centre Su: Suburban Ru: Rural
LAQM Progress Report 2013-2014 82
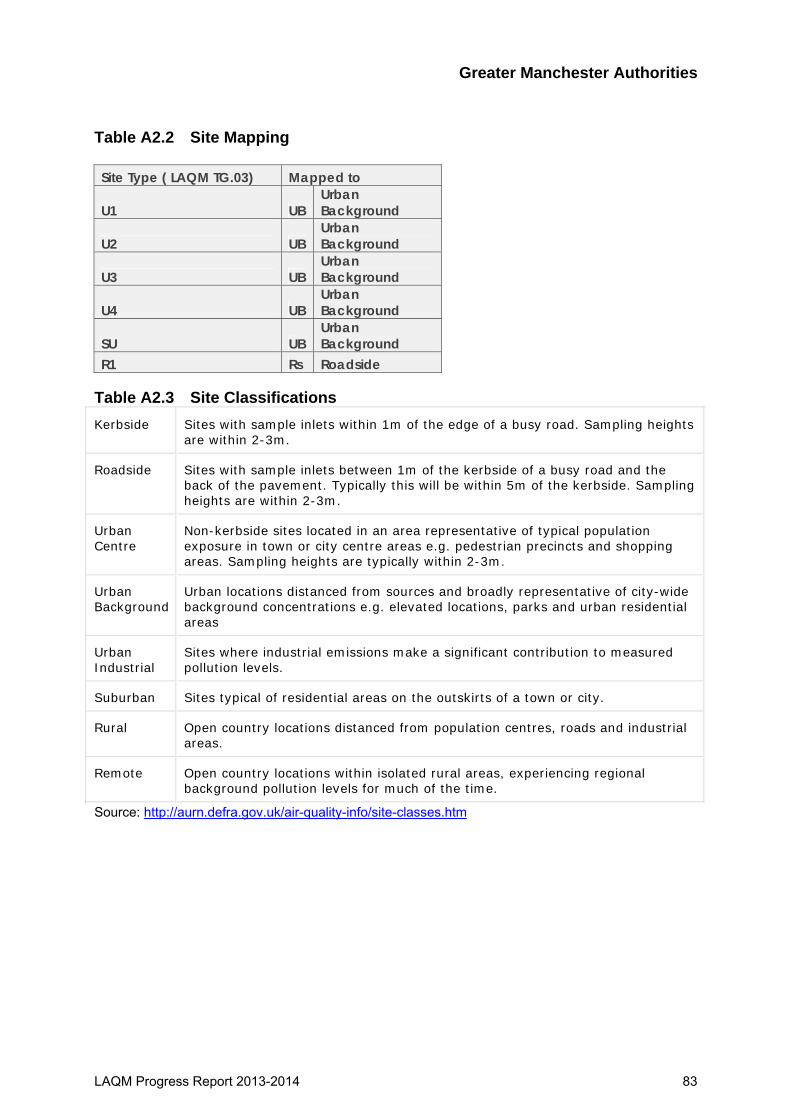
Greater Manchester Authorities Table A2.2 Site Mapping Site Type ( LAQM TG.03) Mapped to
U1 UB Urban Background
U2 UB Urban Background
U3 UB Urban Background
U4 UB Urban Background
SU UB Urban Background
R1 Rs Roadside Table A2.3 Site Classifications Kerbside Sites with sample inlets within 1m of the edge of a busy road. Sampling heights
are within 2-3m.
Roadside Sites with sample inlets between 1m of the kerbside of a busy road and the back of the pavement. Typically this will be within 5m of the kerbside. Sampling heights are within 2-3m.
Urban Centre
Non-kerbside sites located in an area representative of typical population exposure in town or city centre areas e.g. pedestrian precincts and shopping areas. Sampling heights are typically within 2-3m.
Urban Background
Urban locations distanced from sources and broadly representative of city-wide background concentrations e.g. elevated locations, parks and urban residential areas
Urban Industrial
Sites where industrial emissions make a significant contribution to measured pollution levels.
Suburban Sites typical of residential areas on the outskirts of a town or city.
Rural Open country locations distanced from population centres, roads and industrial areas.
Remote Open country locations within isolated rural areas, experiencing regional background pollution levels for much of the time.
Source: http://aurn.defra.gov.uk/air-quality-info/site-classes.htm
LAQM Progress Report 2013-2014 83
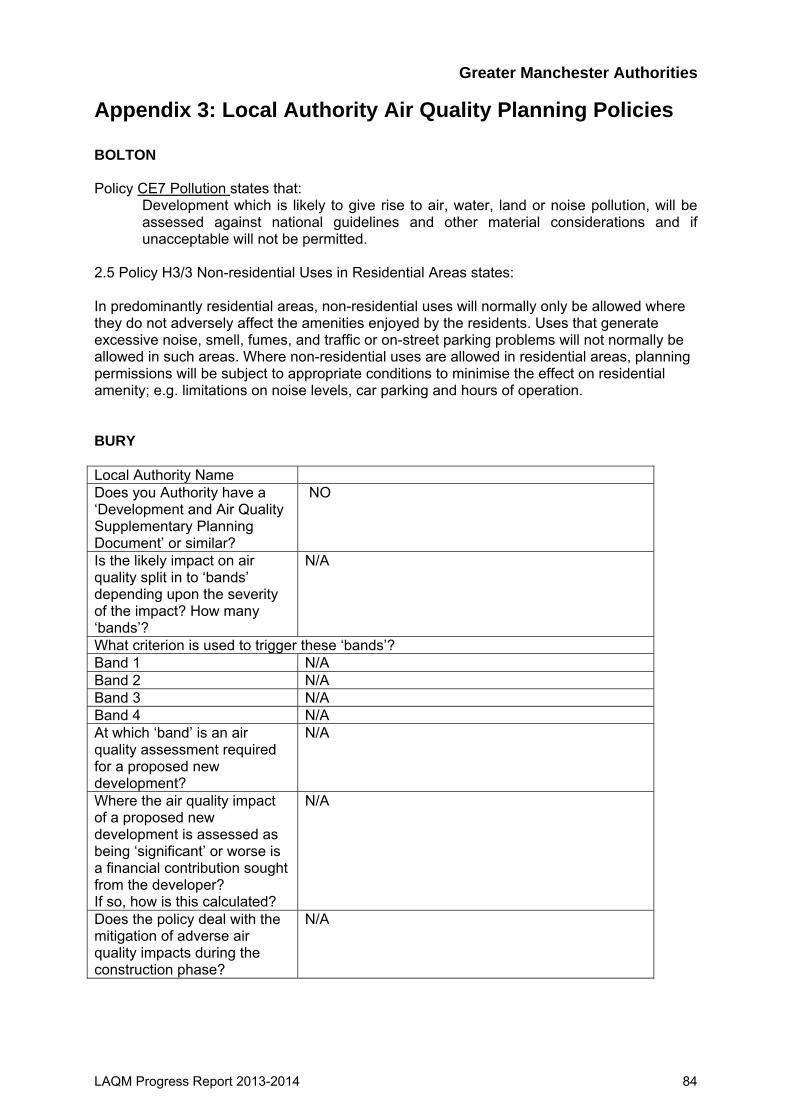
Greater Manchester Authorities
Appendix 3: Local Authority Air Quality Planning Policies BOLTON Policy CE7 Pollution states that:
Development which is likely to give rise to air, water, land or noise pollution, will be assessed against national guidelines and other material considerations and if unacceptable will not be permitted.
2.5 Policy H3/3 Non-residential Uses in Residential Areas states: In predominantly residential areas, non-residential uses will normally only be allowed where they do not adversely affect the amenities enjoyed by the residents. Uses that generate excessive noise, smell, fumes, and traffic or on-street parking problems will not normally be allowed in such areas. Where non-residential uses are allowed in residential areas, planning permissions will be subject to appropriate conditions to minimise the effect on residential amenity; e.g. limitations on noise levels, car parking and hours of operation. BURY Local Authority Name Does you Authority have a ‘Development and Air Quality Supplementary Planning Document’ or similar?
NO
Is the likely impact on air quality split in to ‘bands’ depending upon the severity of the impact? How many ‘bands’?
N/A
What criterion is used to trigger these ‘bands’? Band 1 N/A Band 2 N/A Band 3 N/A Band 4 N/A At which ‘band’ is an air quality assessment required for a proposed new development?
N/A
Where the air quality impact of a proposed new development is assessed as being ‘significant’ or worse is a financial contribution sought from the developer? If so, how is this calculated?
N/A
Does the policy deal with the mitigation of adverse air quality impacts during the construction phase?
N/A
LAQM Progress Report 2013-2014 84
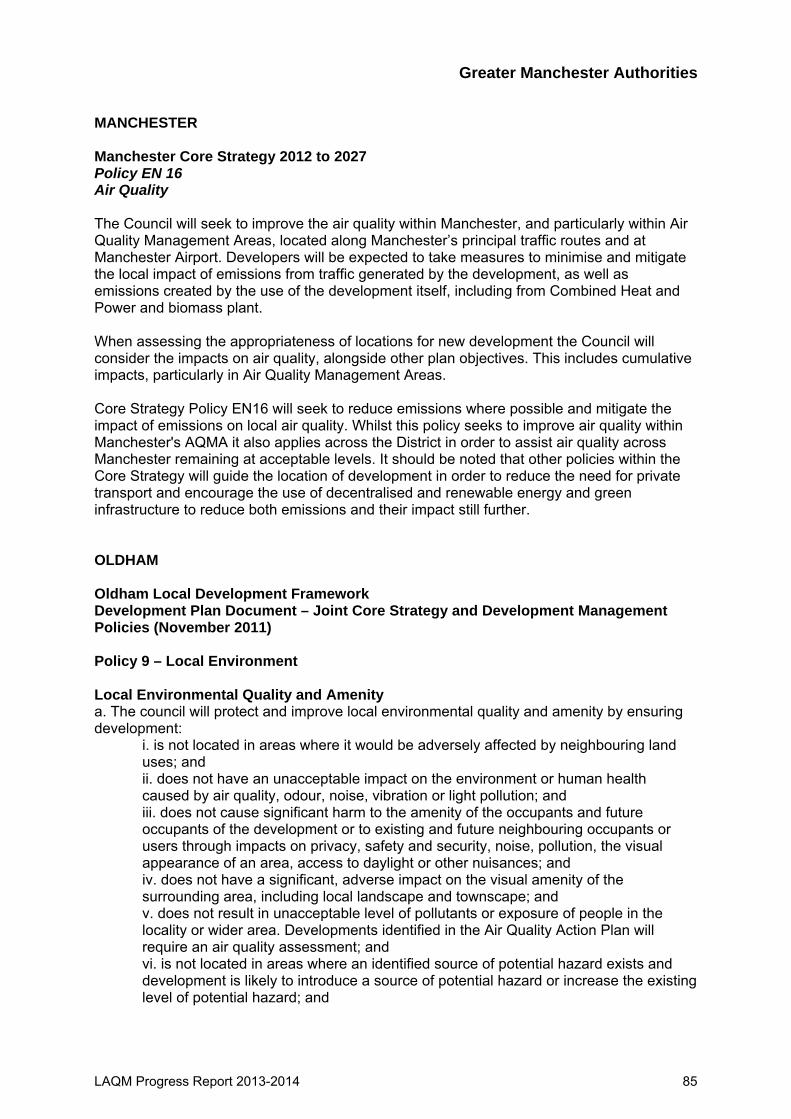
Greater Manchester Authorities MANCHESTER Manchester Core Strategy 2012 to 2027 Policy EN 16 Air Quality The Council will seek to improve the air quality within Manchester, and particularly within Air Quality Management Areas, located along Manchester’s principal traffic routes and at Manchester Airport. Developers will be expected to take measures to minimise and mitigate the local impact of emissions from traffic generated by the development, as well as emissions created by the use of the development itself, including from Combined Heat and Power and biomass plant. When assessing the appropriateness of locations for new development the Council will consider the impacts on air quality, alongside other plan objectives. This includes cumulative impacts, particularly in Air Quality Management Areas. Core Strategy Policy EN16 will seek to reduce emissions where possible and mitigate the impact of emissions on local air quality. Whilst this policy seeks to improve air quality within Manchester's AQMA it also applies across the District in order to assist air quality across Manchester remaining at acceptable levels. It should be noted that other policies within the Core Strategy will guide the location of development in order to reduce the need for private transport and encourage the use of decentralised and renewable energy and green infrastructure to reduce both emissions and their impact still further. OLDHAM Oldham Local Development Framework Development Plan Document – Joint Core Strategy and Development Management Policies (November 2011) Policy 9 – Local Environment Local Environmental Quality and Amenity a. The council will protect and improve local environmental quality and amenity by ensuring development:
i. is not located in areas where it would be adversely affected by neighbouring land uses; and ii. does not have an unacceptable impact on the environment or human health caused by air quality, odour, noise, vibration or light pollution; and iii. does not cause significant harm to the amenity of the occupants and future occupants of the development or to existing and future neighbouring occupants or users through impacts on privacy, safety and security, noise, pollution, the visual appearance of an area, access to daylight or other nuisances; and iv. does not have a significant, adverse impact on the visual amenity of the surrounding area, including local landscape and townscape; and v. does not result in unacceptable level of pollutants or exposure of people in the locality or wider area. Developments identified in the Air Quality Action Plan will require an air quality assessment; and vi. is not located in areas where an identified source of potential hazard exists and development is likely to introduce a source of potential hazard or increase the existing level of potential hazard; and
LAQM Progress Report 2013-2014 85
Greater Manchester Authorities
vii. minimises traffic levels and does not harm the safety of road users. Proposals to work from home must also ensure provision is made for access, servicing and parking
Supporting text in relation to air quality 6.4 An air quality assessment will be expected where a potential `significant` impact on
local air quality is anticipated, or where air quality remains generally unchanged but there is an increased risk of exposure. The following types of development would normally require an air quality assessment: a. proposals that will result in increased congestion, a change in either traffic volumes (for example, 5% annual average daily traffic or peak) or a change in vehicle speed (±10 kilometres per hour), or both, on a road with greater than 10,000 vehicles per day. b. proposals that will significantly increase the flow on roads lying within an Air Quality Management Area (AQMA). c. proposals that would significantly alter the traffic composition in an area (e.g. bus stations, HGV parks, increased delivery traffic.) d. proposals that include new car parking spaces (more than 80 spaces) or coach/lorry parks. e. developments located in, or which may affect, sensitive areas (e.g. ecological sites), areas of poor air quality (including AQMAs) or which may generate pollution at levels that could harm health where either direct emissions to air occur, or where any of the preceding criteria are met. f. residential, school, public buildings or similar developments lying within an area of poorer air quality such as an AQMA.
6.5 The following thresholds (developments of size equal or greater than criteria listed below) will also be used to determine where an air quality assessment is required:
Air quality thresholds Development Site Area Gross Floorspace Food retail 0.2 hectares 1,000 square metres Non-food retail 0.8 hectares 1,000 square metres B1(Business) 2.0 hectares 2,500 square metres B2 (General Industry) and B8 (Storage or Distribution)
1.0 hectares 6,000 square metres
Other 60 or more vehicle movements in any hour 6.6 The significance of the development in terms of its air quality impact will depend
upon: a. the extent of the predicted increase in pollution from the development; b. whether the development is already in an Air Quality Management Area; c. whether the development may cause exceedances of air quality objectives or standards where these did not already occur; d. whether the development affects the implementation of measures under the Air Quality Action Plan or Local Transport Plan; e. exposure of people in the locality or wider area; and f. whether the development could potentially affect a European designated nature conservation site.
6.7 It is not possible to place exact thresholds on what increases in pollution will make a proposed development unacceptable. Each proposal will be considered on the merits of its individual circumstances.
LAQM Progress Report 2013-2014 86
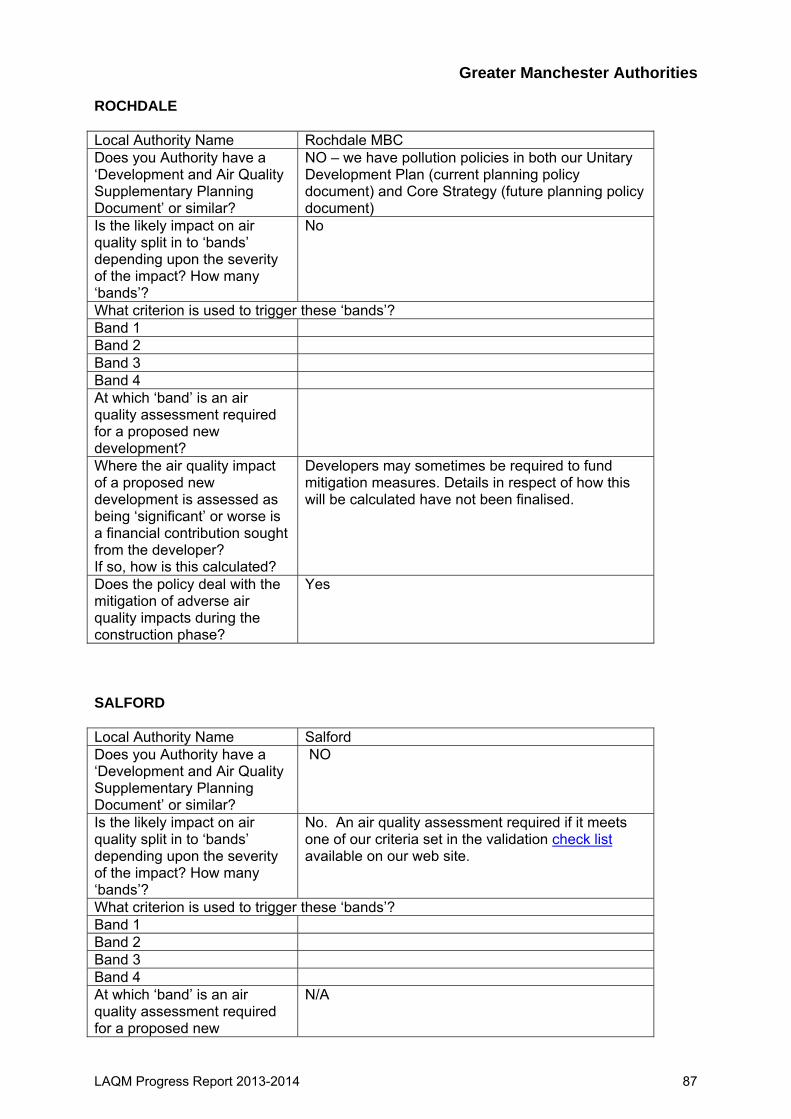
Greater Manchester Authorities ROCHDALE Local Authority Name Rochdale MBC Does you Authority have a ‘Development and Air Quality Supplementary Planning Document’ or similar?
NO – we have pollution policies in both our Unitary Development Plan (current planning policy document) and Core Strategy (future planning policy document)
Is the likely impact on air quality split in to ‘bands’ depending upon the severity of the impact? How many ‘bands’?
No
What criterion is used to trigger these ‘bands’? Band 1 Band 2 Band 3 Band 4 At which ‘band’ is an air quality assessment required for a proposed new development?
Where the air quality impact of a proposed new development is assessed as being ‘significant’ or worse is a financial contribution sought from the developer? If so, how is this calculated?
Developers may sometimes be required to fund mitigation measures. Details in respect of how this will be calculated have not been finalised.
Does the policy deal with the mitigation of adverse air quality impacts during the construction phase?
Yes
SALFORD Local Authority Name Salford Does you Authority have a ‘Development and Air Quality Supplementary Planning Document’ or similar?
NO
Is the likely impact on air quality split in to ‘bands’ depending upon the severity of the impact? How many ‘bands’?
No. An air quality assessment required if it meets one of our criteria set in the validation check list available on our web site.
What criterion is used to trigger these ‘bands’? Band 1 Band 2 Band 3 Band 4 At which ‘band’ is an air quality assessment required for a proposed new
N/A
LAQM Progress Report 2013-2014 87
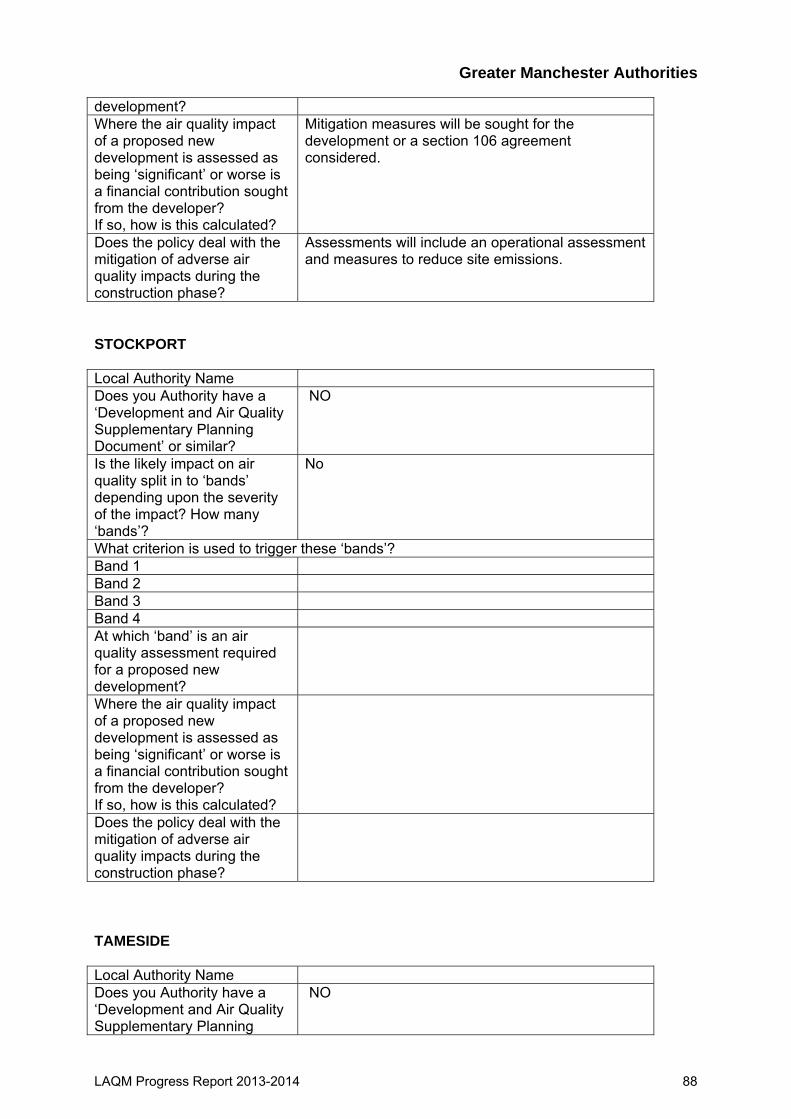
Greater Manchester Authorities development? Where the air quality impact of a proposed new development is assessed as being ‘significant’ or worse is a financial contribution sought from the developer? If so, how is this calculated?
Mitigation measures will be sought for the development or a section 106 agreement considered.
Does the policy deal with the mitigation of adverse air quality impacts during the construction phase?
Assessments will include an operational assessment and measures to reduce site emissions.
STOCKPORT Local Authority Name Does you Authority have a ‘Development and Air Quality Supplementary Planning Document’ or similar?
NO
Is the likely impact on air quality split in to ‘bands’ depending upon the severity of the impact? How many ‘bands’?
No
What criterion is used to trigger these ‘bands’? Band 1 Band 2 Band 3 Band 4 At which ‘band’ is an air quality assessment required for a proposed new development?
Where the air quality impact of a proposed new development is assessed as being ‘significant’ or worse is a financial contribution sought from the developer? If so, how is this calculated?
Does the policy deal with the mitigation of adverse air quality impacts during the construction phase?
TAMESIDE Local Authority Name Does you Authority have a ‘Development and Air Quality Supplementary Planning
NO
LAQM Progress Report 2013-2014 88

Greater Manchester Authorities Document’ or similar? Is the likely impact on air quality split in to ‘bands’ depending upon the severity of the impact? How many ‘bands’?
No
What criterion is used to trigger these ‘bands’? Band 1 Band 2 Band 3 Band 4 At which ‘band’ is an air quality assessment required for a proposed new development?
Where the air quality impact of a proposed new development is assessed as being ‘significant’ or worse is a financial contribution sought from the developer? If so, how is this calculated?
Does the policy deal with the mitigation of adverse air quality impacts during the construction phase?
TRAFFORD The Trafford Core Strategy, as part of the Local Development Framework, contains the relevant planning policy to protect and improve air quality in the borough. WIGAN Local Authority Name Wigan Council Does you Authority have a ‘Development and Air Quality Supplementary Planning Document’ or similar?
YES
Is the likely impact on air quality split in to ‘bands’ depending upon the severity of the impact? How many ‘bands’?
Yes Four
What criterion is used to trigger these ‘bands’? Band 1 developments with a very small potential impact Band 2 medium scale developments that, together with
other developments, would have a contributory impact.
Band 3 development that individually is likely to have a significant impact and, for which, an air quality assessment and mitigating and compensating measures will be required
Band 4 developments with a substantial potential impact for
LAQM Progress Report 2013-2014 89

Greater Manchester Authorities
which adequate mitigation or compensating measures cannot be achieved.
At which ‘band’ is an air quality assessment required for a proposed new development?
Band 3 & 4
Where the air quality impact of a proposed new development is assessed as being ‘significant’ or worse is a financial contribution sought from the developer? If so, how is this calculated?
Yes In accordance with DMRB guidance
Does the policy deal with the mitigation of adverse air quality impacts during the construction phase?
Yes via a planning condition requiring a ‘construction environmental management plan’
LAQM Progress Report 2013-2014 90