an efficient method for estimating seismic hazards using
TRANSCRIPT
An Efficient Method for Estimating Seismic HazardsUsing Big Data Analysis
Denis M. Filatov1, 2 & Alexey A. Lyubushin2
1 Sceptica Scientific Ltd (Stockport, UK)2 Institute of Physics of the Earth (Moscow, Russia)
2
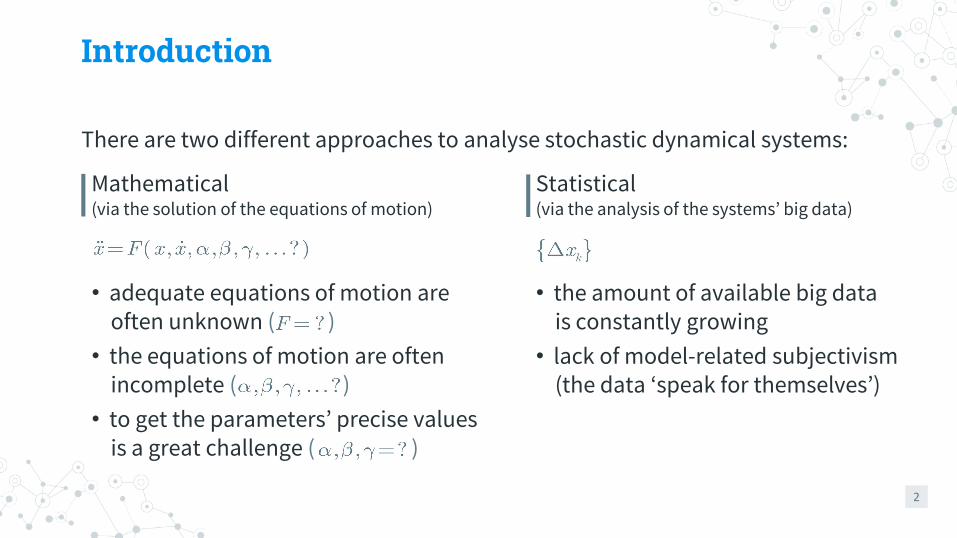
Introduction
There are two different approaches to analyse stochastic dynamical systems:
Mathematical(via the solution of the equations of motion)
Statistical(via the analysis of the systems’ big data)
• adequate equations of motion are often unknown ( )
• the equations of motion are often incomplete ( )
• to get the parameters’ precise valuesis a great challenge ( )
• the amount of available big data is constantly growing
• lack of model-related subjectivism(the data ‘speak for themselves’)
| |
3
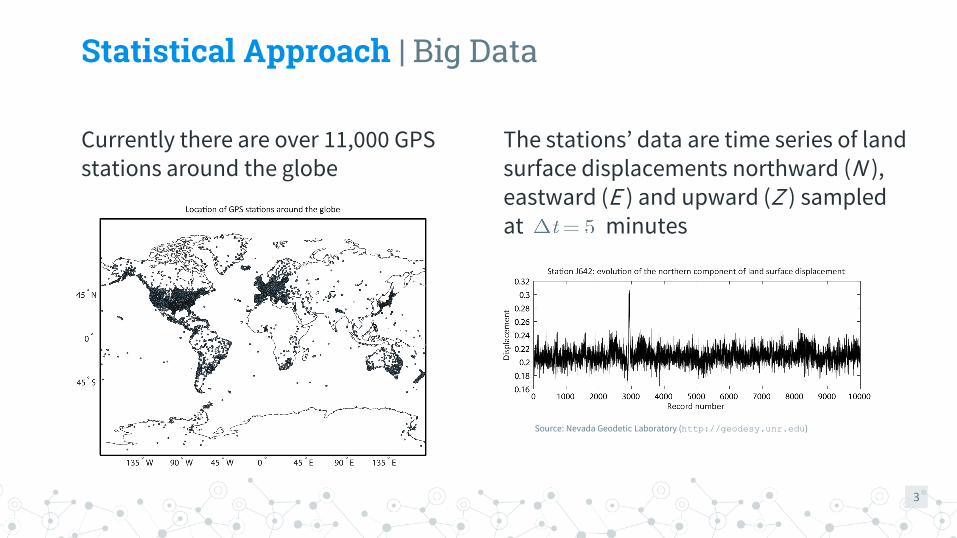
Statistical Approach | Big Data
Currently there are over 11,000 GPS stations around the globe
The stations’ data are time series of land surface displacements northward (N ), eastward (E ) and upward (Z ) sampled at minutes
Source: Nevada Geodetic Laboratory (http://geodesy.unr.edu)

4
Statistical Approach | Main Idea
A system’s transition from a quiet into a critical state results in a growth of energies at the low frequencies
As a result, the system’s chaoticity decays1-2
Hence, in order to differentiate the system’s critical and quiet states, an adequate measure of chaoticity has to be developed1 H. Haken, Information and Self-Organization, Springer, Berlin, 20002 Yu.L. Klimontovich, Turbulent Motion and the Structure of Chaos, Nauka, Moscow, 1990
5
Statistical Approach | Measures of Chaoticity
The lack of a single mechanism exhibited in all extreme seismic events suggests that a number of diverse quantitative measures has to be developed
Our methods include1-6:• fractal critical exponents• width of the multifractal singularity spectrum• multivariate canonical correlations and coherences• principal components of Fourier-aggregate time series• among others
1 A.A. Lyubushin, Izv. Phys. Solid Earth, 45 (2009) 381-3942 A.A. Lyubushin, Nat. Sci., 4 (2012) 659-6663 A.A. Lyubushin and P.V. Yakovlev, SpringerPlus, 3 (2014) 364-3704 D.M. Filatov and A.A. Lyubushin, Phys. A, 469 (2017) 718-7305 D.M. Filatov and A.A. Lyubushin, Phys. A, 527 (2019) 1213096 D.M. Filatov and A.A. Lyubushin, Pure Appl. Geophys., 177 (2020) 509-530
6
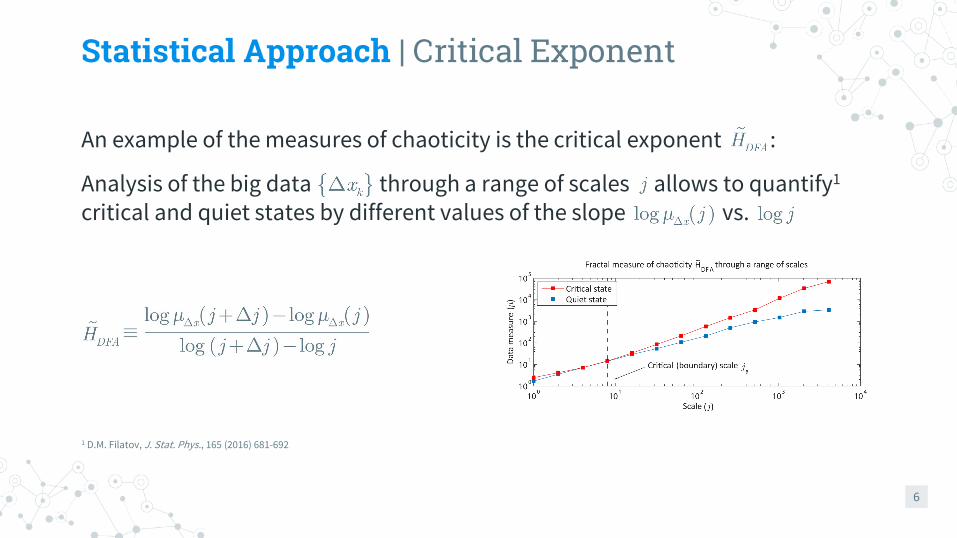
Statistical Approach | Critical Exponent
An example of the measures of chaoticity is the critical exponent :
Analysis of the big data through a range of scales allows to quantify1
critical and quiet states by different values of the slope vs.
1 D.M. Filatov, J. Stat. Phys., 165 (2016) 681-692
7
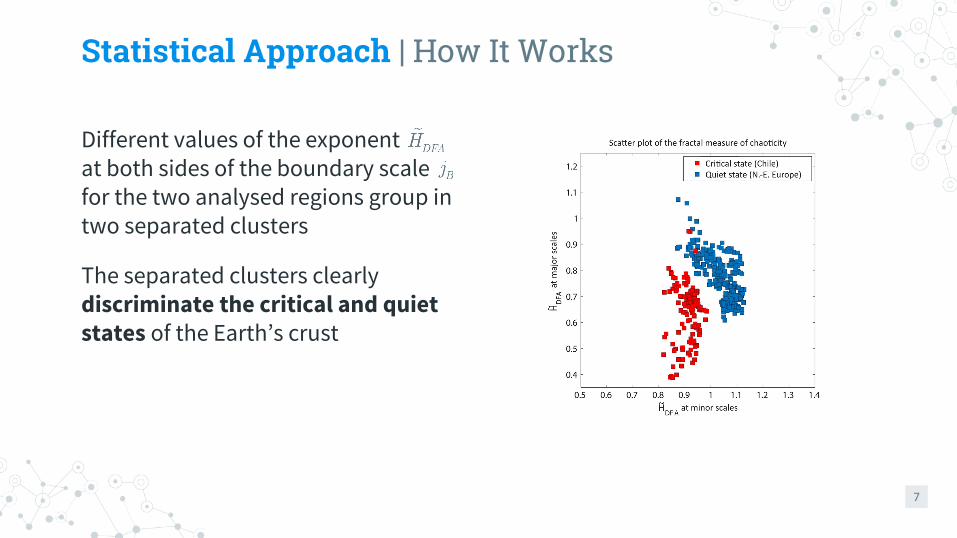
Statistical Approach | How It Works
Different values of the exponent at both sides of the boundary scale for the two analysed regions group in two separated clusters
The separated clusters clearly discriminate the critical and quiet states of the Earth’s crust
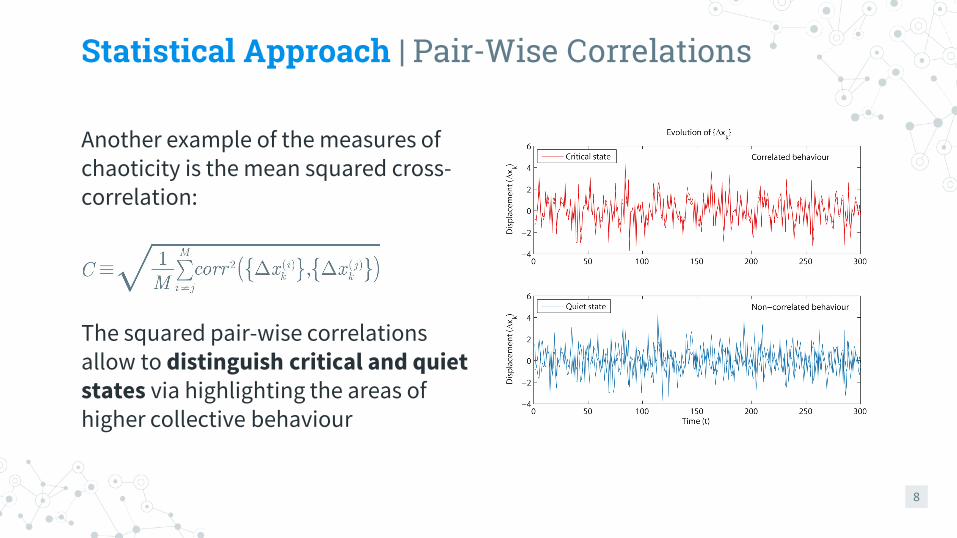
Another example of the measures of chaoticity is the mean squared cross-correlation:
The squared pair-wise correlations allow to distinguish critical and quiet states via highlighting the areas of higher collective behaviour
8
Statistical Approach | Pair-Wise Correlations
9
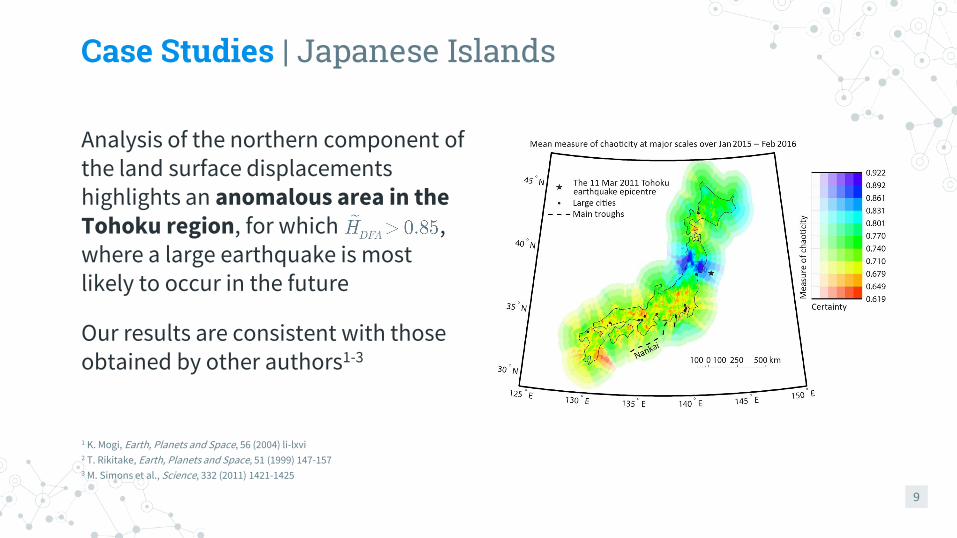
Case Studies | Japanese Islands
Analysis of the northern component of the land surface displacements highlights an anomalous area in the Tohoku region, for which , where a large earthquake is most likely to occur in the future
Our results are consistent with those obtained by other authors1-3
1 K. Mogi, Earth, Planets and Space, 56 (2004) li-lxvi2 T. Rikitake, Earth, Planets and Space, 51 (1999) 147-1573 M. Simons et al., Science, 332 (2011) 1421-1425
10
Case Studies | Japanese Islands
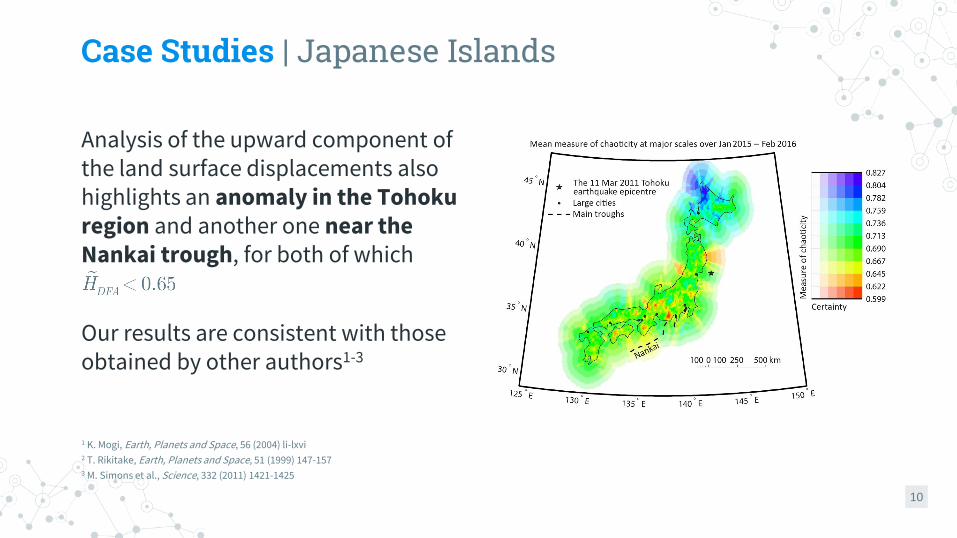
Analysis of the upward component of the land surface displacements also highlights an anomaly in the Tohoku region and another one near the Nankai trough, for both of which
Our results are consistent with those obtained by other authors1-3
1 K. Mogi, Earth, Planets and Space, 56 (2004) li-lxvi2 T. Rikitake, Earth, Planets and Space, 51 (1999) 147-1573 M. Simons et al., Science, 332 (2011) 1421-1425
11
Case Studies | Japanese Islands
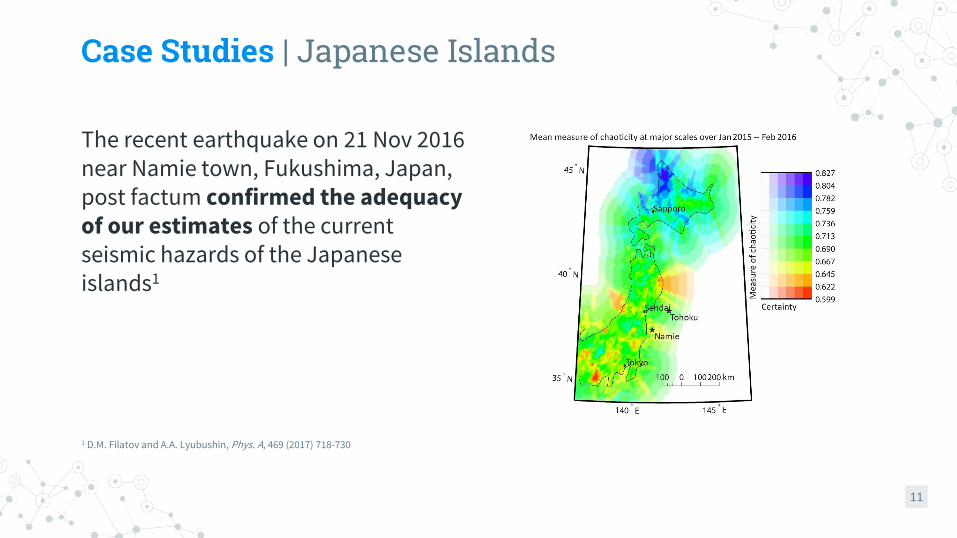
The recent earthquake on 21 Nov 2016near Namie town, Fukushima, Japan, post factum confirmed the adequacy of our estimates of the current seismic hazards of the Japanese islands1
1 D.M. Filatov and A.A. Lyubushin, Phys. A, 469 (2017) 718-730
12
Case Studies | West Coast of the USA
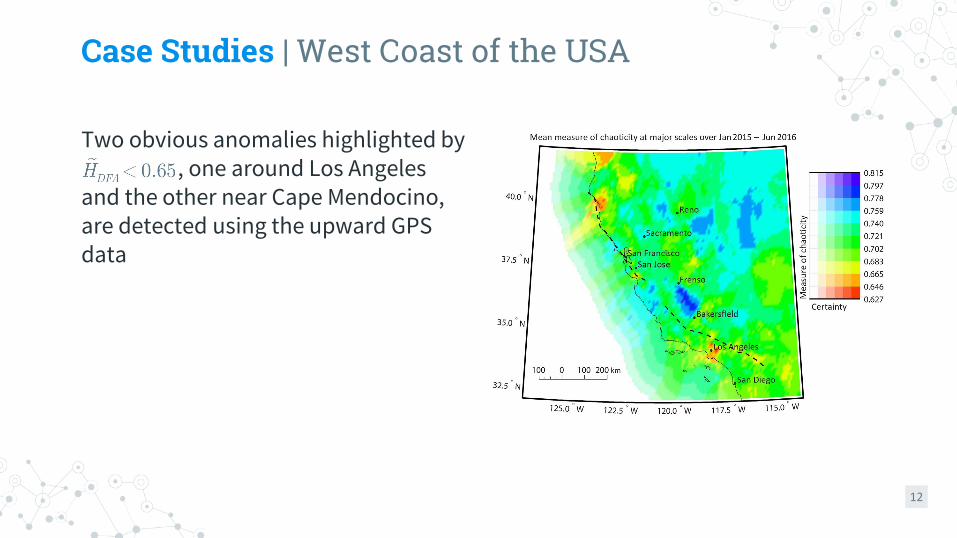
Two obvious anomalies highlighted by, one around Los Angeles
and the other near Cape Mendocino, are detected using the upward GPS data
13
Case Studies | West Coast of the USA
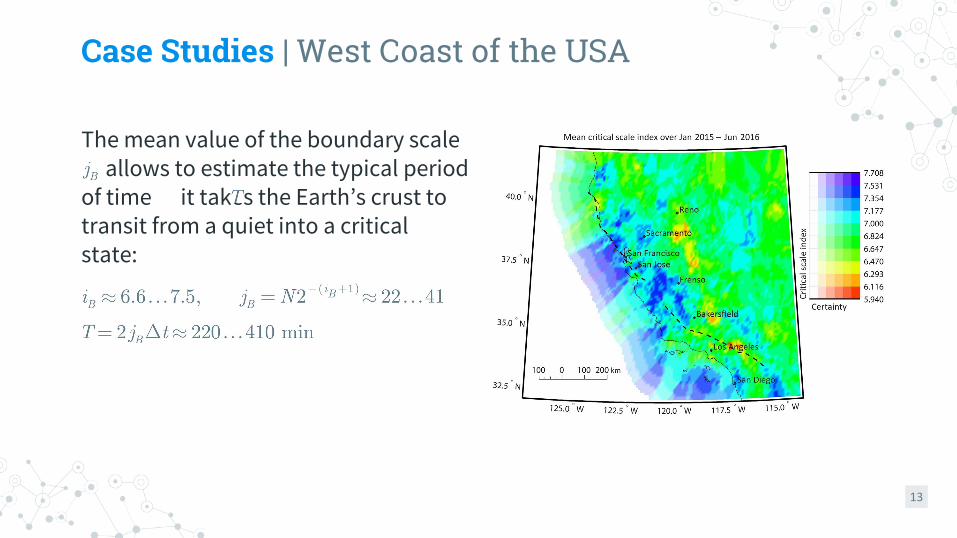
The mean value of the boundary scale allows to estimate the typical period
of time it takes the Earth’s crust to transit from a quiet into a critical state:
14
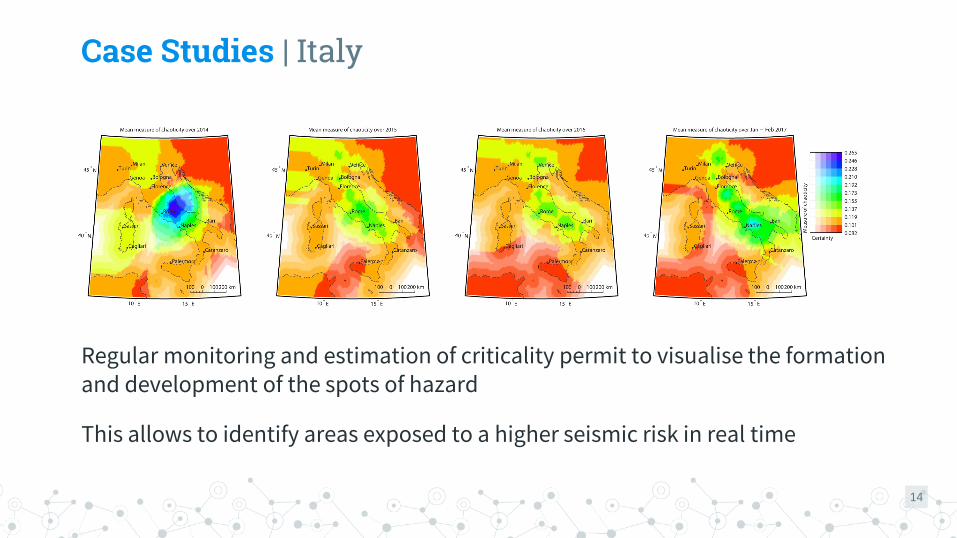
Case Studies | Italy
Regular monitoring and estimation of criticality permit to visualise the formation and development of the spots of hazard
This allows to identify areas exposed to a higher seismic risk in real time

15
Conclusion
• The statistical approach allows to objectively recognise precatastrophic and quiet states of the Earth’s crust
• The use of various measures of chaoticity allows to quantify a large variety of precursors of the coming extreme seismic events
• The approach has shown to be an efficient tool for early warning of natural earthquakes, and it could be useful for fast detection of other disasters as well as man-made earthquakes (e.g., due to shale oil extraction)
• Regular quantification permits to identify the formation and development of areas exposed to higher risks in real time

Thanks!
You are always welcome to contact us by e-mail:Denis M. Filatov
Alexey A. Lyubushin| [email protected]| [email protected]
For further information please visit our website:
www.sceptica.co.uk/?catastrophes