an item response theory analysis of the … · such as calm, relaxed, and stable. as seen from its...
TRANSCRIPT

AN ITEM RESPONSE THEORY ANALYSIS OF THE SCALES FROM THE
INTERNATIONAL PERSONALITY ITEM POOL AND THE NEO
PERSONALITY INVENTORY-REVISED
by
Nadine LeBarron McBride
Virginia Tech
Thesis submitted to the Faculty of
Virginia Polytechnic Institute and State University
in partial fulfillment for the degree of
MASTERS IN SCIENCE
in
Psychology
Robert J. Harvey, Chair
John J. Donovan
Morell E. Mullins, Jr.
May 9, 2001
Blacksburg, VA
Keywords: Personality, Item Response Theory, IRT

IRT Analysis ii
An Item Response Theory Analysis of the Scales from the
International Personality Item Pool and the NEO Personality Inventory-Revised
Nadine LeBarron McBride
(ABSTRACT)
Personality tests are widely used in the field of Industrial/Organizational
Psychology; however, few studies have focused on their psychometric properties using
Item Response Theory. This paper uses IRT to examine the test information functions
(TIFs) of two personality measures: the NEO-PI-R and scales from the International
Personality Item Pool. Results showed that most scales for both measures provided
relatively consistent levels of information and measurement precision across levels of
theta (θ). Although the NEO-PI-R provided overall higher levels of information and
measurement precision, the IPIP scales provided greater efficiency in that they provided
more precision per item. Both scales showed substantial decrease in precision and
information when response scales were dichotomized away from the original 5 point
likert scale format. Implications and further avenues for research are discussed.

IRT Analysis iii
ACKNOWLEDGEMENTS
First and foremost, I owe a huge thank you to my advisor, Dr. R.J. Harvey, for his
help, support, and guidance during the course of this project. In addition, I would like to
acknowledge the rest of my committee, Dr. John J. Donovan and Dr. Morell E. Mullins,
for their indispensable feedback and ideas. I would also like to thank my wonderful
friends and family for being there for me and encouraging me every step of the way.
And, of course, I must acknowledge the support of my wonderful husband, Andy. I am
forever grateful for the encouragement and support he provides to me.

IRT Analysis iv
TABLE OF CONTENTS
ABSTRACT……………………………………………………………………….. i
ACKNOWLEDGMENTS.………………………………………………………….iii
TABLE OF CONTENTS. ……………………………………………………….... iv
LIST OF TABLES………………………………………………………………….v
LIST OF FIGURES………………………………………………………………... vi
INTRODUCTION…………………………………………………………………. 1
Personality Background ……………………………………………………1
How Personality and the Big Five is Important to I/O Psychology ………. 3Criticisms of the use of the Big Five and Five Factor Model ……………...5
Measurement of the Big Five and the Development of a New Measure. ….6Principals of IRT……………………………………………………………7
Table 1.1: Example of an Item Characteristic Curve……...……………..…8Assumptions of IRT..……………………………………………………… 9
Models of IRT………………………………………………………………10Item and Test Level Information …………………………………………...12
Rationale and Objectives for the Project …………………………………...13Hypotheses …………………………………………………………………14
METHOD………………………………………………………………………..… 14
Participants………………………………………………………………….14
Instruments………………………………………………………………….15Unidimensionality of Subscales…………………………………………….15
IRT Model and Parameter Estimation ……………………………………...16
RESULTS………………………………………………………………………….. 17
Unidimensionality of Scales. ……………………………………………… 17Item Parameter Estimation …………………………………………………17
DISCUSSION………………………………………………………………………19
Implications …………………………………………………………..…… 20
Future Research Directions…………………………………………………21Conclusion ………………………………………………………………… 22
REFERENCES…………………………………………………………………….. 23
APPENDIX A…………………………………………………...………………… 28
Table 1: The IPIP Items in Each of the Preliminary Scales

IRT Analysis v
Measuring the Five NEO Domains. ………………………………………. 28
Table 2: Characteristics of the Preliminary IPIP ScalesMeasuring the NEO Domains ……………………………………..……… 31
APPENDIX B……………………………………………………………………… 32
Table 3: Eigenvalues for the first factor and
percent of variance accounted for each of the scales used.…………………32Figure 1: Scree plots for the scales of the NEO-PI-R……………………... 33
Figure 2: Scree plots for the IPIP Scales measuring the NEO domains…… 34
APPENDIX C……………………………………………………………………… 35
Table 4: Item parameter estimates for the NEO-PI-R …………………….. 35
Table 5: Item parameter estimates for the IPIP……………………………. 41
APPENDIX D…………………………………………………...………………….44
Table 6: Information and standard error values (#)for the NEO-PI-R and the IPIP……………….…………………………… 44
Table 7: Average information provided per itemfor the NEO-PI-R and the IPIP. ……………………………….………….. 45
Table 8: Relative efficiency of the each NEO-PI-R scalein comparison to the IPIP at points of theta.………………………………. 46
Figure 3: Test information functions for NEO-PI-R scales……………….. 47Figure 4: Test standard errors for NEO-PI-R scales………………………. 48
Figure 5: Test information functions for the IPIP Scalesmeasuring the NEO domains………. ……………...……………………… 49
Figure 6: Test standard errors for the IPIP Scalesmeasuring the NEO domains.……………………………...………………. 50
APPENDIX E……………………………………………………………………… 51
Table 9: Item parameter estimates for the dichotomized NEO-PI-R
midpoints coded to the negative pole …………………………...………… 51Figure 7: Frequency distribution of the a parameters -NEO-PI-R
midpoints coded to the negative pole ………………………………..……. 57Figure 8: Frequency distribution of the b parameters -NEO-PI-R
midpoints coded to the negative pole …………………………………..…. 58Figure 9: Frequency distribution of the c parameters -NEO-PI-R
midpoints coded to the negative pole ……………………………………... 59Table 10: Item parameter estimates for the dichotomized IPIP
midpoints coded to the negative pole ……………………………….…….. 60Figure 10: Frequency distribution of the a parameters for the IPIP
scales with midpoints dichotomized to the negative pole. …………………63

IRT Analysis vi
Figure 11: Frequency distribution of the b parameters for IPIP
scales with midpoints dichotomized to the negative pole ……...…………..64Figure 12: Frequency distribution of the c parameters for IPIP
scales with midpoints dichotomized to the negative pole ……...…………..65Table 11: Item parameter estimates for the dichotomized NEO-PI-R
midpoints coded to the positive pole ……………………………………… 66Figure 13: Frequency distribution of the a parameters for the NEO-PI-R
scales with midpoints dichotomized to the positive pole…………….. …....72Figure 14: Frequency distribution of the b parameters for the NEO-PI-R
scales with midpoints dichotomized to the positive pole …………….….…73Figure 15: Frequency distribution of the c parameters for the NEO-PI-R
scales with midpoints dichotomized to the positive pole ……………..…... 74Table 12: Item parameter estimates for the dichotomized IPIP
midpoints coded to the positive pole …………………………………..….. 75Figure 16: Frequency distribution of the a parameters for the IPIP scales
with midpoints dichotomized to the positive poles …………………….…. 78Figure 17: Frequency distribution of the b parameters for the IPIP
with midpoints dichotomized to the positive poles …………………… .….79Figure 18: Frequency distribution of the c parameters for the IPIP
with midpoints dichotomized to the positive poles ……………………..… 80
APPENDIX F……………………………………………………………………… 81
Figure 19: Test information functions for NEO-PI-R scaleswith dichotomous scoring, midpoints coded toward the negative pole….… 81
Figure 20: Test standard error functions for NEO-PI-R scaleswith dichotomous scoring, midpoints coded toward the negative pole….… 82
Figure 21: Test information functions for NEO-PI-R scaleswith dichotomous scoring midpoints coded toward the positive pole…...…83
Figure 22: Test standard error functions for the NEO-PI-R scaleswith dichotomous scoring midpoints coded toward the positive pole …......84
Figure 23: Test information functions for IPIP scaleswith dichotomous scoring, midpoints coded toward the negative end …..... 85
Figure 24: Test standard error functions for IPIP scaleswith dichotomous scoring, midpoints coded toward the positive end……...86
Figure 25: Test information functions for IPIP scaleswith dichotomous scoring, midpoints coded toward the positive end…….. 87
Figure 26: Test standard error functions for IPIP scaleswith dichotomous scoring, midpoints coded toward the positive end…….. 88
VITA………………………………………………………………………………..89
INTRODUCTION
Personality tests are widely used in the field of Industrial/Organizational
Psychology, both in research and as a selection measure. Personality tests are also
increasing in their popularity in organizations and they are frequently used in areas such
as employee selection and training. Many studies have focused on the validity of such
measures; however, fewer studies have focused on their psychometric properties.
Additionally, new measures are frequently being developed to assess personality. As
these new measures are being developed it is important to assess their psychometric
properties so that we can continually improve such measures.
Item response theory (IRT) provides a valuable tool for assessing the
psychometric properties of a personality measure. While IRT has been widely used in
educational measurement and test scoring, to date, IRT has not been used to the extent
possible in personality measurement (Panter, Swygert, Dahlstrom, &Tanaka, 1997). This
study provides a brief overview of both personality testing and item response theory. The
psychometric properties of two personality measures are then examined.
Personality Background
Although the use of personality testing in Industrial/ Organizational Psychology
has been criticized in the past (e.g. Guion & Gottier, 1965), it has been important to the
field and has been growing in popularity. One reason for the current expansion of
research in personality testing has been the advent of the Big Five (Digman, 1990) and
five-factor model (FFM) of personality. Prior to the Big Five and FFM gaining
acceptance in the field of I/O Psychology, researchers did not have a complete and
parsimonious taxonomy for classifying personality traits.
Although most researchers tend to use the terms Big Five and five-factor model
interchangeably, some researchers argue that they are actually two different, but very
similar, models (John & Robbins, 1993; Saucier & Goldberg, 1996). The Big Five model
of personality consists of a classification of personality attributes. It is mainly atheoretical
and attempts to describe behavior rather than explain it. The five-factor model builds on
the Big Five taxonomy but differs from the Big Five in that it makes an attempt at
explaining the underlying causal properties of personality. Both models consist of five
major personality traits.

IRT Analysis 2
The Big Five is largely based on the lexical hypothesis. The lexical hypothesis
states that important individual differences will come to be encoded into language over
time (Goldberg, 1993). Dating back to the 1930’s, multiple researchers have subjected
lists of personality traits found in dictionaries to factor analysis and have arrived at a 5-
factor structure (Fiske, 1949; Goldberg, 1990; Norman, 1963; Saucier & Goldberg, 1996;
Thurstone, 1934). This factor structure surfaced whether peer versus self- descriptions,
different factor analytic procedures, different sets of items, and different languages were
used (Mount & Barrick, 1995). These five factors serve as a way of classifying hundreds,
if not thousands, of more specific traits or attributes (Goldberg, 1995).
The five-factor model (FFM) builds on the structure of the Big Five by including
research on the factor analytic results of numerous personality descriptions and
instruments. A five-factor structure has been found across different instruments (e.g.
McCrae & Costa, 1985, 1987), and cultures (e.g. Borkenau & Ostendorf, 1989; Digman
& Takemoto-Chock, 1981), as well as using ratings obtained from different sources (e.g.
Fiske, 1949; Norman, 1963; McCrae & Costa, 1987). Additionally, the FFM includes
several assumptions that the Big Five does not, including: individual differences are
stable over time, have a genetic and biological component, and individuals can be
described by their scores on the five domains as well as their facets (John & Robbins,
1993).
The first of the five factors in the Big Five and FFM is Extraversion or Surgency
and includes traits such as extraverted, talkative, and spontaneous. The second factor,
Agreeableness, is associated with traits such as warm, polite, and trustful. Common
attributes associated with the third factor, Conscientiousness, include organized,
responsible, and reliable. The fourth factor has been labeled by both its’ positive and
negative poles. Labeled from the positive pole, Emotional Stability, it includes traits
such as calm, relaxed, and stable. As seen from its opposite pole, Neuroticism, this factor
describes individuals who are anxious, depressed, emotional, and apprehensive. There
has been the most discrepancy in the literature on the labeling of the fifth factor. Costa
and McCrae (1992) refer to this final factor as Openness to Experience. This factor is
also referred to as Intellect (Digman & Takemoto-Chock, 1981; Fiske, 1949; Goldberg,

IRT Analysis 3
1990; and Peabody & Goldberg, 1989) and Culture (Norman, 1963). Despite its label,
this factor includes traits such as imagination, curiosity, and creativity.
How Personality and the Big Five is Important to I/O Psychology
With the rise of the Big Five and the FFM, researchers now had an adequate
taxonomy for classifying individual’s personality. Many studies have focused on the use
of these five personality factors in employee selection. In 1991, Barrick and Mount
conducted an influential meta-analysis examining the relationship between the five
personality dimensions and job performance. In this study, the researchers categorized
scales from personality inventories into each of the dimensions. They then examined the
relation between these dimensions and the performance criteria of job proficiency,
training proficiency, and personnel data for the occupational groups of professionals,
police, sales, skilled/semi-skilled, and managers. Their results found that for all of the
occupational groupings, Conscientiousness was a valid predictor for all three criterion
types with estimated true correlations ranging from .20 to .23. This meta-analysis also
found support for Extraversion as a valid predictor of job performance for managers and
sales representatives.
Tett, Jackson, and Rothstein (1991) were the next to publish a meta-analysis.
This meta-analysis was more sophisticated in that the studies used in the meta-analysis
were divided by those that employed personality measures selected on a basis of a job
analysis versus those not selected in such a manner. Additionally, these authors
examined for differences based on recruits versus incumbents, age, length of tenure, and
civilian versus military job. This study found an overall correlation of .24 of personality
with job performance, with Agreeableness as the best predictor, followed by Openness to
Experience, Emotional Stability, and Conscientiousness. In relation to job analysis, the
study found a higher correlation of personality with job performance in jobs where the
personality measure was selected on the basis of a job analysis.
Most recently, Hurtz & Donovan (2000) conducted a meta-analysis using only
actual measures of the five factors, rather than individual measures of lower level facets
that had been categorized as measuring one of the five factors as Barrick and (1991) and
Tett et al. (1991) had done. As with Barrick and Mount, Hurtz and Donovan found
Conscientiousness to have the highest overall estimated true validity at .20. Additionally,

IRT Analysis 4
validity for Conscientiousness was higher for sales and customer service jobs. Although
the validity coefficients found by Hurtz and Donovan are somewhat lower than those
found by previous studies, their study still provides evidence for the usefulness of
ongoing research in personality testing as it relates to job performance and personnel
selection.
One possible reason for the validity that personality shows in predicting job
performance is due to the link with contextual performance. While task performance
consists of activities that are vital to the organization’s core, contextual performance has
been defined as those activities that contribute to organization not by contributing to the
core but by supporting it instead (Borman & Motowidlo, 1997). These activities
contribute to the overall organization as a whole by providing a supportive environment
for the technical core to function effectively. Previous studies, such as the meta-analyses
described above by Barrick & Mount, and Tett et al., have focused on overall measures of
job performance. According to Motowidlo, Borman, and Schmit (1997) personality
variables are predicted to have a greater impact on contextual performance than they do
on task performance. Support for this hypothesis had previously been found by
Motowidlo & Van Scotter (1994). This study found that more personality variables
correlated with contextual performance than task performance and that the personality
variables combined explained more of the variance in contextual performance than in
task performance.
In 1996, Van Scotter and Motowidlo defined interpersonal facilitation as a subset
of contextual performance. Interpersonal facilitation occurs when coworkers engage in
activities that assist fellow coworkers and their performance that are helpful, cooperative,
and considerate. They then found that Agreeableness significantly correlated (r=.16)
with a measure of interpersonal facilitation. The Hurtz and Donovan meta-analysis also
found a significant correlation between Agreeableness and interpersonal facilitation.
It has also been suggested that other factors may moderate the relationship
between personality and job performance (Barrick & Mount, 1991, 1993). One possible
moderator that has been examined is autonomy. In their 1993 study, Barrick and Mount
found an increase in the validity of Conscientiousness and Extraversion for managers in

IRT Analysis 5
jobs high in autonomy over managers in jobs low in autonomy. Other potential
moderators remain under-researched.
In addition to using the Big Five and FFM to examine individual work
performance, these constructs have also been used to examine team and group
performance. Agreeableness has been found to be a valid predictor for performance in
team jobs (Barrick, & Stewart, 1998; Hough, 1992). Neuman and Wright (1999) also
found that Agreeableness and Conscientiousness explained variance in team performance
beyond that explained the more traditional measures of cognitive ability and job-related
skills.
Overall, these studies are just a sampling of the research that has provided
evidence for the potential usefulness of the Big Five in personnel selection and for the
need for continued research in the area of personality testing. While personality tests do
not show the predictive ability of other measures, such as cognitive ability (Hunter &
Schmidt, 1998), their results may be less affected by the race and gender of the individual
(Hogan, 1991). Therefore, when used with other valid, uncorrelated predictors, the use of
personality testing may increase predictiveness (McHenry, Hough, Toquam, Hanson, &
Ashworth, 1990) while lowering adverse impact. Additionally, the Big Five and
personality measures in general are important to Industrial/Organizational Psychology in
their utility in research in areas other than personnel selection.
Criticisms of the use of the Big Five and Five Factor Model
Several critics have argued that the Big Five is not a comprehensive model of
personality, the most notable of which has been Block (1995). In his critique, Block
argued fault in the Big Five in the use of the lexical approach, single word descriptors,
factor analyses, and laypersons as raters of personality. Another main argument was that
five factors are not comprehensive and that the use of factor analysis has resulted in a
taxonomy of too few factors. Others have agreed, arguing for as many factors as sixteen
(Cattell, 1946) or nine (Hough, 1992) primary factors while others have argued that five
is too many (Eysenck, 1992).
An additional question concerning the use of 5 broad factors and their
comprehensiveness is whether we are losing information by measuring personality along
such broad dimensions rather than using more narrowly defined traits. Each of the five

IRT Analysis 6
major dimensions of personality includes numerous other trait descriptors, each of which
can be used to measure personality in its’ own right. These broad traits, such as the Big
Five, are located at the top of the personality hierarchy and are considered more abstract
and inclusive than the more concrete, distinct, and narrowly defined traits (Ones &
Wisvesvaran, 1996). The ‘bandwidth-fidelity dilemma’ debates whether narrow and
specific personality descriptors will predict criteria better than broad descriptors, such as
the Big Five and FFM (Ones & Wisvesvaran, 1996, Schneider, Hough, & Dunnette,
1996). To an extent, the purpose guiding the selection of a broad versus narrow band
personality measure depends on the research question of interest. That is, broader criteria
of interest, such as multidimensional measures of job performance, may command the
use of a broader predictor (Hogan & Roberts, 1996). Additionally, it is clear that when
one’s purpose is to describe the broad dimensions of normal personality, the use of the
Big Five is clearly adequate. It is only when one’s purpose becomes an interest in
specific traits, regardless of the reason, that one must question the comprehensiveness of
the Big Five.
Despite the criticisms, the use of the Big Five has flourished. When one is
interested in the relations between a broad personality factor and some criterion of
interest, the Big Five provides an inclusive and parsimonious structure for measuring
personality.
Measurement of the Big Five and the Development of a New Measure
During the 1980’s and 1990’s multiple personality inventories were designed to
measure all or part of the Big Five and the five-factor model. These include the NEO
Personality Inventory, the Personal Characteristics Inventory, Goldberg’s adjective
markers, The Hogan Personality Inventory, and the Multidimensional Personality
Questionnaire. While each of these measures was designed with the measurement of the
either FFM or the Big Five as the goal, the interpretation of factors differs across
instrument. In many of the instruments, different adjectives are used to describe the same
factor (Johnson and Ostendorf, 1993). Additionally, all of these measures are proprietary
instruments that consist of items that have been copyrighted by the authors (Goldberg,
1999). This has been a limiting factor in research designed to improve such measures.

IRT Analysis 7
Recently, the International Personality Item Pool was developed by Lewis
Goldberg in an effort to develop a broad-bandwidth, public domain, personality
inventory. The items’ author envisions an international effort of researchers joining
together to continually refine such a measure based on a Big Five framework (Goldberg,
1999). Based on the items in the International Personality Item Pool, Goldberg has
developed two preliminary scales designed to measure the Big Five Factor Markers and
the same constructs as current popular FFM measure the NEO Personality Inventory
Revised (NEO-PI-R). Currently, both scales have a 50 and 100 item version.
Principles of IRT
Previously, the psychometric properties of personality measures have been
examined using classical test theory (CTT). According to classical test theory, an
individual’s observed score on a test consists of the individual’s true score plus error
(X=T+E). Because the true score is an unobservable, hypothetical construct it cannot be
directly measured. Instead, the true score must be estimated from the individual’s
responses on a set of test items.
In CTT, the observed score is assumed to be measured with error. However, in
developing measures, the goal of CTT is to minimize this error. Therefore, CTT has
developed methods of determining the reliability of a measure as way of determining the
amount of error a test may contain. Based on the concept of reliability, CTT also provides
the standard error of measurement (SEM) as a way of calculating a confidence interval
around the expected true score. The SEM interval decreases as the reliability of the
measure increases, indicating a more precise true score estimate.
Several researchers have pointed out problems and limitations of classical test
theory (e.g. Hambleton, Swaminathan, & Rogers 1991, Weiss, 1995). Classical test
theory does not provide information as to how individuals with different “true scores”
perform on each item. Additionally, CTT scores are group-dependent. Since in CTT
item difficulty is defined as the proportion of examinees who answer an item correctly,
administering a test to a group of individuals with low levels of ability or a given trait is
going to result in very different item difficulties than if that same test was administered to
a second group of individuals with high levels of ability. Therefore, the reliability of a
measure is also group-dependent. Additionally, scores generated through CTT are also

IRT Analysis 8
test-dependent, making it difficult for the examiner to make comparisons between
individuals who did not respond directly to the same items.
The use of item response theory offers a number of advantages that CTT does not.
IRT can be used in the construction of measures, to analyze individual items, and to
assign test scores (Steinberg & Thissen, 1995). IRT can also be used to determine
differential item functioning (DIF) for two subgroups and for shortening the length of
some scales through computer adaptive testing (Hambleton et al, 1991). One major
difference between classical test theory and item response theory is that IRT links the
probability of each item response to the underlying trait that is being measured (Drasgow
& Hulin, 1990). Classical test theory does not take into account how individuals score on
each individual item. While CTT depends on the number of items correct, IRT takes into
account the pattern of responses- that is, IRT examines not just which items were
answered correctly or incorrectly but can also take into account the item difficulties,
discriminations, and guessing parameters of the items.
The underlying trait that is being measured is termed theta (θ) in item response
theory. The relationship between theta and the probability of a correct response or item
endorsement (PCR) on the item is graphically described by the item characteristic curve
(ICC). Each item on the test will have its’ own ICC. In the graphical representation of
the ICC, the PCR resides on the Y-axis and, as in any probability, the possible values
range from 0.0 to 1.0. Theta is along the X-axis. An example of an item characteristic
curve is given in Figure 1.1.

IRT Analysis 9
Figure 1.1
In this example, an individual with lower levels of the trait would be less likely to
get the item correct. However, someone with higher levels of the trait is almost
guaranteed to pick the correct response.
Assumptions of IRT
Before using IRT two basic assumptions must be met. These are
unidimensionality and local independence. The assumption of unidimensionality means
that only one trait or ability is measured by the items. In other words, for a test to meet
the assumption of unidimensionality, correlations between the test items must be
accounted for by only a single trait (Crocker & Algina, 1986). While this assumption can
not be strictly met due to the influence of characteristics such as personality, cognitive
and test-taking factors, it is considered met when there is a “dominate” factor in the
measure (Hambleton et al., 1991). This can be assessed through factor analysis.
The second assumption of IRT is local independence. Local independence is
achieved when the latent trait being measured, or theta, is controlled for and as a result,

IRT Analysis 10
responses to test items are statistically independent, or uncorrelated. Because the
responses to test items are assumed to come from a common cause, the latent trait (θ),
when you control for θ, the item responses should become uncorrelated. In other words,
the responses to each item should not influence the responses to the other items.
Local independence and unidimensionality are similar, but not equivalent,
concepts. When the assumption of unidimensionality is met, so is the assumption of local
independence. However, the assumption of local independence can be met without
unidimensional data as long as all aspects that affect the test results are taken into
account.
Models of IRT
The most commonly used models of IRT include the one, two and three parameter
models (Hambleton et al., 1991). The first parameter in each model is termed b. For this
parameter, b is the location on the θ scale where exactly half of the individuals taking the
test will get the item correct or endorse the item in the keyed direction. Hence, the b
parameter is the difficulty parameter. For items that are either correct or incorrect this
means that as the value of b increases, the higher the level of ability required for the
individual to have a 50% chance of getting the item correct. For personality measures,
this means that as the value of the b parameter increases the greater the amount of the
trait the individual must have before having a 50% chance of answering the item in the
scaled direction. The one-parameter model of IRT includes only this parameter. In effect,
the one-parameter model assumes that the score is a function of only the difficulty of the
items and the latent trait. The equation for the item characteristic curve for the one-
parameter model is:
where i= 1, 2,….,n. In this equation Pi (θ) is equal to the probability that an examinee
chosen at random with a given theta score answers item i in the scaled direction, bi is the
item i difficulty parameter and e is equal to 2.718. This model is rarely used because of
its restrictiveness.
)(
)(
1)(
i
i
b
b
i
e
eP
−
−
+
=θ
θ
θ

IRT Analysis 11
The second component in the two- and three- parameter models is the a
parameter. This parameter is the item discrimination parameter. In this model, a is equal
to the slope of the ICC at the point of maximum discrimination. For the one- and two-
parameter models this point is at point b on θ. Items with steeper slopes are more
discriminating items.
The two-parameter IRT model includes only the two previously described
parameters. The equation for computing the ICCs under this model is:
The three-parameter IRT model includes a third parameter, c. This is the
“pseudo-chance” or “pseudo guessing” parameter. This parameter adds a lower
asymptote for the ICC. Theoretically, as the level of ability or trait decreases to zero the
probability of a correct response should also approach zero. However, even those with
very low scores on a trait may be able to guess the correct answer.
For personality measures, this third parameter takes on a slightly different
meaning. Instead of interpreting the c parameter as a “pseudo guessing” parameter it is
interpreted as the likelihood that the respondent will endorse an item in the opposite
direction of their true score (Zumbo et al, 1997). An example of this would be an
emotionally stable individual answering in a way that would indicate neuroticism.
The equation for the 3-parameter model is:
An additional IRT model is Samejima’s (1969) graded response model. This
model is used in instances where responses are ordered, for example, as in a Likert scale
or multiple point grading scale, rather than dichotomous, as in the 1-,2-, and 3-parameter
models. This model attempts to extract more information from the individual’s responses
beyond whether they gave correct or incorrect responses. In this model, responses to an
item i are classified into m=m+1 categories. For an item with m+1 categories, m
difficulty parameter values need to be estimated for each item as well as one common
)(
)(
1)(
ii
ii
bDa
bDa
e
eP
−
−
+
=θ
θ
θ
)(
)(
1)1()(
ii
ii
bDa
bDa
iii
e
eccP
−
−
+
−+=θ
θ
θ

IRT Analysis 12
slope (discrimination) parameter. The following equation is used to calculate the
probability of an examinee replying to an item in a particular category or above:
The application of the IRT model begins with the estimation of the parameters.
Before estimating parameters, all that is known is the individual’s responses to the test
items. Neither the latent trait (θ), nor the item parameters are known. These come from
the individual’s responses. A commonly used method for estimating the parameters for
the IRT model is the maximum likelihood procedure.
Given the assumption of local independence, we can multiply the probabilities of
each item response to obtain the joint probability, or the likelihood function. The
maximum likelihood estimate of theta is the value of theta that makes the likelihood
function for an examinee a maximum. Peculiar response patterns, including those where
the individual answers all items correctly or incorrectly may result in an infinite absolute
maximum.
Item and Test Level Information
Using the above parameters, Item Information Functions (IIFs), can be computed.
The IIF shows the level of information provided by the item across levels of θ. By
information, we mean the precision of measurement. In other words, an item that
provides a lot of information has good ability to discriminate between individuals with
different levels of theta. When the three-parameter model is used the equation for the IIF
is:
)(
)(
1)(
ii
ii
bDa
bDa
e
eP
−
−
+
=θ
θ
θ
2)(7.1)(7.1
2
1
]1][[
)1(89.2)(
iiii
i
baba
i
i
eec
caI
−−−
++
−
=θθ
θ

IRT Analysis 13
By taking the reciprocal of the square root of the IIF we get the SEM function of the
item. The SEM is inversely related to the IIF, rather than demonstrating the precision of
the measurement, it describes the imprecision, or error of measurement of the item
Because of the assumption of local independence, the IIF function is additive.
Therefore, the sum of the IIFs is the test information function (TIF). This is shown in the
following equation:
The TIF provides us with the amount of information, or how precisely the test measures,
that is provided by the test at all possible levels of theta.
We can also calculate the Standard Error of Measurement (SEM) for the test. The
SEM provided by IRT is similar to the SEM provided by CTT in that is gives us a
confidence interval around the ability estimate. However, in IRT the SEM for the test
can vary by trait level.
Additionally, the Test Characteristic Curve (TCC) can be computed by summing
the ICCs. When the item response model fits the data, the TCC is the true score (τ). A
association to θ can then be made.
Sometimes researchers and practitioners desire to compare scores taken from two
different tests. In order to compare parameters across items or subsets of items in IRT, all
parameters must be on a common scale. Linking is the procedure of adjusting the
parameters to such a common scale (Vale, 1986). This permits us to make comparisons
across tests.
Rationale and Objectives for the Project
Despite the number of advantages of IRT few personality measures have been
examined using it. Previous IRT work has been conducted on the Myers-Briggs Type
Indicator (Harvey, Murray, & Markham, 1994), the Multidimensional Personality
Questionnaire (Reise & Waller, 1990) and the Minnesota Multiphasic Personality
Inventory (Rouse, Finger, & Butcher, 1999). No previous research was found on IRT
calibrations on the subset of IPIP items used in this study, or on the NEO-PI-R items.
∑=
=
n
i
iII
1
)()( θθ

IRT Analysis 14
Given the advantages of IRT and the lack of examinations of the personality measures in
question using IRT the authors propose this research should be done. Additionally, this
work is being done to aid in the development of measures based on the International
Personality Item Pool.
For this study, the Test Information Functions for the NEO-PI-R and the IPIP
FFM measure will be compared to assess differences between the two tests in level of
information provide by each test across a range of thetas. Additionally, the authors were
interested in exploring a comparison of the graded-response model using the 5-item likert
scale against a two alternative binary model, to explore what degree of information loss
(if any) is associated with using a simpler response format. Since several other popular
measures of personality use binary response options and respondents may often avoid
choosing the extreme options on a likert scale it was expected that the scales would not
lose information when broken down into a binary model. This technique of
dichotomizing the responses was used in at least one study examining Differential Item
Functioning for the NEO-FFI, the short version of the NEO-PI-R (Jennings and Schmitt,
2000) in which the authors recognize the limitations of collapsing the responses options
into two groups without prior research.
Hypotheses
Hypothesis 1: The test information function for each scale will be relatively flat.
Each scale is hypothesized to provide information across a range of trait levels.
Hypothesis 2: The NEO-PI-R and IPIP scales will provide similar levels of
information across the range of theta.
Hypothesis 3: Neither the NEO-PI-R nor IPIP scales will sustain information loss
when broken down into a binary model.
Method
Participants
Individuals were recruited by mail solicitation as a part of a research project
designed to create and validate the International Personality Item Pool. All participants
were recruited from a list of local homeowners in a Northwest community of the
continental United States during 1993. During the course of four years, each participant
in the project was mailed an inventory to complete and return in a pre-addressed stamped

IRT Analysis 15
envelope. From this sample, 567 completed both the NEO-PI-R and the items comprising
the IPIP scales used for this analysis. This sample was 57.7% female and 97.4%
Caucasian. Many (41.4%) were employed full-time and an additional 15.2% were
employed part-time. All individuals were between the ages of 18 and 85.
Instruments
NEO Personality Inventory (Costa & McCrae, 1992). The NEO-PI-R consists
of 240 items which were designed to measure 30 traits which are organized into the five
larger factors making up the five factor model: Extraversion, Openness to Experience,
Neuroticism, Consciousness, and Agreeableness. Items are rated on a 5-point likert scale
ranging from “strongly disagree” to “strongly agree” (Costa & McCrae, 1992). The NEO-
PI-R has shown agreement with a variety of other personality measures in multiple
studies (Wiggens & Trapnell, 1997, Furnham, 1996).
International Personality Item Pool (Goldberg, 1999). The International
Personality Item Pool consists of 1412 items developed by Lewis R. Goldberg. From
these items scales have been developed to measure the Big Five domains and the FFM
domains (as measured by the NEO-PI-R). There is a 100 item and 50 item version of
each scale. For the purposes of this study, the 100 item version of the FFM scale was
used. Each scale consists of 5 subscales. The subscales for the IPIP scale measuring the
FFM construct are: Extraversion, Agreeableness, Conscientiousness, Emotional Stability,
and Openness to Experience. Each item in the scale consists of a personality descriptive
term with a 5 point likert scale with responses ranging from very inaccurate to very
accurate. The coefficient alphas for the five domains measured by the IPIP scale
measuring the NEO-PI-R domains range from .77 to .82. These scales have been found
to correlated .63 to .93 with the NEO-PR-R scales (Goldberg, 2000). A complete list of
the IPIP items used in this study is provided in Table 1 in Appendix A. Table 2 in
Appendix A provides additional characteristics of the scales.
Unidimensionality of Subscales
Before estimating item parameters, the assumption of unidimensionality of
subscales must first be met. In other words, we must be assured that each of the scales
measuring one of the five factors of personality does truly measure only one and not
multiple factors. Numerous methods of assessing unidimensionality of subscales have

IRT Analysis 16
been employed. In this study, the assumption of unidimensionality of subscales is
assessed through an exploratory factor analytic method, specifically principal
components analysis.
In the results of the principal components analysis, two main items are examined:
the percent of variance accounted for and the scree plot. The scree plot is a plot of the
eigenvalues of each factor. In determining unidimensionality of the subscale, the first
factor must be clearly separated from the other factors on the scree plot. This
demonstrates the presence of one dominant first factor. The percent of variance
accounted for was also examined. In order to ensure acceptable item calibration, the
percent of variance accounted for by the dominant factor must be at least 20 percent
(Reckase, 1979).
IRT Model and Parameter Estimation
Previous personality research has used the one-, two-, and three parameter models
(Harvey, Murry & Markham, 1994, Zumbo et al, 1997, Rouse et al, 1999) as well as
Samejima’s graded response model (Gray-Little, Williams, & Hancock, 1997). Since
both the NEO-PI-R and IPIP scales use Likert scales, Samejima’s (1969) graded response
model is ideal for the first part of this study. The computer program MULTILOG was
used in the estimation of parameters and theta. MULTILOG uses marginal maximum
likelihood estimation of item parameters and is appropriate for use when the data has
polychotomous responses. Additionally, it provides goodness-of-fit statistics (Thissen,
1986). Since the same population completed both measures, and therefore should be
matched on theta for the two measures, the items were not linked. The values of
information were then plotted to form graphs of the test information functions (TIFs).
The graphs illustrating the TIFs were then examined to test the stated hypotheses.
For the second part of the study, the comparison of the graded-response model
against a binary model, BILOGMG with the Bayes estimation method was used in
creating the test information functions for the binary model. BILOGMG is similar to
MULTILOG and is appropriate for use when the data has dichotomous responses. In
order to create dichotomous responses, the 5 point likert scale were recoded into two
alternatives.

IRT Analysis 17
The midpoint for each scale, (“neutral” for the NEO-PI-R and “neither accurate
nor inaccurate” for the IPIP) presented a dilemma. Throwing out these responses resulted
in a large percentage of missing data. Therefore, the responses were recoded two
separate times. For the first, the midpoint response was coded to the pole opposite the
scale label. That is, for the NEO-PI-R, responses of a 0, 1, or 2 were coded with a 0 and
responses of a 3, or 4, were coded 1, indicating agreement with the item. For the IPIP,
responses of a 1, 2, or 3, were coded a 0 and responses of a 4, or 5 were coded 1,
indicating that the item accurately reflected the rater. To code the midpoints toward the
positive pole, for the NEO-PI-R, responses of a 0, or 1, were coded with a 0 and
responses of a 2, 3, or 4, were coded 1. For the IPIP, responses of a 1 or 2 were coded a
0 and responses of a 3, 4, or 5 were coded 1. Again, the graphs of the TIFs were
examined to test the hypothesis.
Results
Unidimensionality of Scales
For all scales unidimensionality was confirmed through the use of principal
components factor analysis. The eigenvalues for the first factor and percent of variance
accounted for each of the scales are presented in Table 3 in Appendix B. The percent of
variance accounted for ranged from 42.86 to 84.97 percent for the scales of the NEO-PI-
R and from 69.28 to 89.61 percent for the IPIP. Thus, the percent of variance accounted
for was above 20% for each scale examined and met the previously set criteria.
Therefore, the percent of variance accounted for the by the first factor is sufficient for
IRT analysis. Additionally, the scree plots are provided in Figures 1 and 2 in Appendix
B. For each scale the first factor was clearly separated from the other factors.
Item Parameter Estimation
As previously discussed, the computer program MULTILOG and Samejima's
(1969) graded response was used for item parameter estimation for the likert scale items.
This resulted in one discrimination parameter and four difficulty parameters for each
item. These parameter estimates for each measure are provided in Tables 4 and 5 in
Appendix C. The total test information functions and the corresponding standard error of
estimation were also calculated. These values of information and standard error across
various levels of theta are presented in Table 6 of Appendix D. Also, the average

IRT Analysis 18
information provided by each item was calculated by dividing the value of information
by the total number of items in the scale. Table 7 in Appendix D provides these values.
The Test Information Functions (TIFs) and Test Standard Errors (TSEs) are presented
graphically in Figures 3-6 of Appendix D.
Next, BILOGMG was used to estimate the item parameters for the dichotomized
scale items. However, BILOGMG was unable to estimate item parameters for one of the
scales of the dichotomized IPIP, the IPIP Openness to Experience scale with midpoints
dichotomized to the positive pole. All other item parameters are presented in Tables 9
through 12 of Appendix E. The frequency distributions for the parameters are also
provided in Figures 7-18 in Appendix E. The test information function curves as well as
the test standard error curves for all of the dichotomized NEO-PI-R and IPIP scales used
are shown in Figures 19 through 26 of Appendix F.
Hypothesis 1 stated that the test information function for each scale will relatively
flat and that each scale is hypothesized to provide information across a range of trait
level. An examination of the graphs in Appendix C provides support for this hypothesis
for several of the scales of the NEO-PI-R. Most notably, four of the five scales of the
NEO-PI-R provided a relatively consistent level of information. The Neuroticism scale,
however, showed a significant decrease in information provided at the lower end.
Although all of the IPIP scales become flat, several show slight decreases in information
at the upper levels of theta. The Extraversion scale did support the hypothesis as it
consistently measure with a similar level of precision across all levels of theta.
Hypothesis 2 stated that the NEO-PI-R and IPIP scales would provide similar
levels of information across the range of theta. As can be seen by the graphs in Appendix
C, this hypothesis were not supported for the majority of the scales. In fact, only at the
lowest level of theta for the Neuroticism scale did the IPIP provide more information.
For all other scales, the NEO-PI-R provided more information. This was especially true
for the Conscientiousness scale.
Hypothesis 3 stated that neither the NEO-PI-R nor IPIP scales would sustain
information loss when broken down into a binary model. This hypothesis was also not
supported. All scales provided less information across a range of theta when broken

IRT Analysis 19
down into dichotomous responses, in several cases providing less than half the
information of the likert scale format.
Discussion
The present study was undertaken to examine the psychometric properties of two
personality measures: the NEO-PI-R, a measure commonly used in research, and the
IPIP, a newly developed measure. Upon finding one dominant trait in each scale of the
measures the test information functions (TIFs) for each scale were examined. One trend
that was found to be apparent across the several of the scales of the IPIP is the decrease in
information at values of theta important for personnel selection and research. For
example, the Conscientiousness scale decreases in information provided and precision at
values of theta equal to and greater than .5. For this scale this suggests that the scale are
less reliable for measuring the traits of respondents scoring at the highest levels of theta.
The IPIP Conscientiousness scale may not be very accurate at measuring distinctions
between individuals at higher levels of the trait. This is a concern for I/O psychologists
due to the fact that the individuals who are often of most interest are those who score
higher on scales such as Conscientiousness. Since it is often the individuals at the highest
levels of these traits that are desirable for employee selection this presents a dilemma in
measurement. Thus, the IPIP Conscientiousness scale shows room for improvement at
the upper levels of theta.
Despite providing lower amounts of information, in most cases the IPIP is more
efficient than the NEO-PI-R. The IPIP consists of less than half the number of items of
the NEO-PI-R without providing less than half the information. In fact, most of the IPIP
scales provided a greater amount of information and precision per item, on average, than
did the corresponding NEO-PI-R scale. The relative efficiency of a test, in comparison
to another, can be calculated by dividing the information functions of Test A at theta by
the information function of Test B at theta (Hambleton, et al, 1991). Thus, for example,
at θ=1 the NEO-PI-R Conscientiousness scale is operating as if it were 1.89 times as long
as the IPIP. In fact, the NEO-PI-R is 2.4 times as long. Additional relative efficiency
values are provided in Table 8 in Appendix D.
Both scales were also converted to dichotomous response sets and the test
information functions were then re-examined. All scales lost information when responses

IRT Analysis 20
were converted to dichotomous responses from the original likert scale form. In
particular, the NEO-PI-R scales lost the most information at the more extreme values of
theta for each scale and the test information functions became much less flat. For
example, the both the Conscientiousness and Agreeableness scales became negatively
skewed and became extremely less precise at the upper ends of the scale. The IPIP scales
also lost precision at the ends, in many instances providing almost no information for
those individuals two standard deviations away from the mean.
This study also provides evidence that the International Personality Item Pool
shows promise as a useful measure of personality. Although the IPIP scale provided
lower values of test level information than the commonly used and accepted measure of
the FFM, the NEO-PI-R, it was more efficient overall. An additional, unhypothesized,
positive aspect of the IPIP scale found here was that the between category threshold
parameters (b1-4) were evenly spread out across the range of the trait, providing evidence
for the integrity of the anchors on the likert rating scale used. With this IPIP scale it is
also important to keep in mind that the scale is a preliminary scale and subject to future
revision. While future revisions to the scales are deemed necessary to increase the
information and level of precision across the highest levels of theta for several of the
scales and for the lower values of theta for the Neuroticism scale, the IPIP clearly shows
potential to be a useful measure of personality.
Implications
One of the most important implications of this research concerns the use of
personality tests in research. Obviously, the researcher would prefer to use the measure
that provides the most information and precision about the individual on the region of the
trait of interest. For example, if the researcher were interested in the productivity of a
group consisting of mid-range to highly Extraverted individuals they would want to use a
test that accurately distinguished between individuals on an Extraversion scale.
However, other factors, such as cost and test length often come into play in the decision
to use one scale over another in research. These two factors are benefits of the IPIP five
factor model scales. Being less than half the length of the NEO-PI-R and free to use, the
IPIP have advantages over the NEO-PI-R for use in research. However, despite the scale
used, the administrator should continue to use the likert scale the test was developed with

IRT Analysis 21
rather than dichotomizing responses, which results in greater information and precision
loss.
This research also has implications for the use of the personality tests in industry.
For example, the IPIP Conscientiousness scale is best used when the lower levels of
Conscientiousness is the area of interest, such selecting against individuals low on the
trait, not when the area of investigation is in the finer distinctions among individuals high
in Conscientiousness, such as in the case if one desired to rank individuals by their
scores. This personality measure would not recommended if the employer intended to
use a top-down score or sliding band method of selection. The same advice is extended
toward companies wishing to put to use the Neuroticism scale of the NEO-PI-R. As this
scale provides more information and more reliable estimates of the trait for highly
Neurotic individuals, rather than those individuals at the Emotionally Stable end of the
scale, it is suggested that this scale in particular is not used for ranking individuals in
terms of Emotional Stability.
Future Research Directions
Future research should examine the items in both scales for differential item
functioning (DIF), such as that conducted by Jennings and Schmitt (2000) examining
racial DIF in the NEO-FFI. Studies examining DIF should be conducted to determine if
any of the items in either scale are functioning differently depending on the group
membership of the respondent. Biased items in the IPIP scale could then potentially be
replaced with other non-biased items from the International Personality Item Pool.
Additional research should also be conducted to continue to improve on the scale
of the International Personality Item Pool used for this study. The IPIP scale used in this
study, as well as the other IPIP scales, are still open for refinement (Goldberg, 2000).
Items that demonstrate poor discrimination and are less useful for distinguishing between
individuals of varying levels of the trait should be replaced with items that demonstrate
more ability to make fine discriminations amongst individuals.
Lastly, research such as that conducted here should also be applied to other IPIP
scales, such as that measuring the Big Five Factor Markers (Goldberg, 2000). Additional
IPIP scales can benefit through an item response analysis for use for examination of the
item and test properties.

IRT Analysis 22
Conclusion
In conclusion, the use of Item Response Theory (IRT) provides a number of
advantages over Classical Test Theory (CTT) in examining the psychometric aspects of
personality measures. In particular, IRT allows us to examine test functions to determine
at what level(s) of the trait the test is most precise. Both the NEO-PI-R and IPIP show
room for improvement in terms of precision for several levels of the trait. In particular,
both scales show room for improvement for levels of traits that are of particular interest
for use in personnel selection and research. For these scales, revision is recommended to
increase the precision across these highest levels of theta. In comparison of the two tests,
although the NEO-PI-R provides a greater level of information along the levels of the
trait in question, the IPIP offers greater efficiency in that it offers a greater level of
information per item and is less than half the length of the other measure.

IRT Analysis 23
References
Barrick, M. R. & Mount, M.K. (1991). The big five personality dimensions and
job performance: A meta-analysis. Personnel Psychology, 44, 1-26.
Barrick, M.R. & Mount, M. K. (1993). Autonomy as a moderator of the
relationship between the big five personality dimensions and job performance. Journal of
Applied Psychology, 78, 111-118.
Bentler, P. M. & Bonett, D. G. (1980). Significance tests and goodness-of-fit in
the analysis of covariance structures. Psychological Bulletin, 88, 588-606.
Block, J. (1995). A contrarian view of the five-factor approach to personality
description. Psychological Bulletin, 117, 187-215.
Borkenau, P., & Ostendorf, F. (1989). Descriptive consistency and social
desirability in self and peer reports. European Journal of Personality, 3, 31-45.
Borman, W. C., & Motowidlo, S. J. (1997). Task performance and contextual
performance: The meaning for personnel selection research. Human Performance, 10,
99-109.
Costa, P.T. and McCrae, R. R. (1992). Four ways the big five are basic.
Personality and Individual Differences, 13, 653-665.
Crocker, L. & Algina, J. (1986). Introduction to Classical and Modern Test
Theory. Fort Worth, TX: Harcourt Brace Jovanovich.
Digman, John M (1990). Personality structure: Emergence of the five-factor
model. Annual Review of Psychology, 41, 417-440.
Digman, J. M., & Takemoto-Chock, N.K. (1981). Factors in the natural language
of personality: Reanalysis and comparison of six major studies. Multivariate Behavior
Research, 16, 149-170.
Drasgow, F. & Hulin, C.L. (1990). Item Response Theory. In M. D. Dunnette &
L. M. Hough (Eds.), Handbook of Industrial Organizational Psychology (Vol. 1, pp. 577-
636). Palo Alto, CA: Consulting Psychologists Press, Inc.
Eysenck, H.J. (1992). A reply to costa and mccrae: P or a and c- the role of
theory. Journal of Personality and Individual Differences, 13, 867-868.
IRT Analysis 24
Fiske, D.W. (1949). Consistency of the factorial structure of personality ratings
from different sources. Journal of Abnormal and Social Psychology, 44, 329-44.
Furnham, A. (1996). The big five versus the big four: the relationship between the
Myers-Briggs Type Indicator (MBTI) and the NEO-PI five factor model of personality.
Personality and Individual Differences, 21, 303-307.
Goldberg, L. R. (1990). An alternative “description of personality”: the big-five
factor structure. Journal of Personality and Social Psychology, 59, 1216-1229.
Goldberg, L. R. (1992). The development of markers for the Big-Five factor
structure. Psychological Assessment, 4, 26-42.
Goldberg, L. R. (1993). The structure of phenotypic personality traits. American
Psychologist, 48, 26-34.
Goldberg, L.R. (1995). What the hell took so long? Donald Fiske and the big-five
factor structure. In P.E. Shrout & S.T. Fiske (Eds.), Personality Research, Methods, and
Theory, (pp. 29-43). Hillsdale, NJ: Lawrence Erlbaum Associates, Inc.
Goldberg, Lewis R. (1999). A broad-bandwidth, public-domain, personality
inventory measuring the lower level facets of several five factor models. Personality
Psychology in Europe. Vol 7. Edited by I. Mervielde, I. J. Deary, F. DeFruyt, and F.
Ostendorf.
Goldberg, L.R. (2000). International Personality Item Pool: A Scientific
Collaboratory for the Development of Advanced Measures of Personality and Other
Individual Differences [online]. Available: http://ipip.ori.org/ipip/.
Grey-Little, B., Williams, V.S.L., Hancock, T.D. (1997). An item response
theory analysis of the rosenberg self-esteem scale. Personality and Social Psychology
Bulletin, 23, 443.
Guion, R. M. & Gottier, R. F. (1965). Validity of personality measures in
personnel selection. Personnel Psychology, 18, 135-164.
Hambleton, R. K., Swaminathan, H. & Rogers, H.J. (1991). Fundamentals of
Item Response Theory. Newbury Park: Sage.
Harvey, R.J., Murry, W.D., & Markham, S.E. (1994). Evaluation of Three Short-
Form Versions of the Myers-Briggs Type Indicator. Journal of Personality Assessment,
63, 181-184

IRT Analysis 25
Hogan, R. T. (1991). Personality and personality measurement. In Dunnette,
M.D. & Hough, L.M. (Eds.), Handbook of Industrial and Organizational Psychology, (pp.
873-919). Palo Alto, CA: Consulting Psychologists Press, Inc.
Hough, L.M. (1992). The big five personality variables- construct confusion:
Description versus predictions. Human Performance, 5, 139-155.
Hoyle, R. H. & Panter, A, T (1995). Writing about structural equation models. In
Hoyle, R. H. (Ed.) Structural Equation Modeling: Concepts, Issues, and Applications,
(pp. 158-176), Thousand Oaks: Sage Publications.
Hurtz, G. M. & Donovan, J.J (2000). Personality and job performance: The big
five revisited. Journal of Applied Psychology, 85, 869-879.
Jennings, D.A. & Schmitt, N. (2000). Examination of Differential Item
Functioning: Subgroups and Personality. Paper presented at the 15th annual meeting of
the Society for Industrial and Organizational Psychology, Atlanta, GA.
John, O. P. (1990). The “big five” factor taxonomy: Dimensions of personality in
the natural language and in questionnaires. In Pervin, L.A. (Ed.) Handbook of
Personality: Theory and Research, (pp. 66-100). New York, NY: The Guilford Press.
John, O.P. & Robbins, R.W. (1993). Gordon Allport: The father and critic of the
five-factor model. In K.H. Craik, R. Hogan & R.N. Wolfe (Eds.), Fifty Years of
Personality Psychology, (pp. 215-236). New York, NY: Plenum Press.
Johnson, J.A. & Ostendorf, F. (1993). Clarification of the five-factor model with
the abridged big five dimensional circumplex. Journal of Personality and Social
Psychology, 65, 563-576.
Neuman, G.A. & Wright, J. (1999). Team effectiveness: beyond skills and
cognitive ability. Journal of Applied Psychology, 84, 376-389.
Norman, W.T. (1963). Toward an adequate taxonomy of personality attributes:
replicated factor structure in peer nomination personality ratings. Journal of Abnormal
and Social Psychology, 66, 574-83.
McCrae, R.R & Costa, P.T. (1985). Updating Norman’s “adequate taxonomy”:
Intelligence and personality dimensions in natural language and in questionnaires.
Journal of Personality and Social Psychology, 49, 710-721.

IRT Analysis 26
McCrae, R.R & Costa, P.T. (1987). Validation of the five-factor model of
personality across instruments and observers. Journal of Personality and Social
Psychology, 52, 81-90.
McHenry, J.J., Hough, L.M., Toquam, J.L., Hanson, M.A., Ashworth, S. (1990).
Project a validity results: the relationship between predictor and criterion domains.
Personnel Psychology, 43, 335-353.
Mount, M.K., Barrick, M.R., & Stewart, G.L. (1998). Five-factor model of
personality and performance in jobs involving interpersonal interactions. Human
Performance, 11, 145-165.
Mount, M.K., & Barrick, M.R. (1995). The big five personality dimensions:
implications for research and practice in human resources management. Research in
Personnel and Human Resource Management, 13, 153-200.
Motowidlo, S. J., Borman, W. C, & Schmit, M.J. (1997). A theory of individual
differences in task and contextual performance. Human Performance, 10, 71-83.
Motowidlo, S. J. & Van Scotter, J.R. (1994). Evidence that task performance
should be distinguished from contextual performance. Journal of Applied Psychology,
79, 475-480.
Ones, D.S. & Viswesvaran, C. (1996). Bandwidth-fidelity dilemma in personality
measurement for personnel selection. Journal of Organizational Behavior, 17, 609-626.
Panter, A. T., Swygert, K. A., Dahlstrom, W. G., Tanaka, J. S. (1997). Factor-
analytic approaches to personality item-level data. Journal of Personality Assessment,
68, 561-589.
Peabody & Goldberg (1989). Some determinates of factor structure from
personality-trait descriptors. Journal of Personality and Social Psychology, 57, 552-567.
Reckase, M. D. (1979). Unifactor Latent Trait Models Applied to Multi-Factor
Tests: Results and Implications. Journal of Educational Statistics, 4, 207-230.
Reise, S. P. & Waller, N. G. (1990). Fitting the two-parameter model to
personality data. Applied Psychological Measurement, 14, 45-58.
Rouse, S.V., Finger, M.S., & Butcher, J.N. (1999). Advances in clinical
personality measurement: An item response theory analysis of the MMPI-2 PSY-5
scales. Journal of Personality Assessment, 72, 282-307.

IRT Analysis 27
Samejima, F. (1969). Estimation of Latent Ability Using a Response Pattern of
Graded Scores. Psychometrika Monograph Supplement, 34 (4, Pt. 2).
Saucier, G. & Goldberg, L.R. (1996). Evidence for the big five in analysis of
familiar English personality adjectives. European Journal of Personality, 10, 61-77.
Schneider, R.J., Hough, L.M., Dunnette, M.D. (1996). Broadsided by broad traits:
how to sink science in five dimensions or less. Journal of Organizational Behavior, 17,
639-655.
Steinberg, L. & Thissen, D. (1995). Item response theory in personality research.
In Shrout, P.E., & Fiske, S.T. (Eds). Personality Research, Methods, and Theory (pp. 29-
43). Hillsdale, NJ: Lawrence Erlbaum Associates, Inc.
Tett, R. P., Jackson, D.N., & Rothstein, M. (1991). Personality measures as
predictors of job performance: A meta-analytic review. Personnel Psychology, 44, 703-
742.
Thissen, D. (1986). MULTILOG [Computer program]. Mooresville, IN:
Scientific Software.
Vale, C. D. (1986). Linking item parameters onto a common scale. Applied
Psychological Measurement, 10, 333-344.
Van Scotter, J. R. & Motowidlo, S.J. (1996). Interpersonal facilitation and job
dedication as separate facets of contextual performance. Journal of Applied Psychology,
81, 525-531.
Weiss, D.J. (1995). Improving individual differences measurement with item
response theory and computerized adaptive testing. In Lubinski, D. & Davis (Eds),
Assessing Individual Differences in Human Behavior: New Concepts, Methods and
Findings. Palo Alto, CA: Consulting Psychologists Press.
Wiggins, J.S. & Trapnell, P. D. (1997). Personality structure: The return of the
big five. In Hogan, R., Johnson, J., & Briggs, S (Eds), Handbook of Personality
Psychology. San Diego, CA: Academic Press.
Zumbo, B.D., Pope, G.A., Watson, J.E., & Hubley, A. M. (1997). An empirical
test of Roskam’s conjecture about the interpretation of an ICC parameter in personality
inventories. Educational and Psychological Measurement, 57, 963-969.

IRT Analysis 28
Appendix A: International Personality Item Pool Scale
Table 1: The IPIP Items in Each of the Preliminary Scales Measuring the Five NEO
Domains
Factor I: Neuroticism
X74 Often feel blue.
X15 Dislike myself.
H640 Am often down in the dumps.
E92 Have frequent mood swings.
H948 Panic easily.
H683 Am filled with doubts about things.
H612 Feel threatened easily.
X107 Get stressed out easily.
H999 Fear for the worst.
H1157 Worry about things.
X156 Seldom feel blue.
X129 Feel comfortable with myself.
X265 Rarely get irritated.
X138 Am not easily bothered by things.
H737 Am very pleased with myself.
E141 Am relaxed most of the time.
X231 Seldom get mad.
X59 Am not easily frustrated.
X79 Remain calm under pressure.
E99 Rarely lose my composure.
Factor II: Extraversion
X112 Feel comfortable around people.
H29 Make friends easily.
H1366 Am skilled in handling social situations.
H34 Am the life of the party.
H1110 Know how to captivate people.
H16 Start conversations.
H52 Warm up quickly to others.
X83 Talk to a lot of different people at parties.
X78 Don't mind being the center of attention.
H1151 Cheer people up.
H1039 Have little to say.
H154 Keep in the background.
X147 Would describe my experiences as somewhat dull.
X68 Don't like to draw attention to myself.
IRT Analysis 29
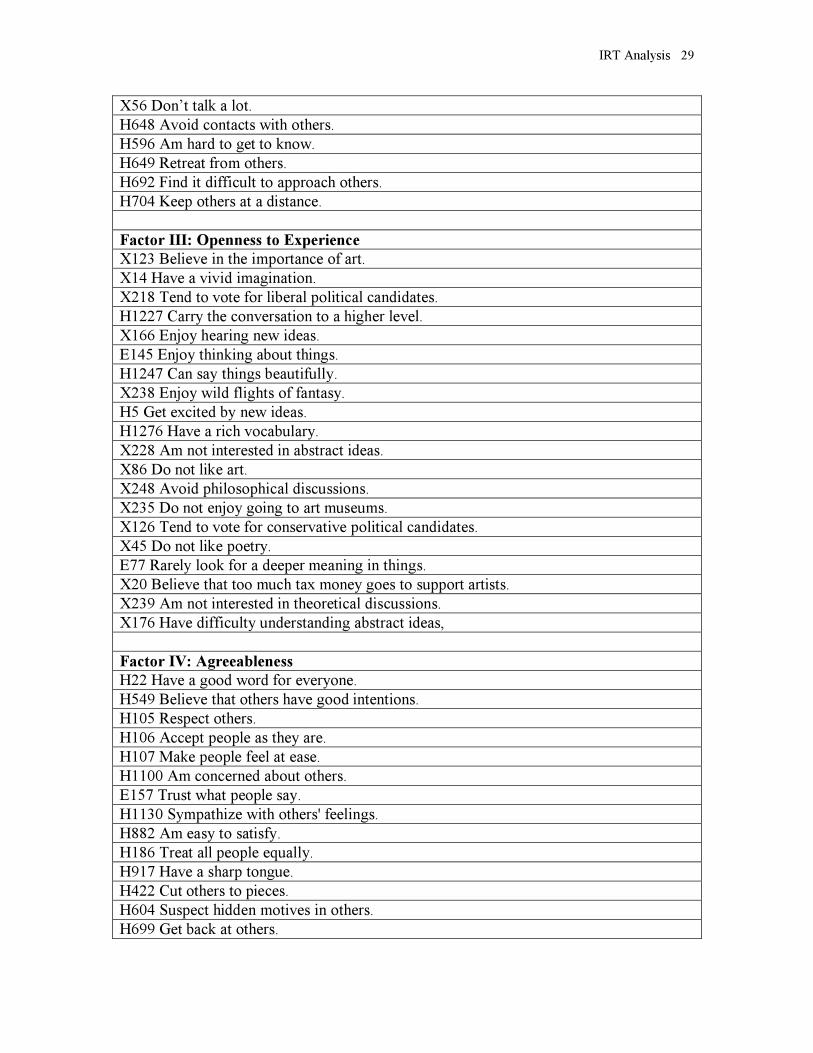
X56 Don’t talk a lot.
H648 Avoid contacts with others.
H596 Am hard to get to know.
H649 Retreat from others.
H692 Find it difficult to approach others.
H704 Keep others at a distance.
Factor III: Openness to Experience
X123 Believe in the importance of art.
X14 Have a vivid imagination.
X218 Tend to vote for liberal political candidates.
H1227 Carry the conversation to a higher level.
X166 Enjoy hearing new ideas.
E145 Enjoy thinking about things.
H1247 Can say things beautifully.
X238 Enjoy wild flights of fantasy.
H5 Get excited by new ideas.
H1276 Have a rich vocabulary.
X228 Am not interested in abstract ideas.
X86 Do not like art.
X248 Avoid philosophical discussions.
X235 Do not enjoy going to art museums.
X126 Tend to vote for conservative political candidates.
X45 Do not like poetry.
E77 Rarely look for a deeper meaning in things.
X20 Believe that too much tax money goes to support artists.
X239 Am not interested in theoretical discussions.
X176 Have difficulty understanding abstract ideas,
Factor IV: Agreeableness
H22 Have a good word for everyone.
H549 Believe that others have good intentions.
H105 Respect others.
H106 Accept people as they are.
H107 Make people feel at ease.
H1100 Am concerned about others.
E157 Trust what people say.
H1130 Sympathize with others' feelings.
H882 Am easy to satisfy.
H186 Treat all people equally.
H917 Have a sharp tongue.
H422 Cut others to pieces.
H604 Suspect hidden motives in others.
H699 Get back at others.

IRT Analysis 30
H1103 Insult people.
H736 Believe that I am better than others.
H808 Contradict others.
H2030 Make demands on others
X217 Hold a grudge.
H1325 Am out for my own personal gain.
Factor V: Conscientiousness
X87 Am always prepared.
H1362 Pay attention to details.
E119 Get chores done right away.
H258 Carry out my plans.
X263 Make plans and stick to them.
H1285 Complete tasks successfully.
H1351 Do things according to a plan.
X163 Am exacting in my work.
H254 Finish what I start.
X196 Follow through with my plans.
H1186 Waste my time.
H1171 Find it difficult to get down to work.
X115 Do just enough work to get by.
H885 Don't see things through.
H1140 Shirk my duties
H896 Mess things up.
H928 Leave things unfinished.
H854 Don't put my mind on the task at hand.
H1467 Make a mess of things.
H969 Need a push to get started.

IRT Analysis 31
Table 2. Characteristics of the Preliminary IPIP Scales Measuring the NEO Domains
NEO-PI-R Domain Number of ItemsMean Item Inter-
CorrelationCoefficient Alpha
Neuroticism 20 .33 .91
Extraversion 20 .35 .91
Openness 20 .29 .89
Agreeableness 20 .23 .85
Conscientiousness 20 .31 .90
Total/Mean 100 .30 .89

IRT Analysis 32
Appendix B
Descriptive Statistics and Factor Analysis of the NEO-PI-R and IPIP Scales
Table 3: Eigenvalues for the first factor and percent of variance accounted for each of the
scales used.
Scale Eigenvalue for
Factor 1
Percent of Variance
Accounted for
NEO-PI-R: Neuroticism 11.79 58.77%
NEO-PI-R: Extraversion 8.71 84.97%
NEO-PI-R: Openness to
Experience
9.32 49.12%
NEO-PI-R: Agreeableness 7.62 42.86 %
NEO-PI-R: Conscientiousness 9.93 56.30%
IPIP FFM: Neuroticism 6.78 83.88%
IPIP FFM: Extraversion 6.96 84.42%
IPIP FFM: Openness to
Experience
6.07 69.28%
IPIP FFM: Agreeableness 4.77 83.60%
IPIP FFM: Conscientiousness 6.30 89.61%

IRT Analysis 33
Figure 1: Scree plots for the scales of the NEO-PI-R.

IRT Analysis 34
Figure 2: Scree plots for the IPIP Scales measuring the NEO domains.

IRT Analysis 35
Appendix C
Item Parameters Estimates for the NEO-PI-R and the IPIP.
Table 4: Item parameter estimates for the NEO-PI-R.
a b1 b2 b3 b4
Neuroticism
I1 1.30 -.57 -.10 1.66 8.99
I6 1.13 .80 1.78 3.71 13.78
I11 1.56 .30 .71 2.22 9.54
I16 1.02 -.28 .55 3.08 15.43
I21 .68 -.40 .40 4.42 19.42
I26 1.77 .98 1.74 3.67 11.48
I31 1.22 .97 1.84 4.13 10.41
I36 .93 .96 2.00 4.19 14.44
I41 1.96 .36 .80 2.47 10.40
I46 1.05 -.59 .08 2.55 12.84
I51 .78 -1.22 -.18 3.86 12.03
I56 1.61 2.06 2.59 4.32 8.47
I61 1.98 .07 .55 2.01 7.62
I66 .65 1.88 3.36 6.49 15.18
I71 1.95 .23 .67 2.19 9.00
I76 1.25 .21 .86 2.62 13.61
I81 .50 -1.24 .44 6.24 22.41
I86 1.55 .01 .57 2.63 12.54
I91 1.71 .61 1.20 3.06 8.36
I96 .92 1.26 2.15 4.59 10.47
I101 .96 -.71 -.07 2.97 10.10
I106 .58 -1.27 -.36 3.39 17.78
I111 .52 -3.10 -2.32 2.84 18.57
I116 .77 1.47 3.27 7.55 17.78
I121 1.32 -.27 .32 3.03 13.62
I126 .87 .37 1.34 4.60 19.23
I131 .90 -.72 .41 3.68 20.03
I136 1.81 .41 .92 2.67 10.27
I141 .35 -2.48 .23 11.55 31.98
I146 1.07 .32 .86 3.43 13.19
I151 1.63 -.49 .09 2.29 10.62
I156 .76 .97 1.90 6.03 14.74
I161 1.95 .86 1.38 3.02 10.45
I166 .97 1.09 1.98 4.74 13.06
I171 .57 1.53 2.36 7.46 18.90
I176 1.19 1.82 2.88 5.51 7.74
I181 1.10 -.57 1.02 4.06 14.52
I186 1.11 -1.33 -.65 3.01 12.14

IRT Analysis 36
I191 1.93 .01 .55 2.64 9.44
I196 1.00 -.06 .84 3.88 18.29
I201 .70 -.66 .32 6.00 24.03
I206 .88 1.34 3.40 17.35 1.39
I211 1.03 -.91 -.16 3.95 14.53
I216 1.04 -.26 .54 4.45 19.00
I221 1.72 .73 1.33 2.85 11.07
I226 .39 -3.74 -1.52 7.60 23.54
I231 .58 -1.25 .20 5.93 23.22
I236 1.76 1.24 1.85 3.28 9.78
Extraversion
I2 1.10 -2.69 -1.65 1.55 9.41
I7 1.12 -.40 .24 2.36 13.01
I12 .46 -1.04 .98 6.51 27.56
I17 .09 -3.52 3.58 34.48 105.13
I22 .37 -1.10 1.49 7.91 29.63
I27 .98 -1.80 -1.27 1.11 10.28
I32 1.51 -1.88 -1.17 .97 8.22
I37 1.09 .14 1.57 3.93 19.05
I42 .65 1.43 2.27 5.37 14.08
I47 .90 -2.69 -.84 3.06 10.53
I52 .20 -3.70 -1.09 7.21 39.91
I57 1.08 -1.79 -2.57 .94 9.40
I62 1.47 -2.30 -1.04 1.27 9.91
I67 .94 -.67 .54 3.94 20.72
I72 .85 -1.58 -.71 2.27 13.67
I77 .42 -2.53 -.56 6.08 22.10
I82 .35 -1.78 -.08 8.44 25.90
I87 1.46 -1.30 -.46 1.56 7.70
I92 1.37 -1.99 -1.04 1.05 10.05
I97 .58 -.90 .34 5.25 22.37
I102 .66 -.70 .54 5.62 21.76
I107 .96 -.54 .65 3.25 20.37
I112 .15 -2.85 .89 15.13 52.01
I117 1.48 -1.28 -.40 1.76 7.84
I121 1.89 -1.64 -.87 1.21 5.91
I127 .80 -.46 .84 4.81 19.65
I131 .82 -2.62 -1.14 3.27 13.30
I137 1.31 -.73 -.21 2.20 8.51
I142 .88 -1.39 .35 3.95 21.84
I147 1.20 -.44 .43 3.06 17.94
I152 1.56 -1.30 -.77 1.46 8.31
I157 .42 .75 2.77 7.73 27.47
I162 1.04 -.23 .84 3.61 24.48

IRT Analysis 37
I167 .34 .63 -1.45 8.74 31.58
I172 .16 -3.53 2.11 14.11 50.95
I177 2.23 -1.19 -.36 1.62 4.86
I182 .95 -2.56 -1.30 2.10 10.50
I187 1.19 -1.42 -.59 2.51 10.04
I192 .45 .64 3.24 9.75 25.93
I197 .95 -.46 .74 4.88 22.01
I202 .42 .29 2.56 8.17 27.97
I207 .94 -.33 .26 3.43 22.09
I212 1.12 -2.77 -1.56 2.05 9.10
I217 .92 -.66 .65 3.73 22.25
I222 .89 -1.61 -.87 2.62 12.98
I227 1.06 -1.66 -.67 2.15 9.42
I232 .56 -1.87 -.22 5.25 17.01
I237 1.43 -2.08 1.19 -1.33 8.10
Openness
I3 1.21 -1.87 -.88 1.35 8.80
I8 1.35 -1.58 -.87 .79 8.24
I13 .65 -1.27 .40 4.06 18.31
I18 .60 .29 1.93 7.09 19.95
I23 1.31 -.88 .00 1.87 8.36
I28 1.11 -2.79 -1.48 .43 10.20
I33 1.13 -.57 .11 2.58 12.95
I38 .96 -1.22 -.41 2.14 11.61
I43 1.05 -1.17 1.53 1.53 9.84
I48 .84 -3.50 -1.54 2.11 11.77
I58 1.35 -1.23 -.40 1.69 8.20
I58 .68 -3.52 -1.97 1.96 13.87
I63 1.04 -.57 .57 2.78 16.67
I68 .95 -.87 -.03 2.29 10.51
I73 .77 -5.84 -3.84 1.16 12.47
I78 .83 1.67 3.29 6.96 12.80
I83 .58 -3.20 -1.73 2.36 16.26
I88 .81 -1.93 -.45 1.34 12.00
I93 .72 -1.18 .26 4.97 18.54
I98 1.60 -1.73 -.89 1.13 7.52
I103 .80 -2.50 -1.22 2.95 12.10
I108 .88 -1.17 -.37 2.43 12.85
I113 1.20 -.07 .64 2.67 16.22
I118 .70 -3.66 -1.84 2.13 13.73
I123 1.00 -.54 .75 3.18 16.28
I128 1.46 -.78 -.26 1.65 7.67
I133 1.10 -1.79 -.90 2.07 9.89
I138 .66 .20 1.91 6.47 18.49

IRT Analysis 38
I143 .33 -1.79 .51 7.37 27.05
I148 .79 -1.65 0.0 3.98 15.58
I153 .77 -1.19 .70 5.15 18.58
I158 .98 -1.52 -.51 2.16 11.21
I163 1.39 -1.75 -1.12 1.63 8.28
I168 .54 -1.23 -.20 4.87 18.88
I173 1.66 -1.38 -.69 .98 7.34
I178 .89 -2.74 -1.81 1.66 11.22
I183 1.19 -2.08 -1.22 1.21 9.17
I188 1.72 -.60 -.06 1.90 7.28
I193 .87 -3.09 -1.62 2.17 11.13
I198 .59 -1.61 .04 4.84 16.19
I203 1.68 -1.69 -.80 1.11 7.00
I208 .55 -4.10 -2.09 2.75 17.27
I213 1.35 -.89 -.21 2.14 8.45
I218 1.08 -.35 .96 3.37 15.71
I223 1.18 -.82 .15 2.60 11.72
I228 .57 -.03 1.03 6.22 23.29
I233 1.56 -1.53 -.64 1.41 7.53
I238 .64 -.77 1.26 5.11 20.42
Agreeableness
I4 1.34 -1.24 -.37 1.78 8.45
I9 1.09 -2.22 -1.45 .82 9.26
I14 1.44 -1.76 -.93 .82 8.06
I19 1.02 -2.53 -1.47 1.55 9.85
I24 .69 -2.39 -.99 2.58 14.40
I29 .46 -7.94 -3.68 1.80 20.39
I34 1.15 -2.87 -1.90 2.23 9.07
I39 1.20 -1.49 -.81 1.18 9.06
I44 1.33 -5.37 -2.91 .40 8.50
I49 1.07 .23 .86 2.46 16.25
I54 .43 -2.42 -.05 6.37 20.94
I59 .76 -1.22 .18 3.74 15.11
I64 .79 -2.27 -.83 3.59 12.72
I69 .74 -.36 .73 3.72 19.48
I74 1.27 -2.43 -1.45 .59 8.87
I79 .53 -1.30 -.15 5.64 16.71
I84 .79 -2.40 -.39 2.25 12.62
I89 .50 -1.59 .48 4.97 19.35
I94 1.18 -2.75 -1.19 2.35 9.41
I99 .87 -3.84 -2.42 .09 12.15
I104 1.81 -4.03 -2.67 .37 5.31
I109 1.03 -2.79 -1.54 1.79 9.83
I114 .69 -3.37 -1.27 3.74 14.44

IRT Analysis 39
I119 .30 -2.80 .44 10.34 30.72
I124 1.19 -2.37 -1.44 1.70 8.82
I129 .79 -6.10 -4.17 .51 12.22
I134 .99 -2.09 -.92 2.12 10.67
I139 .95 -1.41 -.20 4.09 12.35
I144 .28 -1.21 3.64 11.52 36.19
I149 .56 -2.58 .17 4.54 16.31
I154 1.63 -1.82 -1.16 1.76 7.46
I159 1.31 -2.22 -1.42 .99 8.19
I164 1.08 -4.37 -2.11 2.15 9.39
I169 .92 -1.44 -.28 2.87 10.88
I174 .47 -.54 .92 5.34 25.92
I179 .89 -2.89 -1.86 1.08 10.98
I184 1.96 -1.88 -1.14 1.69 5.36
I189 1.19 -2.15 -1.31 1.02 8.90
I194 1.23 -2.46 -1.40 2.21 8.66
I199 .99 -1.39 -.32 2.06 11.36
I204 .65 -2.83 -.50 3.95 14.40
I209 1.07 -3.59 -2.30 1.80 9.39
I214 1.2 -1.88 -.97 2.09 8.56
I219 .48 -3.34 -.11 5.59 19.12
I224 1.12 -2.68 -1.29 1.99 9.09
I229 1.20 -2.55 -1.78 1.00 8.91
I234 .44 -3.62 .07 4.84 20.79
I239 .65 -2.11 .39 4.15 14.51
Conscientiousness
I5 1.01 -3.02 -1.21 1.86 9.93
I10 .40 -.56 1.60 7.47 27.73
I15 1.37 -3.66 -2.59 -.13 9.88
I20 .66 -2.22 -.52 3.18 16.19
I25 1.42 -2.21 -1.63 1.06 8.03
I30 .51 .85 2.13 7.25 21.13
I35 .38 -7.64 -5.86 -.01 25.18
I40 1.08 -2.20 -1.09 1.47 9.67
I45 1.32 -1.51 -1.07 1.10 9.63
I50 1.57 -1.14 -.18 1.90 7.75
I55 1.34 -1.34 -.57 1.82 7.93
I60 1.17 -3.10 -1.96 1.71 8.64
I65 1.22 -3.51 -2.04 1.74 8.49
I70 1.31 -1.58 -.85 1.57 8.45
I75 .75 -4.31 -2.87 -.08 13.42
I80 .99 -1.00 .30 3.40 17.91
I85 1.83 -2.33 -1.39 1.19 6.59
I90 .82 .34 1.03 4.18 17.31

IRT Analysis 40
I95 1.35 -1.17 -.47 2.43 8.06
I100 1.11 -2.20 -1.37 1.36 9.49
I105 .47 -2.75 -1.53 1.79 19.68
I110 1.55 -2.57 -1.58 1.00 7.49
I115 1.43 -1.24 -.57 2.02 8.14
I120 1.05 -1.36 -.40 3.14 9.14
I125 1.19 -2.81 -1.25 1.87 8.81
I130 2.04 -1.47 -1.06 .95 5.74
I135 1.60 -3.10 -2.16 .48 9.98
I140 .51 .27 1.38 6.27 22.88
I145 2.01 -1.86 -1.27 1.09 6.05
I150 .72 -.83 .42 6.38 21.35
I155 1.44 -1.53 -1.19 1.11 7.86
I160 .91 -1.17 -.26 3.34 10.99
I165 1.09 -2.29 -1.09 2.02 9.85
I170 1.07 -1.71 -.64 2.26 10.72
I175 1.26 -1.83 -.87 2.18 9.13
I180 .83 -1.92 -.85 3.66 12.59
I185 1.49 -2.97 -1.61 1.35 7.97
I190 .59 .51 1.60 4.88 19.38
I195 1.75 -2.83 -1.86 .87 6.42
I200 1.37 -1.61 -.76 1.81 8.42
I205 1.22 -.95 -.55 2.45 9.25
I210 .96 -2.41 -1.43 1.97 10.48
I215 1.92 -2.37 -1.62 .95 4.92
I220 .97 -1.36 -.64 2.49 11.63
I225 .91 -2.22 -1.70 1.00 10.59
I230 .52 -.43 .82 5.26 23.48
I235 1.54 -1.54 -.76 1.74 7.49
I240 .45 -3.63 -1.25 5.68 20.93

IRT Analysis 41
Table 5: Item parameter estimates for the IPIP.
a b1 b2 b3 b4
Neuroticism
X74 2.26 -.58 .53 1.01 2.37
X15 1.74 .12 1.11 2.03 3.22
H640 1.50 -.57 .62 1.43 2.55
E92 1.48 -.76 .71 1.32 2.86
H948 1.12 -.83 1.41 2.21 3.72
H683 1.38 -1.04 .37 1.18 3.20
H612 1.17 -.96 .95 1.73 3.74
X107 1.64 -1.21 .59 1.25 2.81
H999 1.19 -.43 1.11 1.99 4.07
H1157 .19 -13.65 -5.21 -1.56 8.79
X156 1.97 -1.14 .32 .76 2.08
X129 1.58 -.52 1.65 2.47 3.62
X265 1.20 -2.51 .07 .71 2.99
X138 1.25 -2.43 .07 .81 2.88
H737 .95 -2.73 -.16 1.44 3.15
E141 1.05 -1.94 .80 1.49 3.91
X231 1.17 -1.78 .63 1.23 3.21
X59 1.28 -2.11 .27 .94 3.05
X79 .98 -1.93 1.27 2.29 4.75
E99 .91 -1.86 1.24 1.91 4.32
Extraversion
X112 2.13 -2.82 -1.37 -.78 1.06
H29 2.08 -2.45 -1.07 -.46 .97
H1366 1.43 -2.47 -.94 .09 1.80
H34 1.21 -.77 .40 1.91 3.87
H1110 1.09 -2.75 -.54 .92 2.99
H16 1.56 -2.82 -1.25 -.35 1.43
H52 1.35 -3.21 -1.12 -.30 1.82
X83 1.33 -1.77 -.16 .48 2.10
X78 1.16 -1.93 -.07 .54 2.69
H1151 1.14 -4.10 -2.68 -1.22 1.77
H1039 1.49 -3.40 -1.43 -.35 1.56
H154 1.15 -3.23 -.69 .57 2.59
X147 .93 -4.61 -1.38 -.71 1.36
X68 1.01 -1.68 .69 1.72 4.57
X56 1.08 -2.69 -.65 .08 1.83
H648 1.27 -4.18 -1.90 -.98 .61
H596 1.43 -2.70 -.78 -.17 1.40
H649 1.99 -3.77 -1.74 -.67 1.29
H592 1.38 -2.84 -.83 -.06 1.56
H704 1.25 -3.04 -1.11 -.19 1.55

IRT Analysis 42
Openness
X123 1.89 -2.42 -1.57 -.81 .40
X14 .96 -4.37 -2.11 -1.13 1.09
X218 1.03 -1.46 -.48 .33 1.55
H1227 .97 -3.73 -1.85 -.01 2.67
X166 1.35 -5.45 -3.35 -2.40 .30
E145 1.28 -5.01 -3.08 -1.83 .75
H1247 .87 -3.58 -1.46 .11 2.31
X238 .69 -1.72 .12 1.52 4.53
H5 .78 -7.64 -3.96 -2.14 1.24
H1276 1.11 -3.38 -1.89 -.57 1.38
X228 1.85 -2.33 -1.02 -.31 1.06
X86 1.87 -3.00 -1.92 -1.08 -.11
X248 1.78 -2.26 -1.07 -.49 .91
X235 1.51 -2.15 -1.10 -.59 .52
X126 .96 -1.92 -.38 .33 1.07
X45 1.15 -2.71 -1.19 -.29 1.05
E77 1.27 -3.70 -1.37 -.86 .92
X20 1.10 -2.67 -1.48 -.05 .87
X239 1.49 -2.61 -1.32 -.58 1.19
X176 1.51 -2.44 -1.00 -.40 1.13
Agreeableness
H22 1.08 -4.52 -2.28 -.63 2.27
H549 1.22 -4.57 -2.73 -1.51 1.70
H105 1.59 -6.32 -4.29 -2.99 -.34
H106 1.26 -4.95 -2.59 -1.73 .89
H107 1.40 -4.29 -2.56 -1.40 1.03
H1100 1.25 -5.07 -3.51 -2.25 .21
E157 .65 -5.67 -2.75 -1.22 4.22
H1130 1.24 -4.51 -2.86 -1.98 .60
H882 .83 -4.44 -2.06 -1.03 2.22
H186 .84 -3.75 -2.03 -1.03 1.84
H917 1.02 -3.73 -1.35 -.68 .73
H422 1.62 -4.69 -2.86 -2.14 -.94
H604 1.00 -3.78 -1.64 -.47 1.45
H699 1.22 -4.89 -2.86 -1.89 -.24
H1103 1.87 -6.02 -3.07 -2.12 -.94
H736 .89 -3.70 -2.03 -.91 .89
H808 1.08 -4.68 -2.11 -.86 1.03
H2030 .92 -5.12 -1.70 -.64 1.37
X217 .87 -4.91 -1.70 -.81 1.19
H1325 .91 -4.59 -2.33 -.86 1.19
Conscientiousness
X87 1.08 -4.50 -2.31 -1.11 2.18
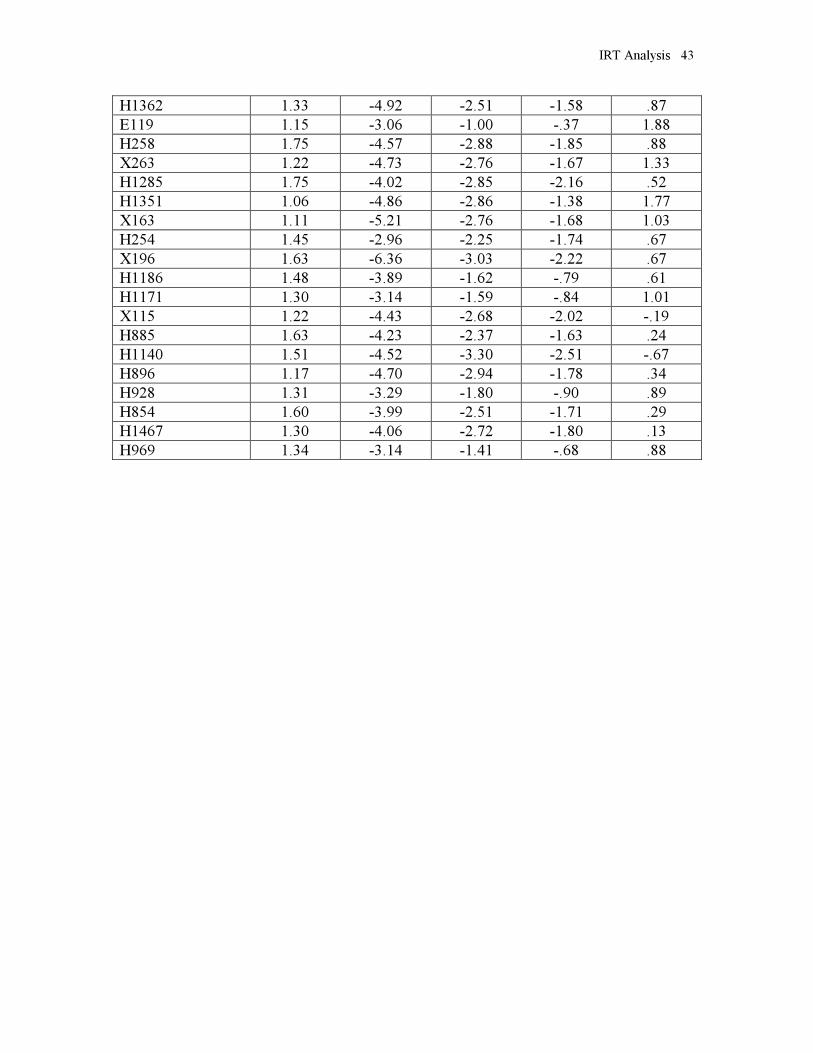
IRT Analysis 43
H1362 1.33 -4.92 -2.51 -1.58 .87
E119 1.15 -3.06 -1.00 -.37 1.88
H258 1.75 -4.57 -2.88 -1.85 .88
X263 1.22 -4.73 -2.76 -1.67 1.33
H1285 1.75 -4.02 -2.85 -2.16 .52
H1351 1.06 -4.86 -2.86 -1.38 1.77
X163 1.11 -5.21 -2.76 -1.68 1.03
H254 1.45 -2.96 -2.25 -1.74 .67
X196 1.63 -6.36 -3.03 -2.22 .67
H1186 1.48 -3.89 -1.62 -.79 .61
H1171 1.30 -3.14 -1.59 -.84 1.01
X115 1.22 -4.43 -2.68 -2.02 -.19
H885 1.63 -4.23 -2.37 -1.63 .24
H1140 1.51 -4.52 -3.30 -2.51 -.67
H896 1.17 -4.70 -2.94 -1.78 .34
H928 1.31 -3.29 -1.80 -.90 .89
H854 1.60 -3.99 -2.51 -1.71 .29
H1467 1.30 -4.06 -2.72 -1.80 .13
H969 1.34 -3.14 -1.41 -.68 .88

IRT Analysis 44
Appendix D
Test Level Information for the NEO-PI-R and IPIP Scales
Table 6: Information and standard error values (#) for the NEO-PI-R and the IPIP.
Theta
Scale
-2.0 -1.5 -1.0 -.5 0.0 .5 1.0 1.5 2.0
NEO-PI-R:
Neuroticism
5.0
(.45)
6.9
(.38)
9.7
(.32)
13.5
(.27)
17.4
(.24)
19.9
(.22)
20.4
(.22)
20.0
(.22)
19.9
(.22)
NEO-PI-R:
Extraversion
11.5
(.29)
13.6
(.27)
14.5
(.26)
14.3
(.26)
13.5
(.27)
13.0
(.28)
13.4
(.27)
13.4
(.27)
12.1
(.29)
NEO-PI-R:
Openness
12.0
(.29)
14.2
(.27)
15.5
(.25)
15.7
(.26)
15.2
(.26)
14.8
(.26)
14.8
(.26)
14.4
(.26)
13.1
(.28)
NEO-PI-R:
Agreeableness
14.1
(.27)
14.3
(.26)
13.7
(.27)
12.9
(.28)
12.4
(.28)
12.4
(.28)
12.6
(.28)
12.5
(.28)
11.5
(.29)
NEO-PI-R:
Conscientiousness
18.7
(.23)
20.0
(.22)
19.1
(.23)
17.2
(.24)
16.3
(.25)
17.0
(.24)
17.8
(.24)
16.9
(.24)
14.4
(.26)
IPIP FFM:
Neuroticism
6.4
(.40)
8.1
(.35)
9.7
(.32)
10.7
(.31)
11.3
(.30)
11.9
(.29)
12.0
(.29)
11.7
(.29)
11.5
(.29)
IPIP FFM:
Extraversion
10.7
(.31)
11.4
(.30)
12.0
(.29)
11.9
(.29)
11.3
(.30)
11.1
(.30)
11.1
(.30)
10.4
(.31)
8.7
(.34)
IPIP FFM:
Openness
11.0
(.30)
11.2
(.30)
11.4
(.30)
11.2
(.30)
10.9
(.30)
10.4
(.31)
9.4
(.33)
7.7
(.36)
5.8
(.42)
IPIP FFM:
Agreeableness
8.9
(.33)
8.7
(.34)
8.5
(.34)
8.1
(.35)
7.4
(.37)
6.7
(.38)
6.1
(.40)
5.4
(.43)
4.6
(.47)
IPIP FFM:
Conscientiousness
12.1
(.29)
11.4
(.30)
10.5
(.31)
10.0
(.32)
10.3
(.31)
10.4
(.31)
9.4
(.33)
7.5
(.37)
5.5
(.43)

IRT Analysis 45
Table 7: Average information provided per item for the NEO-PI-R and the IPIP.
Theta
Scale
-2.0 -1.5 -1.0 -.5 0.0 .5 1.0 1.5 2.0
NEO-PI-R:
Neuroticism
.104 .144 .202 .281 .363 .415 .425 .427 .414
NEO-PI-R:
Extraversion
.240 .283 .302 .298 .281 .271 .279 .279 .252
NEO-PI-R:
Openness
.250 .296 .322 .327 .317 .308 .308 .300 .273
NEO-PI-R:
Agreeableness
.294 .298 .285 .269 .258 .258 .263 .260 .240
NEO-PI-R:
Conscientiousness
.390 .417 .340 .358 .340 .354 .371 .352 .514
IPIP FFM:
Neuroticism
.320 .405 .485 .535 .565 .595 .600 .585 .575
IPIP FFM:
Extraversion
.535 .570 .600 .595 .565 .555 .555 .52 .435
IPIP FFM:
Openness
.550 .560 .570 .560 .545 .520 .470 .385 .290
IPIP FFM:
Agreeableness
.445 .435 .425 .405 .370 .335 .305 .270 .230
IPIP FFM:
Conscientiousness
.605 .570 .525 .500 .515 .520 .470 .375 .275

IRT Analysis 46
Table 8: Relative efficiency of the each NEO-PI-R scale in comparison to the IPIP at
points of theta.
Theta
Scale
-2.0 -1.5 -1.0 -.5 0.0 .5 1.0 1.5 2.0
Neuroticism .78 .85 1.00 1.26 1.54 1.67 1.70 1.71 1.73
Extraversion 1.07 1.19 1.21 1.20 1.19 1.17 1.12 1.28 1.39
Openness 1.09 1.27 1.36 1.40 1.39 1.42 1.57 1.89 2.25
Agreeableness 1.58 1.64 1.61 1.59 1.68 1.85 2.07 2.31 2.50
Conscientiousness 1.55 1.75 1.82 1.72 1.58 1.63 1.89 2.25 2.61

IRT Analysis 47
Figure 3: Test information functions for NEO-PI-R scales.

IRT Analysis 48
Figure 4: Test standard error for NEO-PI-R scales.

IRT Analysis 49
Figure 5: Test information functions for the IPIP Scales measuring the NEO domains.
Figure 6: Test standard errors for the IPIP Scales measuring the NEO domains.

IRT Analysis 50

IRT Analysis 51
Appendix E
Item Parameters Estimates for the Dichotomized NEO-PI-R and the IPIP.
Table 9: Item parameter estimates for the dichotomized NEO-PI-R midpoints coded to
the negative pole.
a b c
Neuroticism
I1 0.72358 0.07844 0.01504
I6 0.84945 1.72921 0.00269
I11 1.21281 0.86348 0.02957
I16 0.68435 0.75589 0.02554
I21 0.46743 0.75589 0.01070
I26 1.65911 1.62876 0.00393
I31 1.01285 1.67307 0.00617
I36 0.79936 1.81598 0.00615
I41 1.63594 0.94653 0.01794
I46 0.64998 0.29266 0.02608
I51 0.58332 -0.02985 0.00990
I56 0.09547 -15.68762 0.01593
I61 1.38665 0.62224 0.01089
I66 0.58766 3.14480 0.00859
I71 1.36464 0.81494 0.02834
I76 0.82847 1.07689 0.01032
I81 0.40941 0.49293 0.01499
I86 0.94678 0.73505 0.00726
I91 1.50254 1.17890 0.01660
I96 0.83485 1.88472 0.02356
I101 0.62633 0.32140 0.02183
I106 0.40848 -0.13075 0.01754
I111 0.41621 -1.66959 0.01475
I116 1.04194 2.23689 0.02140
I121 0.80716 0.39546 0.00618
I126 0.74454 1.23048 0.02045
I131 0.64859 0.49920 0.01377
I136 1.47225 1.04922 0.03089
I141 0.33825 0.27921 0.01503
I146 0.69975 0.97703 0.01601
I151 0.98087 0.19725 0.01528
I156 0.73395 1.75749 0.04766
I161 1.48576 1.39808 0.00124
I166 0.82090 1.77584 0.00640
I171 0.58665 2.21636 0.01040
I176 1.38761 2.31375 0.01541

IRT Analysis 52
I181 0.85370 1.12525 0.03541
I186 0.73490 -0.46387 0.01337
I191 1.35481 0.67418 0.00455
I196 0.66083 0.92545 0.00787
I201 0.49704 0.40979 0.01376
I206 1.12796 2.32060 0.01583
I211 0.71601 0.04549 0.01058
I216 0.72302 0.66258 0.02785
I221 1.42978 1.33679 0.01574
I226 0.31432 -0.97629 0.01638
I231 0.42589 0.35614 0.01854
I236 1.25087 1.82812 0.00148
Extraversion
I2 0.60621 -1.52590 0.12469
I7 0.99151 0.74007 0.12423
I12 0.61478 1.51426 0.16309
I17 0.52844 3.36171 0.34089
I22 0.44622 1.91648 0.17053
I27 0.52945 -0.85819 0.10932
I32 0.78223 -1.09072 0.10561
I37 0.97323 1.49660 0.03537
I42 0.58311 2.36251 0.07628
I47 0.58107 -0.46334 0.13137
I52 0.63245 2.31841 0.36510
I57 0.67918 -1.49208 0.12388
I62 0.70486 -0.97894 0.10739
I67 0.75317 0.77002 0.06786
I72 0.67815 0.09472 0.20191
I77 0.31865 0.38995 0.15356
I82 0.31406 1.08014 0.15303
I87 0.88023 -0.22399 0.08819
I92 0.85958 -0.85896 0.10637
I97 0.51065 0.88598 0.09696
I102 0.72664 0.97242 0.14416
I107 0.69875 0.96407 0.08959
I112 0.66427 3.06180 0.33369
I117 0.78941 -0.21437 0.08262
I121 1.04972 -0.74130 0.09948
I127 0.69553 1.02171 0.05821
I131 0.61105 -0.71268 0.12170
I137 0.77308 0.07244 0.08894
I142 0.72482 0.51386 0.05442
I147 0.74525 0.63401 0.04845
I152 0.94602 -0.46724 0.14729

IRT Analysis 53
I157 0.79360 2.18415 0.11190
I162 1.02391 0.97473 0.07164
I167 0.40671 1.49317 0.20544
I172 0.77054 2.72429 0.23014
I177 1.27008 -0.23637 0.04828
I182 0.50264 -1.17076 0.11754
I187 0.73584 -0.31537 0.09084
I192 0.55881 2.33984 0.06487
I197 0.66265 1.08832 0.13339
I202 0.47675 2.43792 0.11254
I207 0.61907 0.69778 0.09985
I212 0.68602 -1.36520 0.11752
I217 0.65976 1.02167 0.05942
I222 0.70331 -0.33853 0.15115
I227 0.94884 -0.01153 0.24043
I232 0.50794 0.72169 0.14781
I237 0.91643 -1.12248 0.11402
Openness
I3 0.71306 -0.65262 0.10356
I8 0.74294 -0.65272 0.09035
I13 0.50128 0.76699 0.08752
I18 0.63085 1.90546 0.09793
I23 0.62128 0.40637 0.07143
I28 0.58883 -1.32207 0.08077
I33 0.65511 0.38212 0.05668
I38 0.83593 0.02478 0.10906
I43 0.62060 -0.93641 0.10093
I48 0.50798 -1.36028 0.07250
I58 0.76442 -0.13614 0.07771
I58 0.39771 -1.64673 0.08678
I63 0.82227 0.91500 0.08404
I68 0.71549 0.33388 0.03530
I73 0.43192 -3.81494 0.08223
I78 0.70638 3.14021 0.02916
I83 0.31910 -1.38256 0.08010
I88 0.55416 0.08779 0.09599
I93 0.92328 0.87752 0.22123
I98 0.98129 -0.75135 0.06597
I103 0.49443 -0.97974 0.08738
I108 0.62261 0.02510 0.09857
I113 0.50128 0.76699 0.08752
I118 0.46507 -1.32943 0.08024
I123 0.83057 0.99379 0.06623
I128 1.00129 -0.00978 0.05305

IRT Analysis 54
I133 0.65135 -0.73298 0.07471
I138 0.51047 1.91768 0.04239
I143 0.28378 1.42650 0.10870
I148 0.55423 0.48313 0.09215
I153 0.71443 0.91040 0.10379
I158 0.66681 -0.15059 0.08421
I163 0.91318 -0.93338 0.08791
I168 0.36735 0.41968 0.10149
I173 0.87572 -0.54874 0.06603
I178 0.48901 -1.7015 0.08194
I183 0.64247 -1.04807 0.08625
I188 1.06042 0.17590 0.04018
I193 0.51039 -1.44897 0.07746
I198 0.40443 0.50776 0.09101
I203 0.93038 -0.71705 0.07026
I208 0.30093 -1.82164 0.0917
I213 0.93801 0.00508 0.04099
I218 0.94727 1.04889 0.04431
I223 0.69101 0.43897 0.05199
I228 0.43450 1.57388 0.11168
I233 0.84409 -0.52272 0.06503
I238 0.57049 1.62713 0.05934
Agreeableness
I4 0.88397 -0.20171 0.01315
I9 0.01315 -1.45146 0.03057
I14 0.74031 -0.88573 0.02826
I19 0.58019 -1.39652 0.02892
I24 0.41879 -0.73371 0.04252
I29 0.31401 -3.09851 0.03284
I34 0.69388 -1.73863 0.02643
I39 0.70995 -0.69414 0.02579
I44 0.70228 -3.14237 0.03265
I49 0.7227 0.99717 0.01323
I54 0.34103 0.35487 0.06882
I59 0.53097 0.39066 0.02447
I64 0.56823 -0.54115 0.02329
I69 0.46543 0.93116 0.01695
I74 0.54928 -1.72281 0.02626
I79 0.30576 0.22611 0.02983
I84 0.40393 -0.1987 0.03861
I89 0.39773 0.67200 0.03128
I94 0.67142 -1.89717 0.03490
I99 0.50928 -2.33943 0.03592
I104 0.72250 -3.41380 0.03302

IRT Analysis 55
I109 0.60591 -1.47676 0.02623
I114 0.34842 -1.30459 0.03122
I119 0.32033 0.66883 0.03050
I124 0.63126 -1.46585 0.03571
I129 0.34972 -4.95185 0.03302
I134 0.46591 -0.89554 0.03008
I139 0.61173 -0.03338 0.01844
I144 0.35294 2.43508 0.06345
I149 0.39000 0.35490 0.03549
I154 0.98418 -1.06537 0.02272
I159 0.74148 -1.3593 0.03529
I164 0.67006 -2.00839 0.03681
I169 0.57440 -0.08809 0.02916
I174 0.36512 1.14064 0.04367
I179 0.49359 -1.78813 0.03028
I184 1.25873 -1.04062 0.01974
I189 0.82500 -1.09033 0.03628
I194 0.68115 -1.3807 0.02771
I199 0.56789 -0.13127 0.02330
I204 0.38638 -0.32728 0.03593
I209 0.61140 -2.29605 0.03282
I214 0.69218 -0.8761 0.02540
I219 0.36225 0.21837 0.04737
I224 0.54106 -1.41958 0.02992
I229 0.67015 -1.79563 0.03460
I234 0.28030 0.40700 0.03627
I239 0.52806 0.52783 0.03581
Conscientiousness
I5 0.57481 -0.99105 0.09326
I10 0.47294 1.49770 0.07189
I15 0.64665 -2.99894 0.05682
I20 0.38097 -0.17627 0.06171
I25 0.77814 -1.59139 0.06372
I30 0.57740 1.63296 0.02378
I35 0.28893 -4.23726 0.06409
I40 0.68053 -0.84152 0.06216
I45 0.69231 -1.05108 0.04764
I50 1.04855 0.02703 0.05906
I55 0.83949 -0.34383 0.06131
I60 0.60240 -2.06682 0.06379
I65 0.65088 -2.11448 0.06207
I70 0.82513 -0.68199 0.03925
I75 0.53683 -2.34810 0.06266
I80 0.62340 0.49498 0.03459

IRT Analysis 56
I85 1.06582 -1.33333 0.06843
I90 0.82068 1.08728 0.07697
I95 0.90577 -0.14700 0.12069
I100 0.67961 -1.1752 0.06777
I105 0.34148 -0.91089 0.07445
I110 0.89226 -1.53349 0.05256
I115 0.99801 -0.35068 0.04464
I120 0.66478 -0.13648 0.09454
I125 0.62935 -1.23655 0.04450
I130 1.17966 -0.96274 0.03876
I135 1.04360 -2.05645 0.05852
I140 0.38229 1.75364 0.06121
I145 1.15463 -1.23088 0.03569
I150 0.59577 0.71582 0.08232
I155 0.64311 -1.19290 0.05247
I160 0.57325 0.08312 0.05570
I165 0.57549 -0.99761 0.06927
I170 0.56856 -0.45121 0.07035
I175 0.74573 -0.72376 0.05091
I180 0.56997 -0.54550 0.05893
I185 0.74568 -1.73092 0.05474
I190 0.48608 1.71293 0.03848
I195 0.86277 -2.01532 0.06574
I200 0.88593 -0.57582 0.04927
I205 0.79073 -0.28365 0.06359
I210 0.59850 -1.18229 0.07821
I215 1.07574 -1.64130 0.05689
I220 0.62612 -0.30927 0.04100
I225 0.46209 -1.60976 0.06660
I230 0.40862 1.19798 0.05843
I235 0.93515 -0.62561 0.03464
I240 0.31009 -0.75243 0.06599

IRT Analysis 57
Figure 7: Frequency distribution of the a parameters for the NEO-PI-R scales with
midpoints dichotomized to the negative pole.

IRT Analysis 58
Figure 8: Frequency distribution of the b parameters for the NEO-PI-R scales with
midpoints dichotomized to the negative pole.

IRT Analysis 59
Figure 9: Frequency distribution of the c parameters for the NEO-PI-R scales with
midpoints dichotomized to the negative pole.

IRT Analysis 60
Table 10: Item parameter estimates for the dichotomized IPIP midpoints coded to the
negative pole.
a b c
Neuroticism
X74 1.55711 1.06659 0.00668
X15 1.34106 1.80687 0.00603
H640 1.64248 1.28627 0.05050
E92 1.33520 1.14178 0.00750
H948 1.24195 1.62534 0.01132
H683 1.28421 1.05754 0.03083
H612 1.02464 1.40510 0.01146
X107 1.15418 1.14842 0.00594
H999 1.17473 1.62152 0.02245
H1157 0.22508 -0.66261 0.02401
X156 1.39346 0.74236 0.02208
X129 1.84228 1.86743 0.00356
X265 0.93505 0.63119 0.01632
X138 1.00023 0.73884 0.02076
H737 0.98591 1.34063 0.07154
E141 0.90163 1.33299 0.02704
X231 0.95186 1.04291 0.00663
X59 0.88997 0.96201 0.03216
X79 0.87190 1.82974 0.00858
E99 0.69434 1.67240 0.00725
Extraversion
X112 1.50755 -0.71491 0.02039
H29 1.30146 -0.43009 0.01436
H1366 0.94241 0.06155 0.01700
H34 1.18670 1.40323 0.00388
H1110 0.69619 0.87338 0.02049
H16 1.10550 -0.30395 0.02055
H52 0.84806 -0.27840 0.01788
X83 0.91317 0.39107 0.00580
X78 0.94385 0.46657 0.02490
H1151 0.70220 -1.17926 0.01928
H1039 1.06637 -0.32386 0.01975
H154 1.02791 0.57525 0.06248
X147 0.63155 -0.64153 0.02784
X68 0.97320 1.38230 0.03126
X56 0.71166 0.04560 0.01535
H648 0.76027 -0.96150 0.01499
H596 0.85456 -0.17649 0.01170
H649 0.62824 -0.69430 0.01632

IRT Analysis 61
H592 0.86419 -0.03842 0.01480
H704 0.79254 -0.16774 0.02069
Openness
X123 1.23656 -0.65086 0.05595
X14 0.61162 -0.94268 0.06039
X218 1.41112 0.42565 0.08274
H1227 0.58017 0.21771 0.07048
X166 0.81280 -2.27345 0.06428
E145 0.65655 -1.58908 0.06297
H1247 0.49101 0.34695 0.06019
X238 0.60725 1.37494 0.04560
H5 0.51512 -1.79881 0.07069
H1276 0.76749 -0.37966 0.06279
X228 1.35077 -0.14010 0.05179
X86 1.08936 -0.99689 0.05778
X248 1.24454 -0.33545 0.04734
X235 0.88273 -0.49684 0.04255
X126 1.62777 0.46667 0.12046
X45 0.65781 -0.15345 0.05161
E77 0.69909 -0.59801 0.05845
X20 1.02653 0.10278 0.04848
X239 1.06115 -0.41162 0.04782
X176 0.94130 -0.20634 0.06999
Agreeableness
H22 0.72612 -0.45173 0.05073
H549 0.81864 -1.25436 0.05073
H105 0.81500 -3.05985 0.05815
H106 0.81887 -1.50448 0.04742
H107 0.72027 -1.33775 0.05553
H1100 0.76730 -1.98616 0.05418
E157 0.47974 -0.64242 0.05294
H1130 1.14191 -1.44629 0.04362
H882 0.57422 -0.65658 0.04362
H186 0.64494 -0.65037 0.05319
H917 0.56355 -0.50239 0.05611
H422 0.93027 -1.99633 0.04980
H604 0.80714 -0.23274 0.04598
H699 0.74831 -1.63590 0.06798
H1103 1.17924 -1.92992 0.05663
H736 0.56592 -0.61803 0.06027
H808 0.68418 -0.62301 0.04522
H2030 0.53083 -0.42673 0.05541
X217 0.68828 -0.48356 0.04953
H1325 0.55404 -0.54700 0.07295

IRT Analysis 62
Conscientiousness
X87 0.72226 -0.82885 0.07756
H1362 0.92904 -1.24808 0.07032
E119 0.75266 -0.00466 0.06863
H258 1.05062 -1.62767 0.07232
X263 0.96556 -1.21508 0.09138
H1285 1.15313 -1.86088 0.07384
H1351 0.76921 -1.02398 0.06929
X163 0.67075 -1.45306 0.07115
H254 0.98299 -1.38731 0.05766
X196 1.02000 -1.93868 0.06943
H1186 0.96885 -0.50438 0.09884
H1171 0.95776 -0.48973 0.08283
X115 0.75176 -1.77706 0.07788
H885 0.90812 -1.45229 0.07911
H1140 1.32252 -1.88548 0.09011
H896 0.88666 -1.28705 0.09544
H928 0.84572 -0.59272 0.07106
H854 1.01068 -1.44298 0.06122
H1467 0.96911 -1.38040 0.07073
H969 0.94132 -0.34934 0.08152

IRT Analysis 63
Figure 10: Frequency distribution of the a parameters for the IPIP scales with midpoints
dichotomized to the negative pole.

IRT Analysis 64
Figure 11: Frequency distribution of the b parameters for the IPIP scales with midpoints
dichotomized to the negative pole.

IRT Analysis 65
Figure 12: Frequency distribution of the c parameters for the IPIP scales with midpoints
dichotomized to the negative pole.

IRT Analysis 66
Table 11: Item parameter estimates for the dichotomized NEO-PI-R midpoints coded to
the positive pole.
a b c
Neuroticism
I1 0.74367 -0.37542 0.02377
I6 0.81655 0.98368 0.00816
I11 1.01058 0.50418 0.01866
I16 0.62949 -0.01088 0.02492
I21 0.48281 -0.09455 0.02743
I26 1.39515 1.19050 0.01437
I31 0.77298 1.22269 0.01879
I36 0.87013 1.30525 0.07727
I41 1.52183 0.62037 0.02270
I46 0.60428 -0.35936 0.03488
I51 0.50632 -0.94903 0.02586
I56 1.17962 1.98118 0.00316
I61 1.16932 0.21138 0.02363
I66 0.62898 2.15199 0.01974
I71 1.53257 0.41661 0.05444
I76 0.91621 0.51448 0.02054
I81 0.39000 -0.73189 0.03264
I86 0.93581 0.26425 0.04139
I91 1.18320 0.74266 0.01719
I96 0.73123 1.33348 0.03475
I101 0.54021 -0.19149 0.04112
I106 0.32406 -1.04723 0.03824
I111 0.40335 -2.27282 0.02985
I116 0.48782 1.83628 0.02381
I121 0.82387 -0.16709 0.02093
I126 0.53624 0.62238 0.03458
I131 0.49476 -0.53517 0.03597
I136 1.15754 0.60470 0.01439
I141 0.24087 -1.89459 0.03514
I146 0.68112 0.53708 0.03836
I151 1.01008 -0.39290 0.01828
I156 0.66267 1.30913 0.09409
I161 1.44753 1.01004 0.01332
I166 0.71286 1.44828 0.06047
I171 0.61242 2.08013 0.06381
I176 0.75350 2.15481 0.02691
I181 0.54483 -0.37557 0.03533
I186 0.65274 -1.13115 0.03447
I191 1.20640 0.21350 0.01447

IRT Analysis 67
I196 0.54441 0.17188 0.03344
I201 0.50065 -0.40248 0.03040
I206 0.74613 1.33692 0.04303
I211 0.58410 -0.63889 0.03299
I216 0.69083 -0.08172 0.02822
I221 1.08817 0.90889 0.02007
I226 0.30385 -2.60866 0.03275
I231 0.37605 -0.87463 0.03628
I236 1.29018 1.28458 0.00455
Extraversion
I2 0.70690 -2.28464 0.19906
I7 0.99227 0.18967 0.13436
I12 0.65192 0.48571 0.22569
I17 0.48829 2.95606 0.46845
I22 0.51730 0.26866 0.21872
I27 0.53190 -1.20606 0.18738
I32 1.06189 -1.50767 0.17328
I37 1.21547 0.41085 0.08087
I42 0.79350 1.64189 0.13923
I47 0.60377 -2.05615 0.23017
I52 0.36996 0.98246 0.27700
I57 0.66294 -2.16405 0.19223
I62 0.66216 -2.49463 0.19762
I67 0.92701 -0.03134 0.16648
I72 0.65069 -0.58715 0.24820
I77 0.37926 -0.79764 0.23924
I82 0.38197 0.37237 0.26743
I87 0.76010 -1.11922 0.13780
I92 0.74142 -1.90033 0.17915
I97 0.50846 0.14305 0.15399
I102 0.81906 0.22248 0.20944
I107 0.80161 0.05181 0.18161
I112 0.54219 2.60272 0.41159
I117 0.84769 -1.10279 0.12956
I121 1.53961 -1.25887 0.19604
I127 0.67964 0.14551 0.10918
I131 0.74338 -1.62118 0.21941
I137 0.95438 -0.30309 0.16452
I142 0.95993 -0.53446 0.20550
I147 0.53182 -0.14598 0.12853
I152 1.19935 -0.78148 0.25460
I157 0.69574 1.63490 0.18832
I162 1.00975 0.22397 0.12539
I167 0.42318 0.44823 0.29048

IRT Analysis 68
I172 0.45009 1.90366 0.26173
I177 1.10613 -1.12751 0.10363
I182 0.64872 -2.06329 0.19582
I187 1.02560 -0.81108 0.19846
I192 0.60841 1.10142 0.16498
I197 0.93792 0.36646 0.22388
I202 0.57182 1.23638 0.22874
I207 0.68152 0.26670 0.16552
I212 0.70899 -2.41915 0.20708
I217 0.94233 0.05196 0.12389
I222 0.66370 -0.85206 0.24489
I227 0.87201 -0.93414 0.25879
I232 0.51945 -0.30987 0.17708
I237 0.89390 -1.79102 0.19861
Openness
I3 0.77840 -1.55262 0.14152
I8 0.82525 -1.28606 0.12238
I13 0.35477 -0.79781 0.12031
I18 0.58437 0.68873 0.11146
I23 0.72963 -0.52543 0.08281
I28 0.66324 -2.34331 0.11501
I33 0.84676 -0.22696 0.08818
I38 0.64499 -0.75340 0.09866
I43 0.58933 -1.43314 0.13006
I48 0.68341 -2.61604 0.11243
I58 0.81908 -0.89488 0.11493
I58 0.65493 -2.06990 0.11130
I63 0.82376 -0.02316 0.12265
I68 0.73501 -0.15723 0.09861
I73 0.47199 -5.24496 0.11540
I78 0.73988 1.68640 0.04672
I83 0.53879 -1.79365 0.11043
I88 0.61274 -0.90577 0.16278
I93 0.55469 -0.41366 0.18610
I98 1.02341 -1.48376 0.12330
I103 0.44023 -2.43229 0.11966
I108 0.72697 -0.59443 0.11433
I113 0.59093 0.28347 0.06336
I118 0.39020 -3.16607 0.11618
I123 0.81009 0.04477 0.12783
I128 1.08298 -0.32220 0.14729
I133 0.64579 -1.63122 0.11027
I138 0.66286 0.42519 0.06063
I143 0.32183 -0.21923 0.11517

IRT Analysis 69
I148 0.59213 -0.84358 0.11653
I153 0.55641 -0.60329 0.16562
I158 0.64793 -1.04821 0.10306
I163 0.68765 -1.82342 0.11958
I16 8 0.40776 -0.38836 0.12915
I173 1.05581 -1.10053 0.10862
I178 0.69927 -2.01335 0.12368
I183 0.51536 -2.26870 0.11634
I188 1.15597 -0.31524 0.06221
I193 0.49446 -2.96600 0.11726
I198 0.62432 -0.58553 0.14940
I203 1.10285 -1.47856 0.13655
I208 0.40450 -3.00962 0.11851
I213 0.79856 -0.59915 0.09441
I218 0.92958 0.01505 0.06077
I223 0.73379 -0.44441 0.09674
I228 0.49379 0.46945 0.10540
I233 0.82425 -1.48842 0.09042
I238 0.57568 0.37180 0.10037
Agreeableness
I4 0.84176 -0.87225 0.15063
I9 0.48493 -2.19454 0.21379
I14 0.75010 -1.58489 0.19584
I19 0.57765 -2.20759 0.21269
I24 0.64593 -1.15555 0.25137
I29 0.39849 -5.07789 0.21450
I34 0.67386 -2.42310 0.21913
I39 1.03867 -0.90853 0.20382
I44 0.50569 -6.73142 0.21215
I49 0.92977 0.56032 0.09282
I54 0.60569 -0.39760 0.31289
I59 0.73390 -0.34182 0.19457
I64 0.55786 -1.45981 0.20223
I69 0.60497 0.30350 0.16273
I74 0.65541 -2.39661 0.20265
I79 0.42268 -0.16312 0.19985
I84 0.70605 -1.24194 0.21518
I89 0.46459 -0.19180 0.24473
I94 0.68115 -2.54560 0.20393
I99 0.53255 -3.33324 0.21263
I104 0.62830 -5.22643 0.21216
I109 0.72419 -2.22770 0.21111
I114 0.46132 -2.59242 0.21469
I119 0.28068 -0.24449 0.25027

IRT Analysis 70
I124 0.58462 -2.42302 0.19962
I129 0.35992 -6.16012 0.21303
I134 0.52090 -1.81984 0.20984
I139 0.81114 -0.77165 0.16273
I144 0.49515 0.73063 0.28451
I149 0.47566 -1.34882 0.22204
I154 1.04010 -1.53778 0.16981
I159 0.85151 -1.82300 0.22313
I164 0.66312 -3.99272 0.21295
I169 0.72104 -0.76476 0.18878
I174 0.62677 0.28497 0.15921
I179 0.60657 -2.16562 0.20636
I184 1.08945 -1.76573 0.18465
I189 0.84670 -1.60779 0.23260
I194 0.65445 -2.36976 0.20479
I199 0.60919 -0.88311 0.20200
I204 0.51659 -1.74832 0.23642
I209 0.51886 -3.81275 0.21179
I214 0.55427 -1.90157 0.20766
I219 0.47933 -1.49479 0.22453
I224 0.66582 -2.42472 0.21476
I229 0.73147 -2.25479 0.21464
I234 0.49769 -1.41473 0.22055
I239 0.42186 -1.28569 0.21044
Conscientiousness
I5 0.58561 -2.75230 0.16691
I10 0.46839 0.69183 0.18568
I15 0.74866 -3.66096 0.15387
I20 0.38964 -1.65843 0.15853
I25 0.88266 -1.93868 0.16813
I30 0.73788 1.18566 0.12887
I35 0.29418 -5.15374 0.16223
I40 0.60447 -1.91857 0.15698
I45 0.77772 -1.31457 0.14413
I50 1.12919 -0.85518 0.11685
I55 0.97381 -0.92016 0.13930
I60 0.70393 -2.85870 0.16001
I65 0.63059 -3.70226 0.16135
I70 0.82959 -1.27472 0.13820
I75 0.57030 -3.23919 0.16070
I80 0.61265 -0.66462 0.10226
I85 0.97578 -2.36061 0.15299
I90 0.86578 0.80109 0.16806
I95 0.83067 -0.89906 0.15368

IRT Analysis 71
I100 0.66395 -1.89971 0.16573
I105 0.34047 -1.59074 0.18614
I110 0.83253 -2.57682 0.15529
I115 0.91126 -0.94282 0.12763
I120 0.85798 -0.77967 0.21569
I125 0.60179 -2.93367 0.15873
I130 1.23581 -1.31833 0.10257
I135 0.88191 -3.08004 0.16038
I140 0.43416 1.03140 0.13497
I145 0.99221 -1.93531 0.12614
I150 0.73296 0.11667 0.24409
I155 0.70096 -1.37151 0.15465
I160 0.58807 -0.49581 0.18266
I165 0.62913 -2.06497 0.17588
I170 0.78611 -1.20749 0.16074
I175 0.80202 -1.55573 0.12805
I180 0.50466 -1.48717 0.17269
I185 0.70598 -3.36639 0.15666
I190 0.44464 1.37068 0.12689
I195 0.82398 -3.10887 0.15152
I200 0.99274 -1.09724 0.24047
I205 0.80211 -0.57305 0.13880
I210 0.69955 -1.85473 0.15425
I215 1.33754 -2.15895 0.15328
I220 0.61488 -0.79859 0.13340
I225 0.54787 -1.70568 0.17704
I230 0.54652 0.51159 0.16030
I235 1.05799 -1.22050 0.14284
I240 0.25917 -3.04635 0.16702

IRT Analysis 72
Figure 13: Frequency distribution of the a parameters for the NEO-PI-R scales with
midpoints dichotomized to the positive pole.

IRT Analysis 73
Figure 14: Frequency distribution of the b parameters for the NEO-PI-R scales with
midpoints dichotomized to the positive pole.

IRT Analysis 74
Figure 15: Frequency distribution of the c parameters for the NEO-PI-R scales with
midpoints dichotomized to the positive pole.

IRT Analysis 75
Table 12: Item parameter estimates for the dichotomized IPIP midpoints coded to the
positive pole.
a b c
Neuroticism
X74 1.44511 0.55757 0.01067
X15 1.23443 1.06697 0.01009
H640 1.16410 0.64976 0.04462
E92 1.15190 0.76491 0.02310
H948 0.88853 1.32340 0.02850
H683 1.04011 0.57629 0.09540
H612 0.96446 0.94111 0.05013
X107 1.14433 0.56716 0.01506
H999 1.01996 1.13379 0.06129
H1157 0.19558 -2.85305 0.04304
X156 1.43294 0.32226 0.02225
X129 1.34523 1.43726 0.00537
X265 0.92377 0.08802 0.02169
X138 0.86800 0.11869 0.02813
H737 0.63004 0.10537 0.07997
E141 1.10903 0.93806 0.10173
X231 0.85123 0.61932 0.02090
X59 0.85095 0.31044 0.02821
X79 0.69242 1.25300 0.02122
E99 0.70182 1.18368 0.02181
Extraversion
X112 1.47323 -1.23024 0.04630
H29 1.30053 -0.94373 0.06506
H1366 1.10040 -0.77674 0.04566
H34 1.20826 0.48596 0.09109
H1110 0.96306 -0.28267 0.09780
H16 1.07730 -1.06255 0.06714
H52 0.84837 -0.97587 0.08617
X83 1.03139 -0.13374 0.02663
X78 0.89740 0.01298 0.05424
H1151 0.77075 -2.37936 0.06373
H1039 1.05405 -1.24567 0.06023
H154 0.92153 -0.48413 0.07694
X147 0.69554 -1.10934 0.06342
X68 0.88930 0.63018 0.04645
X56 0.73234 -0.56784 0.04826
H648 0.86683 -1.66640 0.05320
H596 0.92033 -0.70627 0.03407
H649 0.75537 -1.57565 0.05306

IRT Analysis 76
H592 0.97335 -0.68887 0.05226
H704 0.84260 -0.96818 0.05233
Openness
X123
X14
X218
H1227
X166
E145
H1247
X238
H5
H1276
X228
X86
X248
X235
X126
X45
E77
X20
X239
X176
Agreeableness
H22 0.08004 -14.47519 0.01213
H549 0.09364 -16.35767 0.01192
H105 0.28590 -10.39507 0.01173
H106 0.08240 -17.81814 0.01195
H107 0.09789 -15.82192 0.01190
H1100 0.16606 -11.63054 0.01177
E157 0.07943 -9.81742 0.01254
H1130 0.10065 -16.08749 0.01188
H882 0.07550 -10.66435 0.01254
H186 0.06429 -12.51066 0.01262
H917 0.65316 0.61995 0.00849
H422 1.07333 2.05446 0.01558
H604 0.73003 0.36194 0.01006
H699 0.74594 1.77095 0.00356
H1103 1.25735 1.95538 0.00101
H736 0.59646 0.78788 0.00807
H808 0.78769 0.68914 0.00772
H2030 0.65050 0.51073 0.01120
X217 0.54973 0.71343 0.00970
H1325 0.50055 0.84479 0.00862

IRT Analysis 77
Conscientiousness
X87 0.90273 -1.65107 0.11452
H1362 1.06679 -1.87057 0.11500
E119 0.74751 -0.55491 0.08517
H258 1.14200 -2.45470 0.11244
X263 0.96075 -2.10596 0.12162
H1285 1.31563 -2.29036 0.12991
H1351 0.88881 -2.04751 0.12077
X163 0.75920 -2.24179 0.12515
H254 0.85929 -1.91919 0.09368
X196 1.18377 -2.41329 0.11462
H1186 1.08701 -1.24758 0.10188
H1171 1.20146 -0.97304 0.13829
X115 0.88801 -2.16038 0.11648
H885 1.04237 -2.05068 0.09954
H1140 1.04778 -2.68013 0.13646
H896 0.83829 -2.29978 0.11936
H928 0.83517 -1.44872 0.09939
H854 0.94708 -2.20574 0.11152
H1467 0.91475 -2.12260 0.13312
H969 1.15046 -0.82971 0.16948

IRT Analysis 78
Figure 16: Frequency distribution of the a parameters for the IPIP scales with midpoints
dichotomized to the positive pole.

IRT Analysis 79
Figure 17: Frequency distribution of the b parameters for the IPIP scales with midpoints
dichotomized to the positive pole.

IRT Analysis 80
Figure 18: Frequency distribution of the c parameters for the IPIP scales with midpoints
dichotomized to the positive pole.

IRT Analysis 81
Appendix F
Test Level Information for the NEO-PI-R and IPIP Scales
Figure 19: Test information functions for NEO-PI-R scales with dichotomous scoring,
midpoints coded toward the negative pole.

Figure 20: Test standard error functions for NEO-PI-R scales with dichotomous scoring,
midpoints coded toward the negative pole.

IRT Analysis 83
Figure 21: Test information functions for NEO-PI-R scales with dichotomous scoring
midpoints coded toward the positive pole.

IRT Analysis 84
Figure 22: Test standard error functions for the NEO-PI-R scales with dichotomous
scoring, midpoints coded toward the positive pole.

Figure 23: Test information functions for IPIP scales with dichotomous scoring,
midpoints coded toward the negative end.

IRT Analysis 86
Figure 24: Test standard error functions for IPIP scales with dichotomous scoring,
midpoints coded toward the negative end.

IRT Analysis 87
Figure 25: Test information functions for IPIP scales with dichotomous scoring,
midpoints coded toward the positive end.

Figure 26: Test standard error functions for IPIP scales with dichotomous scoring,
midpoints coded toward the positive end.

IRT Analysis 89
Nadine LeBarron McBride
480 Chrisman StreetChristiansburg, VA 24073
(540) [email protected]
EDUCATION
May 2001 M.S., Industrial/Organizational Psychology
Virginia Tech, Blacksburg, VA Thesis: An Item Response Theory Analysis of the Scales from theInternational Personality Item Pool and the NEO PersonalityInventory RevisedAdvisor: Robert J. Harvey, Ph.D.
May 1998 B.A. Psychology with Honors, Summa Cum Laude
State University of New York at Albany, Albany, NYHonors Thesis: The Relationship Between an Overt Integrity Testand Measures of Self-Monitoring and ReligiousnessAdvisors: George M. Alliger, Ph.D., Stephen Dwight, M.S.
PROFESSIONAL EXPERIENCE
Jan 2001- May2001 Virginia Tech Blacksburg, VAInstructor: Currently teaching two Social Psychology Labs
May 2000- May 2001 Center for Organizational Research Blacksburg, VAConsultant and Project Manager: Oversaw the development andexecution of an exit interview survey program designed todetermine causes of turnover within a large retail organization aswell as conducted an industry-wide salary and turnover survey
Jan 2000- Dec 2000 Virginia Tech Blacksburg, VAGraduate Teaching Assistant: Assisted Morrell Mullins,Assistant Professor, with the administration of his classes
August 1998- Virginia Tech Blacksburg, VADec 1999 Recitation Instructor: Taught two to three Introductory to
Psychology Recitation Sections per semester
PUBLICATIONS
McBride, N.L. (1999). How to Set and Reach Your Goals. InHelena K. Chandler and Jack W. Finney (Eds.), ExploringIntroductory Psychology: A Reader andWorkbook. New York:McGraw Hill, Inc.

IRT Analysis 90
McBride, N.L. (1999). What Determines Your Destiny? In HelenaK. Chandler and Jack W. Finney (Eds.), Exploring IntroductoryPsychology: A Reader and Workbook. New York: McGraw Hill,Inc.
TECHNICAL REPORTS
McBride, N.L., O’Shea, P.G., Hauenstein, N.M. (2001). IndustrySurvey Report.
McBride, N.L, & Hauentstein, N.M. (2001). Regional Report onExit Surveys of Retail Employees of Advance Auto Parts.
McBride, N.L., Hauenstein, N.M., Swartz, D.E., Bess, T.L.,Lemmond, G., Breland, B.T., Hollander, E., Robson, V.E., &O’Shea, P.G. (2001). Report on Exit Surveys of DistributionEmployees of Advance Auto Parts.
Hauenstein, N.M., McBride, N.L., Swartz, D.E., Bess, T.L.Lemmond, G., Breland, B.T., Hollander, E., Robson, V.E., &O’Shea, P.G. (2001). Report on Exit Surveys of Retail Employeesof Advance Auto Parts.
O’Shea, P.G., Hauenstein, N.M., McBride, N.L., Bess, T.L.,Swartz, D.E. (2001). Report on Exit Surveys of AdministrationEmployees of Advance Auto Parts.
CONFERENCE PRESENTATIONS
McBride, N.L. (1999). The relationship between an overt integritytest and measures of self-monitoring and religiousness. Paperpresented at Industrial Organizational/ Organizational BehaviorGraduate Student Conference. Fairfax, VA.
PROFESSIONAL ASSOCIATIONS
American Psychological Association, Student AffiliateSociety for Industrial and Organizational Psychology, StudentAffiliate
RELATED COURSES
Research Methods, Psychological Measurement, IndustrialPsychology, Organizational Psychology, Social Psychology,Statistics in Research, Personality Processes, Quantitative Topics

IRT Analysis 91
in Applied Psychology, Multiple Regression, Applied StructuralEquation Modeling, Psychometric Theory, Seminar inOrganizational Behavior, and Seminar in Tests and Measurements
COMPUTER SKILLS
SPSS, SAS, Word, Excel, PowerPoint, MULTILOG, BILOG