analyst's handbook: industrials - yardeni research · analyst’s handbook: industrials...
TRANSCRIPT

Analyst’s Handbook:Industrials
Yardeni Research, Inc.
June 27, 2018
Dr. Edward Yardeni516-972-7683
Mali Quintana480-664-1333
Please visit our sites atwww.yardeni.comblog.yardeni.com
thinking outside the box

Table Of Contents Table Of ContentsTable Of Contents
June 27, 2018 / Analyst’s Handbook: Industrials www.yardeni.com
Yardeni Research, Inc.
S&P 500 Industrials 1S&P 500: Industrials 2S&P 500: Industrials (cont) 3-4S&P 500/400/600 Industrials YTD 5-6Earnings 7Revenues & Margins 8Earnings Growth & Valuation 9

1995 1996 1997 1998 1999 2000 2001 2002 2003 2004 2005 2006 2007 2008 2009 2010 2011 2012 2013 2014 2015 2016 2017 2018 201995
220
345
470
595
720
95
220
345
470
595
720
6/27
yardeni.com
200-day moving average.* Ratio scale.
Source: Standard & Poor’s and Haver Analytics.
S&P 500 INDUSTRIALS STOCK PRICE INDEX*
Figure 1.
48 50 52 54 56 58 60 62 64 66 68 70 72 74 76 78 80 82 84 86 88 90 92 94 96 98 00 02 04 06 08 10 12 14 16 18 20 22 24.15
.20
.25
.30
.15
.20
.25
.30
S&P 500 INDUSTRIALS(as a ratio of S&P 500)
6/22
Note: Shaded areas denote recessions according to the National Bureau of Economic Research. Monthly through December 1990, then weekly.Source: Standard & Poor’s Corporation.
yardeni.com
Figure 2.
S&P 500 Industrials
Page 1 / June 27, 2018 / Analyst’s Handbook: Industrials www.yardeni.com
Yardeni Research, Inc.

Figure 3.
06 07 08 09 10 11 12 13 14 15 16 17 18 19 20100
200
300
400
500
600
700
6/27
S&P 500 INDUSTRIALS
06 07 08 09 10 11 12 13 14 15 16 17 18 19 2050
150
250
350
450
550
6/27
S&P 500 CONSTRUCTION & ENGINEERING(FLR JEC PWR)
06 07 08 09 10 11 12 13 14 15 16 17 18 19 20150
350
550
750
950
1150
1350
6/27S&P 500 AEROSPACE & DEFENSE(ARNC BA COL GD LLL LMT NOC RTNTDG TXT UTX)
06 07 08 09 10 11 12 13 14 15 16 17 18 19 20100
300
500
700
900
1100
6/27
S&P 500 CONSTRUCTION MACHINERY & HEAVY TRUCKS(CAT CMI PCAR)
06 07 08 09 10 11 12 13 14 15 16 17 18 19 2025
100
175
250
325
400
475
6/27
S&P 500 BUILDING PRODUCTS(ALLE AOS FBHS JCI MAS)
200-day moving averageSource: Standard & Poor’s Corporation.
06 07 08 09 10 11 12 13 14 15 16 17 18 19 20100
250
400
550
700
850
1000
6/27
yardeni.com
S&P 500 ELECTRICAL COMPONENTS &EQUIPMENT(AME AYI EMR ETN ROK)
06 07 08 09 10 11 12 13 14 15 16 17 18 19 200
50
100
150
200
12/11
S&P 500 COMMERCIAL PRINTING(RRD)
200-day moving averageSource: Standard and Poor’s Corporation.
S&P 500: Industrials
Page 2 / June 27, 2018 / Analyst’s Handbook: Industrials www.yardeni.com
Yardeni Research, Inc.
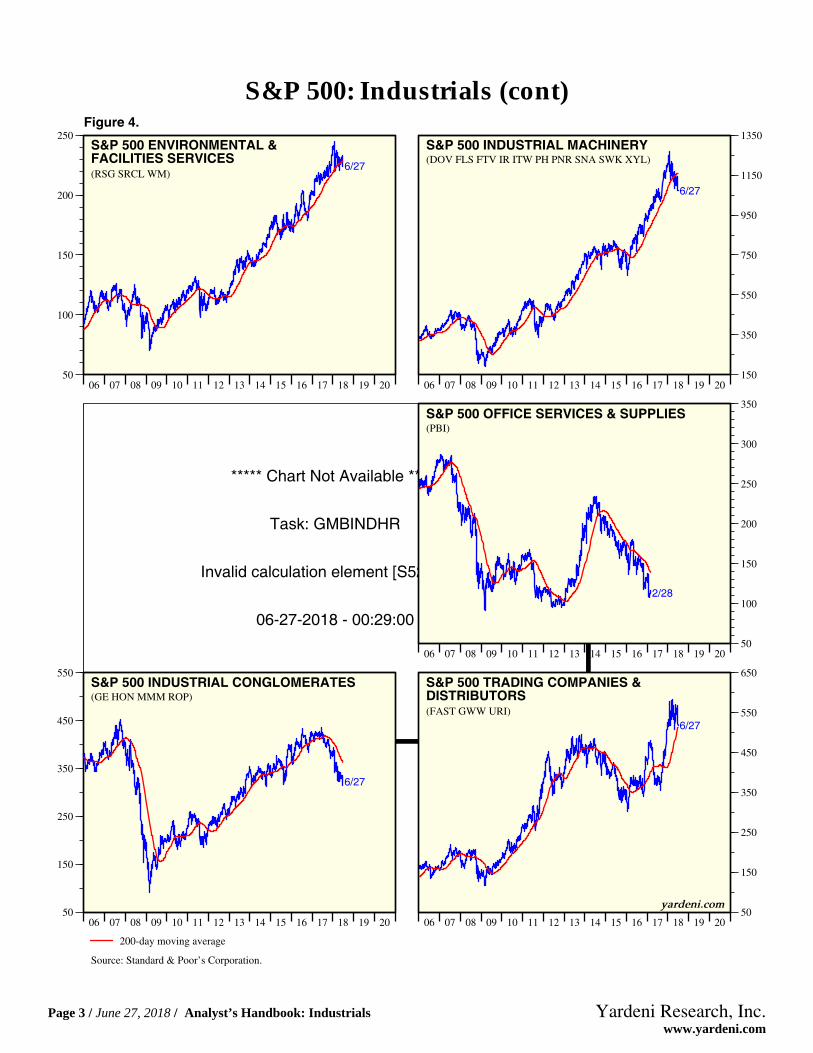
Figure 4.
06 07 08 09 10 11 12 13 14 15 16 17 18 19 2050
100
150
200
250
6/27
S&P 500 ENVIRONMENTAL &FACILITIES SERVICES(RSG SRCL WM)
06 07 08 09 10 11 12 13 14 15 16 17 18 19 20150
350
550
750
950
1150
1350
6/27
S&P 500 INDUSTRIAL MACHINERY(DOV FLS FTV IR ITW PH PNR SNA SWK XYL)
***** Chart Not Available *****
Task: GMBINDHR
Invalid calculation element [S5202AD]
06-27-2018 - 00:29:00
06 07 08 09 10 11 12 13 14 15 16 17 18 19 2050
100
150
200
250
300
350
2/28
S&P 500 OFFICE SERVICES & SUPPLIES(PBI)
06 07 08 09 10 11 12 13 14 15 16 17 18 19 2050
150
250
350
450
550
6/27
S&P 500 INDUSTRIAL CONGLOMERATES(GE HON MMM ROP)
200-day moving average
Source: Standard & Poor’s Corporation.
06 07 08 09 10 11 12 13 14 15 16 17 18 19 2050
150
250
350
450
550
650
6/27
yardeni.com
S&P 500 TRADING COMPANIES &DISTRIBUTORS(FAST GWW URI)
S&P 500: Industrials (cont)
Page 3 / June 27, 2018 / Analyst’s Handbook: Industrials www.yardeni.com
Yardeni Research, Inc.

Figure 5.
06 07 08 09 10 11 12 13 14 15 16 17 18 19 20100
150
200
250
300
350
400
450
500
550
600
650
700
750
800
6/27
S&P 500 TRANSPORTATION INDEX
06 07 08 09 10 11 12 13 14 15 16 17 18 19 200
50
100
150
200
250
300
350
400
450
6/27
S&P 500 AIRLINES(AAL ALK DAL LUV UAL)
06 07 08 09 10 11 12 13 14 15 16 17 18 19 20150
200
250
300
350
400
450
500
550
600
650
700
750
800
850
900
6/27
S&P 500 AIR FREIGHT & LOGISTICS(CHRW EXPD FDX UPS)
200-day moving average
Source: Standard & Poor’s Corporation.
06 07 08 09 10 11 12 13 14 15 16 17 18 19 20100200300400500600700800900100011001200130014001500160017001800
6/27
yardeni.com
S&P 500 RAILROADS(CSX KSU NSC UNP)
S&P 500: Industrials (cont)
Page 4 / June 27, 2018 / Analyst’s Handbook: Industrials www.yardeni.com
Yardeni Research, Inc.

Jan Feb Mar Apr May Jun Jul Aug Sep2018
-15
-5
5
15
25
35
45
1.0
Figure 5.S&P 500 LargeCap
All Sectors
Jan Feb Mar Apr May Jun Jul Aug Sep2018
-15
-5
5
15
25
35
45
2.2
S&P 400 MidCap
Jan Feb Mar Apr May Jun Jul Aug Sep2018
-15
-5
5
15
25
35
45
8.7
S&P 600 SmallCap
Jan Feb Mar Apr May Jun Jul Aug Sep2018
-25-15
-55
15253545
-5.9
IndustrialsSector
Jan Feb Mar Apr May Jun Jul Aug Sep2018
-25-15
-55
15253545
-4.3
Jan Feb Mar Apr May Jun Jul Aug Sep2018
-25-15
-55
15253545
4.4
Jan Feb Mar Apr May Jun Jul Aug Sep2018
-25-15
-55
152535455565
1.1
Aerospace &Defense
Jan Feb Mar Apr May Jun Jul Aug Sep2018
-25-15
-55
152535455565
-.2
Jan Feb Mar Apr May Jun Jul Aug Sep2018
-25-15
-55
152535455565
7.0
Jan Feb Mar Apr May Jun Jul Aug Sep2018
-20-10
01020304050
-7.0
Air Freight &Logistics
Jan Feb Mar Apr May Jun Jul Aug Sep2018
-30-20-10
010203040
6.2
Jan Feb Mar Apr May Jun Jul Aug Sep2018
-40-20
020406080
100
-16.0
Airlines
Jan Feb Mar Apr May Jun Jul Aug Sep2018
-40-20
020406080
100
-15.3
Jan Feb Mar Apr May Jun Jul Aug Sep2018
-40-20
020406080
100
-7.2
Jan Feb Mar Apr May Jun Jul Aug Sep2018
-30
-10
10
30
50
70
-12.0
BuildingProducts
CommercialPrinting
Jan Feb Mar Apr May Jun Jul Aug Sep2018
-30
-10
10
30
50
70
-1.7
Jan Feb Mar Apr May Jun Jul Aug Sep2018
-40
-30
-20
-10
0
10
CommercialPrinting
Jan Feb Mar Apr May Jun Jul Aug Sep2018
-100
-60
-20
20
60
100
140
-13.4
Jan Feb Mar Apr May Jun Jul Aug Sep2018
-100
-60
-20
20
60
100
140
-7.3
Jan Feb Mar Apr May Jun Jul Aug Sep2018
-40
-20
0
20
40
-7.6
Construction &Engineering
Jan Feb Mar Apr May Jun Jul Aug Sep2018
-40
-20
0
20
40
-10.1
Jan Feb Mar Apr May Jun Jul Aug Sep2018
-40
-20
0
20
40
60
2.9
Jan Feb Mar Apr May Jun Jul Aug Sep2018
-50
-30
-10
10
30
50
-16.3
ConstructionMachinery &Heavy Trucks
Jan Feb Mar Apr May Jun Jul Aug Sep2018
-50
-30
-10
10
30
50
-5.9
Jan Feb Mar Apr May Jun Jul Aug Sep2018
-50
-30
-10
10
30
50
-5.1
Jan Feb Mar Apr May Jun Jul Aug Sep2018
-30
-10
10
30
50
18.3DiversifiedSupportServices
Jan Feb Mar Apr May Jun Jul Aug Sep2018
-30
-10
10
30
50
70
13.7
Jan Feb Mar Apr May Jun Jul Aug Sep2018
-30
-10
10
30
50
70
11.7
Jan Feb Mar Apr May Jun Jul Aug Sep2018
-25-15
-55
1525354555
-7.1
ElectricalComponents& Equipment
Source: Standard & Poor’s.
Jan Feb Mar Apr May Jun Jul Aug Sep2018
-25-15
-55
1525354555
-7.1
Jan Feb Mar Apr May Jun Jul Aug Sep2018
-35-25-15
-55
1525354555
10.1
yardeni.com
S&P 500/400/600 Industrials YTD
Page 5 / June 27, 2018 / Analyst’s Handbook: Industrials www.yardeni.com
Yardeni Research, Inc.

Jan Feb Mar Apr May Jun Jul Aug Sep2018
-50
-30
-10
10
30
50
-4.9
Figure 6.S&P 500 LargeCap
Environmental& FacilitiesServices
Jan Feb Mar Apr May Jun Jul Aug Sep2018
-20
0
20
40
60
6.7
S&P 400 MidCap
Jan Feb Mar Apr May Jun Jul Aug Sep2018
-20
0
20
40
60
7.4
S&P 600 SmallCap
Jan Feb Mar Apr May Jun Jul Aug Sep2018
-40-20
020406080
100120140
24.1
Human Resource& EmploymentServices
Jan Feb Mar Apr May Jun Jul Aug Sep2018
-40-20
020406080
100120140
-26.8Jan Feb Mar Apr May Jun Jul Aug Sep
2018
-40-20
020406080
100120140
22.2
Jan Feb Mar Apr May Jun Jul Aug Sep2018
-20
-10
0
10
20
30
40
-14.0
IndustrialConglomerates
Jan Feb Mar Apr May Jun Jul Aug Sep2018
-20
-10
0
10
20
30
40
-5.5
Jan Feb Mar Apr May Jun Jul Aug Sep2018
-20
0
20
40
60
12.8
Jan Feb Mar Apr May Jun Jul Aug Sep2018
-20-10
01020304050
-11.1
IndustrialMachinery
Office Services& Supplies
Jan Feb Mar Apr May Jun Jul Aug Sep2018
-30-20-10
01020304050
-5.7
Jan Feb Mar Apr May Jun Jul Aug Sep2018
-20-10
01020304050
-1.4
Jan Feb Mar Apr May Jun Jul Aug Sep2017
-40-20
020406080
100120
Office Services& Supplies
Jan Feb Mar Apr May Jun Jul Aug Sep2018
-40-20
020406080
100120
-3.8
Jan Feb Mar Apr May Jun Jul Aug Sep2018
-40-20
020406080
100120
1.3
Jan Feb Mar Apr May Jun Jul Aug Sep2018
-40-30-20-10
01020304050
6.6Railroads
Jan Feb Mar Apr May Jun Jul Aug Sep2018
-30-20-10
010203040
-.7
TradingCompanies &Distributors
Source: Standard & Poor’s.
Jan Feb Mar Apr May Jun Jul Aug Sep2018
-30-20-10
010203040
1.4
Jan Feb Mar Apr May Jun Jul Aug Sep2018
-30-20-10
010203040
13.7
yardeni.com
S&P 500/400/600 Industrials YTD
Page 6 / June 27, 2018 / Analyst’s Handbook: Industrials www.yardeni.com
Yardeni Research, Inc.

1995 1996 1997 1998 1999 2000 2001 2002 2003 2004 2005 2006 2007 2008 2009 2010 2011 2012 2013 2014 2015 2016 2017 2018 20198
15
22
29
36
43
8
15
22
29
36
43
17 18
19 6/21
yardeni.com
* Time-weighted average of consensus estimates for current year and next year. Monthly through December 2005, then weekly.Source: Thomson Reuters I/B/E/S.
S&P 500 INDUSTRIALS OPERATING EARNINGS PER SHARE(analysts’ average forecasts, ratio scale)
Consensus ForecastsAnnual estimates
Forward earnings*
Figure 8.
1995 1996 1997 1998 1999 2000 2001 2002 2003 2004 2005 2006 2007 2008 2009 2010 2011 2012 2013 2014 2015 2016 2017 2018 2019-50
-40
-30
-20
-10
0
10
20
30
40
-50
-40
-30
-20
-10
0
10
20
30
40
NERI Apr 17.8 May 12.1 Jun 9.7
Jun
yardeni.com
* Three-month moving average of the number of forward earnings estimates up less number of estimates down, expressed as a percentageof the total number of forward earnings estimates.Source: Thomson Reuters I/B/E/S.
S&P 500 INDUSTRIALS NET EARNINGS REVISIONS*
Figure 9.
Earnings
Page 7 / June 27, 2018 / Analyst’s Handbook: Industrials www.yardeni.com
Yardeni Research, Inc.

2004 2005 2006 2007 2008 2009 2010 2011 2012 2013 2014 2015 2016 2017 2018 2019175
225
275
325
375
425
175
225
275
325
375
425
17
18
196/21
yardeni.com
* Time-weighted average of consensus estimates for current year and next year. Monthly through December 2005, then weekly.Source: Thomson Reuters I/B/E/S.
S&P 500 INDUSTRIALS REVENUES PER SHARE(analysts’ average forecasts, ratio scale)
Consensus ForecastsAnnual estimates
Forward revenues*
Figure 10.
2004 2005 2006 2007 2008 2009 2010 2011 2012 2013 2014 2015 2016 2017 2018 20196
7
8
9
10
11
6
7
8
9
10
11
17
1819
6/21
yardeni.com
(using analysts’ average earnings and revenues forecasts)
* Time-weighted average of the consensus estimates for current year and next year. Monthly through December 2005, weekly thereafter.Source: Thomson Reuters I/B/E/S.
S&P 500 INDUSTRIALS PROJECTED PROFIT MARGIN
Consensus ForecastsAnnual estimates
Forward profit margin* (10.1)
Figure 11.
Revenues & Margins
Page 8 / June 27, 2018 / Analyst’s Handbook: Industrials www.yardeni.com
Yardeni Research, Inc.

1995 1996 1997 1998 1999 2000 2001 2002 2003 2004 2005 2006 2007 2008 2009 2010 2011 2012 2013 2014 2015 2016 2017 2018 2019-20
-15
-10
-5
0
5
10
15
20
25
-20
-15
-10
-5
0
5
10
15
20
25
6/21
yardeni.com
* STEG: 12- month (52-week) forward consensus expected earnings growth. LTEG: 5-year forward consensus expected earnings growth. Monthly datathrough 2005, then weekly.Source: Thomson Reuters I/B/E/S.
S&P 500 INDUSTRIALS LTEG VS STEG(percent)
LTEG* (15.3)
STEG* (15.4)
Figure 12.
5
10
15
20
25
5
10
15
20
25
6/21
1995 1996 1997 1998 1999 2000 2001 2002 2003 2004 2005 2006 2007 2008 2009 2010 2011 2012 2013 2014 2015 2016 2017 2018 2019.50
.75
1.00
1.25
1.50
1.75
2.00
2.25
.50
.75
1.00
1.25
1.50
1.75
2.00
2.25
6/21
yardeni.com
* Price divided by 12-month forward consensus expected operating earnings per share.** Sector or industry forward P/E relative to S&P 500 forward P/E.
*** Sector or industry forward P/E relative to sector or industry consensus 5-year LTEG forecast.Source: Thomson Reuters I/B/E/S.
S&P 500 INDUSTRIALS VALUATION
Forward P/E* (16.0)
Relative P/E** (1.0)PEG Ratio*** (1.0)
Figure 13.
Earnings Growth & Valuation
Page 9 / June 27, 2018 / Analyst’s Handbook: Industrials www.yardeni.com
Yardeni Research, Inc.

http://blog.yardeni.com
http://blog.yardeni.com
Copyright (c) Yardeni Research, Inc. 2018. All rights reserved. The informationcontained herein has been obtained from sources believed to be reliable, but is notnecessarily complete and its accuracy cannot be guaranteed. No representation orwarranty, express or implied, is made as to the fairness, accuracy, completeness, orcorrectness of the information and opinions contained herein. The views and the otherinformation provided are subject to change without notice. All reports posted onwww.yardeni.com, blog.yardeni.com, and YRI’s Apps for iPads and iPhones are issuedwithout regard to the specific investment objectives, financial situation, or particular needsof any specific recipient and are not to be construed as a solicitation or an offer to buy or sellany securities or related financial instruments. Past performance is not necessarily a guideto future results. Company fundamentals and earnings may be mentioned occasionally, butshould not be construed as a recommendation to buy, sell, or hold the company’s stock.Predictions, forecasts, and estimates for any and all markets should not be construed asrecommendations to buy, sell, or hold any security--including mutual funds, futurescontracts, and exchange traded funds, or any similar instruments.
The text, images, and other materials contained or displayed on any Yardeni Research, Inc.product, service, report, email or website are proprietary to Yardeni Research, Inc. andconstitute valuable intellectual property. No material from any part of www.yardeni.com, blog.yardeni.com, and YRI’s Apps for iPads and iPhones may be downloaded, transmitted,broadcast, transferred, assigned, reproduced or in any other way used or otherwisedisseminated in any form to any person or entity, without the explicit written consent ofYardeni Research, Inc. All unauthorized reproduction or other use of material from YardeniResearch, Inc. shall be deemed willful infringement(s) of this copyright and other proprietaryand intellectual property rights, including but not limited to, rights of privacy. YardeniResearch, Inc. expressly reserves all rights in connection with its intellectual property,including without limitation the right to block the transfer of its products and services and/orto track usage thereof, through electronic tracking technology, and all other lawful means,now known or hereafter devised. Yardeni Research, Inc. reserves the right, without furthernotice, to pursue to the fullest extent allowed by the law any and all criminal and civilremedies for the violation of its rights.
The recipient should check any email and any attachments for the presence of viruses.Yardeni Research, Inc. accepts no liability for any damage caused by any virus transmittedby this company’s emails, website, blog and Apps. Additional information available onrequest.