annual financial statements for personal use only · michael charles (mike) young bsc (hon),...
TRANSCRIPT

BC Iron LimitedACN 120 646 924
ANNuAL FINANCIAL StAtemeNtS
2011
For
per
sona
l use
onl
y
BC Iron Limited 2 Annual Report 2011 – Financials
DIreCtorS’ reportfor the year ended 30 June 2011
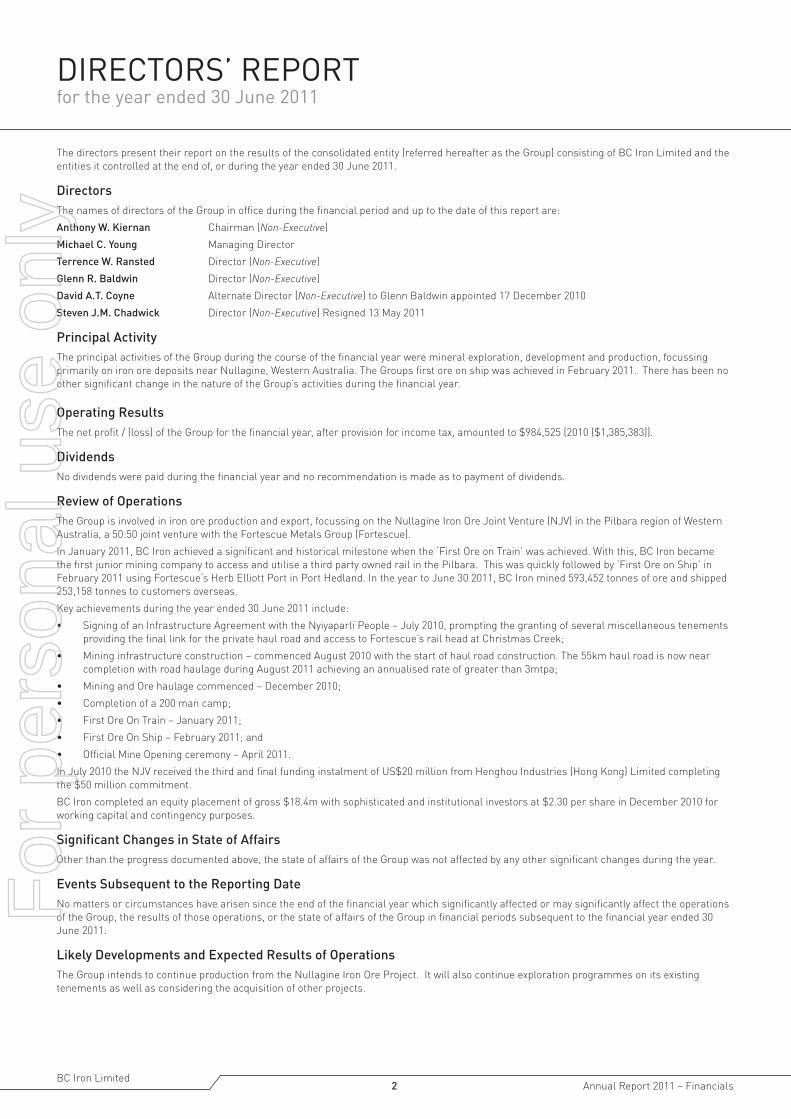
The directors present their report on the results of the consolidated entity (referred hereafter as the Group) consisting of BC Iron Limited and the entities it controlled at the end of, or during the year ended 30 June 2011.
DirectorsThe names of directors of the Group in office during the financial period and up to the date of this report are:
Anthony W. Kiernan Chairman (Non-Executive)
Michael C. Young Managing Director
Terrence W. Ransted Director (Non-Executive)
Glenn R. Baldwin Director (Non-Executive)
David A.T. Coyne Alternate Director (Non-Executive) to Glenn Baldwin appointed 17 December 2010
Steven J.M. Chadwick Director (Non-Executive) Resigned 13 May 2011
Principal ActivityThe principal activities of the Group during the course of the financial year were mineral exploration, development and production, focussing primarily on iron ore deposits near Nullagine, Western Australia. The Groups first ore on ship was achieved in February 2011. There has been no other significant change in the nature of the Group’s activities during the financial year.
Operating ResultsThe net profit / (loss) of the Group for the financial year, after provision for income tax, amounted to $984,525 (2010 ($1,385,383)).
DividendsNo dividends were paid during the financial year and no recommendation is made as to payment of dividends.
Review of OperationsThe Group is involved in iron ore production and export, focussing on the Nullagine Iron Ore Joint Venture (NJV) in the Pilbara region of Western Australia, a 50:50 joint venture with the Fortescue Metals Group (Fortescue).
In January 2011, BC Iron achieved a significant and historical milestone when the ‘First Ore on Train’ was achieved. With this, BC Iron became the first junior mining company to access and utilise a third party owned rail in the Pilbara. This was quickly followed by ‘First Ore on Ship’ in February 2011 using Fortescue’s Herb Elliott Port in Port Hedland. In the year to June 30 2011, BC Iron mined 593,452 tonnes of ore and shipped 253,158 tonnes to customers overseas.
Key achievements during the year ended 30 June 2011 include:
• Signing of an Infrastructure Agreement with the Nyiyaparli People – July 2010, prompting the granting of several miscellaneous tenements providing the final link for the private haul road and access to Fortescue’s rail head at Christmas Creek;
• Mining infrastructure construction – commenced August 2010 with the start of haul road construction. The 55km haul road is now near completion with road haulage during August 2011 achieving an annualised rate of greater than 3mtpa;
• Mining and Ore haulage commenced – December 2010;
• Completion of a 200 man camp;
• First Ore On Train – January 2011;
• First Ore On Ship – February 2011; and
• Official Mine Opening ceremony – April 2011.
In July 2010 the NJV received the third and final funding instalment of US$20 million from Henghou Industries (Hong Kong) Limited completing the $50 million commitment.
BC Iron completed an equity placement of gross $18.4m with sophisticated and institutional investors at $2.30 per share in December 2010 for working capital and contingency purposes.
Significant Changes in State of AffairsOther than the progress documented above, the state of affairs of the Group was not affected by any other significant changes during the year.
Events Subsequent to the Reporting DateNo matters or circumstances have arisen since the end of the financial year which significantly affected or may significantly affect the operations of the Group, the results of those operations, or the state of affairs of the Group in financial periods subsequent to the financial year ended 30 June 2011.
Likely Developments and Expected Results of OperationsThe Group intends to continue production from the Nullagine Iron Ore Project. It will also continue exploration programmes on its existing tenements as well as considering the acquisition of other projects.
For
per
sona
l use
onl
y

BC Iron Limited – Financials 3 Annual Report 2011
DIreCtorS’ reportfor the year ended 30 June 2011 continued
Environmental IssuesThe Group is subject to environmental regulation in respect to its mineral tenements relating to exploration and development activity on those tenements. No breaches of any environmental restrictions were recorded during the financial year.
The Group is subject to the Energy Efficiency Opportunities Act 2006 and the National Greenhouse and Energy Reporting Act 2007. The Group has adequate systems in place to ensure compliance with its reporting requirements.
DIRECTORS’ QUALIFICATIONS, EXPERIENCE AND SPECIAL RESPONSIBILITIES
Mr Anthony William (Tony) Kiernan LL.B
Chairman (Non-Executive)
Mr Kiernan, formerly a solicitor, has extensive experience in the management and operation of listed public companies. He is Chairman of ASX listed Uranium Equities Limited as well as Venturex Resources (since July 2010) and is a director of Chalice Gold Mines Ltd (since February 2007) and Liontown Resources Ltd (since November 2006).
Mr Kiernan has not been a director of any other ASX listed companies during the past three years other than North Queensland Metals Ltd (from January 2007 to July 2008).
Mr Kiernan is a member of the Audit, Remuneration and Diversity Committees.
Michael Charles (Mike) Young BSc (Hon), MAusIMM, MAIG, MSEG
Managing Director
Mr Young is a Geologist and a graduate of Queens University, Canada with a Bachelor of Science (Honours) degree in Geological Sciences (1985). Mr Young immigrated to Australia in 1987 and began working in gold exploration in Southern Cross and Leonora, WA. From 1991, he worked for Dominion Mining Limited concentrating on near-mine exploration and resource development work. He then moved onto work with Mining and Resource Technology/Golder Associates from 1994 to 2003 where he carried out resource modeling and feasibility work on a wide variety of deposits and commodities. These included Century Zinc in Queensland, Escondida Copper in Chile, and Koolyanobbing iron mine in Western Australia. In 2003, he joined Cazaly Resources as Exploration Manager and he was a founding director of Bannerman Resources Limited (February 2005 to April 2006). He is a member of the Australian Institute of Geoscientists, the Australasian Institute of Mining and Metallurgy (CP) and is a councillor of the Association of Mining and Exploration Companies (AMEC). He is also the Co-Patron of the St Bartholomew’s House Foundation.
Mr Young has been a director of Warratah Resources Limited since February 2011. Mr Young has not been a director of any other ASX listed companies during the past three years.
Mr Young is a member of the Risk Management and Diversity Committees.
Mr Terrence William (Terry) Ransted B. (App) Sc, MAusIMM, MGSA
Director (Non-Executive)
Mr Ransted is a geologist and a graduate of the Western Australian Institute of Technology with a Bachelor of Applied Science Degree and has 31 years experience in the mining industry. Mr Ransted commenced his career with Hamersley Exploration Pty Limited exploring for bedded iron ore deposits in the Hamersley region and in the early 1990’s was responsible for the onsite management of the drilling, metallurgical sampling, and geological assessment and interpretation for the Yandicoogina Pisolite and Marandoo Iron Ore Projects for Hamersley Iron Pty Ltd. Mr Ransted is Chief Geologist for Alkane Resources Ltd, managing the geological aspects of the exploration and development programs in New South Wales.
Mr Ransted was a non-executive Director of Northern Star Resources Ltd until 4 September 2009. Mr Ransted has not been a director of any other ASX listed companies during the past three years.
Mr Ransted is a member of the Audit, Risk Management and Remuneration Committees.
Mr Glenn Richard Baldwin BEng (Hons)
Director (Non-Executive)
Mr Baldwin is the Chief Executive Officer of Consolidated Minerals Limited, a leading manganese ore producer and also BC Iron’s largest shareholder (25%). Prior to joining Consolidated Minerals Limited, Mr Baldwin was an Executive Vice President of Gold Fields Limited from 2007, based in Johannesburg and then Perth. Mr Baldwin has approximately 20 years’ experience in the mining industry holding a variety of technical, senior and executive management positions including two previous roles as Chief Operating Officer. He has also spent part of his career in a Project Finance role with an international bank based in South Africa.
Mr Baldwin has not been a director of any other ASX listed companies during the past three years.
Mr David Allan Thomas Coyne BCom, CPA and MAICD
Alternate Director (Non-Executive) to Mr Glenn Baldwin
Mr Coyne has approximately 20 years commercial, financial and accounting experience in mining, oil & gas and steel making work both in Australia and South East Asia. He is currently Chief Financial Officer Australia of Consolidated Minerals Limited. Prior to joining Consolidated Minerals, Mr Coyne held the role of General Manager Corporate Finance and Risk at Macmahon Holdings Limited. Previously, Mr Coyne held responsibility for regional and Australasian business development for the Energy and Chemicals business unit for Kellogg Brown & Root Inc.
Mr Coyne has not been a director of any other ASX listed companies during the past three years.
Mr Coyne is a member of the Audit and Remuneration Committees.
For
per
sona
l use
onl
y

BC Iron Limited 4 Annual Report 2011 – Financials
DIreCtorS’ reportfor the year ended 30 June 2011 continued
Mr Steven John Micheil Chadwick BAppSc, MAusIMM
Director (Non-Executive) – Resigned 13 May 2011
Mr Chadwick resigned 13 May 2011. He is the Principal of Spectrum Metallurgical Consultants, a Perth based specialist consultancy business to the minerals industry. He is a metallurgical graduate from the WA School of Mines and has 31 years experience in the mining industry, incorporating technical, operating and management roles in gold and base metals mining and processing. Mr Chadwick served as Executive Technical Director of ASX listed junior gold company Northern Gold NL from August 1995 to October 2005.
Mr Chadwick was a Director of NGM Resources Limited (from January 2010 until October 2010) and is a Director of RMG Ltd (April 2011 to present). Mr Chadwick has not been a director of any other ASX listed companies during the past three years.
Mr Chadwick was a member of the Risk Management Committee.
Mr Morgan Scott Ball B.Com, CA, FFin
Company Secretary
Mr Ball is a Chartered Accountant with over 20 years of Australian and international experience in the resources, logistics and finance industries. He has held various senior finance and commercial roles in a number of significant public companies. Most recently Mr Ball was the CFO and Company Secretary for Indago Resources - a publicly listed exploration company developing the Tusker gold deposit in Tanzania. Prior to this, Mr Ball has held senior commercial roles with WMC Resources, Brambles, P&O and Ernst & Young.
Meetings of DirectorsThe number of meetings held during the year and the number of meetings attended by each director was as follows:
Director Board Meetings Audit Committee Risk Management Committee Remuneration Committee
A B A B A B A B
A Kiernan 12 12 2 2 n/a n/a 1 1
M Young 12 12 n/a n/a 2 2 n/a n/a
S Chadwick 10 10 n/a n/a - - n/a n/a
T Ransted 10 12 2 2 2 2 1 1
D Coyne 6 6 1 1 n/a n/a n/a n/a
G Baldwin 5 12 1 1 n/a n/a 1 1
A – Meetings attendedB – Meetings held whilst a director
Audit CommitteeThe Audit Committee comprises David Coyne, Anthony Kiernan and Terrence Ransted.
Risk Management CommitteeThe Risk Management Committee comprises Terrence Ransted, Michael Young, and Morgan Ball.
Remuneration CommitteeThe Remuneration Committee is made up of David Coyne, Anthony Kiernan and Terrence Ransted.
Diversity CommitteeThe Diversity Committee comprises Anthony Kiernan, Michael Young and Linda Edge.
The Group does not have a nomination committee with the full Board carrying out the functions that would otherwise be dealt with by such a committee. No diversity meetings were held during the year.
Corporate GovernanceIn recognising the need for the highest standards of corporate behaviour and accountability, the directors of BC Iron Limited support and have adhered to the principles of corporate governance and have established a set of policies and manuals for the purpose of managing this governance. The Group’s detailed corporate governance policy statement is contained in the additional Supplementary Information section of the annual report and can be viewed on the Group’s web site at www.bciron.com.au.
Share OptionsAs at the date of this report, there were 9,730,000 options over ordinary shares on issue (10,230,000 at the reporting date). Refer to the Remuneration Report for further details of the options outstanding.
No option holder has any right under the options to participate in any other share issue of the Group or any other entity. None of the existing options are listed on ASX Limited.
For
per
sona
l use
onl
y
BC Iron Limited – Financials 5 Annual Report 2011
DIreCtorS’ reportfor the year ended 30 June 2011 continued
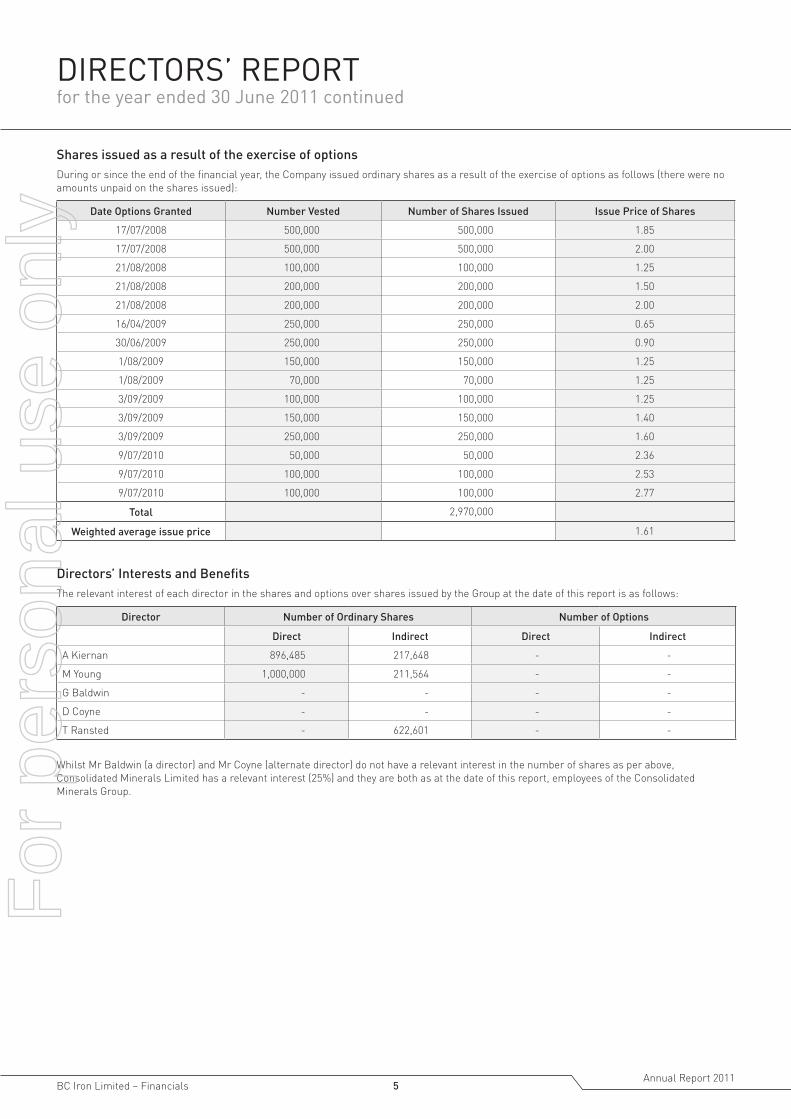
Shares issued as a result of the exercise of optionsDuring or since the end of the financial year, the Company issued ordinary shares as a result of the exercise of options as follows (there were no amounts unpaid on the shares issued):
Date Options Granted Number Vested Number of Shares Issued Issue Price of Shares
17/07/2008 500,000 500,000 1.85
17/07/2008 500,000 500,000 2.00
21/08/2008 100,000 100,000 1.25
21/08/2008 200,000 200,000 1.50
21/08/2008 200,000 200,000 2.00
16/04/2009 250,000 250,000 0.65
30/06/2009 250,000 250,000 0.90
1/08/2009 150,000 150,000 1.25
1/08/2009 70,000 70,000 1.25
3/09/2009 100,000 100,000 1.25
3/09/2009 150,000 150,000 1.40
3/09/2009 250,000 250,000 1.60
9/07/2010 50,000 50,000 2.36
9/07/2010 100,000 100,000 2.53
9/07/2010 100,000 100,000 2.77
Total 2,970,000
Weighted average issue price 1.61
Directors’ Interests and BenefitsThe relevant interest of each director in the shares and options over shares issued by the Group at the date of this report is as follows:
Director Number of Ordinary Shares Number of Options
Direct Indirect Direct Indirect
A Kiernan 896,485 217,648 - -
M Young 1,000,000 211,564 - -
G Baldwin - - - -
D Coyne - - - -
T Ransted - 622,601 - -
Whilst Mr Baldwin (a director) and Mr Coyne (alternate director) do not have a relevant interest in the number of shares as per above, Consolidated Minerals Limited has a relevant interest (25%) and they are both as at the date of this report, employees of the Consolidated Minerals Group.
For
per
sona
l use
onl
y

BC Iron Limited 6 Annual Report 2011 – Financials
DIreCtorS’ reportfor the year ended 30 June 2011 continued
REMUNERATION REPORT The Remuneration Report is set out under the following main headings:
A. Principles used to determine the nature and amount of remuneration
B. Details of remuneration
C. Service agreements
D. Share-based compensation
The information provided in this Remuneration Report has been audited as required by section 308(3C) of the Corporations Act 2001.
A. Principles used to determine the nature and amount of remuneration The objective of the Group’s executive reward framework is to ensure reward for performance is competitive and appropriate for the results delivered. The framework aligns executive reward with achievement of strategic objectives and the creation of value for shareholders.
The Board ensures that executive reward satisfies the following key criteria for good reward corporate governance practices:
- Competitiveness and reasonableness
- Acceptability to shareholders
- Performance linkage/alignment of executive compensation
- Transparency
- Capital management.
The Group has structured an executive remuneration framework that is market competitive and complementary to the reward strategy for the organisation. Further to this, the Group is currently reviewing its Long Term Incentive Plan structure to ensure that the Group remains an “employer of choice” and to better align the remuneration of key personnel with the long term performance of the Group.
Non-executive directors
Fees and payments to non-executive directors reflect the demands which are made on, and the responsibilities of, the directors. Non-executive directors’ fees and payments are reviewed annually by the Board. The Chairman is not present at any discussions relating to determination of his own remuneration.
Directors’ fees
Directors’ fees are determined within an aggregate directors’ fee pool limit, which is periodically recommended for approval by shareholders. The maximum currently stands at $400,000 in aggregate. This amount is separate from any specific tasks the directors or their related entities may take on for the Group. Directors’ remuneration is set out below which includes share and option based payments.
The Group has no specific performance based remuneration component currently built into director remuneration packages.
Senior Executives Renumeration
Under the Senior Executive Remuneration Policy the remuneration of senior executives may be comprised of the following:
• fixed salary that is determined from a review of the market and reflects core performance requirements and expectations;
• a short term focussed performance bonus designed to reward actual achievement by the individual of performance objectives and Company performance;
• a longer term focussed plan that may include deferred cash payments and / or participation in equity based schemes with thresholds approved by shareholders; and
• statutory superannuation.
Short term incentives
The Board is responsible for assessing short term incentives for key management personnel. Service agreements may establish short-term incentives against key performance indicators which are assessed by the Board. These key performance indicators will typically be aligned to specific operating and corporate objectives in relation to each financial year.
Cash incentives are determined based on financial years and are payable the following year after the year’s financial results have been audited and approved by the Board.
Long term incentives
Long-term incentives are provided to certain employees at the discretion of the Board. See section D (Share based compensation) for further information.
Group performance
The following table shows the gross revenue, losses and share price of the Group at the end of the respective financial years.
30 June 2011 30 June 2010 30 June 2009 30 June 2008
Revenue from continuing operations $19,087,764 $1,528,290 $402,146 $723,075
Net profit/(loss) $984,525 ($1,385,383) ($1,311,656) ($787,955)
Share price $3.05 $1.62 $1.12 $1.60
No dividends were paid during this period.
For
per
sona
l use
onl
y

BC Iron Limited – Financials 7 Annual Report 2011
DIreCtorS’ reportfor the year ended 30 June 2011 continued
B. Details of remunerationDetails of remuneration of the directors and key management personnel of the Group (as defined by AASB 124 Related Party Disclosures) and executives are set out in the following tables. The key management personnel of the Group include the Directors, the Chief Financial Officer / Company Secretary and the Chief Operating Officer.
Year
Short-term benefitsPost-employment
benefitsShare-based
paymentsTotal
Director's fees or salary
Bonus SuperannuationValue of options
(a)
Directors
Non-Executive
A Kiernan 2011 80,000 - - - 80,000
2010 79,773 - - - 79,773
S Chadwick 2011 34,725 - - - 34,725
2010 36,250 - - - 36,250
G Higgo 2011 - - - - -
2010 25,847 - 2,326 - 28,173
T Ransted 2011 40,000 - - - 40,000
2010 35,000 - - - 35,000
G Baldwin/D Coyne (b) 2011 40,000 - - - 40,000
2010 10,000 - - - 10,000
Executive
M Young 2011 426,360 29,167 16,653 - 472,180
(Managing Director) 2010 350,000 - 31,500 60,405 441,905
Total Directors 2011 621,085 29,167 16,653 - 666,904
2010 536,870 - 33,826 60,405 631,100
Executives
S Storm 2011 - - - - -
(CFO, Company Secretary) 2010 35,693 - - 180,146 215,839
B Duncan 2011 313,055 22,917 30,237 1,546 367,755
(Chief Operations Officer) 2010 283,750 - 24,771 19,536 328,056
M Ball 2011 299,398 21,875 28,915 68,450 418,638
(CFO, Company Secretary) 2010 181,808 - 16,363 176,553 374,724
Total Executives 2011 612,453 44,792 59,152 69,996 786,393
2010 501,251 - 41,134 376,235 918,619
(a) The share-based payments referred to above comprise options over ordinary shares in the Group and have been valued based on the Black Scholes option pricing model.
(b) The amounts noted above were paid directly to Consolidated Minerals Pty Ltd. Mr Baldwin is the Chief Executive Officer of Consolidated Minerals Ltd, the ultimate parent entity of Consolidated Minerals Pty Ltd. Mr Baldwin is an employee of Consolidated Minerals, as is Mr Coyne as his alternate.
C. Service Agreements
Mr Michael Young (Managing Director)Term of Agreement - 2 years commencing 1 July 2009.Agreement - Base salary, inclusive of statutory superannuation of $443,013 to be reviewed annually on 31 December (or such other times as agreed).Termination – The Group has the right to terminate the Agreement upon three months notice.
Mr Blair Duncan (Chief Operations Officer)Term of Agreement - Unspecified.Agreement - Base salary, inclusive of statutory superannuation of $343,292 to be reviewed annually on 31 December (or such other times as agreed). Termination – The Group has the right to terminate the Agreement upon three months notice.
Mr Morgan Ball (CFO, Company Secretary)Term of Agreement - Unspecified.Agreement - Base salary, inclusive of statutory superannuation of $328,313 to be reviewed annually on 31 December (or such other times as agreed). Termination – The Group has the right to terminate the Agreement upon six months notice.
For
per
sona
l use
onl
y
BC Iron Limited 8 Annual Report 2011 – Financials
DIreCtorS’ reportfor the year ended 30 June 2011 continued
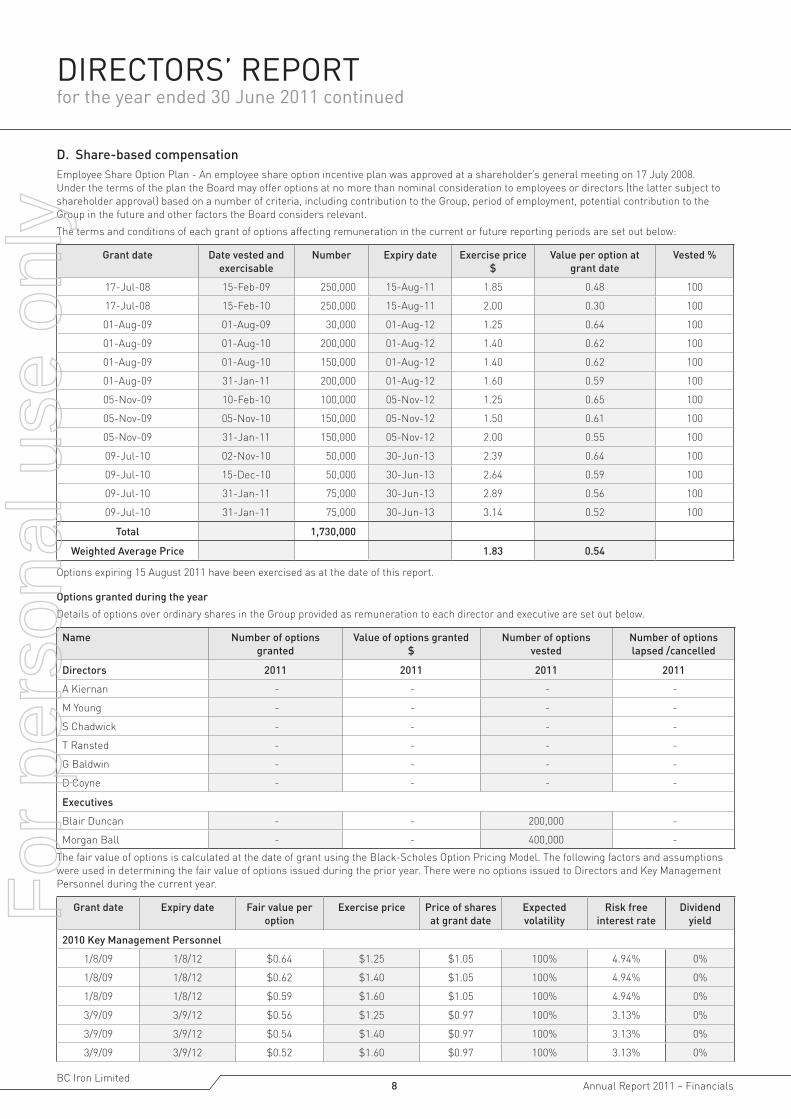
D. Share-based compensationEmployee Share Option Plan - An employee share option incentive plan was approved at a shareholder’s general meeting on 17 July 2008. Under the terms of the plan the Board may offer options at no more than nominal consideration to employees or directors (the latter subject to shareholder approval) based on a number of criteria, including contribution to the Group, period of employment, potential contribution to the Group in the future and other factors the Board considers relevant.
The terms and conditions of each grant of options affecting remuneration in the current or future reporting periods are set out below:
Grant date Date vested and exercisable
Number Expiry date Exercise price $
Value per option at grant date
Vested %
17-Jul-08 15-Feb-09 250,000 15-Aug-11 1.85 0.48 100
17-Jul-08 15-Feb-10 250,000 15-Aug-11 2.00 0.30 100
01-Aug-09 01-Aug-09 30,000 01-Aug-12 1.25 0.64 100
01-Aug-09 01-Aug-10 200,000 01-Aug-12 1.40 0.62 100
01-Aug-09 01-Aug-10 150,000 01-Aug-12 1.40 0.62 100
01-Aug-09 31-Jan-11 200,000 01-Aug-12 1.60 0.59 100
05-Nov-09 10-Feb-10 100,000 05-Nov-12 1.25 0.65 100
05-Nov-09 05-Nov-10 150,000 05-Nov-12 1.50 0.61 100
05-Nov-09 31-Jan-11 150,000 05-Nov-12 2.00 0.55 100
09-Jul-10 02-Nov-10 50,000 30-Jun-13 2.39 0.64 100
09-Jul-10 15-Dec-10 50,000 30-Jun-13 2.64 0.59 100
09-Jul-10 31-Jan-11 75,000 30-Jun-13 2.89 0.56 100
09-Jul-10 31-Jan-11 75,000 30-Jun-13 3.14 0.52 100
Total 1,730,000
Weighted Average Price 1.83 0.54
Options expiring 15 August 2011 have been exercised as at the date of this report.
Options granted during the year
Details of options over ordinary shares in the Group provided as remuneration to each director and executive are set out below.
Name Number of options granted
Value of options granted $
Number of options vested
Number of options lapsed /cancelled
Directors 2011 2011 2011 2011
A Kiernan - - - -
M Young - - - -
S Chadwick - - - -
T Ransted - - - -
G Baldwin - - - -
D Coyne - - - -
Executives
Blair Duncan - - 200,000 -
Morgan Ball - - 400,000 -
The fair value of options is calculated at the date of grant using the Black-Scholes Option Pricing Model. The following factors and assumptions were used in determining the fair value of options issued during the prior year. There were no options issued to Directors and Key Management Personnel during the current year.
Grant date Expiry date Fair value per option
Exercise price Price of shares at grant date
Expected volatility
Risk free interest rate
Dividend yield
2010 Key Management Personnel
1/8/09 1/8/12 $0.64 $1.25 $1.05 100% 4.94% 0%
1/8/09 1/8/12 $0.62 $1.40 $1.05 100% 4.94% 0%
1/8/09 1/8/12 $0.59 $1.60 $1.05 100% 4.94% 0%
3/9/09 3/9/12 $0.56 $1.25 $0.97 100% 3.13% 0%
3/9/09 3/9/12 $0.54 $1.40 $0.97 100% 3.13% 0%
3/9/09 3/9/12 $0.52 $1.60 $0.97 100% 3.13% 0%
For
per
sona
l use
onl
y

BC Iron Limited – Financials 9 Annual Report 2011
DIreCtorS’ reportfor the year ended 30 June 2011 continued
Details of remuneration: Options
Employee options generally vest and are expensed over the period from the date of grant. The maximum value of options yet to vest has been determined as the amount of the grant date fair value of the options that is yet to be expensed. Vesting criteria relates only to service periods.
Year granted
Vested %
Unvested %
Forfeited %
Financial years in which options
may vest
Minimum total value of grant
yet to vest
Maximum total value of grant yet
to vest
Directors
M Young 2011 - - - - - - -
2010 2009 100% - - 2010 - -
Executives
S Storm 2011 2010 3% - - 2011 - -
2010 2010 57% 3% 40% 2010-2012 - -
B Duncan 2011 2009 3% - - 2011 - -
2010 2009 97% 3% - 2010-2011 - -
M Ball 2011 2010 26% - - 2011 - -
2010 2010 74% 26% - 2010-2012 - -
Further details relating to options are set out below:
A Remuneration consisting of
options
B Value at reporting date
$
Directors
M Young 2011 - -
2010 13.7% 60,405
Specified Executives
S Storm 2011 - -
2010 84.0% 180,146
B Duncan 2011 0.4% 1,546
2010 6.0% 19,536
M Ball 2011 16.4% 68,450
2010 49.0% 176,553
A = The percentage of the value of remuneration consisting of options, based on the value of options expensed during the current yearB = The value at grant date calculated in accordance with AASB 2 Share-based Payment of options granted during the year as part of remuneration
Details regarding options exercised during the year are outlined below. There were no executive options granted during the year.
Date of exercise of options
Number of ordinary shares issued on exercise of options
Value at exercise date $
Directors
M Young 19/11/2010 250,000 127,500
M Young 19/11/2010 250,000 90,000
Specified Executives
B Duncan 3/02/2011 100,000 201,000
B Duncan 3/02/2011 200,000 352,000
B Duncan 3/02/2011 200,000 252,000
M Ball 3/02/2011 100,000 201,000
M Ball 3/02/2011 150,000 279,000
M Ball 3/02/2011 250,000 415,000
1,500,000 1,917,500
End of Audited Remuneration Report
For
per
sona
l use
onl
y

BC Iron Limited 10 Annual Report 2011 – Financials
DIreCtorS’ reportfor the year ended 30 June 2011 continued
Insurance of Officers During the financial period, BC Iron Limited incurred premiums of $25,000 to insure the directors, secretary and/or officers of the Group. The liability insured is the indemnification of the Group against any legal liability to third parties arising out of any Directors or Officers duties in their capacity as a Director or Officer other than indemnification not permitted by law.
No liability has arisen under this indemnity as at the date of this report.
The Group has entered into Indemnity Deeds with each Director (“Officers”). Under the Deeds, the Group indemnifies each Officer to the maximum extent permitted by law against legal proceedings or claims made against or incurred by the Officers in connection with being an Officer of the Group, or breach by the Group of its obligations under the Deed.
AUDIT INDEPENDENCE AND NON-AUDIT SERVICES
Auditor’s Independence Declaration
A copy of the auditor’s independence declaration as required under section 307C of the Corporations Act 2001 is attached to the independent auditors report and forms part of the Director’s Report.
Non-audit services
The board of directors has considered the position and, in accordance with the advice received from the audit committee is satisfied that the provision of non-audit services is compatible with the general standard of independence for auditors imposed by the Corporations Act 2001. The directors are satisfied that the provision of non-audit services by the auditor, as set out below, did not compromise the auditor independence requirements of the Corporations Act 2001 for the following reasons:
• all non-audit services have been reviewed by the audit committee to ensure they do not impact the impartiality and objectivity of the auditor
• none of the services undermine the general principles relating to auditor independence as set out in Code of Conduct APES 110 Code of Ethics for Professional Accountants issued by the Accounting Professional & Ethical Standards Board, including acting in a management or a decision-making capacity for the Group or acting as advocate for the Group.
The following fees for non-audit services were paid/payable to entities connected to the external auditors during the year ended 30 June 2011:
$ Taxation services $44,239
These services were provided by BDO Corporate Tax (WA) Pty Ltd.
This report is made in accordance with a resolution of the directors.
Dated this 7th day of September 2011.
Michael C Young Managing Director
For
per
sona
l use
onl
y

BC Iron Limited – Financials 11 Annual Report 2011
DIreCtorS’ DeCLArAtIoNfor the year ended 30 June 2011
In the opinion of the Directors of BC Iron Limited:
(a) the financial statements comprising the statement of comprehensive income, statement of financial position, statement of cash flows, statement of changes in equity and accompanying notes are in accordance with the Corporations Act 2001 including:
i. giving a true and fair view of the financial position of the Group as at 30 June 2011 and of its performance for the financial year ended 30 June 2011; and
ii complying with Accounting Standards and the Corporations Regulations 2001.
(b) there are reasonable grounds to believe that the Group will be able to pay its debts as and when they become due and payable.
(c) The company has included to the notes to the financial statements an explicit and unreserved statement of compliance with International Financial Reporting Standards.
The directors have been given the declarations by the Managing Director and Chief Financial Officer required by section 295A of the Corporations Act 2001.
This declaration is made in accordance with a resolution of the Directors and is signed on their behalf by:
Michael C Young Managing Director
PERTH, 7th September 2011.
For
per
sona
l use
onl
y
BC Iron Limited 12 Annual Report 2011 – Financials
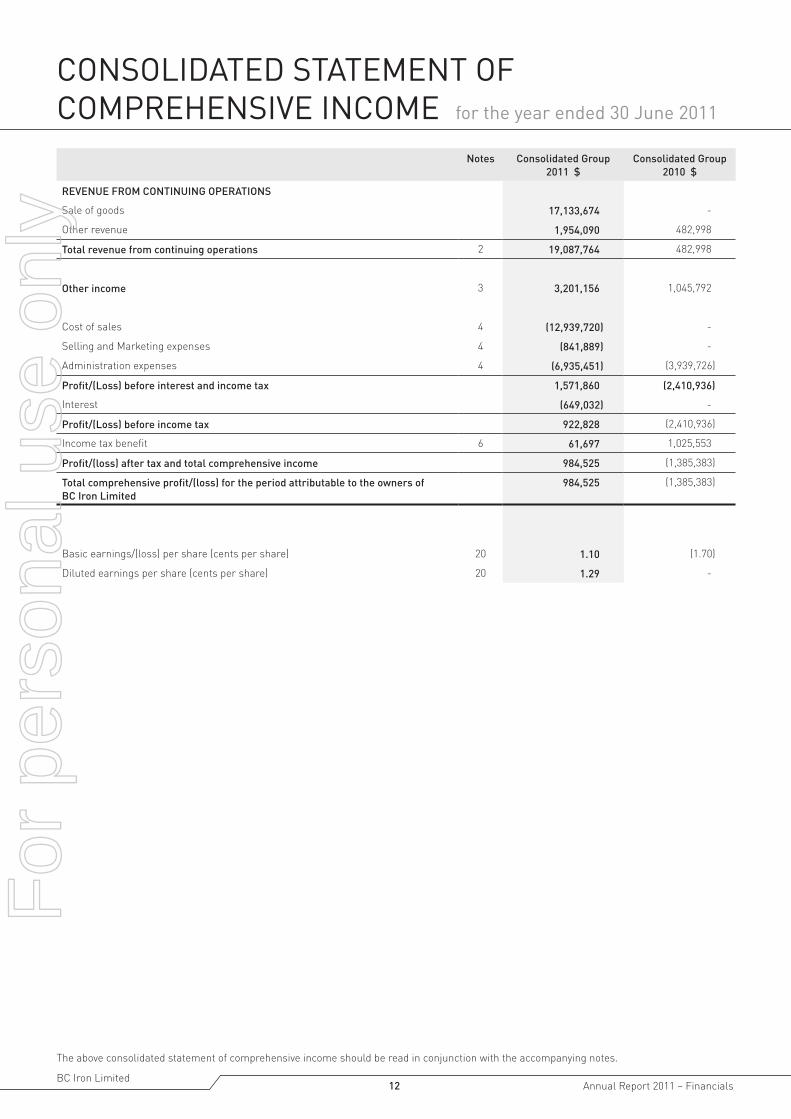
CoNSoLIDAteD StAtemeNt oF CompreheNSIve INCome for the year ended 30 June 2011
The above consolidated statement of comprehensive income should be read in conjunction with the accompanying notes.
Notes Consolidated Group 2011 $
Consolidated Group 2010 $
REVENUE FROM CONTINUING OPERATIONS
Sale of goods 17,133,674 -
Other revenue 1,954,090 482,998
Total revenue from continuing operations 2 19,087,764 482,998
Other income 3 3,201,156 1,045,792
Cost of sales 4 (12,939,720) -
Selling and Marketing expenses 4 (841,889) -
Administration expenses 4 (6,935,451) (3,939,726)
Profit/(Loss) before interest and income tax 1,571,860 (2,410,936)
Interest (649,032) -
Profit/(Loss) before income tax 922,828 (2,410,936)
Income tax benefit 6 61,697 1,025,553
Profit/(loss) after tax and total comprehensive income 984,525 (1,385,383)
Total comprehensive profit/(loss) for the period attributable to the owners of BC Iron Limited
984,525 (1,385,383)
Basic earnings/(loss) per share (cents per share) 20 1.10 (1.70)
Diluted earnings per share (cents per share) 20 1.29 -
For
per
sona
l use
onl
y

BC Iron Limited – Financials 13 Annual Report 2011
CoNSoLIDAteD StAtemeNt oF FINANCIAL poSItIoN for the year ended 30 June 2011
The above consolidated statement of financial position should be read in conjunction with the accompanying notes.
Notes Consolidated Group 2011 $
Consolidated Group 2010 $
CURRENT ASSETS
Cash and cash equivalents 7 17,536,827 28,762,976
Trade and other receivables 8 7,148,015 2,032,700
Inventory 9 9,023,661 1,965,880
Other assets 10 242,765 250,436
Total Current Assets 33,951,268 33,011,991
NON CURRENT ASSETS
Plant & equipment 11 37,409,578 4,117,490
Exploration and evaluation assets 12 4,349,457 3,439,802
Development expenditure 13 24,974,772 12,914,138
Deferred Tax Assets 6 1,608,404 1,331,918
Other assets 14 1,146,500 -
Total Non-Current Assets 69,488,711 21,803,348
TOTAL ASSETS 103,439,979 54,815,339
CURRENT LIABILITIES
Trade and other payables 15 16,131,009 1,739,897
Loans & Borrowings 16 4,512,766 -
Total Current Liabilities 20,643,775 1,739,897
NON-CURRENT LIABILITIES
Loans & Borrowings 16 14,488,235 13,954,966
Provisions 17 920,594 125,000
Total Non-Current Liabilities 15,408,829 14,079,966
TOTAL LIABILITIES 36,052,604 15,819,863
NET ASSETS 67,387,375 38,995,476
EQUITY
Contributed Equity 18 58,250,587 36,518,762
Reserves 19a 12,385,997 6,710,448
Accumulated losses 19b (3,249,209) (4,233,734)
TOTAL EQUITY 67,387,375 38,995,476 For
per
sona
l use
onl
y

BC Iron Limited 14 Annual Report 2011 – Financials
CoNSoLIDAteD StAtemeNt oF ChANgeS IN equIty for the year ended 30 June 2011
The above consolidated statement of changes in equity should be read in conjunction with the accompanying notes.
Contributed Equity $
Accumulated Losses $
Share Based Payments Reserve $
Options Exercised Reserve $ Total $
Consolidated Entity
Balance at 1 July 2009 22,982,385 (2,848,351) 1,303,240 75,680 21,512,954
Profit/(Loss) for the period - (1,385,383) - - (1,385,383)
Total comprehensive loss for the period - (1,385,383) - - (1,385,383)
Transactions with equity holders in their capacity as equity holders
Shares issued net of transaction costs 13,536,377 - - - 13,536,377
Options issued - - 5,331,528 - 5,331,528
Options exercised - - (569,159) 569,159 -
Balance at 30 June 2010 36,518,762 (4,233,734) 6,065,609 644,839 38,995,476
Consolidated Entity
Balance at 1 July 2010 36,518,762 (4,233,734) 6,065,609 644,839 38,995,476
Profit/(Loss) for the period - 984,525 - - 984,525
Total comprehensive profit / loss for the period - 984,525 - - 984,525
Transactions with equity holders in their capacity as equity holders
Shares issued net of transaction costs 17,898,825 - - - 17,898,825
Options issued - - 5,675,549 - 5,675,549
Options exercised 3,833,000 - (1,256,446) 1,256,446 3,833,000
Balance at 30 June 2011 58,250,587 (3,249,208) 10,484,712 1,901,285 67,387,375
For
per
sona
l use
onl
y
BC Iron Limited – Financials 15 Annual Report 2011
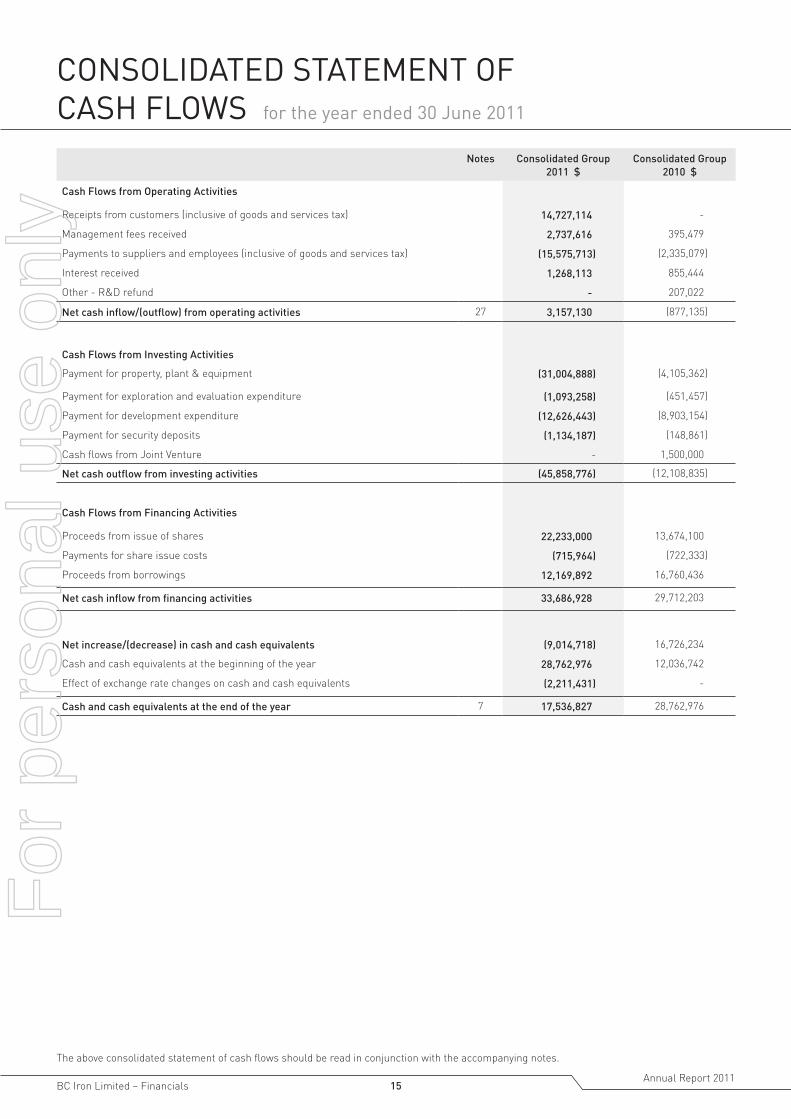
CoNSoLIDAteD StAtemeNt oF CASh FLowS for the year ended 30 June 2011
The above consolidated statement of cash flows should be read in conjunction with the accompanying notes.
Notes Consolidated Group 2011 $
Consolidated Group 2010 $
Cash Flows from Operating Activities
Receipts from customers (inclusive of goods and services tax) 14,727,114 -
Management fees received 2,737,616 395,479
Payments to suppliers and employees (inclusive of goods and services tax) (15,575,713) (2,335,079)
Interest received 1,268,113 855,444
Other - R&D refund - 207,022
Net cash inflow/(outflow) from operating activities 27 3,157,130 (877,135)
Cash Flows from Investing Activities
Payment for property, plant & equipment (31,004,888) (4,105,362)
Payment for exploration and evaluation expenditure (1,093,258) (451,457)
Payment for development expenditure (12,626,443) (8,903,154)
Payment for security deposits (1,134,187) (148,861)
Cash flows from Joint Venture - 1,500,000
Net cash outflow from investing activities (45,858,776) (12,108,835)
Cash Flows from Financing Activities
Proceeds from issue of shares 22,233,000 13,674,100
Payments for share issue costs (715,964) (722,333)
Proceeds from borrowings 12,169,892 16,760,436
Net cash inflow from financing activities 33,686,928 29,712,203
Net increase/(decrease) in cash and cash equivalents (9,014,718) 16,726,234
Cash and cash equivalents at the beginning of the year 28,762,976 12,036,742
Effect of exchange rate changes on cash and cash equivalents (2,211,431) -
Cash and cash equivalents at the end of the year 7 17,536,827 28,762,976
For
per
sona
l use
onl
y

BC Iron Limited 16 Annual Report 2011 – Financials
NoteS to the FINANCIAL StAtemeNtSfor the year ended 30 June 2011
NOTE 1 - STATEMENT OF SIGNIFICANT ACCOUNTING POLICIES
The principal accounting policies adopted in the preparation of the financial statements are set out below.
These policies have been consistently applied to all the years presented, unless otherwise stated. BC Iron Limited is a company limited by shares incorporated in Australia, whose shares are publicly traded on the Australian Securities Exchange.
(a) Basis of Preparation
These general purpose financial statements have been prepared in accordance with Australian Accounting Standards, other authoritative pronouncements of the Australian Accounting Standards Board, Urgent Issues Group Interpretations and the Corporations Act 2001.
Compliance with AIFRS ensures that the historical financial information complies with International Financial Reporting Standards.
All amounts are presented in Australian dollars.
Historical cost convention These financial statements have been prepared under the historical cost convention. Cost is based on the fair values of consideration given in exchange for assets.
(b) Principles of Consolidation
i. SubsidiariesThe consolidated financial statements incorporate the assets and liabilities of all subsidiaries of the Company as at 30 June 2011 and the results of all subsidiaries for the period then ended.
Subsidiaries are all those entities controlled by the Company. Control exists when the Company has the power, directly or indirectly, to govern the financial and operating policies of an entity so as to obtain benefits from its activities. In assessing control, potential voting rights that are presently exercisable or convertible are taken into account. The financial statements of subsidiaries are included in the consolidated financial statements from the date that control commences until the date that control ceases. They are de-consolidated from the date that control ceases.
The purchase method of accounting is used to account for the acquisition of subsidiaries by the Company.
Intra-group balances, and any unrealised income and expenses arising from intra-group transactions, are eliminated in preparing the consolidated financial statements. Accounting policies of subsidiaries are consistent with the parent.
ii. Joint venturesJointly controlled assets
The proportionate interests in the assets, liabilities and expenses of a joint venture operation have been incorporated in the financial statements under the appropriate headings.
Details of the joint venture operations are set out in note 29. Intra-group balances, and any unrealised income and expenses arising from intra-group transactions, are eliminated in preparing the consolidated financial statements.
(c) Segment Reporting
Operating segments are reported in a manner that is consistent with the internal reporting provided to the chief operating decision maker. The chief operating decision maker has been identified as the Board of BC Iron Ltd.
The Group operates only in one operating segment being predominantly in the area of mineral exploration, development and production in the Pilbara region, Western Australia.
(d) Revenue Recognition
Revenue is measured at the fair value of the gross consideration received or receivable. BC Iron recognises revenue when the amount of revenue can be reliably measured, it is probable that future economic benefits will flow to the entity and specific criteria have been met for each of BC Iron’s activities. The amount of revenue is not considered to be reliably measurable until all contingencies relating to the sale have been resolved. BC Iron bases its estimates on historical results, taking into consideration the type of customer, the type of transaction and the specifics of each arrangement.
Sale of goodsRevenue from the sale of goods and disposal of other assets is recognised when persuasive evidence, usually in the form of an executed sales agreement, or an arrangement exists, indicating there has been a transfer of risks and rewards to the customer, no further work or processing is required by the Group, the quantity and quality of the goods has been determined with reasonable accuracy, the price can be reasonably estimated, and collectability is reasonably assured.
BC Iron recognises revenue when the risks and rewards transfers to the buyer which is typically the bill of lading date. The sales agreements allow for an adjustment to the sales price based on a survey of the goods by the customer, therefore the recognition of the sales revenue is based on the most recently determined estimate of product specifications.
Additionally, the sales price is determined on a provisional basis at the date of sale and adjustments to the sales price may subsequently occur depending on movements in quoted market or contractual iron ore prices to the date of final pricing. The date of final pricing is typically when a notice of readiness is received when the vessel has arrived at its final destination. Revenue on provisionally priced sales is recognised based on the estimated fair value of the total consideration receivable.
For
per
sona
l use
onl
y

BC Iron Limited – Financials 17 Annual Report 2011
NoteS to the FINANCIAL StAtemeNtSfor the year ended 30 June 2011 continued
NOTE 1 - STATEMENT OF SIGNIFICANT ACCOUNTING POLICIES (Continued)
traded freightRevenue from freight services is recognised on the bill of lading date of the customer.
other revenueManagement fee income from the joint venture has been recognised based on an agreed % of capitalised expenditure during the development phase followed by an agreed % of expensed expenditure during the operating phase. It is based on an accrual basis.
other IncomeInterest income is recognised on a time proportionate basis using the effective interest method.
(e) Income Tax
The income tax expense or revenue for the financial year is the tax payable on the current financial period’s taxable income based on the national income tax rate, adjusted by changes in deferred tax assets and liabilities attributable to temporary differences and to unused tax losses.
Deferred income tax is provided in full, using the liability method, on temporary differences arising between the tax bases of assets and liabilities and their carrying amounts in the financial statements.
Deferred income tax is determined using tax rates (and laws) that have been enacted or substantially enacted by the statement of financial position date and are expected to apply when the related deferred income tax asset is realised or the deferred income tax liability is settled.
Deferred tax assets are recognised for deductible temporary differences and unused tax losses only if it is probable that future taxable amounts will be available to utilise those temporary differences and losses.
Deferred tax assets and liabilities are offset when there is a legally enforceable right to offset current tax assets and liabilities and when the deferred tax balances relate to the same taxation authority. Current tax assets and liabilities are offset where the entity has a legally enforceable right to offset and intends either to settle on a net basis, or to realise the asset and settle the liability simultaneously.
Current and deferred tax balances attributable to amounts recognised directly in equity are also recognised directly in equity.
(f) Goods and Services Tax (GST)
Revenues, expenses and assets are recognised net of the amount of associated GST, except where the GST incurred is not recoverable from the taxation authority, in which case the GST is recognised as part of the cost of acquisition of the asset or as part of the expense item.
Receivables and payables are stated inclusive of the amount of GST receivable or payable. The net amount of GST recoverable from, or payable to, the taxation authority is included with receivables or payables in the statement of financial position.
Cash flows are included in the Statement of Cash Flows on a gross basis and the GST component of cash flows arising from investing and financing activities, which is recoverable from or payable to the taxation authority are classified as operating cash flows.
Commitments and contingencies are disclosed net of the amount of GST recoverable from or payable to the taxation authority.
(g) Impairment of Assets
Assets are reviewed for impairment at each reporting date or whenever events or changes in circumstances indicate that the carrying amount may not be recoverable. An impairment loss is recognised for the amount by which the asset’s carrying amount exceeds its recoverable amount.
The recoverable amount is the higher of an asset’s fair value less costs to sell and value in use. For the purposes of assessing impairment, assets are grouped at the lowest levels for which there are separately identifiable cash inflows which are largely independent of the cash inflows from other assets or groups of assets (cash-generating units).
Non-financial assets, other than goodwill, that suffered impairment are reviewed for possible reversal of the impairment at each reporting date.
(h) Cash and Cash Equivalents
For statement of cash flows presentation purposes, cash and cash equivalents includes cash on hand, deposits held at call with financial institutions, other short-term, highly liquid investments with original maturities of three months or less that are readily convertible to known amounts of cash and which are subject to an insignificant risk of changes in value.
(i) Trade and Other Receivables
Trade receivables are recognised initially at fair value and subsequently measured at amortised cost using the effective interest method, less allowance for impairment. Trade receivables are due for settlement at 95% within 7 days and the balance within 60 days. Other receivables are due for settlement no more than 30 days from the date of invoice. Collectability of trade receivables is reviewed on an ongoing basis. Debts which are known to be uncollectible are written off. An allowance for impairment is established when there is objective evidence that the Group will not be able to collect all amounts due according to the original terms of receivables. The amount of the allowance is recognised in profit and loss.
(j) Fair Value Estimation
The fair value of financial assets and financial liabilities must be estimated for recognition and measurement or for disclosure purposes. The carrying value, less impairment allowance, of trade receivables and payables are assumed to approximate their fair values due to their short-term nature.
For
per
sona
l use
onl
y

BC Iron Limited 18 Annual Report 2011 – Financials
NoteS to the FINANCIAL StAtemeNtSfor the year ended 30 June 2011 continued
NOTE 1 - STATEMENT OF SIGNIFICANT ACCOUNTING POLICIES (Continued)
(k) Plant and Equipment
Plant and equipment is stated at historical cost less accumulated depreciation. Historical cost includes expenditure that is directly attributable to the acquisition of the items. Depreciation is calculated on a straight-line basis so as to write off the net cost of each asset over either its expected useful life of 2.5 - 5 years for Furniture, Computers and Equipment or the life of the mine for Plant & Equipment.
(l) Exploration and Evaluation Expenditure
Expenditure on acquisition, exploration and evaluation relating to an area of interest is carried forward where rights to tenure of the area of interest are current and:
i. the area has proven commercially recoverable reserves; or
ii. exploration and evaluation activities are continuing in an area of interest but have not yet reached a stage which permits a reasonable assessment of the existence or otherwise of economically recoverable reserve.
At the end of each financial year the Directors assess the carrying value of the exploration expenditure carried forward in respect of each area of interest. Capitalised exploration expenditure is considered for impairment based upon areas of interest on an annual basis, depending on the existence of impairment indicators including:
• the period for which the Group has the right to explore in the specific area has expired during the period or will expire in the near future, and is not expected to be renewed;
• substantive expenditure on further exploration for and evaluation of mineral resources in the specific area is neither budgeted or planned;
• exploration for and evaluation of mineral resources in the specific area have not led to the discovery of commercially viable quantities of mineral resources and the Group has decided to discontinue such activities in the specific area; and
• sufficient data exists to indicate that, although a development in the specific area is likely to proceed, the carrying amount of the exploration and evaluation asset is unlikely to be recovered in full from successful development or by sale.
Costs carried forward in respect of an area of interest that is abandoned are written off in the year in which the decision to abandon is made.
(m) Development Expenditure
Once a mining project has been established as commercially viable and technically feasible, expenditure other than that on land, buildings and plant and equipment is capitalised under development expenditure. Development expenditure costs include past capitalised exploration and evaluation costs, pre-production development costs, development excavation, development studies and other subsurface expenditure pertaining to that area of interest. Costs related to surface plant and equipment and any associated land and buildings are accounted for as property, plant and equipment.
Development costs are accumulated in respect of each separate area of interest. Costs associated with commissioning new assets in the period before they are capable of operating in the manner intended by management, are capitalised. Development costs incurred after the commencement of production are capitalised to the extent they are expected to give rise to a future economic benefit.
When an area of interest is abandoned or the Directors decide that it is not commercial or technically feasible, any accumulated cost in respect of that area is written off in the financial period the decision is made. Each area of interest is reviewed at the end of each accounting period and accumulated cost written off to the profit or loss to the extent that they will not be recoverable in the future.
Amortisation of carried forward exploration and development costs is charged on a unit of production basis over the life of economically recoverable reserves once production commences.
Development assets are assessed for impairment if facts and circumstances suggest that the carrying amount exceeds the recoverable amount. For the purposes of impairment testing, development assets are allocated to cash-generating units to which the development activity relates. The cash generating unit shall not be larger than the area of interest.
Development strippingOverburden and other mine waste materials are often removed during the initial development of a mine in order to access the mineral deposit. This activity is referred to as development stripping.
The directly attributable costs (inclusive of an allocation of relevant operational overhead expenditure) are capitalised as development costs. Capitalisation of development stripping costs ceases and amortisation of those capitalised costs commences upon extraction of ore. Amortisation of capitalised development stripping costs is determined on a unit of production basis for each separate area of interest.
Capitalised development and production stripping costs are classified as ‘Development Expenditure”. Development stripping costs are considered in combination with other assets of an operation for the purpose of undertaking impairment assessments.
Removal of waste material normally continues throughout the life of a mine. This activity is referred to as production stripping and commences upon extraction of ore.
The Nullagine Iron Ore Joint Venture area of interest has minimal overburden to remove from these mines, therefore production stripping costs for these mines are not deferred but charged to the Statement of Comprehensive Income as they are incurred.
For
per
sona
l use
onl
y

BC Iron Limited – Financials 19 Annual Report 2011
NoteS to the FINANCIAL StAtemeNtSfor the year ended 30 June 2011 continued
NOTE 1 - STATEMENT OF SIGNIFICANT ACCOUNTING POLICIES (Continued)
(n) Inventories
Inventories are valued at the lower of cost and net realisable value. Cost is determined primarily on the basis of weighted average costs. Cost for raw materials and stores is purchase price and for partly processed and saleable products cost is derived on an absorption costing basis. For this purpose the costs of production include:
- labour costs, materials and contractor expenses which are directly attributable to the extraction and processing of ore;
- the amortisation of development expenditure and depreciation of property, plant and equipment used in the extraction and processing of ore; and
- production overheads, including attributable mining overheads.
Stockpiles represent ore that has been extracted and is available for further processing. If there is significant uncertainty as to when the stockpiled ore will be processed it is expensed as incurred. Where the future processing of this ore can be predicted with confidence e.g., because it exceeds the mine’s cut off grade, it is valued at the lower of cost and net realisable value. If the ore will not be processed within 12 months after the statement of financial position date it is included within non-current assets. Quantities are assessed primarily through surveys and volume conversions.
(o) Rehabilitation
The mining, extraction and processing activities of BC Iron give rise to obligations for site rehabilitation. Rehabilitation obligations can include facility decommissioning and dismantling; removal or treatment of waste materials; land rehabilitation; and site restoration. The extent of work required and the associated costs are estimated based on feasibility and engineering studies using current restoration standards and techniques. Provisions for the cost of each rehabilitation program are recognised at the time that environmental disturbance occurs.
Rehabilitation provisions are initially measured at the expected value of future cash flows required to rehabilitate the relevant site, discounted to their present value. The value of the provision is progressively increased over time as the effect of discounting unwinds. When provisions for rehabilitation are initially recognised, the corresponding cost is capitalised as an asset, representing part of the cost of acquiring the future economic benefits of the operation.
The capitalised cost of rehabilitation activities is recognised in ‘Development Expenditure’ as rehabilitation assets and amortised accordingly.
Where rehabilitation is expected to be conducted systematically over the life of the operation, rather than at the time of closure, provision is made for the present obligation or estimated outstanding continuous rehabilitation work at each statement of financial position date and the costs charged to the profit or loss in line with remaining future cash flows
At each reporting date the rehabilitation liability is re-measured to account for any new disturbance, updated cost estimates, changes to the estimated lives of operations, new regulatory requirements and revisions to discount rates. Changes to the rehabilitation liability are added to or deducted from the related rehabilitation asset and amortised accordingly.
(p) Mineral Tenements
The Group’s activities in the mining industry are subject to regulations and approvals including mining heritage, environmental regulation, the implications of the High Court of Australia decision in what is known generally as the “Mabo” case and any State or Federal legislation regarding native and mining titles. Approvals, although granted in most cases, are discretionary. The question of native title has yet to be determined and could effect any mining title area whether granted by the State or not.
(q) Trade and Other Payables
These amounts represent liabilities for goods and services provided to the Group prior to the end of the financial year which are unpaid. The amounts are unsecured and are usually paid within 30 days of recognition. They are recognised initially at fair value and subeqently at amortised cost.
employee BenefitsLiabilities for wages and salaries, including non-monetary benefits and annual leave expected to be settled within twelve (12) months of the reporting date are recognised in other payables and are measured at the amounts expected to be paid when the liability is settled.
LeasesLeases in which a significant portion of the risks and rewards of ownership are retained by the lessor are classified as operating (Refer note 21). Payments made under operating leases (net of any incentives received from the lessor) are charged to the profit or loss on a straight-line basis over the period of the lease.
BorrowingsAll loans and borrowings are initially recognised at fair value, net of transaction costs incurred. Borrowings are subsequently measured at amortised cost. Any difference between the proceeds (net of transaction costs) and the redemption amount is recognised in profit or loss over the period of the loans and borrowings using the effective interest method.
Borrowings are classified as current liabilities, unless the entity has an unconditional right to defer settlement of the liability for at least 12 months after the reporting date.
For
per
sona
l use
onl
y

BC Iron Limited 20 Annual Report 2011 – Financials
NoteS to the FINANCIAL StAtemeNtSfor the year ended 30 June 2011 continued
NOTE 1 - STATEMENT OF SIGNIFICANT ACCOUNTING POLICIES (Continued)
(q) Trade and Other Payables (Continued)
Foreign currency translationFunctional and presentation currencyItems included in the financial statements of each of the Group’s entities are measured using the currency of the primary economic environment in which the entity operates (‘the functional currency’). The consolidated financial statements are presented in AUD, which is BC Iron Limited’s functional and presentation currency.
Transactions and balancesTransactions in foreign currency are translated at the foreign exchange rate ruling at the date of the transaction. Monetary assets and liabilities denominated in foreign currencies at reporting date are translated to Australian dollars at the foreign exchange rate ruling at that date. Foreign exchange differences arising on translation are recognised in the profit or loss. Non-monetary assets and liabilities that are measured in terms of historical cost in a foreign currency are translated using the exchange rate at the date of the transaction.
(r) Provisions
Provisions for legal claims are recognised when the Group has a present legal or constructive obligation as a result of past events, it is more likely than not that an outflow of resources will be required to settle the obligation and the amount can be reliably estimated. Provisions are not recognised for future operating losses. Where there are a number of similar obligations, the likelihood that an outflow will be required in settlement is determined by considering the class of obligations as a whole. A provision is recognised even if the likelihood of an outflow with respect to any one item included in the same class of obligations may be small.
Provisions are measured at the present value of management’s best estimate of the expenditure required to settle the present obligation at the balance sheet date. The discount rate used to determine the present value reflects current market assessments of the time value of money and the risks specific to the liability. The increase in the provision due to the passage of time is recognised as interest expense.
(s) Contributed Equity
Ordinary shares are classified as equity. Costs directly attributable to the issue of new shares or options are shown in equity as a deduction from the proceeds.
(t) Earnings Per Share
Basic earnings per share is determined by dividing the profit (loss) after income tax attributable to equity holders of the Company by the weighted average number of ordinary shares outstanding during the financial year.
Diluted earnings per share earnings used to calculate diluted earnings per share are calculated by adjusting the basic earnings by the after-tax effect of dividends and interest associated with dilutive potential ordinary shares. The weighted average number of shares used is adjusted for the weighted average number of ordinary shares that would be issued on the conversion of all the dilutive potential ordinary shares into ordinary shares.
(u) Share-Based Payments
Share-based remuneration benefits are provided to employees via an employee share option plan. Information relating to this plan is set out in Note 28.
The fair value of options granted is recognised as an employee benefit expense with a corresponding increase in equity. The fair value is measured at grant date and recognised over the period during which the employees become unconditionally entitled to the options.
The fair value at grant date is independently determined using a Black-Scholes option pricing model that takes into account the exercise price, the term of the option, the impact of dilution, the share price at grant date and expected price volatility of the underlying share, the expected dividend yield and the risk free interest rate for the term of the option.
The fair value of the options granted is adjusted to reflect market conditions, but excludes the impact of any non-market vesting conditions (for example, profitability and sales growth targets). Non-market vesting conditions are included in the assumptions about the number of options that are expected to become exercisable.
The employee benefit expense recognised each period takes in to account the most recent estimate. The impact of revision to original estimates, if any, is recognised in the profit and loss with a corresponding adjustment to equity.
For
per
sona
l use
onl
y

BC Iron Limited – Financials 21 Annual Report 2011
NoteS to the FINANCIAL StAtemeNtSfor the year ended 30 June 2011 continued
NOTE 1 - STATEMENT OF SIGNIFICANT ACCOUNTING POLICIES (Continued)
(v) New Accounting Standards and Interpretations
Certain new accounting standards have been published that are not mandatory for 30 June 2011 reporting periods as outlined below. The Group has not applied these in preparing this financial report.
Affected Standard
Title of Affected Standard
Nature of Change Application Date *
Impact on Initial Application
AASB 9 (issued December 2009)
Financial Instruments
Amends the requirements for classification and measurement of financial assets
1 January 2013
Due to the recent release of these amendments and that adoption is only mandatory for the 30 June 2014 year end, the entity has not yet made an assessment of the impact of these amendments.
AASB 124 (issued December 2009)
Related Party Disclosures
Clarifies the definition of a related party 1 January 2011
As this a disclosure standard only, there will be no impact on amounts recognised in the financial statements.
AASB 2010-6 (AASB 7)
Financial Instruments Disclosures
Deletes various disclosures relating to credit risk, renegotiated loans and receivables and the fair value of collateral held
1 January 2011
There will be no impact on initial adoption to amounts recognised in the financial statement as the amendments result in fewer disclosures.
IFRS 11 (issued May 2011)
Joint Arrangements
Joint arrangements will be classified as either ‘joint operations’ (where parties with joint control have rights to assets and obligations for liabilities) or ‘joint ventures’ (where parties with joint control have rights to the net assets of the arrangement).Joint arrangements structured as a separate vehicle will generally be treated as joint ventures and accounted for using the equity method (proportionate consolidation no longer allowed). However, where terms of the contractual arrangement, or other facts and circumstances indicate that the parties have rights to assets and obligations for liabilities of the arrangement, rather than rights to net assets, the arrangement will be treated as a joint operation and joint venture parties will account for the assets, liabilities, revenues and expenses in accordance with the contract.
Annual reporting periods commencing on or after 1 January 2013
When this standard is adopted for the first time for the year ended 30 June 2014, joint ventures will be accounted for in consolidated financial statements using the equity method, rather than the proportionate consolidation method. On 1 July 2012, the initial equity accounted investment will be measured as the aggregate of the net carrying amounts of all assets and liabilities previously accounted for using proportionate consolidation. Any impairment adjustments required on 1 July 2012 will be debited to retained earnings on that date.
IAS 19 (issued June 2011)
Employee Benefits
Main changes include:
Elimination of the ‘corridor’ approach for deferring gains/losses for defined benefit plans
Actuarial gains/losses on remeasuring the defined benefit plan obligation/asset to be recognised in OCI rather than in profit or loss, and cannot be reclassified in subsequent periods
Subtle amendments to timing for recognition of liabilities for termination benefits
Employee benefits expected to be settled (as opposed to due to settled under current standard) within 12 months after the end of the reporting period are short-term benefits, and therefore not discounted when calculating leave liabilities. Annual leave not expected to be used within 12 months of end of reporting period will in future be discounted when calculating leave liability.
Annual periods commencing on or after 1 January 2013
The entity currently calculates its liability for annual leave employee benefits on the basis that it is due to be settled within 12 months of the end of the reporting period because employees are entitled to use this leave at any time. The amendments to IAS 19 require that such liabilities be calculated on the basis of when the leave is expected to be taken, i.e. expected settlement.
When this standard is first adopted for 30 June 2014 year end, annual leave liabilities will be recalculated on 1 July 2012. Leave liabilities for any employees with significant balances of leave outstanding who are not expected to take their leave within 12 months will be discounted, which may result in a reduction of the annual leave liabilities recognised on 1 July 2012, and a corresponding increase in retained earnings at that date.
For
per
sona
l use
onl
y

BC Iron Limited 22 Annual Report 2011 – Financials
NoteS to the FINANCIAL StAtemeNtSfor the year ended 30 June 2011 continued
NOTE 1 - STATEMENT OF SIGNIFICANT ACCOUNTING POLICIES (Continued)
(w) Critical Accounting Estimates & Judgements
In preparing this Financial Report, the Group has been required to make certain estimates and assumptions concerning future occurrences. There is an inherent risk that the resulting accounting estimates will not equate exactly with actual events and results.
i) Significant accounting judgementsIn the process of applying the Group’s accounting policies, management has made the following judgements, apart from those involving estimations, which have the most significant effect on the amounts recognised in the financial statements:
Capitalisation of exploration and evaluation expenditureThe Group has capitalised significant exploration and evaluation expenditure on the basis either that this is expected to be recouped through future successful development (or alternatively sale) of the Areas of Interest concerned or on the basis that it is not yet possible to assess whether it will be recouped. This better reflects the operating position of the Group.
Development expenditureDevelopment activities commence after commercial viability and technical feasibility of the project is established. Judgement is applied by management in determining when a project is commercially viable and technically feasible. Any judgements may change as new information becomes available. If, after having commenced the development activity, a judgement is made that a development asset is impaired, the appropriate amount will be written off to the statement of comprehensive income.
ii) Significant accounting estimates and assumptionsThe carrying amounts of certain assets and liabilities are often determined based on estimates and assumptions of future events. The key estimates and assumptions that have a significant risk of causing a material adjustment to the carrying amounts of certain assets and liabilities within the next annual reporting period are:
Impairment of capitalised exploration and evaluation expenditureThe future recoverability of capitalised exploration and evaluation expenditure is dependent on a number of factors, including whether the Group decides to exploit the related lease itself, or, if not, whether it successfully recovers the related exploration and evaluation asset through sale.
Factors that could impact the future recoverability include the level of reserves and resources, future technological changes, costs of drilling and production, production rates, future legal changes (including changes to environmental restoration obligations) and changes to commodity prices.
As at 30 June 2011, the carrying value of exploration expenditure is $4,349,457.
Share-based payment transactionsThe cost of share-based payments to employees is measured by reference to the fair value of the option instruments at the date at which they are granted. The fair value is determined using the Black-Scholes model, taking into account the terms and conditions upon which the options were granted.
The cost of share-based payments to financiers is measured by reference to the difference between the nominal value and net present value of the finance facility provided. The net present value is determined based upon a market comparable discount rate applicable to similar size companies within the mining sector.
Development expenditureUpon reclassification from exploration and evaluation expenditure, the recoverable amount has been estimated as the asset’s value in use, using the present value of future cash flows based upon available reserves calculated by the Company’s geologists in accordance with industry guidelines, using a discount rate of 11%. As a result of this assessment, no impairment was deemed necessary.
Recognition of deferred tax balances relating to tax lossesThe group has recognised deferred tax assets relating to carried forward tax losses to the extent the group believe the utilisation of these losses against future taxable profits is considered probable.
RehabilitationBC Iron’s accounting policy for the recognition of rehabilitation provisions requires significant estimates in determining the estimated cost for the rehabilitation of disturbed areas at a point in the future. These uncertainties may result in future actual expenditure differing from the amounts currently provided.
Reserve estimatesReserves are estimates of the amount of product that can be economically and legally extracted from the current mining tenements. In order to calculate reserves, estimates and assumptions are required about a range of geological, technical and economic factors, including quantities, grades, production techniques, recovery rates, production costs, transports costs, commodity demand, commodity prices and exchange rates. Estimating the quantity and/or grade of reserves requires the size, shape and depth of ore bodies or fields to be determined by analysing geological data such as drilling samples. This process may require complex and difficult geological judgements and calculations to interpret the data.
For
per
sona
l use
onl
y

BC Iron Limited – Financials 23 Annual Report 2011
NoteS to the FINANCIAL StAtemeNtSfor the year ended 30 June 2011 continued
NOTE 1 - STATEMENT OF SIGNIFICANT ACCOUNTING POLICIES (Continued)
(w) Critical accounting estimates & judgements (Continued)
Because the economic assumptions used to estimate reserves change from period to period, and because additional geological data is generated during the course of operations, estimates of reserves may change from period to period. Changes in reported reserves may affect the Groups financial results and financial position in a number of ways, including the following:
• Asset carrying values may be affected due to changes in estimated future cash flows;
• Depreciation and amortisation charges in the Statement of Comprehensive Income may change where such charges are determined by the units of production basis, or where the useful economic lives of assets change; and
• The carrying value of deferred tax assets may change due to changes in estimates of the likely recovery of tax benefits.
Units of production methodWhere the useful life of an asset is directly linked to the extraction of ore from the mine, the asset is depreciated using the units of production method. In applying the units of production method, depreciation is normally calculated using the quantity of material extracted from the mine in the period as a percentage of the total quantity of material to be extracted in current and future periods based on proved and probable reserves.
Production start dateThe Group assesses the stage of each mine development project to determine when a mine moves into the production stage. The criteria used to assess the start date of a mine are determined based on the unique nature of each mine development project. The Group considers various relevant criteria to assess when the mine is substantially complete, ready for its intended use and moves into the production stage. Some of the criteria include:
• The level of capital expenditure compared to construction cost estimates;
• Completion of a reasonable period of testing of the mine plant and equipment;
• Ability to process iron ore in saleable form; and
• Ability to sustain ongoing mining and processing of iron ore.
When a mine development project moves into the production stage, the capitalisation of certain mine construction costs ceases and costs are either regarded as inventory or expensed, except for costs relating to mining asset additions or improvements, and mineable reserve development, which are capitalised. It is also at this point that depreciation/amortisation commences.
Functional CurrencyThe company has defined the functional currency of its group as Australian Dollars. The group operates in Australia and incurs expenses in Australian dollars. In determining this conclusion the company has exercised judgement when reviewing its existing transactions and applying the requirements of AASB 121 The Effects of Changes in Foreign Exchange Rates. The company will monitor this going forward as it moves from an exploration to mining company.
NOTE 2 - REVENUE
Consolidated Entity 2011 $
Consolidated Entity 2010 $
From Continuing Operations
Sales Revenue 17,133,674 -
17,133,674 -
Other Revenue
Management Fees 1,954,090 482,998
1,954,090 482,998
19,087,764 482,998 For
per
sona
l use
onl
y

BC Iron Limited 24 Annual Report 2011 – Financials
NoteS to the FINANCIAL StAtemeNtSfor the year ended 30 June 2011 continued
NOTE 3 - OTHER INCOME
Consolidated Entity 2011 $
Consolidated Entity 2010 $
Other Income
Interest revenue 1,081,361 1,045,792
Foreign exchange gains/(loss) (net) 2,119,795 -
3,201,156 1,045,792
NOTE 4 - EXPENSES
Consolidated Entity 2011 $
Consolidated Entity 2010 $
Profit before income tax includes the following specific expenses:
Cost of Sales
Mining and Ore Dressing 6,564,880 -
Haulage 5,247,804 -
Site Administration 6,192,172 -
Depreciation/Amortisation 636,596 -
Royalties 608,119 -
Inventory Movement (6,309,851) -
Total 12,939,720 -
Selling and Marketing expenses 841,889 -
General & Administration expenses
Depreciation expense 211,748 91,068
Director’s fees 194,724 189,196
Office rent, ancillaries and running costs 1,248,576 797,368
Personnel and support 799,990 452,964
Share registry services and other corporate costs 3,980,765 1,590,906
Share based payments 499,648 818,226
Total 6,935,451 3,939,727
For
per
sona
l use
onl
y

BC Iron Limited – Financials 25 Annual Report 2011
NoteS to the FINANCIAL StAtemeNtSfor the year ended 30 June 2011 continued
NOTE 5 - AUDITOR’S REMUNERATION
Consolidated Entity 2011 $
Consolidated Entity 2010 $
During the financial period the following fees were paid or payable for services provided by the auditor:
(a) Audit services
BDO Audit (WA) Pty Ltd:
Audit and review of financial reports under the Corporations Act 2001 44,260 45,650
(b) Non-Audit Services
Related entities of BDO
Taxation services 44,239 29,058
Total remuneration of auditors 88,499 74,708
These services were provided by BDO Corporate Tax (WA) Pty Ltd and BDO Audit (WA) Pty Ltd.
The Group has received notification from the Group’s auditor that they satisfy the independence criterion and that there have been no contraventions of the auditor independence requirements of the Corporations Act 2001 or any applicable code of professional conduct in relation to the audit.
NOTE 6 – INCOME TAXES
Consolidated Entity 2011 $
Consolidated Entity 2010 $
(a) Income tax benefit
Current Tax Benefit - 207,023
Deferred tax expense 61,697 818,530
61,697 1,025,553
(b) Amounts charged or credited directly to equity
Capital raising transaction costs 214,789 513,388
(c) Numerical reconciliation of income tax benefit to prima facie tax payable
Profit/(Loss) from continuing operations before income tax expense 922,828 (2,410,936)
Prima facie tax (expense) / benefit at 30% (2010:30%) (276,848) 723,281
Non deductible expenses:
Share-based payments (149,894) (245,468)
Other (43,500) (3,541)
Deferred tax asset of a prior period now recognised - 344,258
R & D tax offset payment 172,464 207,023
Prior period adjustments 359,475 -
Income tax benefit 61,697 1,025,553For
per
sona
l use
onl
y

BC Iron Limited 26 Annual Report 2011 – Financials
NoteS to the FINANCIAL StAtemeNtSfor the year ended 30 June 2011 continued
NOTE 6 – INCOME TAXES (Continued)
Balances 2011
Balances 2010
(d) Deferred Tax Assets
Tax Losses 6,162,299 5,073,647
Accrued Expenses 396,351 24,682
Provisions 276,178 67,007
Other timing differences 478,066 260,529
Share issue costs in equity 386,835 365,474
7,699,729 5,791,339
Less: Deferred Tax Asset not brought to account -
7,699,729 5,791,339
Less: offset against Deferred Tax Liabilities (6,091,325) (4,459,421)
Net Deferred Tax Asset 1,608,404 1,331,918
Deferred tax assets expected to be recovered within 12 months 6,713,232 5,278,627
Deferred tax assets expected to be recovered after more than 12 months 986,497 512,712
7,699,729 5,791,339
(e) Deferred Tax Liabilities
Exploration & Evaluation Asset 1,304,837 1,031,941
Development Expenditure 4,138,281 3,260,234
Plant & Equipment 12,245 12,245
Other timing differences 635,961 155,001
6,091,325 4,459,421
Less: offset by Deferred Tax Assets (6,091,325) (4,459,421)
Net Deferred Tax Liability - -
(f) Movements in Deferred Tax Assets
Tax losses $’000
Accrued Expenses
$’000Provisions
$’000
Share issue costs $’000
Other $’000
Total $’000
At 1 July 2009 - - - - - -
(Charged)/credited
- to profit or loss 5,073,647 24,682 67,007 (147,914) 260,529 5,277,951
- to other - - - - - -
comprehensive income
- directly to equity - - - 513,288 - 513,288
At 30 June 2010 5,073,647 24,682 67,007 365,374 260,529 5,791,239
(Charged)/credited
- to profit or loss 1,088,652 371,669 209,171 (193,423) 217,632 1,693,601
- to other - - - - - -
comprehensive income
- directly to equity - - - 214,789 - 214,789
At 30 June 2011 6,162,299 396,351 276,178 386,740 478,161 7,699,729
For
per
sona
l use
onl
y

BC Iron Limited – Financials 27 Annual Report 2011
NoteS to the FINANCIAL StAtemeNtSfor the year ended 30 June 2011 continued
NOTE 6 – INCOME TAXES (Continued)
(g) Movements in Deferred Tax Liabilities
Movements
Exploration & Evaluation Assets
$’000
Development Expenditure
$’000
Plant & Equipment
$’000Other $’000
Total $’000
At 1 July 2009 - - - - -
(Charged)/credited
- to profit or loss 1,031,941 3,260,234 12,245 155,001 4,459,421
- to other - - - - -
comprehensive income
- directly to equity - - - - -
At 30 June 2010 1,031,941 3,260,234 12,245 155,001 4,459,421
(Charged)/credited
- to profit or loss 272,896 878,047 - 480,960 1,631,904
- to other - - - - -
comprehensive income
- directly to equity - - - - -
At 30 June 2011 1,304,837 4,138,281 12,245 635,961 6,091,325
Deferred tax assets and liabilities have been offset as they relate to income taxes levied by the same taxation authority and there is a legally recognised right to offset.
Tax consolidation legislation
BC Iron Limited and its wholly owned Australian controlled entities have elected to enter into the tax consolidation legislation from 20 May 2009. On adoption of the tax consolidation legislation, the entities in the tax consolidated group entered into a tax sharing agreement which, in the opinion of the directors, limits the joint and several liability of the wholly owned entities in the case of a default by the head entity, BC Iron Limited.
The amounts receivable/payable under the tax funding agreement are due upon receipt of the funding advice from the head entity, which is issued as soon as practicable after the end of each financial year. The head entity may also require payment of interim funding amounts to assist with its obligations to pay tax instalments. The funding amounts are recognised as current intercompany receivables or payables, no amounts have been recognised.
The entities entered into a tax funding agreement under which the wholly owned entities fully compensate BC Iron Limited for any current tax payable assumed and are compensated by BC Iron Limited for any current tax receivable and deferred tax assets relating to unused tax losses or unused tax credits that are transferred to BC Iron Limited under the tax consolidation legislation. The funding amounts are determined by reference to the amounts recognised in the wholly owned entities’ financial statements.
NOTE 7 – CASH AND CASH EQUIVALENTS
Consolidated Entity 2011 $
Consolidated Entity 2010 $
Cash at Bank and on hand 17,536,827 499,429
Cash on Deposit - 28,263,547
17,536,827 28,762,976
Refer to Note 26 – Financial Risk Management.
For
per
sona
l use
onl
y

BC Iron Limited 28 Annual Report 2011 – Financials
NoteS to the FINANCIAL StAtemeNtSfor the year ended 30 June 2011 continued
NOTE 8 – TRADE AND OTHER RECEIVABLES
Consolidated Entity 2011 $
Consolidated Entity 2010 $
Trade receivables 4,107,576 934,322
Interest receivable 75 186,238
Prepayments 122,345 -
Receivables due from Joint Arrangement (note 25) 1,096,339 268,655
Other receivables (GST) 1,821,679 643,486
7,148,014 2,032,700
(a) Ageing of financial assets past due not impaired
As at 30 June 2011 and 30 June 2010 there were no financial assets past due not impaired.
(b) Ageing of impaired financial assets
As at 30 June 2011 and 30 June 2010 there were no financial assets impaired.
Information about BC Iron’s exposure to foreign currency risk and interest rate risk are disclosed in Note 26.
NOTE 9 – INVENTORY
Consolidated Entity 2011 $
Consolidated Entity 2010 $
Current Assets
Raw materials - at cost 1,739,911 1,965,880
Iron Ore Stockpiles 7,283,750 -
9,023,661 1,965,880
NOTE 10 – OTHER FINANCIAL ASSETS
Consolidated Entity 2011 $
Consolidated Entity 2010 $
Current Assets
Security deposits - corporate cards 112,340 96,436
Security deposits - office rent and village 130,425 154,000
242,765 250,436
For
per
sona
l use
onl
y

BC Iron Limited – Financials 29 Annual Report 2011
NoteS to the FINANCIAL StAtemeNtSfor the year ended 30 June 2011 continued
NOTE 11 – PLANT & EQUIPMENT
Consolidated Entity
Furniture, Computers and Equipment
$Plant & Equipment
$Total
$
Year ended 30 June 2011
At 1 July 2010, net of accumulated depreciation 450,212 3,667,278 4,117,490
Additions 246,818 33,671,745 33,918,563
Disposals - - -
Depreciation charge for the year (211,748) (414,727) (626,474)
At 30 June 2011, net of accumulated depreciation 485,282 36,924,296 37,409,578
At 30 June 2011
Cost 802,223 37,339,023 38,141,246
Accumulated depreciation (316,941) (414,727) (731,668)
Net carrying amount 485,282 36,924,296 37,409,578
Year ended 30 June 2010
At 1 July 2009, net of accumulated depreciation 112,828 - 112,828
Additions 438,084 3,667,278 4,105,362
Disposals (9,631) - (9,631)
Depreciation charge for the year (91,069) - (91,069)
At 30 June 2010, net of accumulated depreciation 450,212 3,667,278 4,117,490
At 30 June 2010
Cost 595,365 3,667,278 4,262,643
Accumulated depreciation (145,153) - (145,153)
Net carrying amount 450,212 3,667,278 4,117,490
NOTE 12 - EXPLORATION & EVALUATION EXPENDITURE
Consolidated Entity 2011 $
Consolidated Entity 2010 $
Exploration and evaluation expenditure costs brought forward in respect of areas of interest
Opening balance 3,439,802 9,877,636
Transfers to development expenditure - (8,639,354)
Expenditure during financial year 909,655 2,201,520
Balance 30 June 2011 4,349,457 3,439,802
Exploration and evaluation expenditure is recorded at historical cost on an area of interest basis. Recovery of these costs is dependent upon the commercial success of future exploration and development or realisation by disposal of the interests therein.
There may exist on the Group’s exploration properties, areas subject to claim under native title or containing sacred sites or sites of significance to Aboriginal people. As a result, exploration properties or areas within the tenements may be subject to exploration and mining restrictions.F
or p
erso
nal u
se o
nly

BC Iron Limited 30 Annual Report 2011 – Financials
NoteS to the FINANCIAL StAtemeNtSfor the year ended 30 June 2011 continued
NOTE 13 – DEVELOPMENT EXPENDITURE
Consolidated Entity 2011 $
Consolidated Entity 2010 $
Development expenditure costs brought forward in respect of areas of interest
Opening balance 12,914,138 -
Transfer from exploration & evaluation expenditure - 8,639,354
Expenditure during financial year 12,304,369 4,274,784
Amortisation of Development expditure (243,734) -
Balance 30 June 2011 24,974,772 12,914,138
All expenditure for the Mine Development is included in Development Expenditure. Development expenditure is recorded at historical cost.
Upon reclassification from exploration and evaluation expenditure, the recoverable amount has been estimated as the asset’s value in use, using the present value of future cash flows based upon available reserves calculated by the Company’s geologists in accordance with industry guidelines, using a discount rate of 11%. As a result of this assessment, no impairment was deemed necessary.
NOTE 14 – OTHER NON CURRENT ASSETS
Consolidated Entity 2011 $
Consolidated Entity 2010 $
Non Current Assets
Opening balance - -
Rehabilitation Asset 1,146,500 -
Balance 30 June 2011 1,146,500 -
NOTE 15 – TRADE AND OTHER PAYABLES
Consolidated Entity 2011 $
Consolidated Entity 2010 $
Trade payables and accruals 15,519,037 1,641,539
Employee benefits 611,972 98,358
Balance 30 June 11 16,131,009 1,739,897
Trade payables are unsecured and payable on supplier credit terms, usually payable within 30 days of recognition. The Group has financial risk management policies in place to ensure that all payables are paid within the credit timeframe.
Refer to Note 26 – Financial Risk Management.
For
per
sona
l use
onl
y

BC Iron Limited – Financials 31 Annual Report 2011
NoteS to the FINANCIAL StAtemeNtSfor the year ended 30 June 2011 continued
NOTE 16 – LOANS AND BORROWINGS
Consolidated Entity 2011 $
Consolidated Entity 2010 $
Unsecured
Loan - Henghou Facility - current 4,512,766 13,954,966
Loan - Henghou Facility - non current 14,488,235 -
Total unsecured borrowings 19,001,001 13,954,966
The NJV secured US$50 million (interest free) in project finance with Henghou Industries (Hong Kong) Limited. Henghou made a payment of US$15 million on 17 December 2009 (being US$7.5 million to the Group), a payment of US$15 million on 3 February 2010 (being US$7.5 million to the Group) and a payment of US$20 million on 2 July 2010 (being US$10 million to the Group). The total borrowings above do not agree to the total loan to the Group of US$25 million due to foreign exchange differences and discounting of the loan as it is interest free.
The Group will repay its share of the facility at the amount of US$5 million annually to Henghou over 5 years from December 2011. As part of this facility BCI issued 8m options to Henghou as non-cash consideration.
These borrowings are unsecured and the carrying value equals fair value.
NOTE 17 – PROVISIONS
Consolidated Entity 2011 $
Consolidated Entity 2010 $
Provision for Rehabilitation 920,594 125,000
920,594 125,000
Movements in provisions
2011 Rehabilitation Total
Carrying amounts at start of year 125,000 125,000
Charged/(credited) to profit or loss - -
Capitalised to Development
- additional provisions recognised 795,594 795,594
Carrying amounts at end of year 920,594 920,594
2010 Rehabilitation Total
Carrying amounts at start of year - -
Charged/(credited) to profit or loss - -
Capitalised to Development
- additional provisions recognised 125,000 125,000
Carrying amounts at end of year 125,000 125,000
The Group makes provision for the future cost of rehabilitating mine sites on a discounted basis on the development of mines. This provision represents the present value of rehabilitation costs relating to the mine sites, which are expected to be incurred through to the life of the mine. Assumptions, based on the current economic environment, have been made in determining current rehabilitation provisions, which management believes are a reasonable bases upon which to estimate the future liability. These estimates are reviewed at each reporting date to take into account any material changes to the assumptions. However, actual rehabilitation costs will ultimately depend upon future market prices for the necessary decommissioning works required which will reflect market conditions at the relevant time. Furthermore, the timing of rehabilitation is likely to depend on when the mines cease to produce at economically viable rates. This, in turn, will depend upon future iron ore prices, which are inherently uncertain.F
or p
erso
nal u
se o
nly

BC Iron Limited 32 Annual Report 2011 – Financials
NoteS to the FINANCIAL StAtemeNtSfor the year ended 30 June 2011 continued
NOTE 18 – CONTRIBUTED EQUITY
Consolidated Entity 2011 Consolidated Entity 2010
Number $ Number $
Share Capital
Ordinary shares - Fully paid 94,381,000 58,250,587 83,911,000 36,518,762
Movement in Ordinary Share Capital
At 1 July 83,911,000 36,518,762 68,846,000 22,982,385
Exercise of options, 1 November 2010 150,000 187,500 - -
Share placement at $2.30, 18 November 2010 4,000,000 9,200,000 - -
Exercise of options, 19 November 2010 500,000 962,500 - -
Share placement at $2.30, 22 December 2010 4,000,000 9,200,000 - -
Exercise of options, 3 February 2011 1,500,000 1,947,500 - -
Exercise of options, 16 February 2011 50,000 62,500 - -
Exercise of options, 9 March 2011 250,000 648,000 - -
Exercise of options, 19 May 2011 20,000 25,000 - -
Rights Issue, 27 July 2009 - - 11,461,000 12,607,100
Exercise of options, 14 August 2009 - - 250,000 62,500
Exercise of options, 5 October 2009 - - 254,000 63,500
Exercise of options, 26 November 2009 - - 30,000 21,600
Exercise of options, 10 December 2009 - - 2,800,000 725,000
Exercise of options, 11 December 2009 - - 70,000 50,400
Exercise of options, 6 January 2010 - - 100,000 72,000
Exercise of options, 9 February 2010 - - 100,000 72,000
Less: costs of issue - (715,964) - (651,111)
Tax effect of costs of issue - 214,789 - 513,388
At 30 June 94,381,000 58,250,587 83,911,000 36,518,762
(a) Terms and conditions of ordinary shares:
Holders of ordinary shares are entitled to receive dividends as declared from time to time and are entitled to one vote per share at shareholders’ meetings. In the event of winding up of the Group, ordinary shareholders rank after all other shareholders and creditors are fully entitled to any proceeds of liquidations.
(b) Capital risk management
The Group’s objective when managing capital is to safeguard its ability to continue as a going concern so that it can continue to provide returns to shareholders and benefits for other stakeholders and to maintain an optimal capital structure to reduce the cost of capital. In order to maintain or adjust the capital structure, the Group may adjust the amount of dividends paid to shareholders, return capital to shareholders, issue new shares or sell assets to reduce debt. The Group defines capital as equity and net debt. Net debt is defined as borrowings less cash and cash equivalents and equity as the sum of share capital, reserves and accumulated losses.
For
per
sona
l use
onl
y

BC Iron Limited – Financials 33 Annual Report 2011
NoteS to the FINANCIAL StAtemeNtSfor the year ended 30 June 2011 continued
NOTE 18 – CONTRIBUTED EQUITY (Continued)
Consolidated Entity 2011 $
Consolidated Entity 2010 $
Net Equity 67,387,375 38,995,476
Borrowings 19,001,001 13,954,966
Cash (17,536,827) (28,762,976)
Net Debt 1,464,174 (14,808,010)
Capital 68,851,549 24,187,467
Gearing Ratio 2% -61%
NOTE 19 - RESERVES AND ACCUMULATED LOSSES
Consolidated Entity 2011 $
Consolidated Entity 2010 $
(a) Reserves
Reserves 12,385,997 6,710,448
Reserves comprise the following:
Share-based payments reserve
Balance at start of financial year 6,065,609 1,303,240
Employee option expense 499,648 818,226
Employee option expense capitalised 566,200 241,784
Financier option expense 4,609,701 4,271,518
Options transferred to options exercised reserve (1,256,446) (569,159)
Balance at end of the financial year 10,484,712 6,065,609
Options Exercised reserve
Balance at start of financial year 644,839 75,680
Options transferred from share-based payments reserve 1,256,446 569,159
Balance at end of the financial year 1,901,285 644,839
Total reserves 12,385,997 6,710,448
(b) Accumulated losses (3,249,209) (4,233,734)
Accumulated losses comprise the following:
Balance at start of financial year (4,233,734) (2,848,351)
Profit/(loss) for the financial period after related income tax benefit 984,525 (1,385,383)
Balance at end of the financial year (3,249,209) (4,233,734)
(c) Nature and purpose of reserves
The share based payments reserve is used to recognise the fair value of options; options issued to employees but not exercised and equity-settled benefits issued in settlement of share issue costs.
The options exercised reserve is used to recognise the fair value of options exercised.
For
per
sona
l use
onl
y

BC Iron Limited 34 Annual Report 2011 – Financials
NoteS to the FINANCIAL StAtemeNtSfor the year ended 30 June 2011 continued
NOTE 20 – PROFIT/ (LOSS) PER SHARE
Consolidated Entity 2011 Cents
Consolidated Entity 2010 Cents
(a) Basic earnings/(loss)per share 1.10 (1.70)
(b) Diluted earnings per share 1.29
$ $
(c) Profit (loss) used in calculating loss per share
Profit/(loss) attributable to the ordinary equity holders of the Company 984,525 (1,385,383)
(d) Additional profit used in calculating diluted earnings per share 300,266 -
Profit used in calculating diluted earnings per share 1,284,791
Number Number
(e) Weighted average number of shares used as the denominator
Weighted average number of ordinary shares outstanding during the year used in calculations of basic earnings/(loss) per share
89,538,973 81,523,203
(f) Diluted earnings per share denominator
Vested share options outstanding at 30 June 2011 10,230,000
Denominator used for the purpose of calculating diluted earnings per share 99,768,973
Diluted loss per share has not been disclosed in prior year as there were no instruments which were dilutive.
NOTE 21 – COMMITMENTS
(a) Mining Tenement Leases
In order to maintain current rights of tenure to exploration tenements the Group is required to perform minimum exploration work to meet the minimum expenditure requirements specified by the WA State Government and pay tenement lease rents.
The estimated exploration expenditure commitment for the ensuing year, but not recognised as a liability in the financial statements:
Consolidated Entity 2011 $
Consolidated Entity 2010 $
Within one year 635,327 492,405
Later than one year but less than five years 3,267,806 3,021,620
Later than five years - -
3,903,134 3,514,025
The commitments due within one year amount to $78,027 in respect of tenement lease rentals and $557,300 in exploration and development expenditures. This expenditure comprises 50% of tenement expenditure commitments in relation to the Joint Venture. It will only be incurred should the Group retain its existing level of interest in its various exploration areas and provided access to mining tenements is not restricted. These obligations will be fulfilled in the normal course of operations, which may include farm-out, joint venture and direct exploration expenditure.
(b) Operating Lease – Buildings
The Group leases offices in West Perth, Western Australia, under a non-cancellable operating lease expiring 31st August 2016.
Consolidated Entity 2011 $
Consolidated Entity 2010 $
Commitments for minimum lease payments are:
Within one year 280,408 200,270
Later than one year but less than five years 1,211,257 33,378
Later than five years 54,489 -
1,546,154 233,648
For
per
sona
l use
onl
y

BC Iron Limited – Financials 35 Annual Report 2011
NoteS to the FINANCIAL StAtemeNtSfor the year ended 30 June 2011 continued
NOTE 21 – COMMITMENTS (continued)
(c) Capital Commitments
Prior to 30th of June the Group executed a contract (on behalf of NJV) with Watpac Civil and Mining for the construction of the Haul Road. Details of commitments to construction completion are as per below:
Consolidated Entity 2011 $
Consolidated Entity 2010 $
Within one year 3,750,000 3,861,896
Later than one year but less than five years - -
Later than five years - -
3,750,000 3,861,896
NOTE 22 - KEY MANAGEMENT PERSONNEL DISCLOSURE
(a) Key management personnel compensation
Consolidated Entity 2011 $
Consolidated Entity 2010 $
Short-term employee benefits 1,233,539 1,028,120
Post-employment benefits 75,805 74,960
Share-based payments 69,996 436,639
1,379,340 1,539,719
Detailed remuneration disclosures are provided in the remuneration report in the Directors Report.
(b) Equity instrument disclosures relating to key management personnel
The interests of Key Management Personnel in shares and share options at the end of the financial period are as follows:
Consolidated Entity 2011
Number of SharesBalance at the start of
the financial period
Received during the year on the
exercise of optionsOther changes
Balance at the end of the financial
period
Directors
A Kiernan 1,114,133 1,114,133
M Young 1,273,001 500,000 (500,000) 1,273,001
S Chadwick 533,334 (100,000) 433,334
T Ransted 622,601 622,601
G Baldwin - -
D Coyne - -
Executives
M Ball 8,000 500,000 (230,000) 278,000
B Duncan - 500,000 (495,000) 5,000
3,551,069 1,500,000 (1,325,000) 3,726,069
For
per
sona
l use
onl
y

BC Iron Limited 36 Annual Report 2011 – Financials
NOTE 22 - KEY MANAGEMENT PERSONNEL DISCLOSURE (Continued)(b) Equity instrument disclosures relating to key management personnel (Continued)
Consolidated Entity 2010
Number of SharesBalance at the start of
the financial periodReceived during the year on
the exercise of optionsOther changes
Balance at the end of the financial period
Directors
A Kiernan 357,976 750,000 6,157 1,114,133
M Young 234,000 1,000,000 39,001 1,273,001
S Chadwick 233,334 500,000 (200,000) 533,334
G Higgo 23,334 - - 23,334
G Higgo* - 500,000 - 500,000
T Ransted 190,800 500,000 (68,199) 622,601
G Baldwin - - - -
Executives
M Ball - - 8,000 8,000
S Storm - - - -
B Duncan - - - -
1,039,444 3,250,000 (215,041) 4,074,403
* - Subsequent to year end, these shares were transferred to the beneficial owner, Consolidated Iron Pty Ltd.
Consolidated Entity 2011
Number of Options
Balance at the start of
the financial period
Granted as compensation
ExercisedOptions lapsed/
cancelled
Balance at the end of
the financial period
Vested and exercisable at 30 June
2011
Unvested
Directors
A Kiernan - - - - - - -
M Young 1,000,000 - (500,000) - 500,000 500,000 -
S Chadwick - - - - - - -
T Ransted - - - - - - -
G Baldwin - - - - - - -
D Coyne - - - - - - -
Executives
M Ball 500,000 - (500,000) - - - -
B Duncan 500,000 - (500,000) - - - -
2,000,000 - (1,500,000) - 500,000 500,000 -
Consolidated Entity 2010
Number of Options
Balance at the start of the
financial year
Granted as compensation
ExercisedOptions lapsed/
cancelled
Balance at the end of the financial year
Vested and exercisable at 30 June
2010
Unvested
Directors
A Kiernan 750,000 - (750,000) - - - -
M Young 2,000,000 - (1,000,000) - 1,000,000 1,000,000 -
S Chadwick 500,000 - (500,000) - - - -
G Higgo* 500,000 - (500,000) - - - -
T Ransted 500,000 - (500,000) - - - -
G Baldwin - - - - - - -
Executives
M Ball - 500,000 - - 500,000 100,000 400,000
S Storm - 500,000 - 200,000 300,000 150,000 150,000
B Duncan 500,000 - - - 500,000 300,000 200,000
4,750,000 1,000,000 (3,250,000) 200,000 2,300,000 1,550,000 750,000
* - Subsequent to year end, these shares were transferred to the beneficial owner, Consolidated Iron Pty Ltd.
NoteS to the FINANCIAL StAtemeNtSfor the year ended 30 June 2011 continued
For
per
sona
l use
onl
y

BC Iron Limited – Financials 37 Annual Report 2011
NoteS to the FINANCIAL StAtemeNtSfor the year ended 30 June 2011 continued
NOTE 22 - KEY MANAGEMENT PERSONNEL DISCLOSURE (Continued)(c) Other transactions with Key Management Personnel
Disclosures relating to key management personnel are set out below. The following transactions occurred with related parties:
Consolidated Entity 2011 $
Consolidated Entity 2010 $
Transactions between related parties are on normal commercial terms no more favourable than those available to other parties unless otherwise stated.
Key Management Personnel
Professional fees paid to Mr Kiernan, a director, for services in excess of normal director duties.
100,000 45,000
Total 100,000 45,000
There are no amounts outstanding at the reporting date (2010 – Nil) in relation to transactions with related parties.
NOTE 23 – CONTINGENT LIABILITIES AND ASSETS
The Group is bound to the Minister in the State of Western Australia to the sum of $122,500 security in order to comply with the conditions of the leases for the mining tenements.
NOTE 24 - SEGMENTAL INFORMATION
Management has determined that the company has one reportable segment, being mineral exploration, development and production in Western Australia. As the company is focused on mineral exploration, development and production, the Board monitors the company based on actual versus budgeted expenditure incurred by area of interest. This internal reporting framework is the most relevant to assist the Board with making decisions regarding the company and its ongoing activities, while also taking into consideration the results of exploration and development work that has been performed to date.
Consolidated Entity 2011 $
Consolidated Entity 2010 $
Total segment revenue 19,087,764 482,998
Adjusted EBITDA 19,087,764 482,998
Total segment assets 103,439,981 54,815,339
Total segment liabilities 17,051,603 1,864,897
Reconciliation of reportable segment profit or loss
Adjusted EBITDA 19,087,764 482,998
Interest revenue 1,081,361 1,045,292
Other income 2,119,795 500
Unallocated: Corporate Expenses (21,366,092) (3,939,726)
Profit/(Loss) before income tax 922,828 (2,410,936)
Segment liabilities 17,051,603 1,864,897
Deferred Tax Liabilities - -
Loans 19,001,001 13,954,966
Total liabilities as per the balance sheet 36,052,604 15,819,863 For
per
sona
l use
onl
y

BC Iron Limited 38 Annual Report 2011 – Financials
NoteS to the FINANCIAL StAtemeNtSfor the year ended 30 June 2011 continued
NOTE 25 – RELATED PARTY TRANSACTIONS
(a) Parent Entities
The parent entity within the group is BC Iron Limited. The parent entity owns 100% of BC Iron Nullagine Pty Ltd. This subsidiary has a 50% participating interest in the Nullagine Iron Ore Joint Venture.
(b) Transactions with related parties
Consolidated Entity 2011 $
Consolidated Entity 2010 $
Management fee income from Joint Arrangement 1,954,090 482,998
(c) Outstanding balances arising from sales/purchases of goods and services
The following balances are outstanding at the end of the reporting period in relation to transactions with related parties:
Consolidated Entity 2011 $
Consolidated Entity 2010 $
Current receivables
Joint Arrangement 945,004 934,322
Current payables - -
(d) Loans to/from related parties
Consolidated Entity 2011 $
Consolidated Entity 2010 $
Loans to joint arrangement 1,096,339 268,655
NOTE 26 - FINANCIAL RISK MANAGEMENT
The Group’s activities expose it to the following risks from their use of financial instruments: credit risk, liquidity risk and market risk. This note presents information about the Group’s exposure to each of the above risks, their objectives, policies and processes for measuring and managing risk.
The Group holds the following financial instruments:
Consolidated Entity 2011 $
Consolidated Entity 2010 $
Financial assets
Cash and cash equivalents 17,536,827 28,762,976
Deposits 242,765 250,436
Trade and other receivables 7,148,015 2,032,700
24,927,607 31,046,112
Financial liabilities at amortised cost
Trade and other payables 16,131,009 1,739,897
Loans & Borrowings 19,001,001 13,954,966
35,132,010 15,694,863For
per
sona
l use
onl
y

BC Iron Limited – Financials 39 Annual Report 2011
NoteS to the FINANCIAL StAtemeNtSfor the year ended 30 June 2011 continued
NOTE 26 - FINANCIAL RISK MANAGEMENT (Continued)
(a) Market risk
(i) Foreign exchange riskBC Iron’s policy is, where possible, to allow group entities to settle foreign liabilities with the cash generated from their own operations in that currency. BC Iron is exposed to currency risk on cash reserves and borrowings. The groups’ exposure to foreign currency risk, expressed in Australian dollar, was as follows:
Consolidated Entity 2011 $
Consolidated Entity 2010 $
Exchange Rate 1.059
Financial Assets
Cash and cash equivalents AUD 2,995,584 4,046,596
USD 3,172,323 3,447,700
Debtors AUD 3,105,152 -
USD 3,288,356 -
Financial Liabilities
Borrowings AUD (23,607,177) (17,605,634)
USD (25,000,000) (15,000,000)
Financial Profit
Sales Revenue AUD 17,133,674 -
USD 18,167,289 -
Sensitivity AnalysisA five per cent strengthening of the US dollar against the Australian dollar at 30 June 2011 on a net basis would have increased the group’s pre-tax profit by $38,190 (2010: $645,668) primarily through a lower valuation of BCI’s US borrowings. A five per cent benchmark is used by the Group based upon potential forward rate movements of foreign exchange rates.
(ii) Cash flow and fair value interest rate riskAlthough the Group has significant interest bearing assets, the Group’s income and operating cash flows are substantially independent of changes in market interest rates. The Group monitors interest rates to obtain the best terms and mix of cash flow.
As at the reporting date, the Group had the following variable rate deposits and there were no interest rate swap contracts outstanding:
Consolidated Entity 2011 Weighted average
interest rate %
Balance $
Consolidated Entity 2010 Weighted average
interest rate %
Balance $
Deposits 242,765 250,436
Other cash available 17,536,827 28,762,976
Net exposure to cash flow interest rate risk 6.8% 17,779,592 3.6% 29,013,412
The group’s borrowings are carried at amortised cost. They are therefore not subject to interest rate risk.
The Group analyses its interest rate exposure each time a deposit term expires. The Group aims to maximise interest returns from available funds and at the same time retain operating flexibility through adequate access to funds.
Sensitivity AnalysisIf interest rates had been 50 basis points higher or lower than the prevailing rates as at 30 June 2011, with all other variables held constant, there would be an immaterial change in post-tax loss for the year. Equity would not have been impacted (2010 – immaterial impact). 50 basis points benchmark is used by the Group based upon potential forward rate movements of interest rates.
For
per
sona
l use
onl
y

BC Iron Limited 40 Annual Report 2011 – Financials
NoteS to the FINANCIAL StAtemeNtSfor the year ended 30 June 2011 continued
NOTE 26 - FINANCIAL RISK MANAGEMENT (continued)
(b) Credit risk
Credit risk arises from cash and cash equivalents and deposits with financial institutions. For banks and financial institutions, only independently rated parties with a minimum rating of “A” are accepted in accordance with ratings guidelines of major global credit rating agencies. The carrying amount of financial assets recorded in the financial statements, net of any allowances for losses, represents the Group’s maximum exposure to credit risk without taking account of the fair value of any collateral or other security obtained.
The maximum exposure to credit risk at the reporting date is the carrying amount of the financial assets as summarised at the beginning of this note. All receivables at 30 June 2011 were received within two months.
The credit quality of financial assets that are neither past due nor impaired can be assessed by reference to external credit ratings (if available) or to historical information about counterparty default rates:
Consolidated Entity 2011 $
Consolidated Entity 2010 $
Trade receivables
Counterparties without external credit rating
Group 1 3,105,152 -
Group 2 4,042,862 2,032,700
Group 3 - -
Total trade receivables 7,148,015 2,032,700
Cash at bank and short-term deposits
AA 17,779,592 29,013,412
17,779,592 29,013,412
Group 1 – new customers (less than 6 months) Group 2 – existing customers (more than 6 months) with no defaults in the past. Group 3 – existing customers (more than 6 months) with some defaults in the past. All defaults were fully recovered.
(c) Liquidity risk
Prudent liquidity management involves the maintenance of sufficient cash and access to capital markets. It is the policy of the board to ensure that the Group is able to meet its financial obligations and maintain the flexibility to pursue attractive investment opportunities through keeping committed credit lines available where possible, ensuring the Group has sufficient working capital and preserving the 15% share issue limit available to the Group under the ASX Listing Rules.
Financing arrangementsOn 2 July 2010, the Nullagine Iron Ore Joint Venture received US$20 million (the Group’s share is US$10million) being the third and final instalment of funding under the US$50 million financing facility with Henghou Industries (Hong Kong) Limited. Refer Note 16.
Maturity analysis of financial assets and liabilities.The Group’s exposure to interest rate risk and the effective weighted average interest rate by maturity periods is set out in the following tables. The tables below analyses the Group’s maturity based upon their contractual maturities and are disclosed at their undiscounted amounts.
For
per
sona
l use
onl
y

BC Iron Limited – Financials 41 Annual Report 2011
NoteS to the FINANCIAL StAtemeNtSfor the year ended 30 June 2011 continued
NOTE 26 - FINANCIAL RISK MANAGEMENT (continued)
(c) Liquidity risk (Continued)
Consolidated Entity Year ended 30 June 2011
<6 months 6-12 months 1-5 years >5 yearsTotal
Contractual Cash flows
Carrying Amount
Financial assets
Cash & cash equivalents 17,536,827 - - - 17,536,827 17,536,827
Deposits - 242,765 - - 242,765 242,765
Trade & other receivables 7,148,015 - - - 5,929,330 7,148,015
24,684,842 242,765 - - 23,708,922 24,927,607
Financial liabilities
Trade & other payables 16,131,009 - - - 16,131,009 16,131,009
Borrowings 4,721,435 - 18,885,742 - 23,607,177 23,607,177
20,852,444 - 18,885,742 - 39,738,186 39,738,186
Net maturity 3,832,397 242,765 (18,885,742) - (16,029,264) (14,810,579)
Consolidated Entity Year ended 30 June 2010
<6 months 6-12 months 1-5 years >5 yearsTotal
Contractual Cash flows
Carrying Amount
Financial assets
Cash & cash equivalents 28,762,976 - - - 28,762,976 28,762,976
Deposits - 250,436 - - 250,436 250,436
Trade & other receivables 2,032,700 - - - 1,764,046 2,032,700
30,795,676 250,436 - - 30,777,457 31,046,112
Financial liabilities
Trade & other payables 1,739,897 - - - 1,739,897 1,739,897
Borrowings - - 17,605,634 - 17,605,634 17,605,634
1,739,897 - 17,605,634 - 19,345,531 19,345,531
Net maturity 29,055,779 250,436 (17,605,634) - 11,431,927 11,700,581
NOTE 27 – RECONCILIATION OF PROFIT/(LOSS) AFTER INCOME TAX TO NET CASH OUTFLOW FROM OPERATING ACTIVITIES
Consolidated Entity 2011 $
Consolidated Entity 2010 $
Profit/(loss) for the financial year 984,525 (1,385,383)
Non cash flows in operating profit/(loss)
Depreciation 626,474 91,068
Movements in provisions 795,594 162,836
Employee benefit - shared-based payment 499,647 818,226
Changes in operating assets and liabilities
Decrease / (increase) in trade and other receivables (5,115,314) (1,553,479)
(Decrease) / increase in trade and other payables 13,332,327 989,597
(increase) / decrease in deferred tax assets (276,486) -
(increase) in inventories (7,689,636) -
Net cash inflows/(outflows) by operating activities 3,157,130 (877,135)
On 12 February 2010, BCI issued 8,000,000 options as non cash consideration for the Henghou loan facility (see Note 16).
For
per
sona
l use
onl
y

BC Iron Limited 42 Annual Report 2011 – Financials
NoteS to the FINANCIAL StAtemeNtSfor the year ended 30 June 2011 continued
NOTE 28 – SHARE-BASED PAYMENTS
During the 2011 financial year the Group provided share based payments to Employees only, whereas in the 2010 financial year they were also granted to Consultants and Financers. An employee share option incentive plan was approved at a shareholder’s general meeting on 17 July 2008. Under the terms of the plan the Board may offer options at no more than nominal consideration to employees or directors (the latter subject to shareholder approval) based on a number of criteria, including contribution to the Group, period of employment, potential contribution to the Group in the future and other factors the Board considers relevant.
Set out below is a summary of the options granted by the Group:
2011
Grant dateExpiry date
Exercise price
Balance at the start of
the year
Granted during the financial period
Exercised during the financial period
Forfeited during the financial period
Balance at end of the financial period
Vesting date
Vested and exercisable
at end of financial period
Director options
17/7/08 15/8/11 $1.85 500,000 - 250,000 - 250,000 15/2/09 250,000
17/7/08 15/8/11 $2.00 500,000 - 250,000 - 250,000 15/2/10 250,000
Others
1/8/09 1/8/12 $1.25 150,000 - 150,000 - - 1/8/09 -
1/8/09 1/8/12 $1.40 150,000 - - - 150,000 1/8/10 150,000
16/4/09 31/3/12 $0.65 250,000 - 250,000 - - 16/4/09 -
30/6/09 31/3/12 $0.90 250,000 - 250,000 - - 30/6/09 -
12/4/10 19/2/15 $1.50 250,000 - - - 250,000 1/1/11 250,000
12/4/10 19/2/15 $1.50 250,000 - - - 250,000 1/1/11 250,000
12/2/10 11/2/12 $1.35 6,000,000 - - - 6,000,000 6/7/10 6,000,000
12/2/10 11/2/12 $1.50 2,000,000 - - - 2,000,000 6/7/10 2,000,000
Employee options
21/8/08 21/8/11 $1.25 100,000 - 100,000 - - 21/8/08 -
21/8/08 21/8/11 $1.50 200,000 - 200,000 - - 21/8/08 -
21/8/08 21/8/11 $2.00 200,000 - 200,000 - - 21/8/08 -
1/8/09 1/8/12 $1.25 100,000 - 70,000 - 30,000 16/4/09 30,000
1/8/09 1/8/12 $1.40 200,000 - - - 200,000 1/8/10 200,000
1/8/09 1/8/12 $1.60 200,000 - - - 200,000 31/1/11 200,000
3/9/09 3/9/12 $1.25 100,000 - 100,000 - - 1/8/09 -
3/9/09 3/9/12 $1.40 150,000 - 150,000 - - 3/9/10 -
3/9/09 3/9/12 $1.60 250,000 - 250,000 - - 31/1/11 -
5/11/09 5/11/12 $1.25 100,000 - - - 100,000 3/12/09 100,000
5/11/09 5/11/12 $1.50 150,000 - - - 150,000 5/11/10 150,000
5/11/09 5/11/12 $2.00 150,000 - - - 150,000 31/1/11 150,000
9/7/10 30/6/13 $2.36 - 50,000 50,000 - - 9/7/10 -
9/7/10 30/6/13 $2.53 - 100,000 100,000 - - 31/1/11 -
9/7/10 30/6/13 $2.77 - 100,000 100,000 - - 31/1/11 -
9/7/10 30/6/13 $2.39 - 50,000 - - 50,000 2/11/10 50,000
9/7/10 30/6/13 $2.64 - 50,000 - - 50,000 15/12/10 50,000
9/7/10 30/6/13 $2.89 - 75,000 - - 75,000 31/1/11 75,000
9/7/10 30/6/13 $3.14 - 75,000 - - 75,000 31/1/11 75,000
Weighted average exercise price $1.45 $2.70 $1.46 $1.46
For
per
sona
l use
onl
y
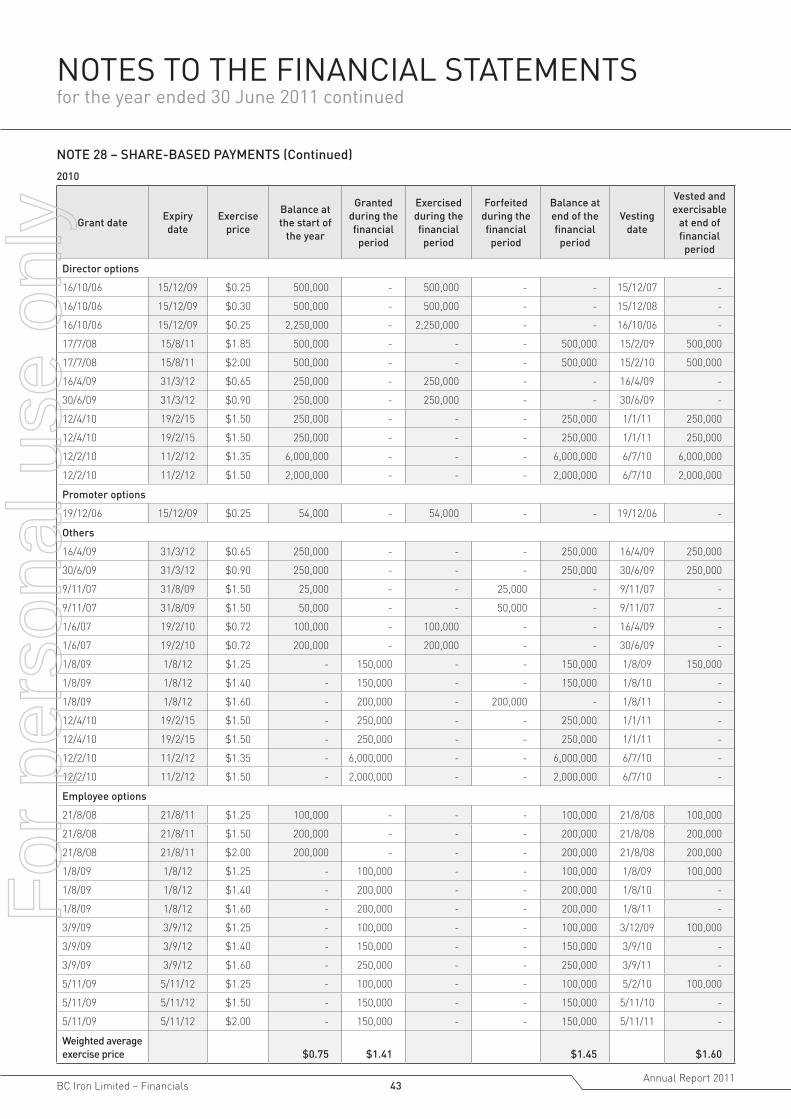
BC Iron Limited – Financials 43 Annual Report 2011
NoteS to the FINANCIAL StAtemeNtSfor the year ended 30 June 2011 continued
NOTE 28 – SHARE-BASED PAYMENTS (Continued)
2010
Grant dateExpiry date
Exercise price
Balance at the start of
the year
Granted during the financial period
Exercised during the financial period
Forfeited during the financial period
Balance at end of the financial period
Vesting date
Vested and exercisable
at end of financial period
Director options
16/10/06 15/12/09 $0.25 500,000 - 500,000 - - 15/12/07 -
16/10/06 15/12/09 $0.30 500,000 - 500,000 - - 15/12/08 -
16/10/06 15/12/09 $0.25 2,250,000 - 2,250,000 - - 16/10/06 -
17/7/08 15/8/11 $1.85 500,000 - - - 500,000 15/2/09 500,000
17/7/08 15/8/11 $2.00 500,000 - - - 500,000 15/2/10 500,000
16/4/09 31/3/12 $0.65 250,000 - 250,000 - - 16/4/09 -
30/6/09 31/3/12 $0.90 250,000 - 250,000 - - 30/6/09 -
12/4/10 19/2/15 $1.50 250,000 - - - 250,000 1/1/11 250,000
12/4/10 19/2/15 $1.50 250,000 - - - 250,000 1/1/11 250,000
12/2/10 11/2/12 $1.35 6,000,000 - - - 6,000,000 6/7/10 6,000,000
12/2/10 11/2/12 $1.50 2,000,000 - - - 2,000,000 6/7/10 2,000,000
Promoter options
19/12/06 15/12/09 $0.25 54,000 - 54,000 - - 19/12/06 -
Others
16/4/09 31/3/12 $0.65 250,000 - - - 250,000 16/4/09 250,000
30/6/09 31/3/12 $0.90 250,000 - - - 250,000 30/6/09 250,000
9/11/07 31/8/09 $1.50 25,000 - - 25,000 - 9/11/07 -
9/11/07 31/8/09 $1.50 50,000 - - 50,000 - 9/11/07 -
1/6/07 19/2/10 $0.72 100,000 - 100,000 - - 16/4/09 -
1/6/07 19/2/10 $0.72 200,000 - 200,000 - - 30/6/09 -
1/8/09 1/8/12 $1.25 - 150,000 - - 150,000 1/8/09 150,000
1/8/09 1/8/12 $1.40 - 150,000 - - 150,000 1/8/10 -
1/8/09 1/8/12 $1.60 - 200,000 - 200,000 - 1/8/11 -
12/4/10 19/2/15 $1.50 - 250,000 - - 250,000 1/1/11 -
12/4/10 19/2/15 $1.50 - 250,000 - - 250,000 1/1/11 -
12/2/10 11/2/12 $1.35 - 6,000,000 - - 6,000,000 6/7/10 -
12/2/10 11/2/12 $1.50 - 2,000,000 - - 2,000,000 6/7/10 -
Employee options
21/8/08 21/8/11 $1.25 100,000 - - - 100,000 21/8/08 100,000
21/8/08 21/8/11 $1.50 200,000 - - - 200,000 21/8/08 200,000
21/8/08 21/8/11 $2.00 200,000 - - - 200,000 21/8/08 200,000
1/8/09 1/8/12 $1.25 - 100,000 - - 100,000 1/8/09 100,000
1/8/09 1/8/12 $1.40 - 200,000 - - 200,000 1/8/10 -
1/8/09 1/8/12 $1.60 - 200,000 - - 200,000 1/8/11 -
3/9/09 3/9/12 $1.25 - 100,000 - - 100,000 3/12/09 100,000
3/9/09 3/9/12 $1.40 - 150,000 - - 150,000 3/9/10 -
3/9/09 3/9/12 $1.60 - 250,000 - - 250,000 3/9/11 -
5/11/09 5/11/12 $1.25 - 100,000 - - 100,000 5/2/10 100,000
5/11/09 5/11/12 $1.50 - 150,000 - - 150,000 5/11/10 -
5/11/09 5/11/12 $2.00 - 150,000 - - 150,000 5/11/11 -
Weighted average exercise price $0.75 $1.41 $1.45 $1.60
For
per
sona
l use
onl
y

BC Iron Limited 44 Annual Report 2011 – Financials
NoteS to the FINANCIAL StAtemeNtSfor the year ended 30 June 2011 continued
NOTE 28 – SHARE-BASED PAYMENTS (Continued)
The weighted average remaining contractual life of share options outstanding at the end of the financial period was 2 years (2011 –2012 financial years)
Options granted carry no dividend or voting rights.
When exercisable, each option is convertible into one ordinary share.
(a) Director option expense
Share options have been granted to provide long-term incentive for Directors to deliver long-term shareholder returns.
(b) Employee option expense
Share options have been granted to provide long-term incentive for senior employees to deliver long-term shareholder returns. Participation in employee share options is at the Board’s discretion and no individual has a contractual right to participate in a plan or to receive any guaranteed benefits.
(c) Other option expense
Share options have been granted to Consultants in 2010 for their services as consideration for the provision of services with respect to broker support and capital raising costs.
During the year the Group issued the following share based payments to Directors, Employees, Consultants and Financiers. The fair value at grant date has been independently determined using a Black-Scholes option pricing model that takes into account the following inputs:
2011
Grant date
Expiry dateExercise
price
Granted during the
year
Vesting Date
Fair value at grant date of options
Share price on
grant date
Expected Volatility
Option life
Expected Dividends
Risk-free interest
rate
Employee options
9/07/2010 30/06/2013 $2.36 50,000 09-Jul-10 $0.64 $1.64 70% 3 years 0% 4.57%
9/07/2010 30/06/2013 $2.53 100,000 31-Jan-11 $0.61 $1.64 70% 3 years 0% 4.57%
9/07/2010 30/06/2013 $2.77 100,000 31-Jan-11 $0.57 $1.64 70% 3 years 0% 4.57%
9/07/2010 30/06/2013 $2.39 50,000 02-Nov-10 $0.64 $1.64 70% 3 years 0% 4.57%
9/07/2010 30/06/2013 $2.64 50,000 15-Dec-10 $0.59 $1.64 70% 3 years 0% 4.57%
9/07/2010 30/06/2013 $2.89 75,000 31-Jan-11 $0.56 $1.64 70% 3 years 0% 4.57%
9/07/2010 30/06/2013 $3.14 75,000 31-Jan-11 $0.52 $1.64 70% 3 years 0% 4.57%
2010
Grant date
Expiry date
Exercise price
Granted during the
year
Vesting Date
Fair value at grant date of options
Share price on
grant date
Expected Volatility
Option life
Expected Dividends
Risk-free interest
rate
Employee options
01/8/09 01/8/12 $1.25 100,000 01-Aug-09 $0.64 $1.05 100% 3 years 0% 4.94%
01/8/09 01/8/12 $1.40 200,000 01-Aug-10 $0.62 $1.05 100% 3 years 0% 4.94%
01/8/09 01/8/12 $1.60 200,000 01-Aug-11 $0.59 $1.05 100% 3 years 0% 4.94%
05/11/09 05/11/12 $1.25 100,000 10-Feb-10 $0.65 $1.08 100% 3 years 0% 3.13%
05/11/09 05/11/12 $1.50 150,000 05-Nov-10 $0.61 $1.08 100% 3 years 0% 3.13%
05/11/09 05/11/12 $2.00 150,000 05-Nov-11 $0.55 $1.08 100% 3 years 0% 3.13%
Key Management Personnel options
01/8/09 01/8/12 $1.25 150,000 01-Aug-09 $0.64 $1.05 100% 3 years 0% 4.94%
01/8/09 01/8/12 $1.40 150,000 01-Aug-10 $0.62 $1.05 100% 3 years 0% 4.94%
01/8/09 01/8/12 $1.60 200,000 01-Aug-11 $0.59 $1.05 100% 3 years 0% 4.94%
03/9/09 03/9/12 $1.25 100,000 03-Dec-09 $0.56 $0.97 100% 3 years 0% 3.13%
03/9/09 03/9/12 $1.40 150,000 03-Sep-10 $0.54 $0.97 100% 3 years 0% 3.13%
03/9/09 03/9/12 $1.60 250,000 03-Sep-11 $0.52 $0.97 100% 3 years 0% 3.13%
Other options
12/4/10 19/2/15 $1.50 250,000 01-Jan-11 $1.62 $2.02 100% 5 years 0% 5.54%
12/4/10 19/2/15 $1.50 250,000 01-Jan-11 $1.62 $2.02 100% 5 years 0% 5.54%
For
per
sona
l use
onl
y

BC Iron Limited – Financials 45 Annual Report 2011
NoteS to the FINANCIAL StAtemeNtSfor the year ended 30 June 2011 continued
NOTE 28 – SHARE-BASED PAYMENTS (continued)
(d) Financier Options
Share Options have been issued to Henghou as part of the borrowing facility. Refer Note 16.
The costs of share-based payments to financiers are measured by reference to the difference between the nominal value and net present value of the finance facility provided. The net present value is determined based upon a market comparable discount rate applicable to similar size companies within the mining sector. The net present value is calculated using the weighted average cost of capital of 11%. The option details are set out below:
2011
Grant date Expiry date Exercise priceGranted during the
prior yearVesting period Cost
Financier
12-Feb-10 11-Feb-12 $1.35 6,000,000 07-Jul-10 $2,124,846
12-Feb-10 11-Feb-12 $1.50 2,000,000 07-Jul-10 $2,484,855
2010
Grant date Expiry date Exercise priceGranted during the
prior yearVesting period Cost
Financier
12-Feb-10 11-Feb-12 $1.35 6,000,000 07-Jul-10 $1,776,369
12-Feb-10 11-Feb-12 $1.50 2,000,000 07-Jul-10 $2,495,149
(e) Expenses arising from share-based payment transactions
Total expenses arising from share-based payments recognised during the financial period as share based payments expense was:
Consolidated Entity 2011 $
Consolidated Entity 2010 $
Director benefits - 60,405
Employee benefits 491,549 577,675
Consultant benefits 8,099 180,145
Total Share Options expensed 499,648 818,225
Consultant benefits (share options capitalised) 566,201 241,784
Total Share Options 1,065,849 1,060,009
For
per
sona
l use
onl
y

BC Iron Limited 46 Annual Report 2011 – Financials
NoteS to the FINANCIAL StAtemeNtSfor the year ended 30 June 2011 continued
NOTE 29 – INTEREST IN JOINT ARRANGEMENT
(a) Jointly controlled assets
On 1 January 2010, the Group and Fortescue Metals Group commenced a Joint Venture to develop the Nullagine Iron Ore Project in the East Pilbara of Western Australia. The subsidiary, BC Iron Nullagine Pty Ltd has a 50% participating interest in this joint venture. The group’s interests in the assets employed in the joint venture are included in the consolidated statement of financial position, in accordance with the accounting policy described in note 1(b). The Group has a 50% share of the following financial information:
Consolidated Entity 2011 $
Consolidated Entity 2010 $
CURRENT ASSETS
Cash and cash equivalents 15,556,665 18,550,803
Trade and other receivables 3,311,111 1,140,454
Inventory 18,047,326 3,931,759
Other financial assets 24,375 -
Total Current Assets 36,939,477 23,623,016
NON CURRENT ASSETS
Plant & equipment 74,613,031 7,696,412
Exploration and evaluation assets 3,131,454 1,562,269
Development expenditure 40,592,619 11,771,858
Other assets 2,293,000 -
Total Non-Current Assets 120,630,105 21,030,539
TOTAL ASSETS 157,569,581 44,653,556
CURRENT LIABILITIES
Loans & Borrowings 9,442,871 -
Trade and other payables 29,347,067 3,922,085
Total Current Liabilities 38,789,937 3,922,085
NON-CURRENT LIABILITIES
Loans & Borrowings 39,964,162 35,748,577
Provisions 1,841,188 250,000
Total Non-Current Liabilities 41,805,350 35,998,577
TOTAL LIABILITIES 80,595,288 39,920,662
NET ASSETS 76,974,294 4,732,893
For
per
sona
l use
onl
y

BC Iron Limited – Financials 47 Annual Report 2011
NoteS to the FINANCIAL StAtemeNtSfor the year ended 30 June 2011 continued
NOTE 29 – INTEREST IN JOINT ARRANGEMENT (Continued)
(b) Mining Tenement Leases
In order to maintain current rights of tenure to exploration tenements the Entity is required to perform minimum exploration work to meet the minimum expenditure requirements specified by the WA State Government and pay tenement lease rents.
The estimated exploration expenditure commitment for the ensuing year, but not recognised as a liability in the financial statements:
Consolidated Entity 2011 $
Consolidated Entity 2010 $
Within one year 1,041,023 815,199
Later than one year but less than five years 5,277,092 4,914,796
Later than five years - -
6,318,116 5,729,996
(c) Capital Commitments
Prior to 30th of June the Joint Arrangement executed a contract with Watpac Civil and Mining for the construction of the Haul Road. Completion commitments are as per below:
Consolidated Entity 2011 $
Consolidated Entity 2010 $
Within one year 7,500,000 7,723,792
Later than one year but less than five years - -
Later than five years - -
7,500,000 7,723,792
For
per
sona
l use
onl
y

BC Iron Limited 48 Annual Report 2011 – Financials
NoteS to the FINANCIAL StAtemeNtSfor the year ended 30 June 2011 continued
NOTE 30 - PARENT ENTITY
The following details information related to the parent entity, BC Iron Ltd, as at 30 June 2011. The information presented here has been prepared using consistent accounting policies as presented in Note 2.
Parent Entity 2011 $
Parent Entity 2010 $
CURRENT ASSETS
Cash and cash equivalents 3,260,137 19,346,835
Trade and other receivables 27,742,409 1,093,643
Other financial assets 230,577 250,436
Total Current Assets 31,233,123 20,690,914
NON CURRENT ASSETS
Other financial assets 16,632,360 16,632,360
Plant & equipment 248,785 269,284
Exploration and evaluation assets 419,838 294,775
Deferred Tax Assets 6,565,060 5,187,853
Total Non-Current Assets 23,866,043 22,384,272
TOTAL ASSETS 55,099,166 43,075,186
CURRENT LIABILITIES
Trade and other payables 984,200 8,255,710
Total Current Liabilities 984,200 8,255,710
TOTAL LIABILITIES 984,200 8,255,710
NET ASSETS 54,114,966 34,819,476
EQUITY
Contributed Equity 58,250,587 36,518,762
Share based payment reserve 1,603,494 1,794,091
Options exercised reserve 1,901,285 644,839
Accumulated losses (7,640,400) (4,138,216)
TOTAL EQUITY 54,114,966 34,819,476
Revenue from continuing operations - -
Other income 834,933 859,959
Total Expenses (6,587,685) (3,113,314)
Income tax benefit 2,250,569 963,490
Profit/(loss) for the year (3,502,183) (1,289,865)
Included in the Commitments note 21 are commitment incurred by the parent entity relating to the lease of offices in West Perth, Western Australia, under a non-cancellable operating lease expiring August 2016.
NOTE 31 – EVENTS OCCURING AFTER THE REPORTING DATE
No matters or circumstances have arisen since the end of the financial year which significantly affected or may significantly affect the operations of the Group, the results of those operations, or the state of affairs of the Group in financial periods subsequent to the financial year ended 30 June 2011.
For
per
sona
l use
onl
y

BC Iron Limited – Financials 49 Annual Report 2011
INDepeNDeNt AuDItor’S reportfor the year ended 30 June 2011
Error! Unknown document property name.Error! Unknown document property name.
1
BDO Audit (WA) Pty Ltd ABN 79 112 284 787 is a member of a national association of independent entities which are all members of BDO (Australia) Ltd ABN 77 050 110 275, an Australian company limited by guarantee. BDO Audit (WA) Pty Ltd and BDO (Australia) Ltd are members of BDO International Ltd, a UK company limited by guarantee, and form part of the international BDO network of independent member firms. Liability limited by a scheme approved under Professional Standards Legislation (other than for the acts or omissions of financial services licensees) in each State or Territory other than Tasmania.
Tel: +8 6382 4600Fax: +8 6382 4601 www.bdo.com.au
38 Station Street Subiaco, WA 6008 PO Box 700 West Perth WA 6872 Australia
INDEPENDENT AUDITOR’S REPORT TO THE MEMBERS OF BC IRON LIMITED
Report on the Financial Report
We have audited the accompanying financial report of BC Iron Limited, which comprises the consolidated statement of financial position as at 30 June 2011, the consolidated statement of comprehensive income, the consolidated statement of changes in equity and the consolidated statement of cash flows for the year then ended, notes comprising a summary of significant accounting policies and other explanatory information, and the directors’ declaration of the consolidated entity comprising the company and the entity it controlled at the year’s end or from time to time during the financial year.
Directors’ Responsibility for the Financial Report
The directors of the company are responsible for the preparation of the financial report that gives a true and fair view in accordance with Australian Accounting Standards and the Corporations Act 2001 and for such internal control as the directors determine is necessary to enable the preparation of the financial report that is free from material misstatement, whether due to fraud or error. In Note 1, the directors also state, in accordance with Accounting Standard AASB 101 Presentation of Financial Statements, that the financial statements comply with International Financial Reporting Standards.
Auditor’s Responsibility
Our responsibility is to express an opinion on the financial report based on our audit. We conducted our audit in accordance with Australian Auditing Standards. Those standards require that we comply with relevant ethical requirements relating to audit engagements and plan and perform the audit to obtain reasonable assurance about whether the financial report is free from material misstatement.
An audit involves performing procedures to obtain audit evidence about the amounts and disclosures in the financial report. The procedures selected depend on the auditor’s judgement, including the assessment of the risks of material misstatement of the financial report, whether due to fraud or error. In making those risk assessments, the auditor considers internal control relevant to the entity’s preparation of the financial report that gives a true and fair view in order to design audit procedures that are appropriate in the circumstances, but not for the purpose of expressing an opinion on the effectiveness of the entity’s internal control. An audit also includes evaluating the appropriateness of accounting policies used and the reasonableness of accounting estimates made by the directors, as well as evaluating the overall presentation of the financial report.
We believe that the audit evidence we have obtained is sufficient and appropriate to provide a basis for our audit opinion.
Independence
In conducting our audit, we have complied with the independence requirements of the Corporations Act 2001. We confirm that the independence declaration required by the Corporations Act 2001,which has been given to the directors of BC Iron Limited, would be in the same terms if given to the directors as at the time of this auditor’s report.
For
per
sona
l use
onl
y

BC Iron Limited 50 Annual Report 2011 – Financials
INDepeNDeNt AuDItor’S reportfor the year ended 30 June 2011 continued
Opinion
In our opinion: (a) The financial report of BC Iron Limited is in accordance with the Corporations Act 2001,
including: (i) giving a true and fair view of the consolidated entity’s financial position as at 30 June
2011 and of its performance for the year ended on that date; and (ii) complying with Australian Accounting Standards and the Corporations Regulations 2001;
and(b) The financial report also complies with International Financial Reporting Standards as disclosed
in Note 1.
Report on the Remuneration Report
We have audited the Remuneration Report included in the directors’ report for the year ended 30 June 2011. The directors of the company are responsible for the preparation and presentation of the Remuneration Report in accordance with section 300A of the Corporations Act 2001. Our responsibility is to express an opinion on the Remuneration Report, based on our audit conducted in accordance with Australian Auditing Standards.
Auditor’s Opinion
In our opinion, the Remuneration Report of BC Iron Limited for the year ended 30 June 2011, complies with section 300A of the Corporations Act 2001.
BDO Audit (WA) Pty Ltd
Peter TollDirector
Perth, Western Australia Dated this 7th day of September 2011
For
per
sona
l use
onl
y

BC Iron Limited – Financials 51 Annual Report 2011
DeCLArAtIoN oF INDepeNDeNCefor the year ended 30 June 2011
BDO Audit (WA) Pty Ltd ABN 79 112 284 787 is a member of a national association of independent entities which are all members of BDO (Australia) Ltd ABN 77 050 110 275, an Australian company limited by guarantee. BDO Audit (WA) Pty Ltd and BDO (Australia) Ltd are members of BDO International Ltd, a UK company limited by guarantee, and form part of the international BDO network of independent member firms. Liability limited by a scheme approved under Professional Standards Legislation (other than for the acts or omissions of financial services licensees) in each State or Territory other than Tasmania.
Tel: +8 6382 4600Fax: +8 6382 4601 www.bdo.com.au
38 Station Street Subiaco, WA 6008 PO Box 700 West Perth WA 6872 Australia
7 September 2011
The Directors BC Iron Limited Level 1, 15 Rheola Street WEST PERTH WA 6005
Dear Sirs,
DECLARATION OF INDEPENDENCE BY PETER TOLL TO THE DIRECTORS OF BC IRON LIMITED
As lead auditor of BC Iron Limited for the period ended 30 June 2011, I declare that, to the best of my knowledge and belief, there have been no contraventions of:
• the auditor independence requirements of the Corporations Act 2001 in relation to the audit; and
• any applicable code of professional conduct in relation to the audit.
This declaration is in respect of BC Iron Limited and the entities it controlled during the period.
Peter Toll Director
BDO Audit (WA) Pty Ltd Perth, Western Australia
For
per
sona
l use
onl
y