annual report 2011 - costco wholesale corporation
TRANSCRIPT

AnnualReport2011
2011YEAR ENDED AUGUST 28, 2011

THE COMPANY
Costco Wholesale Corporation and its subsidiaries (Costco or the Company) began operations in 1983in Seattle, Washington. In October 1993, Costco merged with The Price Company, which hadpioneered the membership warehouse concept, to form Price/Costco, Inc., a Delaware corporation. InJanuary 1997, after the spin-off of most of its non-warehouse assets to Price Enterprises, Inc., theCompany changed its name to Costco Companies, Inc. On August 30, 1999, the Companyreincorporated from Delaware to Washington and changed its name to Costco Wholesale Corporation,which trades on the NASDAQ Global Select Market under the symbol “COST.”
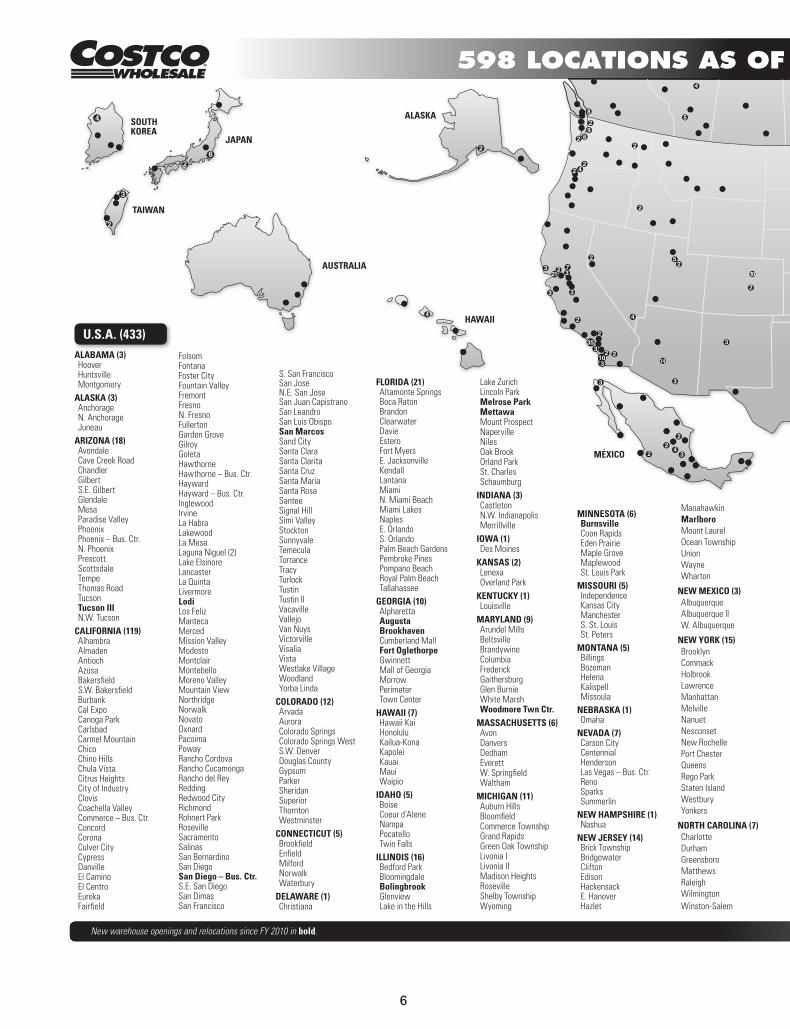
As of December 2011, the Company operated a chain of 598 warehouses in 40 states and Puerto Rico(433 locations), nine Canadian provinces (82 locations), the United Kingdom (22 locations), Korea(seven locations), Taiwan (eight locations, through a 55%-owned subsidiary), Japan (eleven locations),Australia (three locations), and 32 warehouses in Mexico through a 50%-owned joint venture.
CONTENTS
Financial Highlights . . . . . . . . . . . . . . . . . . . . . . . . . . . . . . . . . . . . . . . . . . . . . . . . . . . . . . . . . . . . . . . . . 1
Letter to Shareholders . . . . . . . . . . . . . . . . . . . . . . . . . . . . . . . . . . . . . . . . . . . . . . . . . . . . . . . . . . . . . . . 2
Map of Warehouse Locations . . . . . . . . . . . . . . . . . . . . . . . . . . . . . . . . . . . . . . . . . . . . . . . . . . . . . . . . . 6
Business Overview . . . . . . . . . . . . . . . . . . . . . . . . . . . . . . . . . . . . . . . . . . . . . . . . . . . . . . . . . . . . . . . . . . 8
Risk Factors . . . . . . . . . . . . . . . . . . . . . . . . . . . . . . . . . . . . . . . . . . . . . . . . . . . . . . . . . . . . . . . . . . . . . . . 14
Properties: Warehouses, Administration and Merchandise Distribution Properties . . . . . . . . . . . . . . 22
Market for Costco Common Stock, Dividend Policy and Stock Repurchase Program . . . . . . . . . . . . 23
Five Year Operating and Financial Highlights . . . . . . . . . . . . . . . . . . . . . . . . . . . . . . . . . . . . . . . . . . . . 24
Management’s Discussion and Analysis of Financial Condition and Results of Operations . . . . . . . 26
Directors, Executive Officers and Corporate Governance . . . . . . . . . . . . . . . . . . . . . . . . . . . . . . . . . . 41
Management’s Reports . . . . . . . . . . . . . . . . . . . . . . . . . . . . . . . . . . . . . . . . . . . . . . . . . . . . . . . . . . . . . . 42
Reports of Independent Registered Public Accounting Firm . . . . . . . . . . . . . . . . . . . . . . . . . . . . . . . . 44
Consolidated Financial Statements . . . . . . . . . . . . . . . . . . . . . . . . . . . . . . . . . . . . . . . . . . . . . . . . . . . . 46
Notes to Consolidated Financial Statements . . . . . . . . . . . . . . . . . . . . . . . . . . . . . . . . . . . . . . . . . . . . . 50
Directors and Officers of the Company . . . . . . . . . . . . . . . . . . . . . . . . . . . . . . . . . . . . . . . . . . . . . . . . . 82
Additional Information . . . . . . . . . . . . . . . . . . . . . . . . . . . . . . . . . . . . . . . . . . . . . . . . . . . . . . . . . . . . . . . 84
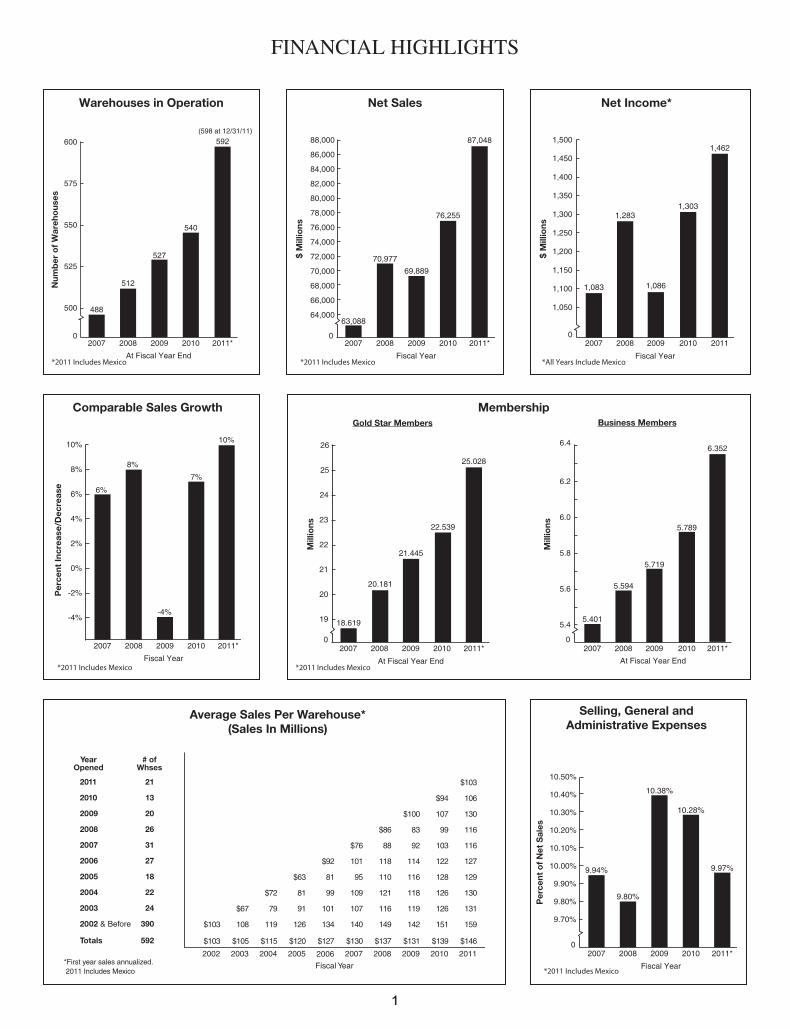
Warehouses in Operation
At Fiscal Year End
(598 at 12/31/11)
0
500
525
550
488
512
527
540
592
575
600
Num
ber
of
War
eho
uses
*2011 Includes Mexico
2007 2010 2011*20092008
Comparable Sales Growth
Fiscal Year
-4%
-2%
0%
2%
4%
6%
8%
10%
6%
8%
10%
-4%
7%
Per
cent
Incr
ease
/Dec
reas
e
*2011 Includes Mexico
2007 2010 2011*20092008
Selling, General andAdministrative Expenses
Fiscal Year
2007 20080
10.10%
10.20%
10.30%
10.40%
10.50%
9.90%
9.80%
10.00%
2009 2010 2011*
9.70%
9.80%
9.94%
10.38%
10.28%
9.97%
Per
cent
of
Net
Sal
es
*2011 Includes Mexico
Gold Star Members Business Members
Membership
At Fiscal Year End
0
18.619
20.181
22.539
25.028
23
20
22
21
21.445
24
19
26
25
Mill
ions
*2011 Includes Mexico
2007 2010 2011*20092008
At Fiscal Year End
5.4
5.6
5.8
6.0
6.2
6.4
0
5.401
5.594
5.719
5.789
6.352
Mill
ions
2007 2010 2011*20092008
YearOpened
# ofWhses
2011 $103
2010 13 $94 106
2009 20 $100 107 130
2008 26 $86 83 99 116
2007 31 $76 88 92 103 116
2006 27 $92 101 118 114 122 127
2005 18 $63 81 95 110 116 128 129
2004 22 $72 81 99 109 121 118 126 130
2003 $67 79 91 101 107 116 119 126 131
2002 & Before 390
592
$103 108 119 126 134 140 149 142 151 159
Totals $103 $105 $115 $120 $127 $130 $137 $131 $139 $146
Fiscal Year
Average Sales Per Warehouse*(Sales In Millions)
*First year sales annualized. 2011 Includes Mexico
21
24
2002 2003 2004 2005 2006 2007 2008 2009 2010 2011
Net Sales
Fiscal Year
66,000
70,000
68,000
72,000
74,000
76,000
78,000
80,000
82,000
84,000
63,088
70,977
69,889
0
86,000
88,000
76,255
87,048
64,000
$ M
illio
ns
2007 2010 2011*20092008
*2011 Includes Mexico
Net Income*
Fiscal Year
0
1,450
1,500
1,300
1,350
1,400
1,050
1,250
1,100
1,150
1,200
1,083
1,283
1,086
1,303
1,462
$ M
illio
ns
2007 2010 201120092008
*All Years Include Mexico
FINANCIAL HIGHLIGHTS
1

December 13, 2011
Dear Costco Shareholders,
2011 has been an interesting year, providing many economic challenges on a worldwide basis.Nonetheless, Costco’s results were solid and once again, we believe, demonstrated our company’sstrength and resilience. We are pleased to report our fiscal 2011 results and discuss our outlook for2012 and the future. The Company recorded back-to-back years of record sales and earnings duringthe past two fiscal years, despite continuing weak and often turbulent economic conditions in the U.S.and other parts of the world. The durability of our unique business model – to continually provide ourmembers with quality goods and services at the lowest possible prices – remains very compelling.
We are proud of the financial performance Costco delivered in fiscal 2011. Net sales increased by over14 percent to $87 billion, and comparable sales in warehouses open more than a year were up 10percent. Our sales and earnings in 2011 benefited from inflation in gasoline prices and stronger foreignexchange rates (particularly in our Canadian and Asian markets). Net income was up 12 percent tonearly $1.5 billion, and earnings per share rose 13 percent to $3.30. Costco generated over $1.9 billionin free cash flow in 2011; and returned over a billion dollars to shareholders in the form of dividends($389 million) and share repurchases ($624 million).
Our strong sales increases also provided leverage in reducing our selling, general and administrative(SG&A) expenses to 9.5% of sales – a three-year low. This is perhaps the most satisfying statistic fromthe past year’s performance, because we recognize how imperative low operating expenses are to thesuccess of our business. We will continue to emphasize cost controls and expense reduction in 2012.
In fiscal 2011, our members shopped our warehouses an average of four percent more often and spentabout five percent more per visit than they did in 2010, resulting in our strong comparable sales results.We remain the third largest retailer in the United States, and this year moved from the eighth to theseventh largest retailer in the world. Our sales per square foot is almost double that of our nearestcompetitor, and our same-store sales for 2011 again topped our competition. This is reflected in ourgrowing number of warehouses with sales of more than $200 million a year, which went from 56locations in fiscal 2010 to 93 in fiscal 2011. For the first time, four of our locations had more than $300million in annual sales, including one which had more than $400 million in sales. This rate of top linerevenue per building stands out in the retail industry and results from our ongoing focus on value - thatwinning combination of quality and price on every item we sell that, we believe, sets Costco apart frommany of its competitors.
This kind of success does not happen by accident. We believe that great companies can not onlysurvive, but actually thrive and increase market share during times of economic downturn; and the pasttwo years have provided an excellent opportunity for us to prove this. It is only through theconcentrated efforts and the constant focus on our mission and core values by all of our dedicatedemployees that Costco is able to succeed year after year. We constantly seek to surprise and delightour members, while deftly balancing the mix of our limited number of SKUs based on the needs andwants of our expanding member base. We concentrate on efficiency at every level of our operations,working to keep our overhead low while still offering our employees the best wage and benefit packagein the industry. And we never lose sight of our reason for existence – serving our members well andrewarding our shareholders.....not just for today, but for the long term.
Our 64 million loyal cardholders play a big part in our success, and keeping them satisfied with everyshopping experience is our ongoing goal. Our Company is made up of talented and passionatemerchants who seek out new and exciting merchandise from suppliers around the world, andexperienced operators who enjoy creating great theater and being “show-time ready” in ourwarehouses every day. The result: our members love to walk our aisles and see what is new andexciting. This year our member renewal rate was 89 percent in the U.S. and Canada (85% worldwide),and our total membership dollars amounted to $1.9 billion in cash fees. This includes our Executive
2

Membership program, which is now operating in the U.S., Canada, Mexico, and the United Kingdom.Our Executive Members represent 34 percent of our member base, but produce a sales penetration of66 percent.
Great merchandise and great service are what our members expect to find at Costco, and ourCompany continues to expand its brand-name selections as well as its Kirkland Signature products toexceed our members’ expectations. We listen to what our members are saying and find innovativeways to bring them the items they want at exceptional prices. This year, some of the Kirkland Signatureitems we introduced were Greek yogurt, organic beef patties, and peanut butter-filled pretzels. We alsocreated a small-batch seven-year-old bourbon that provided our members with a savings of 60 percentover comparable national brands. Also offering a 60 percent savings is our new Kirkland Signaturepremium digital hearing aid with Bluetooth capabilities that our members can purchase in our hearingaid centers.
Costco’s e-commerce business (costco.com and costco.ca in Canada) continues to grow, and carriesa large selection of items that are usually not available in our warehouses. Our profits in this areapicked up in 2011 and showed particularly strong growth in Canada. We expect this aspect of ourbusiness to grow substantially in the coming years. It is currently limited to the U.S. and Canada, butwe plan to expand into our international markets in the next few years.
Our ancillary businesses, encompassing our food courts, mini-photo labs, optical, hearing aid,pharmacy, and gas station operations, are another key component of our warehouse mix. Combined,they showed a sales increase of 24 percent in 2011. These ancillaries help set us apart from ourcompetition, help drive incremental sales and also bring in additional income. One of the big hitters thisyear was our gas station business. We sold nearly $9 billion worth of gasoline in fiscal 2011, a salesincrease of 40 percent over last year. This is a very volatile market that requires a lot of finesse tomanage successfully, and we are pleased to have maintained strong profitability again this year. Anadditional advantage of our gasoline operations is their contribution to warehouse sales, as it isanother factor in driving increased, in-store shopper frequency.
Our pharmacies continue to receive recognition throughout North America for their low prescriptionprices. One contributing factor is our central fill concept; and we now have three central fill facilities thatservice most of our West Coast warehouses, helping reduce the cost of a prescription refill by almosthalf. Both our prescription and over-the-counter drugs showed strong sales and profit increases in 2011.
At its core, Costco is a company of exceptional merchants and operators, and it is our dedication toefficient sourcing, shipping, displaying and selling of quality goods and services that makes Costco thecompany that it is today. We are constantly monitoring the unique qualities of each country in which weoperate, capitalizing on opportunities, adjusting and enhancing our product mix, and adding new itemsto meet our members’ needs. Our merchandise suppliers are our partners, and we continually seek toadd top quality vendors to our ranks. We have recently established direct relationships with Precor,Cannon Gun Safes, Stanley Tools, Craftsman, Asics, Hartmann, Hurley and Spanx among other high-end suppliers. Additionally, this year we introduced a co-branded product with both the KirklandSignature and the Cinnabon names on the package of Cinnamon Rolls sold in our bakeries; a co-branded turkey breast with Foster Farms; a new ready-to-drink green tea in partnership with Ito En, aleading Japanese food company; and finally, an assortment of canned soups that are co-branded withthe Campbell Soup Company.
We remain focused on selling national brand merchandise while developing the Kirkland Signaturebrand to enhance member loyalty. After 19 years, our Kirkland Signature products now represent 15%of the items we carry, but 20% of our sales dollars. We believe we have the capability of building oursales penetration of Kirkland Signature products to 30% over the next several years, while continuingto provide our members with quality brand name products that will always be a part of our product
3

selection. We are not content to simply develop products, and we work hard to ensure that we useresponsible and sustainable practices. We must know the source of every item we buy, provide qualityassurance on each item we carry, and ensure fair treatment for everyone involved in our supply chain.
In fiscal 2011 we spent nearly $1.3 billion for the construction and opening of new warehouses anddepots, as well as renovations to a number of our existing buildings. Costco ended calendar year 2011with 598 warehouses in operation around the world: 433 in the United States and Puerto Rico, 82 inCanada, 22 in the United Kingdom, 32 in Mexico, 11 in Japan, seven in Korea, eight in Taiwan andthree in Australia.
We opened 20 net new units in fiscal 2011, compared to 14 in 2010. Five openings were in newmarkets, while the rest were infill buildings. In addition, we had two relocations: San Marcos, California,and Chesterfield, Virginia. Other fiscal 2011 warehouse openings in North America included:Woodmore Towne Center, Maryland; Fort Oglethorpe and Brookhaven, Georgia; Burnsville,Minnesota; East Vancouver, Washington; Tucson, Arizona; Lodi, California; Marlboro, New Jersey;Sanatoga, Pennsylvania; Melrose Park, Bolingbrook and Mettawa, Illinois; and three buildings inCanada, located in Fredericton, New Brunswick; Rocky View, Alberta; and Courtenay, BritishColumbia. And we opened one new Business Center – in San Diego, California. Internationally, weopened five new buildings: Auburn and Canberra, Australia; Tainan and North Kaohsiung, Taiwan: andMaebashi Gunma, Japan. Overall, fourteen of our new warehouses had opening day sales in excess of$600,000, and four of them brought in sums of more than $1 million. The average annualized sales forwarehouses opened this year was $103 million per building – our highest ever.
In the run-up to this year’s holiday season, we also opened six new units in the following communities:Bucks County, Pennsylvania; Frisco, Texas; Pewaukee, Wisconsin; Augusta, Georgia; Yawata Kyotoand Zama, Japan. We have been actively reviewing potential sites and securing new properties duringthe economic downturn and have many promising locations to be developed over the next few years.And we are evaluating additional countries to help realize our goal of 1,000 warehouses in operation bythe next 10 to 12 years. The strong showing of our recent international openings reinforces Costco’sbusiness model as a global success.
Our strategy for expansion includes thorough research and demographic analysis, and strict attentionto return on investment. Surely there is nothing quite like opening a Costco warehouse in a newmarket; and our appeal, always so strong in North America, has translated well in the internationalmarketplace. People the world over just love our great values, quality merchandise and treasure huntatmosphere. Our international expansion is an important piece of Costco’s business strategy, and ourglobal units are booming. Of our 598 locations open at the close of calendar 2011, 26 are in the fast-growing Asian markets where we operate, and where three of our new warehouses opened this yearposted some of the highest opening-day sales and new member sign-ups in Company history.
Australia is another exciting new market for Costco. We opened our first unit there in 2009 and addedtwo more in fiscal 2011: Auburn, in the Sydney market, which had one of the Company’s highestopening day sales; and Canberra, the nation’s capital.
A brief summary of highlights regarding sustainability indicates that by the end of calendar 2011 we willhave in operation rooftop solar photovoltaic systems at 60 of our facilities, which are projected togenerate 55 million kWh of electricity per year. We also continue to expand the use of non-chemicalwater treatment systems used in our cooling towers to reduce the amount of chemicals going intosewer systems. In addition, tons of trash that our warehouses generate each week, much of which wasonce discarded into landfills, is now being recycled and renewed into usable products. And we nowhave 257 grease recovery systems installed in our warehouses, resulting in the recovery of more thanfour million pounds of grease from the waste stream. By coordinating with state and federal incentiveprograms, these and other environmental/energy-saving systems help us reduce our carbon footprintand lower the cost of operating our facilities.
4
All of our efforts are supported by our outstanding management team. When Costco was founded in1983, we brought in some of the very best retail executives in the industry, most of them people wehad worked with for years in other companies. Together we worked to train and build Costco’smanagement team into what we believe is the strongest and most cohesive in the industry. Most of oursenior executives have been with the Company for more than 25 years and are well-versed in all areasof our operations. Growing Costco’s future leaders has been a major objective for all of us since thebeginning, and we have a deep bench of managers at all levels who are wholly committed to ourculture and core objectives and well-equipped to assume additional responsibilities.
In September of this year, Costco’s co-founder Jim Sinegal informed our Board of Directors of hisintention to step down as Chief Executive Officer of the Company effective January, 2012. The Boardelected Craig Jelinek, President and Chief Operating Officer since February 2010, as President and ChiefExecutive Officer effective January, 2012. Craig has been working very closely with Jim and co-founder/Chairman of the Board Jeff Brotman over the past 18 months in coordinating major Company matters.
Craig is a highly experienced retail executive with 37 years in the industry, 28 of them at Costco, wherehe started as one of the Company’s first warehouse managers in 1984. He has served in every majorrole related to Costco’s business operations and merchandising activities during his tenure and is well-prepared to assume the Company’s leadership. Jim Sinegal will remain with Costco through January2013, serving in an advisory role and assisting Craig during the transition. Jim will also continue toserve on the Board of Directors and will stand for reelection at the January 2012 Annual Meeting.
Costco has a strong corporate culture, one that Craig Jelinek helped to build and will continue tosupport as he assumes leadership of the Company’s more than 161,000 employees around the world.The Company will continue to pursue its mission of bringing the highest quality goods and services tomarket at the lowest possible prices while providing excellent customer service and adhering to a strictcode of ethics that includes taking care of our employees and members, respecting our suppliers,rewarding our shareholders, and seeking to be responsible corporate citizens and environmentalstewards in our operations around the world.
So what does the future hold for Costco? Like most retailers, we had our challenges in 2011: thelackluster economy, a tough competitive environment, increased healthcare costs, and inflation, amongothers. Yet we persevered by sticking to the basic principles that have made our Company successful.We expect many of these same challenges may stay with us in 2012 and beyond, and we will meetthem head-on with continued passion and integrity, giving attention to all of our stakeholders, andkeeping a constant focus on achieving excellence while being innovative and nimble. Our decisions willbe made with an eye on the long term, so that Costco will still be successful for many years to come.
We appreciate the trust you, our shareholders, have placed in our management team, and on behalf ofour 161,000 employees around the world, we thank you for your support. We hope to see many of youat our Annual Meeting of Shareholders on January 26th in Bellevue, Washington, where we will reviewour 2011 accomplishments and discuss plans for a successful 2012.
Best wishes to you and your loved ones for a wonderful holiday season and a healthy, happy, andprosperous New Year.
Warm Regards,
Jeff BrotmanChairman of the Board
Jim SinegalChief Executive Officer
Craig JelinekPresident & COO
5
6
42
2
3
10
4
3
4
5
3 7
3
2
2
22
2
2
2 2
3
3
4
6
4
2
8
5
92
62
3
2
35
10
21
14
2
3
22
3
43
2
3
2
2
SOUTHKOREA
TAIWAN
ALASKA
JAPAN
HAWAII
AUSTRALIA
MÉXICO
U.S.A. (433)
ALABAMA (3)HooverHuntsvilleMontgomery
ALASKA (3)AnchorageN. AnchorageJuneau
ARIZONA (18)AvondaleCave Creek RoadChandlerGilbertS.E. GilbertGlendaleMesaParadise ValleyPhoenix Phoenix – Bus. Ctr.N. PhoenixPrescottScottsdaleTempeThomas RoadTucsonTucson IIIN.W. Tucson
CALIFORNIA (119)AlhambraAlmadenAntioch AzusaBakersfieldS.W. BakersfieldBurbankCal Expo Canoga ParkCarlsbadCarmel MountainChico Chino Hills Chula VistaCitrus HeightsCity of IndustryClovisCoachella ValleyCommerce – Bus. Ctr.ConcordCoronaCulver CityCypressDanvilleEl CaminoEl CentroEureka Fairfield
FolsomFontanaFoster CityFountain ValleyFremontFresnoN. FresnoFullertonGarden GroveGilroyGoletaHawthorneHawthorne – Bus. Ctr.HaywardHayward – Bus. Ctr.InglewoodIrvineLa HabraLakewoodLa MesaLaguna Niguel (2)Lake ElsinoreLancasterLa QuintaLivermoreLodi Los FelizManteca MercedMission ValleyModestoMontclairMontebelloMoreno ValleyMountain ViewNorthridgeNorwalkNovatoOxnardPacoimaPowayRancho CordovaRancho CucamongaRancho del ReyReddingRedwood CityRichmond Rohnert ParkRosevilleSacramentoSalinasSan BernardinoSan DiegoSan Diego – Bus. Ctr.S.E. San DiegoSan DimasSan Francisco
San Juan CapistranoSan LeandroSan Luis ObispoSan MarcosSand CitySanta ClaraSanta ClaritaSanta Cruz Santa Maria Santa RosaSantee Signal HillSimi ValleyStocktonSunnyvaleTemeculaTorranceTracyTurlockTustinTustin IIVacavilleVallejoVan Nuys VictorvilleVisaliaVista Westlake VillageWoodlandYorba Linda
COLORADO (12)ArvadaAuroraColorado SpringsColorado Springs WestS.W. DenverDouglas CountyGypsum Parker SheridanSuperiorThorntonWestminster
CONNECTICUT (5)BrookfieldEnfieldMilford Norwalk Waterbury
DELAWARE (1)Christiana
FLORIDA (21)Altamonte SpringsBoca RatonBrandonClearwaterDavieEsteroFort MyersE. JacksonvilleKendallLantanaMiamiN. Miami Beach Miami LakesNaples E. OrlandoS. OrlandoPalm Beach Gardens Pembroke PinesPompano Beach Royal Palm BeachTallahassee
GEORGIA (10)AlpharettaAugustaBrookhavenCumberland MallFort OglethorpeGwinnettMall of Georgia MorrowPerimeterTown Center
HAWAII (7)Hawaii Kai Honolulu Kailua-KonaKapoleiKauaiMauiWaipio
IDAHO (5)BoiseCoeur d’AleneNampaPocatelloTwin Falls
ILLINOIS (16)Bedford ParkBloomingdaleBolingbrookGlenviewLake in the Hills
Lake ZurichLincoln ParkMelrose Park MettawaMount ProspectNapervilleNilesOak BrookOrland ParkSt. CharlesSchaumburg
INDIANA (3)CastletonN.W. IndianapolisMerrillville
IOWA (1)Des Moines
KANSAS (2)LenexaOverland Park
KENTUCKY (1)Louisville
MARYLAND (9)Arundel MillsBeltsvilleBrandywineColumbiaFrederickGaithersburgGlen BurnieWhite MarshWoodmore Twn Ctr.
MASSACHUSETTS (6)Avon DanversDedhamEverettW. Springfield Waltham
MICHIGAN (11)Auburn Hills Bloomfield Commerce TownshipGrand RapidsGreen Oak TownshipLivonia ILivonia IIMadison HeightsRosevilleShelby TownshipWyoming
MINNESOTA (6)BurnsvilleCoon RapidsEden PrairieMaple GroveMaplewoodSt. Louis Park
MISSOURI (5)Independence Kansas CityManchesterS. St. LouisSt. Peters
MONTANA (5)Billings BozemanHelenaKalispellMissoula
NEBRASKA (1)Omaha
NEVADA (7)Carson CityCentennialHendersonLas Vegas – Bus. Ctr.RenoSparksSummerlin
NEW HAMPSHIRE (1)Nashua
NEW JERSEY (14)Brick TownshipBridgewaterCliftonEdisonHackensackE. HanoverHazlet
Manahawkin
Marlboro
Mount Laurel
Ocean Township
Union
Wayne
Wharton
NEW MEXICO (3)
Albuquerque
Albuquerque ll
W. Albuquerque
NEW YORK (15)
Brooklyn
Commack
Holbrook
Lawrence
Manhattan
Melville
Nanuet
Nesconset
New Rochelle
Port Chester
Queens
Rego Park
Staten Island
Westbury
Yonkers
NORTH CAROLINA (7)
Charlotte
Durham
Greensboro
Matthews
Raleigh
Wilmington
Winston-Salem
New warehouse openings and relocations since FY 2010 in bold.
S. San FranciscoSan Jose N.E. San Jose

7
3
13
3
5
2
2
3
2
2
7
4
2
2
7
8 3
2
2
8
5
3
9
2
9
2
2
2
3
2 32
6
2
3 3
3
2
3
47
16
2
2
2
12
2
2
4
2
2
UNITEDKINGDOM
NEWFOUNDLAND
PUERTORICO
OHIO (7)AvonColumbusDeerfield TownshipMayfield HeightsSpringdaleStrongsvilleToledo
OREGON (13)AlbanyAlohaBendClackamasEugeneHillsboroMedfordPortlandRoseburgSalemTigardWarrentonWilsonville
PENNSYLVANIA (9)Bucks CountyCranberryHarrisburg King of PrussiaLancasterMontgomeryvilleRobinsonSanatogaWest Homestead
SOUTH CAROLINA (4)CharlestonGreenvilleMyrtle BeachSpartanburg
TENNESSEE (4)BrentwoodN.E. MemphisS.E. MemphisW. Nashville
TEXAS (18)ArlingtonAustinS. AustinDuncanvilleEl PasoFort WorthFriscoHoustonKaty FreewayLewisvilleEast PlanoWest PlanoRockwallN.W. San AntonioSelmaSonterra ParkSouthlakeWillowbrook
UTAH (9)W. BountifulLehiMurrayS. OgdenOremSt. GeorgeSalt Lake CitySandyWest Valley
VERMONT (1)Colchester
VIRGINIA (15)ChantillyChesterfieldFairfaxFredericksburgHarrisonburgW. HenricoLeesburgManassasNewingtonNewport NewsNorfolkPentagon CityPotomac Mills
SterlingWinchester
WASHINGTON (29)Aurora VillageBellingham Burlington ClarkstonCovingtonEverett Federal WayFife – Bus. Ctr.Gig HarborIssaquah KennewickKirklandLaceyLynnwood – Bus. Ctr.MarysvillePuyallupSeattleSequimSilverdaleSpokaneN. SpokaneTacomaTukwilaTumwater Union GapVancouverE. VancouverE. Wenatchee
Woodinville
WISCONSIN (3)GraftonMiddletonPewaukee
PUERTO RICO (4)BayamónE. BayamónCaguasCarolina
CANADA (82)
ALBERTA (13)N. CalgaryN.W. CalgaryS. Calgary Edmonton N. EdmontonS. EdmontonGrande Prairie LethbridgeMedicine HatOkotoksRed DeerRocky ViewSherwood Park
BRITISH COLUMBIA (14)AbbotsfordBurnabyCourtenayKamloops KelownaLangfordLangley Nanaimo Port Coquitlam Prince George RichmondSurreyVancouverWillingdon
MANITOBA (3)WinnipegE. WinnipegS. Winnipeg
NEW BRUNSWICK (3)FrederictonMonctonSaint John
NEWFOUNDLAND (1)St. John’s
NOVA SCOTIA (2)DartmouthHalifax
ONTARIO (26)AjaxAncasterBarrieBrampton BurlingtonDownsviewEtobicokeGloucesterKanataKingston KitchenerLondonNorth London Markham E. MarkhamMississauga NorthMississauga SouthNepeanNewmarketPeterboroughRichmond HillSt. CatharinesScarboroughSudburyVaughanWindsor
QUÉBEC (18)AnjouBoisbriandBouchervilleBrossardCandiacChicoutimiGatineauLavalMarché CentralMontréalPointe Claire QuébecSainte-FoySaint-HubertSaint-JérômeSherbrookeTerrebonneTrois-Rivières-Ouest
SASKATCHEWAN (2)ReginaSaskatoon
AUSTRALIA (3)
AUS CAP TER (1)Canberra
NEW SOUTH WALES (1)Auburn
VICTORIA (1)Melbourne
JAPAN (11)
AmagasakiHisayama IrumaKanazawa SeasideKawasakiMaebashi GunmaMakuhari SapporoShin MisatoYawata Kyoto Zama
SOUTH KOREA (7)
BusanDaegu DaejeonIlsan Sangbong Yangjae Yangpyung
TAIWAN (8)
Chung HoHsinchuKaohsiung North KaohsiungNeihuShih Chih TaichungTainan
UNITED KINGDOM (22)
ENGLAND (18)BirminghamBristolChesterChingfordCoventryCroydonDerbyGatesheadHaydockLeedsLiverpoolManchesterMilton KeynesOldhamReadingSheffieldThurrockWatford
SCOTLAND (3)AberdeenEdinburghGlasgow
WALES (1)Cardiff
MÉXICO (32)
(50% Joint Venture)
AGUASCALIENTES (1)Aguascalientes
BAJA CALIFORNIA (4)EnsenadaMexicaliTijuanaTijuana II
BAJA CALIFORNIA
SUR (1)Cabo San Lucas
CHIHUAHUA (1)Juarez
GUANAJUATO (2)CelayaLeón
GUERRERO (1)Acapulco
JALISCO (3)GuadalajaraGuadalajara IIPuerto Vallarta
MÉXICO (4)ArboledasInterlomasSatéliteToluca
MÉXICO, D.F. (3)CoapaMixcoac Polanco
MICHOACÁN (1)Morelia
MORELOS (1)Cuernavaca
NUEVO LEÓN (2)MonterreyMonterrey II
PUEBLA (1)Puebla
QUERÉTARO (1)Querétaro
QUINTANA ROO (1)Cancún
SAN LUIS POTOSÍ (1)San Luis Potosí
SONORA (1)Hermosillo
VERACRUZ (2)VeracruzXalapa
YUCATÁN (1)Mérida

BUSINESS OVERVIEW
Forward-Looking Statements
Certain statements contained in this Report constitute forward-looking statements within the meaningof the Private Securities Litigation Reform Act of 1995, Section 27A of the Securities Act of 1933 andSection 21E of the Securities Exchange Act of 1934. They include statements that address activities,events, conditions or developments that we expect or anticipate may occur in the future and may relateto such matters as sales growth, increases in comparable store sales, cannibalization of existinglocations by new openings, price or fee changes, earnings performance, earnings per share, stock-based compensation expense, warehouse openings and closures, the effect of adopting certainaccounting standards, future financial reporting, financing, margins, return on invested capital, strategicdirection, expense control, membership renewal rates, shopping frequency, litigation impact and thedemand for our products and services. Forward-looking statements may also be identified by the words“believe,” “project,” “expect,” “anticipate,” “estimate,” “intend,” “strategy,” “future,” “opportunity,” “plan,”“may,” “should,” “will,” “would,” “will be,” “will continue,” “will likely result,” and similar expressions.Forward-looking statements are based on current expectations and assumptions and are subject torisks and uncertainties that may cause actual results to differ materially from the forward-lookingstatements. Such forward-looking statements involve risks and uncertainties that may cause actualevents, results, or performance to differ materially from those indicated by such statements, including,without limitation, the factors set forth in Risk Factors, page 14, and other factors noted in theManagement’s Discussion and Analysis of Financial Condition and Results of Operations, and theconsolidated financial statements and related notes of this Report. Forward-looking statements speakonly as of the date they are made, and we do not undertake to update these forward-lookingstatements, except as required by law.
General
Costco Wholesale Corporation and its subsidiaries (Costco or the Company) are principally engaged inthe operation of membership warehouses in the United States, Canada, the United Kingdom, Japan,Australia, through majority-owned subsidiaries in Taiwan and Korea, and a 50% owned joint venture inMexico (Mexico). At the beginning of fiscal 2011, we began consolidating our Mexico joint venture dueto the adoption of a new accounting standard. Mexico’s results previously were accounted for underthe equity method and our 50% share was included in “interest income and other, net” in theconsolidated statements of income. In the current year, the financial position and results of Mexico’soperations are fully consolidated and the joint venture partner’s 50% share is included in “net incomeattributable to noncontrolling interests” in the consolidated statements of income. The initialconsolidation of Mexico increased total assets, liabilities, and revenue by approximately 3%, with noimpact on net income or net income per common share attributable to Costco. See discussion in Note1 to the consolidated financial statements included in this Report.
We report on a 52/53-week fiscal year, consisting of thirteen four-week periods and ending on theSunday nearest the end of August. The first three quarters consist of three periods each, and thefourth quarter consists of four periods (five weeks in the thirteenth period in a 53-week year). Thematerial seasonal impact in our operations is an increased level of net sales and earnings during thewinter holiday season. References to 2011, 2010, and 2009 relate to the 52-week fiscal years endedAugust 28, 2011, August 29, 2010, and August 30, 2009, respectively.
We operate membership warehouses based on the concept that offering our members low prices on alimited selection of nationally branded and private-label products in a wide range of merchandisecategories will produce high sales volumes and rapid inventory turnover. This turnover, whencombined with the operating efficiencies achieved by volume purchasing, efficient distribution and
8

reduced handling of merchandise in no-frills, self-service warehouse facilities, enables us to operateprofitably at significantly lower gross margins than traditional wholesalers, mass merchandisers,supermarkets, and supercenters.
We buy the majority of our merchandise directly from manufacturers and route it to a cross-dockingconsolidation point (depot) or directly to our warehouses. Our depots receive container-basedshipments from manufacturers and reallocate these goods for shipment to our individual warehouses,generally in less than twenty-four hours. This maximizes freight volume and handling efficiencies,eliminating many of the costs associated with traditional multiple-step distribution channels. Suchtraditional steps include purchasing from distributors as opposed to manufacturers, use of centralreceiving, storing and distributing warehouses, and storage of merchandise in locations off the salesfloor.
Because of our high sales volume and rapid inventory turnover, we generally sell inventory before weare required to pay many of our merchandise vendors, even though we take advantage of earlypayment discounts when available. To the extent that sales increase and inventory turnover becomesmore rapid, a greater percentage of inventory is financed through payment terms provided by suppliersrather than by our working capital.
Our typical warehouse format averages approximately 143,000 square feet; newer units tend to beslightly larger. Floor plans are designed for economy and efficiency in the use of selling space, thehandling of merchandise, and the control of inventory. Because shoppers are attracted principally bythe quality of merchandise and the availability of low prices, our warehouses need not have elaboratefacilities. By strictly controlling the entrances and exits of our warehouses and using a membershipformat, we have limited inventory losses (shrinkage) to less than two-tenths of one percent of net salesin the last several fiscal years—well below those of typical discount retail operations.
We generally limit marketing and promotional activities to new warehouse openings, occasional directmail to prospective new members, and regular direct marketing programs (such as The CostcoConnection, a magazine we publish for our members, coupon mailers, weekly email blasts fromcostco.com, and handouts) to existing members promoting selected merchandise. These practicesresult in lower marketing expenses as compared to typical retailers.
Our warehouses generally operate on a seven-day, 69-hour week, open weekdays between10:00 a.m. and 8:30 p.m., with earlier weekend closing hours. Gasoline operations generally haveextended hours. Because the hours of operation are shorter than those of traditional retailers, discountretailers and supermarkets, and due to other efficiencies inherent in a warehouse-type operation, laborcosts are lower relative to the volume of sales. Merchandise is generally stored on racks above thesales floor and displayed on pallets containing large quantities, thereby reducing labor required forhandling and stocking.
Our strategy is to provide our members with a broad range of high quality merchandise at pricesconsistently lower than they can obtain elsewhere. We seek to limit specific items in each product lineto fast-selling models, sizes, and colors. Therefore, we carry an average of approximately 3,600 activestock keeping units (SKUs) per warehouse in our core warehouse business, as opposed to 45,000 to140,000 SKUs or more at discount retailers, supermarkets, and supercenters. Many consumableproducts are offered for sale in case, carton, or multiple-pack quantities only.
In keeping with our policy of member satisfaction, we generally accept returns of merchandise. Oncertain electronic items, we generally have a 90-day return policy and provide, free of charge, technicalsupport services, as well as an extended warranty.
9

Only the 2011 data in the accompanying tables includes Mexico.
The following table indicates the approximate percentage of net sales accounted for by major categoryof items:
2011 2010 2009
Sundries (including candy, snack foods, tobacco, alcoholicand nonalcoholic beverages and cleaning and institutionalsupplies) . . . . . . . . . . . . . . . . . . . . . . . . . . . . . . . . . . . . . . . . . 22% 23% 23%
Hardlines (including major appliances, electronics, healthand beauty aids, hardware, office supplies, cameras,garden and patio, sporting goods, toys, seasonal itemsand automotive supplies) . . . . . . . . . . . . . . . . . . . . . . . . . . . . 17% 18% 19%
Food (including dry and institutionally packaged foods) . . . . . 21% 21% 21%Softlines (including apparel, domestics, jewelry,
housewares, media, home furnishings and smallappliances) . . . . . . . . . . . . . . . . . . . . . . . . . . . . . . . . . . . . . . . 10% 10% 10%
Fresh Food (including meat, bakery, deli and produce) . . . . 12% 12% 12%Ancillary and Other (including gas stations, pharmacy, food
court, optical, one-hour photo, hearing aid and travel) . . . . 18% 16% 15%
Ancillary businesses within or next to our warehouses provide expanded products and services andencourage members to shop more frequently. The following table indicates the number of ancillarybusinesses in operation at fiscal year-end:
2011 2010 2009
Food Court . . . . . . . . . . . . . . . . . . . . . . . . . . . . . . . . . . . . . . . . . 586 534 521One-Hour Photo Centers . . . . . . . . . . . . . . . . . . . . . . . . . . . . . . 581 530 518Optical Dispensing Centers . . . . . . . . . . . . . . . . . . . . . . . . . . . . 574 523 509Pharmacies . . . . . . . . . . . . . . . . . . . . . . . . . . . . . . . . . . . . . . . . 529 480 464Gas Stations . . . . . . . . . . . . . . . . . . . . . . . . . . . . . . . . . . . . . . . . 368 343 323Hearing-Aid Centers . . . . . . . . . . . . . . . . . . . . . . . . . . . . . . . . . 427 357 303Print Shops and Copy Centers . . . . . . . . . . . . . . . . . . . . . . . . . 10 10 10Car Washes . . . . . . . . . . . . . . . . . . . . . . . . . . . . . . . . . . . . . . . . 7 7 2
Number of warehouses . . . . . . . . . . . . . . . . . . . . . . . . . . . . . . . 592 540 527
The 2010 and 2009 numbers exclude the 32 warehouses operated in Mexico.
Our electronic commerce businesses, costco.com in the U.S. and costco.ca in Canada, provide ourmembers additional products generally not found in our warehouses, in addition to services such asdigital photo processing, pharmacy, travel, and membership services.
Our warehouses accept cash, checks, certain debit cards, American Express and a private labelCostco credit card. Losses associated with dishonored checks have been minimal, as members whohave issued dishonored checks are identified and prevented from making further purchases untilrestitution is made.
We have direct buying relationships with many producers of national brand-name merchandise. We donot obtain a significant portion of merchandise from any one supplier. We have not experienced anydifficulty in obtaining sufficient quantities of merchandise, and believe that if one or more of our currentsources of supply became unavailable, we would be able to obtain alternative sources without
10

substantial disruption of our business. We also purchase private label merchandise, as long as qualityand customer demand are comparable and the value to our members is greater as compared to namebrand items.
Certain financial information for our segments and geographic areas is included in Note 12 to theconsolidated financial statements included in this Report.
Membership Policy
Our membership format is designed to reinforce customer loyalty and provide a continuing source ofmembership fee revenue. Members can utilize their memberships at any Costco warehouse location inany country. We have two primary types of members: Business and Gold Star (individual). Ourmember renewal rate was 89% in the U.S. and Canada, and approximately 86% on a worldwide basis,consistent with recent years. The renewal rate is a trailing calculation that captures renewals during theperiod seven to eighteen months prior to the reporting date. Businesses, including individuals with abusiness license, retail sales license or other evidence of business existence, may become Businessmembers. Business members generally pay an annual membership fee of approximately $50 for theprimary and household membership card, with add-on membership cards available for an annual fee ofapproximately $50 (including a free household card). Many of our business members also shop atCostco for their personal needs. Individual (Gold Star) memberships are available to individuals whodo not qualify for a Business membership, for an annual fee of approximately $50, which includes ahousehold card.
Our membership was made up of the following (in thousands):
2011 2010 2009
Gold Star . . . . . . . . . . . . . . . . . . . . . . . . . . . . . . . . . . . . . . . . . 25,000 22,500 21,500Business . . . . . . . . . . . . . . . . . . . . . . . . . . . . . . . . . . . . . . . . . 6,300 5,800 5,700Business, Add-on Primary . . . . . . . . . . . . . . . . . . . . . . . . . . . 4,000 3,300 3,400
Total primary cardholders . . . . . . . . . . . . . . . . . . . . . . . . 35,300 31,600 30,600Additional cardholders . . . . . . . . . . . . . . . . . . . . . . . . . . . . . . 28,700 26,400 25,400
Total cardholders . . . . . . . . . . . . . . . . . . . . . . . . . . . . . . . . . . 64,000 58,000 56,000
The numbers for 2010 and 2009 exclude approximately 2,900 and 2,800 cardholders of Mexico at theend of those years.
Executive membership is available to all members, with the exception of Business Add-on members, inthe U.S., Canada, Mexico, and the United Kingdom for an annual fee of approximately $100. Thisprogram, excluding Mexico, offers additional savings and benefits on various business and consumerservices, such as merchant credit-card processing, auto and home insurance, the Costco autopurchase program, check printing services and a high yield savings program. The services aregenerally provided by third-parties and vary by country and state. In addition, Executive membersqualify for a 2% annual reward (which can be redeemed at Costco warehouses), up to a maximum ofapproximately $500 per year, on qualified purchases made at Costco. At the end of 2011, 2010, and2009, Executive members represented 38%, 36%, and 33%, respectively, of our primary membership.Executive members generally spend more than other members, and the percentage of our net salesattributable to these members continues to increase.
11

Labor
Our employee count approximated:
2011 2010 2009
Full-time employees . . . . . . . . . . . . . . . . . . . . . 92,000 82,000 79,000Part-time employees . . . . . . . . . . . . . . . . . . . . 72,000 65,000 63,000
Total employees . . . . . . . . . . . . . . . . . . . . 164,000 147,000 142,000
The numbers for 2010 and 2009 exclude approximately 9,000 individuals who were employed byMexico at the end of those years. Approximately 13,600 hourly employees in certain of our locations(all former Price Company locations) in five states are represented by the International Brotherhood ofTeamsters. All remaining employees are non-union. We consider our employee relations to be verygood.
Competition
Our industry is highly competitive, based on factors such as price, merchandise quality and selection,warehouse location and member service. We compete with over 800 warehouse club locations acrossthe U.S. and Canada (Wal-Mart’s Sam’s Club and BJ’s Wholesale Club), and every major metropolitanarea has multiple club operations. In addition, we compete with a wide range of global, national andregional wholesalers and retailers, including supermarkets, supercenter stores, department andspecialty stores, gasoline stations, and internet-based retailers. Competitors such as Wal-Mart, Target,Kohl’s and Amazon.com are among our significant general merchandise retail competitors. We alsocompete with low-cost operators selling a single category or narrow range of merchandise, such asLowe’s, Home Depot, Office Depot, PetSmart, Staples, Trader Joe’s, Whole Foods, Best Buy andBarnes & Noble. Our international operations face similar types of competitors.
Regulation
Certain state laws require that we apply minimum markups to our selling prices for specific goods, suchas tobacco products, alcoholic beverages, and gasoline. While compliance with such laws may causeus to charge higher prices, other retailers are also typically governed by the same restrictions, and webelieve that compliance with such laws currently in effect do not have a material adverse effect on ouroperations.
Certain jurisdictions have enacted or proposed laws and regulations that would prevent or restrict theoperations or expansion plans of certain large retailers and warehouse clubs, including us, within theirjurisdictions. If enacted, such laws and regulations could have a material adverse affect on ouroperations.
Intellectual Property
We believe that, to varying degrees, our trademarks, trade names, copyrights, proprietary processes,trade secrets, patents, trade dress and similar intellectual property add significant value to ourbusiness and are important factors in our success. Our failure to continue to develop, maintain, andprotect these properties would adversely affect our business and financial results. We have investedsignificantly in the development and protection of our well-recognized brands, including the CostcoWholesale® series of trademarks and our private label brand, Kirkland Signature®. We believe thatKirkland Signature products are premium products offered to our members at prices that are generallylower than those for national brand products and that they help lower costs, differentiate ourmerchandise offerings from other retailers, and generally earn higher margins. We expect to increase
12
the sales penetration of our private label items in the future. We rely on trademark and copyright law,trade secret protection, and confidentiality and license agreements with our employees and others toprotect our proprietary rights. Effective intellectual property protection may not be available in everycountry in which we operate.
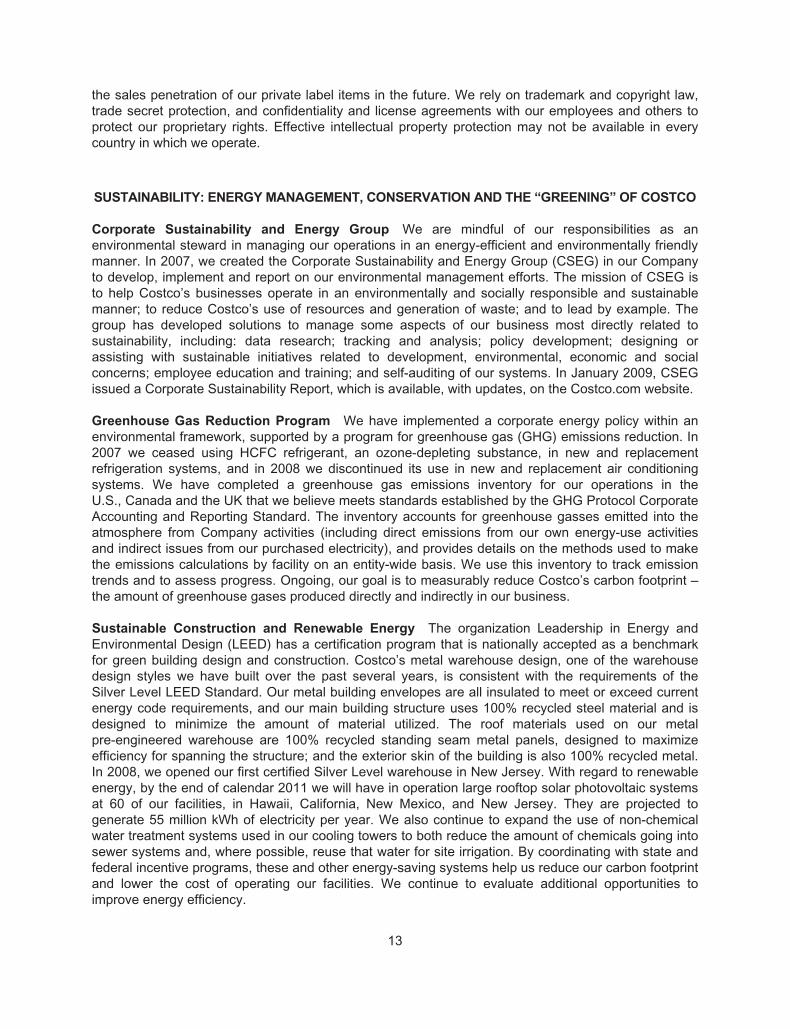
SUSTAINABILITY: ENERGY MANAGEMENT, CONSERVATION AND THE “GREENING” OF COSTCO
Corporate Sustainability and Energy Group We are mindful of our responsibilities as anenvironmental steward in managing our operations in an energy-efficient and environmentally friendlymanner. In 2007, we created the Corporate Sustainability and Energy Group (CSEG) in our Companyto develop, implement and report on our environmental management efforts. The mission of CSEG isto help Costco’s businesses operate in an environmentally and socially responsible and sustainablemanner; to reduce Costco’s use of resources and generation of waste; and to lead by example. Thegroup has developed solutions to manage some aspects of our business most directly related tosustainability, including: data research; tracking and analysis; policy development; designing orassisting with sustainable initiatives related to development, environmental, economic and socialconcerns; employee education and training; and self-auditing of our systems. In January 2009, CSEGissued a Corporate Sustainability Report, which is available, with updates, on the Costco.com website.
Greenhouse Gas Reduction Program We have implemented a corporate energy policy within anenvironmental framework, supported by a program for greenhouse gas (GHG) emissions reduction. In2007 we ceased using HCFC refrigerant, an ozone-depleting substance, in new and replacementrefrigeration systems, and in 2008 we discontinued its use in new and replacement air conditioningsystems. We have completed a greenhouse gas emissions inventory for our operations in theU.S., Canada and the UK that we believe meets standards established by the GHG Protocol CorporateAccounting and Reporting Standard. The inventory accounts for greenhouse gasses emitted into theatmosphere from Company activities (including direct emissions from our own energy-use activitiesand indirect issues from our purchased electricity), and provides details on the methods used to makethe emissions calculations by facility on an entity-wide basis. We use this inventory to track emissiontrends and to assess progress. Ongoing, our goal is to measurably reduce Costco’s carbon footprint –the amount of greenhouse gases produced directly and indirectly in our business.
Sustainable Construction and Renewable Energy The organization Leadership in Energy andEnvironmental Design (LEED) has a certification program that is nationally accepted as a benchmarkfor green building design and construction. Costco’s metal warehouse design, one of the warehousedesign styles we have built over the past several years, is consistent with the requirements of theSilver Level LEED Standard. Our metal building envelopes are all insulated to meet or exceed currentenergy code requirements, and our main building structure uses 100% recycled steel material and isdesigned to minimize the amount of material utilized. The roof materials used on our metalpre-engineered warehouse are 100% recycled standing seam metal panels, designed to maximizeefficiency for spanning the structure; and the exterior skin of the building is also 100% recycled metal.In 2008, we opened our first certified Silver Level warehouse in New Jersey. With regard to renewableenergy, by the end of calendar 2011 we will have in operation large rooftop solar photovoltaic systemsat 60 of our facilities, in Hawaii, California, New Mexico, and New Jersey. They are projected togenerate 55 million kWh of electricity per year. We also continue to expand the use of non-chemicalwater treatment systems used in our cooling towers to both reduce the amount of chemicals going intosewer systems and, where possible, reuse that water for site irrigation. By coordinating with state andfederal incentive programs, these and other energy-saving systems help us reduce our carbon footprintand lower the cost of operating our facilities. We continue to evaluate additional opportunities toimprove energy efficiency.
13

Recycling and Waste Stream Management Waste stream reduction is another major emphasis ofour sustainability program. Tons of trash that our warehouses generate each week, much of which wasonce discarded into landfills, is now being recycled and renewed into usable products, recycled intobiofuels or compost, or used as feed stock. We also have a program in some warehouses where meatscraps and rotisserie chicken grease are recycled by third parties to make animal feed, biodiesel fuel,soaps, and other products. In 2009, we began installing Goslyn™ grease recovery systems in ourwarehouses, and at the end of fiscal 2011 we had 257 systems installed, resulting in the recovery ofover four million pounds of grease from the waste stream.
Energy Efficient Products and Innovative Packaging We have been an active member of theEPA’s Energy Star and Climate Protection Partnerships for the past nine years and are also a majorretailer of Energy Star qualified compact florescent lamp (CFL) bulbs. We sold more than 35 millionCFL bulbs and 9 million LED light bulbs in the U.S. during 2011, and over 204 million energy-savinglight bulbs during the past six years.
Our merchandise packaging is also becoming more sustainable. In collaboration with our vendors, wepursue opportunities to eliminate polyvinyl chloride (PVC) plastic in our packaging and replace it withrecycled or recyclable materials. Likewise, packaging design changes, as in the case of our householddisinfecting wipes and snacks packaging changes from plastic containers to re-sealable pouches andbags, have allowed us to increase the amount of product on a pallet, resulting in fewer delivery truckson the road.
Commuting We continue to encourage our employees to carpool or vanpool – to reduce energyconsumption, as well as reduce emissions. The Commute Trip Reduction (CTR) program we beganseventeen years ago at our corporate office with eighteen vans has evolved into sixty-two vans (vans,fuel, maintenance and insurance provided by five transit agencies); and we have begun vanpools insome regional offices. We offer employees subsidies to vanpool, and we subsidize employees whopurchase monthly bus passes. In addition, we encourage employees to ride bikes to work whenpractical. All of these programs and activities help reduce our carbon footprint.
RISK FACTORS
The risks described below could materially and adversely affect our business, financial condition, andresults of operations. These risks are not the only risks that we face. Our business operations couldalso be affected by additional factors that apply to all companies operating in the United States andglobally, as well as other risks that are not presently known to us or that we currently consider to beimmaterial.
We face strong competition from other retailers and warehouse club operators, which could
negatively affect our financial performance.
The retail business is highly competitive. We compete for members, employees, sites, products andservices and in other important respects with many other local, regional and national retailers, both inthe United States and in foreign countries. We compete with a wide range of global, national andregional wholesalers and retailers, including supermarkets, supercenter stores, department andspecialty stores, gasoline stations, and internet-based retailers. Such retailers and warehouse cluboperators compete in a variety of ways, including merchandise pricing, selection and availability,services, location, convenience, and store hours. Our inability to respond effectively to competitivepressures and changes in the retail markets could negatively affect our financial performance. Somecompetitors may have greater financial resources, better access to merchandise, and greater marketpenetration than we do.
14

General economic factors, domestically and internationally, may adversely affect our financial
performance.
Higher interest rates, energy costs, inflation, levels of unemployment, healthcare costs, consumer debtlevels, unsettled financial markets, weaknesses in housing and real estate markets, reduced consumerconfidence, changes related to government fiscal and tax policies and other economic factors couldadversely affect demand for our products and services or require a change in the mix of products wesell. Prices of certain commodity products, including gasoline and other food products, are historicallyvolatile and are subject to fluctuations arising from changes in domestic and international supply anddemand, labor costs, competition, market speculation, government regulations and periodic delays indelivery. Rapid and significant changes in commodity prices may affect our sales and profit margins.These factors can also increase our merchandise costs and/or selling, general and administrativeexpenses, and otherwise adversely affect our operations and financial results. General economicconditions can also be affected by the outbreak of war, acts of terrorism, or other significant national orinternational events.
Our growth strategy includes expanding our business, both in existing markets and in new
markets.
Our future growth is dependent, in part, on our ability to acquire property, and build or lease newwarehouses. We compete with other retailers and businesses for suitable locations. Local land use andother regulations restricting the construction and operation of our warehouses, as well as localcommunity actions opposed to the location of our warehouses at specific sites and the adoption oflocal laws restricting our operations and environmental regulations may impact our ability to findsuitable locations, and increase the cost of constructing, leasing and operating our warehouses. Wealso may have difficulty negotiating leases or real estate purchase agreements on acceptable terms.Failure to manage these and other similar factors effectively will affect our ability to timely build orlease new warehouses, which may have a material adverse affect on our future growth andprofitability.
We seek to expand our business in existing markets in order to attain a greater overall market share.Because our warehouses typically draw members from their local areas, a new warehouse may drawmembers away from our existing warehouses and adversely affect comparable warehouse salesperformance and member traffic at those existing warehouses.
We also intend to open warehouses in new markets. The risks associated with entering a new marketinclude difficulties in attracting members due to a lack of familiarity with us, attracting members of otherwholesale club operators currently operating in the new market, our lack of familiarity with localmember preferences, and seasonal differences in the market. In addition, entry into new markets maybring us into competition with new competitors or with existing competitors with a large, establishedmarket presence. In new markets, we cannot ensure that our new warehouses will be profitablydeployed; as a result, our future profitability may be delayed or otherwise materially adversely affected.
We are highly dependent on the financial performance of our United States and Canada
operations.
Our financial and operational performance is highly dependent on our United States and Canadaoperations, which comprised 89% and 83% of consolidated net sales and operating income in 2011,respectively. Within the United States, we are highly dependent on our California operations, whichcomprised 24% of consolidated net sales in 2011. Our California market, in general, has a largerpercentage of higher volume warehouses as compared to our other markets. Any substantial slowingor sustained decline in these operations could materially adversely affect our business and financial
15

results. Declines in financial performance of our United States operations, particularly in California, andour Canada operations could arise from, among other things: failing to meet targets for warehouseopenings; declines in actual or estimated comparable warehouse sales growth rates and expectations;negative trends in operating expenses, including increased labor, healthcare and energy costs;cannibalizing existing locations with new warehouses; shifts in sales mix toward lower gross marginproducts; changes or uncertainties in economic conditions in our markets, including higher levels ofunemployment and depressed home values; and failing to consistently provide high quality productsand innovative new products to retain our existing member base and attract new members.
We depend on vendors to supply us with quality merchandise at the right prices in a timely
manner.
We depend heavily on our ability to purchase merchandise in sufficient quantities at competitive prices.We have no assurances of continued supply, pricing or access to new products, and any vendor couldat any time change the terms upon which it sells to us or discontinue selling to us. Member demandsmay lead to out-of-stock positions of our merchandise, leading to loss of sales and profits.
We purchase our merchandise from numerous domestic and foreign manufacturers and importers andhave thousands of vendor relationships. Our inability to acquire suitable merchandise on acceptableterms or the loss of key vendors could negatively affect us. We may not be able to developrelationships with new vendors, and products from alternative sources, if any, may be of a lesserquality or more expensive than those from existing vendors. Because of our efforts to adhere to highquality standards for which available supply may be limited, particularly for certain food items, the largevolume we demand may not be consistently available.
Our suppliers are subject to risks, including labor disputes, union organizing activities, financialliquidity, inclement weather, natural disasters, supply constraints, and general economic and politicalconditions, that could limit their ability to timely provide us with acceptable merchandise. For these orother reasons, one or more of our suppliers might not adhere to our quality control, legal or regulatorystandards. These deficiencies may delay or preclude delivery of merchandise to us and might not beidentified before we sell such merchandise to our members. This failure could lead to litigation andrecalls, which could damage our reputation and our brands, increase our costs, and otherwise hurt ourbusiness.
Disruptions in our depot operations could adversely affect sales and member satisfaction.
We depend on the orderly operation of the receiving and distribution process, primarily through ourdepots. Although we believe that our receiving and distribution process is efficient, unforeseendisruptions in operations due to fires, hurricanes, earthquakes or other catastrophic events, laborshortages and disagreements or shipping problems, may result in delays in the delivery ofmerchandise to our warehouses, which could adversely affect sales and the satisfaction of ourmembers.
We may not timely identify or effectively respond to consumer trends, which could negatively
affect our relationship with our members, the demand for our products and services, and our
market share.
It is difficult to consistently and successfully predict the products and services our members willdemand. Our success depends, in part, on our ability to identify and respond to trends in demographicsand consumer preferences. Failure to timely identify or effectively respond to changing consumertastes, preferences (including those relating to sustainability of product sources) and spending patternscould negatively affect our relationship with our members, the demand for our products and services
16

and our market share. If we are not successful at predicting our sales trends and adjusting ourpurchases accordingly, we may have excess inventory, which could result in additional markdowns andreduce our operating performance. This could have an adverse effect on margins and operatingincome.
Our failure to maintain positive membership loyalty and brand recognition could adversely
affect our financial results.
Membership loyalty is essential to our business model. Damage to our brands or reputation maynegatively impact comparable warehouse sales, lower employee morale and productivity, diminishmember trust, and reduce member renewal rates and, accordingly, membership fee revenues,resulting in a reduction in shareholder value.
In addition, we sell many products under our owned and exclusive Kirkland Signature brand.Maintaining consistent product quality, competitive pricing, and availability of our Kirkland Signatureproducts for our customers is essential to developing and maintaining customer loyalty. Theseproducts also generally carry higher margins than national brand products and represent a growingportion of our overall sales. If the Kirkland Signature brand experiences a loss of consumer acceptanceor confidence, our sales and gross margin results could be adversely affected.
Changes in accounting standards and subjective assumptions, estimates and judgments by
management related to complex accounting matters could significantly affect our financial
results.
Generally accepted accounting principles and related accounting pronouncements, implementationguidelines and interpretations with regard to a wide range of matters that are relevant to our business,including, but not limited to, revenue recognition, sales returns reserves, impairment of long-livedassets and warehouse closing costs, inventories, vendor rebates and other consideration, self-insurance liabilities, income taxes, unclaimed property laws and litigation, and other contingentliabilities are highly complex and involve many subjective assumptions, estimates and judgments byour management. Changes in these rules or their interpretation or changes in underlying assumptions,estimates or judgments by our management could significantly change our reported or expectedfinancial performance. Provisions for losses related to self-insured risks are generally based uponindependent actuarially determined estimates. The assumptions underlying the ultimate costs ofexisting claim losses can be highly unpredictable, which can affect the liability recorded for suchclaims. For example, variability in inflation rates of health care costs inherent in these claims can affectthe amounts realized. In March 2010, the Patient Protection and Affordable Care Act and the HealthCare and Education Reconciliation Act of 2010 were enacted. This legislation expands health carecoverage to many uninsured individuals and expands coverage to those already insured. We expectour healthcare costs to increase, but not materially, as a result of this legislation. Similarly, changes inlegal trends and interpretations, as well as a change in the nature and method of how claims aresettled can impact ultimate costs. Although our estimates of liabilities incurred do not anticipatesignificant changes in historical trends for these variables, any changes could have a considerableeffect upon future claim costs and currently recorded liabilities and could materially impact ourconsolidated financial statements.
Unfavorable changes in tax rates could adversely affect our operations, financial conditions or
cash flows.
We compute our income tax provision based on enacted tax rates in the countries in which we operate.As the tax rates vary among countries, a change in earnings attributable to the various jurisdictions inwhich we operate could result in an unfavorable change in our overall tax provision. Additionally, any
17

change in the enacted tax rates, any adverse outcome in connection with any income tax audits in anyjurisdiction, including transfer pricing disputes, or any change in the pronouncements relating toaccounting for income taxes may have a material adverse affect on our financial condition, results ofoperations, or cash flows.
Failure of our internal control over financial reporting could make our financial results
inaccurate or untimely.
Our management is responsible for establishing and maintaining adequate internal control overfinancial reporting. Internal control over financial reporting is designed to provide reasonable assuranceregarding the reliability of financial reporting for external purposes in accordance with U.S. generallyaccepted accounting principles. Internal control over financial reporting includes: maintaining recordsthat in reasonable detail accurately and fairly reflect our transactions; providing reasonable assurancethat transactions are recorded as necessary for preparation of the financial statements; providingreasonable assurance that our receipts and expenditures of our assets are made in accordance withmanagement authorization; and providing reasonable assurance that unauthorized acquisition, use ordisposition of our assets that could have a material effect on the financial statements would beprevented or detected on a timely basis. Because of its inherent limitations, internal control overfinancial reporting is not intended to and cannot provide absolute assurance that a misstatement of ourfinancial statements would be prevented or detected. Any failure to maintain an effective system ofinternal control over financial reporting could limit our ability to report our financial results accuratelyand timely or to detect and prevent fraud.
We rely extensively on computer systems to process transactions, summarize results and
manage our business. Disruptions in both our primary and back-up systems could harm our
business.
Although we believe that we have independent, redundant, and primary and secondary computersystems, given the number of individual transactions we have each year it is important that wemaintain uninterrupted operation of our business-critical computer systems. Our computer systems,including our back-up systems, are subject to damage or interruption from power outages, computerand telecommunications failures, computer viruses, internal or external security breaches, catastrophicevents such as fires, earthquakes, tornadoes and hurricanes, and errors by our employees. If ourcomputer systems and our back-up systems are damaged or cease to function properly, we may haveto make significant investments to fix or replace them, and we may suffer interruptions in ouroperations in the interim. Any material interruption in our computer systems may have a materialadverse effect on our business or results of operations.
We expect to make significant technology investments in the coming years, which are key to managingour business. We must monitor and choose the right investments and implement them at the rightpace. Excessive technological change could impact the effectiveness of adoption, and could make itmore difficult for us to realize benefits from the technology. Targeting the wrong opportunities, failing tomake the best investments or making an investment commitment significantly above or below ourneeds may result in the loss of our competitive position or underlying financial data. Additionally, thecosts, potential problems, and interruptions associated with implementing technology initiatives coulddisrupt or reduce the efficiency of our operations in the short term. These initiatives might not providethe anticipated benefits or provide them in a delayed or more costly manner.
18

Our international operations subject us to risks associated with the legislative, judicial,
accounting, regulatory, political and economic factors specific to the countries or regions in
which we operate, which could adversely affect our financial performance.
During 2011, our international operations, including Canada, generated 27% of our consolidated netsales. We plan to continue expanding our international operations. As a result of these expansionactivities in countries outside the United States, we expect that our international operations couldaccount for a larger portion of our net sales in future years. Future operating results internationallycould be negatively affected by a variety of factors, many beyond our control and similar to those weface in the United States. These factors include political conditions, economic conditions, regulatoryconstraints, currency regulations and exchange rates, and other matters in any of the countries orregions in which we operate, now or in the future. Other factors that may impact internationaloperations include foreign trade, monetary and fiscal policies both of the United States and of othercountries, laws and regulations of foreign governments and the United States (such as the ForeignCorrupt Practices Act), agencies and similar organizations, and risks associated with having majorfacilities located in countries which have been historically less stable than the United States. Risksinherent in international operations also include, among others, the costs and difficulties of managinginternational operations, adverse tax consequences and greater difficulty in enforcing intellectualproperty rights. Additionally, foreign currency exchange rates and fluctuations may have an adverseimpact on our future costs or on future cash flows from our international operations.
Market expectations for our financial performance is high.
We believe that the price of our stock generally reflects high market expectations for our futureoperating results. Any failure to meet or delay in meeting these expectations, including our comparablewarehouse sales growth rates, margins, earnings and earnings per share or new warehouse openings,could cause the market price of our stock to decline, as could changes in our dividend or stockrepurchase policies.
Natural disasters or other catastrophic events could unfavorably affect our financial
performance.
Natural disasters, such as hurricanes or earthquakes, particularly in California or in Washington state,where our centralized operating systems and administrative personnel are located, could unfavorablyaffect our operations and financial performance. Such events could result in physical damage to one ormore of our properties, the temporary closure of one or more warehouses or depots, the temporarylack of an adequate work force in a market, the temporary or long-term disruption in the supply ofproducts from some local and overseas suppliers, the temporary disruption in the transport of goodsfrom overseas, delays in the delivery of goods to our depots or warehouses within a country in whichwe operate and the temporary reduction in the availability of products in our warehouses. Public healthissues, such as a potential H1N1 flu (swine flu) pandemic, whether occurring in the United States orabroad, could disrupt our operations, disrupt the operations of suppliers or customers, or have anadverse impact on consumer spending and confidence levels. We may be required to suspendoperations in some or all of our locations, which could have a material adverse effect on our business,financial condition, and results of operations. These events could also reduce demand for our productsor make it difficult or impossible to receive products from suppliers.
Factors associated with climate change could adversely affect our business.
We use natural gas, diesel fuel, gasoline, and electricity in our distribution and warehouse operations.Increased government regulations to limit carbon dioxide and other greenhouse gas emissions mayresult in increased compliance costs and legislation or regulation affecting energy inputs could
19

materially affect our profitability. In addition, climate change could affect our ability to procure neededcommodities at costs and in quantities we currently experience. We also sell a substantial amount ofgasoline, the demand for which could be impacted by concerns about climate change and which alsocould face increased regulation. Climate change may be associated with extreme weather conditions,such as more intense hurricanes, thunderstorms, tornados and snow or ice storms, as well as risingsea levels. Extreme weather conditions increase our costs, and damage resulting from extremeweather may not be fully insured.
We are subject to a wide variety of federal, state, regional, local and international laws and
regulations relating to the use, storage, discharge, and disposal of hazardous materials and
hazardous and non-hazardous wastes, and other environmental matters.
Any failure to comply with these laws could result in costs to satisfy environmental compliance,remediation or compensatory requirements, or the imposition of severe penalties or restrictions onoperations by governmental agencies or courts that could adversely affect our operations.
We are involved in a number of legal proceedings and audits, and while we cannot predict the
outcomes of such proceedings and other contingencies with certainty, some of these
outcomes may unfavorably affect our operations or increase our costs.
We are or may become involved in a number of legal proceedings and audits, including grand juryinvestigations, other government investigations, consumer, employment, tort and other litigation (seediscussion of Legal Proceedings in Note 11 to the consolidated financial statements included in thisReport). We cannot predict with certainty the outcomes of these legal proceedings and othercontingencies, including environmental remediation and other proceedings commenced bygovernmental authorities. The outcome of some of these legal proceedings and other contingenciescould require us to take or refrain from taking actions which could unfavorably affect our operations orcould require us to pay substantial amounts of money. Additionally, defending against these lawsuitsand proceedings may involve significant expense and diversion of management’s attention andresources. Our business requires compliance with a great variety of laws and regulations. Failure toachieve compliance could subject us to lawsuits and other proceedings, and lead to damage awards,fines and penalties.
We are subject to the risks of selling unsafe products.
If our merchandise offerings, including food and prepared food products for human consumption, drugsand childrens’ products, do not meet or are perceived not to meet applicable safely standards or ourmembers’ expectations regarding safety, we could experience lost sales, increased costs and beexposed to legal and reputational risk. The sale of these items involves the risk of injury to ourmembers. Such injuries may result from tampering by unauthorized third parties, productcontamination or spoilage, including the presence of foreign objects, substances, chemicals, otheragents, or residues introduced during the growing, manufacturing, storage, handling and transportationphases. Our vendors are generally contractually required to comply with applicable product safetylaws, and we are dependent on them to ensure that the products we buy comply with all safetystandards. While we are subject to governmental inspection and regulations and work to comply in allmaterial respects with applicable laws and regulations, we cannot be sure that consumption of ourproducts will not cause a health-related illness in the future or that we will not be subject to claims,lawsuits, or government investigations relating to such matters, resulting in costly product recalls andother liabilities. Even if a product liability claim is unsuccessful or is not fully pursued, the negativepublicity surrounding any assertion that our products caused illness or injury could adversely affect ourreputation with existing and potential members and our corporate and brand image and these effectscould be long term.
20
Our success depends on the continued contributions of management and on our ability to
attract, train and retain highly qualified employees.
Our success depends to a significant degree on the continued contributions of members of our seniormanagement and other key operations, merchandising and administrative personnel, and the loss ofany such person(s) could have a material adverse effect on our business. Other than an annualagreement with our CEO, Mr. Sinegal, we have no employment agreements with our officers. We mustattract, train and retain a large and growing number of highly qualified employees, while controllingrelated labor costs and maintaining our core values. Our ability to control labor costs is subject tonumerous external factors, including prevailing wage rates and healthcare and other insurance costs.We compete with other retail and non-retail businesses for these employees and invest significantresources in training and motivating them. There is no assurance that we will be able to attract or retainhighly qualified employees in the future, which could have a material adverse effect on the Company’sbusiness, results of operations and financial condition. The Company does not maintain key maninsurance.
If we do not maintain the privacy and security of member-related and business information, we
could damage our reputation with members, incur substantial additional costs and become
subject to litigation.
We receive, retain, and transmit certain personal information about our members. In addition, ouronline operations at www.costco.com and www.costco.ca depend upon the secure transmission ofconfidential information over public networks, including information permitting cashless payments. Acompromise of our security systems or those of other business partners that results in our members’personal information being obtained by unauthorized persons could adversely affect our reputation withour members and others, as well as our operations, results of operations, financial condition andliquidity, and could result in litigation against us or the imposition of penalties. In addition, a securitybreach could require that we expend significant additional resources related to the security ofinformation systems and could result in a disruption of our operations, particularly our online salesoperations.
Additionally, the use of individually identifiable data by our business and our business associates isregulated at the international, federal and state levels. Privacy and information security laws andregulations change, and compliance with them may result in cost increases due to necessary systemschanges and the development of new administrative processes. If we or those with whom we shareinformation fail to comply with these laws and regulations or experience a data security breach, ourreputation could be damaged, possibly resulting in lost future business, and we could be subjected toadditional legal risk as a result of non-compliance.
Our security measures may be undermined due to the actions of outside parties, employee error,malfeasance, or otherwise, and, as a result, an unauthorized party may obtain access to our datasystems and misappropriate business and personal information. Because the techniques used toobtain unauthorized access, disable or degrade service, or sabotage systems change frequently andmay not immediately produce signs of intrusion, we may be unable to anticipate these techniques or toimplement adequate preventative measures. Any such breach or unauthorized access could result insignificant legal and financial exposure, damage to our reputation, and potentially have an adverseeffect on our business.
21
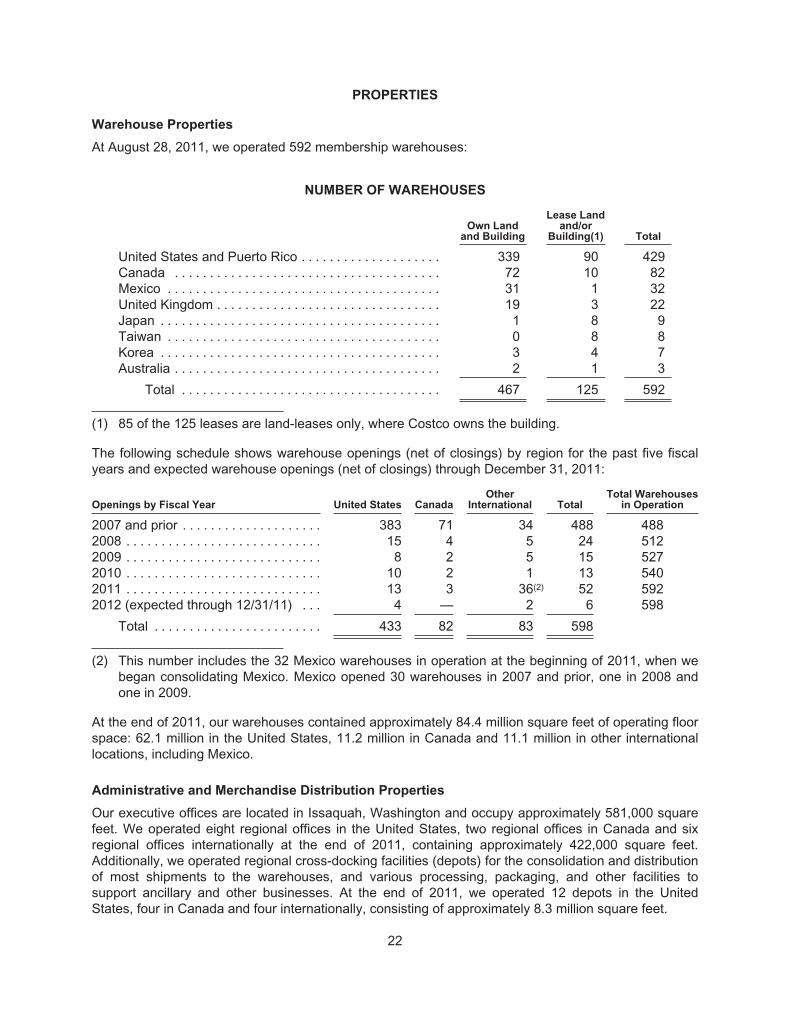
PROPERTIES
Warehouse Properties
At August 28, 2011, we operated 592 membership warehouses:
NUMBER OF WAREHOUSES
Own Landand Building
Lease Landand/or
Building(1) Total
United States and Puerto Rico . . . . . . . . . . . . . . . . . . . . 339 90 429Canada . . . . . . . . . . . . . . . . . . . . . . . . . . . . . . . . . . . . . . 72 10 82Mexico . . . . . . . . . . . . . . . . . . . . . . . . . . . . . . . . . . . . . . . 31 1 32United Kingdom . . . . . . . . . . . . . . . . . . . . . . . . . . . . . . . . 19 3 22Japan . . . . . . . . . . . . . . . . . . . . . . . . . . . . . . . . . . . . . . . . 1 8 9Taiwan . . . . . . . . . . . . . . . . . . . . . . . . . . . . . . . . . . . . . . . 0 8 8Korea . . . . . . . . . . . . . . . . . . . . . . . . . . . . . . . . . . . . . . . . 3 4 7Australia . . . . . . . . . . . . . . . . . . . . . . . . . . . . . . . . . . . . . . 2 1 3
Total . . . . . . . . . . . . . . . . . . . . . . . . . . . . . . . . . . . . . 467 125 592
(1) 85 of the 125 leases are land-leases only, where Costco owns the building.
The following schedule shows warehouse openings (net of closings) by region for the past five fiscalyears and expected warehouse openings (net of closings) through December 31, 2011:
Openings by Fiscal Year United States CanadaOther
International TotalTotal Warehouses
in Operation
2007 and prior . . . . . . . . . . . . . . . . . . . . 383 71 34 488 4882008 . . . . . . . . . . . . . . . . . . . . . . . . . . . . 15 4 5 24 5122009 . . . . . . . . . . . . . . . . . . . . . . . . . . . . 8 2 5 15 5272010 . . . . . . . . . . . . . . . . . . . . . . . . . . . . 10 2 1 13 5402011 . . . . . . . . . . . . . . . . . . . . . . . . . . . . 13 3 36(2) 52 5922012 (expected through 12/31/11) . . . 4 — 2 6 598
Total . . . . . . . . . . . . . . . . . . . . . . . . 433 82 83 598
(2) This number includes the 32 Mexico warehouses in operation at the beginning of 2011, when webegan consolidating Mexico. Mexico opened 30 warehouses in 2007 and prior, one in 2008 andone in 2009.
At the end of 2011, our warehouses contained approximately 84.4 million square feet of operating floorspace: 62.1 million in the United States, 11.2 million in Canada and 11.1 million in other internationallocations, including Mexico.
Administrative and Merchandise Distribution Properties
Our executive offices are located in Issaquah, Washington and occupy approximately 581,000 squarefeet. We operated eight regional offices in the United States, two regional offices in Canada and sixregional offices internationally at the end of 2011, containing approximately 422,000 square feet.Additionally, we operated regional cross-docking facilities (depots) for the consolidation and distributionof most shipments to the warehouses, and various processing, packaging, and other facilities tosupport ancillary and other businesses. At the end of 2011, we operated 12 depots in the UnitedStates, four in Canada and four internationally, consisting of approximately 8.3 million square feet.
22

MARKET FOR COSTCO COMMON STOCK
Market Information and Dividend Policy
Our common stock is traded on the National Market tier of NASDAQ under the symbol “COST.” OnSeptember 30, 2011, we had 8,198 stockholders of record.
The following table shows the quarterly high and low closing sale prices as reported by NASDAQ foreach quarter during the last two fiscal years and the quarterly cash dividend declared per share of ourcommon stock during the periods indicated.
Price RangeCash
DividendsDeclaredHigh Low
2011:Fourth Quarter . . . . . . . . . . . . . . . . . . . . . . . . . . . . . . . . . . . . . . . . . . . $83.86 $70.39 $0.240Third Quarter . . . . . . . . . . . . . . . . . . . . . . . . . . . . . . . . . . . . . . . . . . . . 81.46 69.76 0.240Second Quarter . . . . . . . . . . . . . . . . . . . . . . . . . . . . . . . . . . . . . . . . . . 75.04 66.90 0.205First Quarter . . . . . . . . . . . . . . . . . . . . . . . . . . . . . . . . . . . . . . . . . . . . . 67.02 56.07 0.205
2010:Fourth Quarter . . . . . . . . . . . . . . . . . . . . . . . . . . . . . . . . . . . . . . . . . . . 59.16 53.61 0.205Third Quarter . . . . . . . . . . . . . . . . . . . . . . . . . . . . . . . . . . . . . . . . . . . . 61.74 57.31 0.205Second Quarter . . . . . . . . . . . . . . . . . . . . . . . . . . . . . . . . . . . . . . . . . . 60.89 57.07 0.180First Quarter . . . . . . . . . . . . . . . . . . . . . . . . . . . . . . . . . . . . . . . . . . . . . 61.12 50.65 0.180
Payment of future dividends is subject to declaration by the Board of Directors. Factors considered indetermining the size of the dividends are our profitability and expected capital needs. Subject to thesequalifications, we presently expect to continue to pay dividends on a quarterly basis.
Issuer Purchases of Equity Securities (dollars in millions, except per share data)
The following table sets forth information on our common stock repurchase program activity for the16-week fourth quarter of fiscal 2011:
Period(1)
TotalNumber
of SharesPurchased
AveragePrice Paidper Share
Total Number ofShares
Purchased asPart of Publicly
AnnouncedPrograms(2)
Maximum DollarValue of Sharesthat May Yet be
Purchased Underthe Programs(2)
May 9, 2011 – June 5, 2011 . . . . . . . . . . . . . . 70,000 $79.16 70,000 $3,994June 6, 2011 – July 3, 2011 . . . . . . . . . . . . . . 1,052,000 79.56 1,052,000 $3,911July 4, 2011 – July 31, 2011 . . . . . . . . . . . . . . 917,000 80.64 917,000 $3,837August 1, 2011 – August 28, 2011 . . . . . . . . . 1,756,000 74.85 1,756,000 $3,706
Total fourth quarter . . . . . . . . . . . . . . . . . . 3,795,000 $77.63 3,795,000
(1) Monthly information is presented by reference to our fiscal periods during the fourth quarter offiscal 2011.
(2) Our stock repurchase program is conducted under a $4,000 authorization of our Board ofDirectors approved in April 2011, which expires in April 2015.
Equity Compensation Plans
Information related to our equity compensation plans is incorporated herein by reference to the ProxyStatement. The Proxy Statement was filed with the SEC within 120 days of the end of our fiscal year.
23

Performance Graph
The following graph compares the cumulative total shareholder return (stock price appreciation plusdividends) on our common stock for the last five years with the cumulative total return of the S&P 500Index and the following group of peer companies (based on weighted market capitalization) selectedby the Company: BJ’s Wholesale Club, Inc.; The Home Depot, Inc.; Lowe’s Companies; Best Buy Co.,Inc.; Office Depot, Inc.; Staples Inc.; Target Corporation; Kroger Company; and Wal-Mart Stores, Inc.The information provided is from September 3, 2006 through August 28, 2011.
COMPARISON OF 5-YEAR CUMULATIVE TOTAL RETURN
AMONG COSTCO WHOLESALE CORPORATION,
S&P 500 INDEX AND PEER GROUP INDEX
0
25
50
75
100
125
150
175
200
9/03/06 9/02/07 8/31/08 8/30/09 8/29/10 8/28/11
DOLLARS
COSTCO WHOLESALE CORPORATION PEER GROUP INDEX S&P 500 INDEX
The graph assumes the investment of $100 in Costco common stock, the S&P 500 Index and the PeerGroup Index on September 3, 2006 and reinvestment of all dividends.
Available Information
Our internet website is www.costco.com. We make available through the Investor Relations section ofthat site, free of charge, our Annual Reports on Form 10-K, Quarterly Reports on Form 10-Q, CurrentReports on Form 8-K, Proxy Statements and Forms 3, 4 and 5, and any amendments to those reports,as soon as reasonably practicable after filing such materials with, or furnishing such documents to, theSecurities and Exchange Commission (SEC). The information found on our website is not part of thisor any other report filed with or furnished to the SEC.
FIVE YEAR OPERATING AND FINANCIAL HIGHLIGHTS
The following table sets forth certain information concerning our consolidated financial condition,operating results, and key operating metrics. This information should be read in conjunction withManagement’s Discussion and Analysis of Financial Condition and Results of Operations, and ourConsolidated Financial Statements included in this Report.
24

At the beginning of fiscal 2011, we began consolidating our 50% owned Mexico joint venture (Mexico)on a prospective basis due to the adoption of a new accounting standard. Mexico’s results for the prioryears were accounted for under the equity method and our 50% share was included in “interest incomeand other” in the consolidated statements of income. In the current year, the financial position andresults of Mexico’s operations are fully consolidated and the joint venture partner’s 50% share isincluded in “net income attributable to noncontrolling interests” in the consolidated statements ofincome of this Report. The initial consolidation of Mexico increased total assets, liabilities, and revenueby approximately 3%, with no impact on net income or net income per common share attributable toCostco. See discussion in Note 1 to the consolidated financial statements included in this Report.
SELECTED FINANCIAL DATA(dollars in millions, except per share and warehouse number data)
As of and for the year endedAug. 28, 2011
(52 weeks)Aug. 29, 2010
(52 weeks)Aug. 30, 2009
(52 weeks)Aug. 31, 2008
(52 weeks)Sept. 2, 2007(52 weeks)
RESULTS OF OPERATIONSNet sales . . . . . . . . . . . . . . $87,048 $76,255 $69,889 $70,977 $63,088Merchandise costs . . . . . . 77,739 67,995 62,335 63,503 56,450
Gross margin . . . . . . . 9,309 8,260 7,554 7,474 6,638Membership fees . . . . . . . . 1,867 1,691 1,533 1,506 1,313Operating income . . . . . . . 2,439 2,077 1,777 1,969 1,609Net income attributable to
Costco . . . . . . . . . . . . . . 1,462 1,303 1,086 1,283 1,083Net income per diluted
common shareattributable to Costco . . 3.30 2.92 2.47 2.89 2.37
Dividends per share . . . . . $ 0.89 $ 0.77 $ 0.68 $ 0.61 $ 0.55Increase (decrease) in
comparable warehousesales(1)
United States . . . . . . . . . . . 7% 4% (2%) 6% 5%International . . . . . . . . . . . . 16% 19% (8%) 15% 9%
Total . . . . . . . . . . . . . . . . . . 10% 7% (4%) 8% 6%
Increase in internationalcomparable warehousesales in local currency . . . . . 10% 8% 7% 6% 5%
BALANCE SHEET DATANet property and
equipment . . . . . . . . . . . $12,432 $11,314 $10,900 $10,355 $ 9,520Total assets . . . . . . . . . . . . 26,761 23,815 21,979 20,682 19,607Short-term borrowings . . . — 26 16 134 54Current portion of long-
term debt . . . . . . . . . . . . 900 — 80 6 60Long-term debt, excluding
current portion . . . . . . . . 1,253 2,141 2,130 2,206 2,108Costco stockholders’
equity . . . . . . . . . . . . . . . $12,002 $10,829 $10,024 $ 9,194 $ 8,626WAREHOUSE INFORMATIONWarehouses in Operation(2)
Beginning of year(2) . . . . . 572 527 512 488 458Opened(3) . . . . . . . . . . . . . 24 14 19 34 30Closed(3) . . . . . . . . . . . . . . (4) (1) (4) (10) —
End of year . . . . . . . . . . . . . 592 540 527 512 488
(1) Includes net sales at warehouses open greater than one year, including relocated facilities.
(2) Excludes, in 2010 and in prior years presented, warehouses operated in Mexico through a 50% owned joint venture. Mexicoopened 30 of these warehouses in 2007 and prior, one in 2008, and one in 2009. The 2011 beginning-of-year figureincludes the 32 Mexico warehouses consolidated at the beginning of the fiscal year.
(3) Includes warehouse relocations and the closure in July 2009 of two Costco Home locations.
25

MANAGEMENT’S DISCUSSION AND ANALYSIS OF
FINANCIAL CONDITION AND RESULTS OF OPERATIONS(dollars in millions, except per share and warehouse number data)
OVERVIEW
We believe that the most important driver of increasing our profitability is sales growth, particularlycomparable sales growth (sales in warehouses open for at least one year). Comparable sales growthis achieved through increasing the frequency with which our members shop and the amounts theyspend on each visit. Sales comparisons can also be particularly influenced by two factors that arebeyond our control, including fluctuations in currency exchange rates (with respect to the consolidationof the results of our international operations) and changes in the cost of gasoline and associatedcompetitive conditions (primarily impacting domestic operations). The higher our comparable sales themore we can leverage certain of our selling, general and administrative expenses, reducing them as apercentage of sales and enhancing profitability. Generating comparable sales growth is foremost aquestion of making available to our members the right merchandise at the right prices, a skill that webelieve we have repeatedly demonstrated over the long term. Another substantial factor in salesgrowth is the health of the economies in which we do business, especially the United States. Salesgrowth and our gross margin are also impacted by our competition, which is vigorous and widespread,including a wide range of global, national and regional wholesalers and retailers, includingsupermarkets, supercenter stores, department and specialty stores, gasoline stations, and internet-based retailers. While we cannot control or reliably predict general economic health or changes incompetition, we believe that we have been successful historically in adapting our business to thesechanges, such as through adjustments to our pricing and to our merchandise mix, including increasingthe penetration of our private label items. Our philosophy is not to focus in the short term onmaximizing prices that our members can be charged but to maintain what we believe is a perceptionamong our members of our “pricing authority”—consistently providing the most competitive values.This may cause us, for example, to absorb increases in merchandise costs at certain times rather thanimmediately passing them along to our members, negatively impacting gross margin.
We also achieve sales growth by opening new warehouses and relocating existing warehouses tolarger and better-located facilities. As our warehouse base grows, available and desirable potentialsites become more difficult to secure, and square footage growth becomes a comparatively lesssubstantial component of growth. However, the negative aspects of such growth, including lower initialoperating profitability relative to existing warehouses and cannibalization of sales at existingwarehouses when openings occur in existing markets, are ameliorated. Our rate of square footagegrowth is higher in foreign markets, due to the smaller base in those markets, and we expect that tocontinue.
Our financial performance also depends heavily on our ability to control costs. While we believe thatwe have achieved successes in this area historically, some significant costs are partially outside ourcontrol, most particularly health care and utility expenses. With respect to expenses relating to thecompensation of our employees, our philosophy is not to seek to minimize the wages and benefits thatthey earn. Rather, we believe that achieving our longer-term objectives of reducing employee turnoverand enhancing employee satisfaction requires maintaining compensation levels that are better than theindustry average for much of our workforce. This may cause us, for example, to absorb costs that otheremployers might seek to pass through to their workforces. Because our business is operated on lowmargins, modest changes in various items in the income statement, particularly gross margin andselling, general and administrative expenses, can have substantial impacts on net income.
26
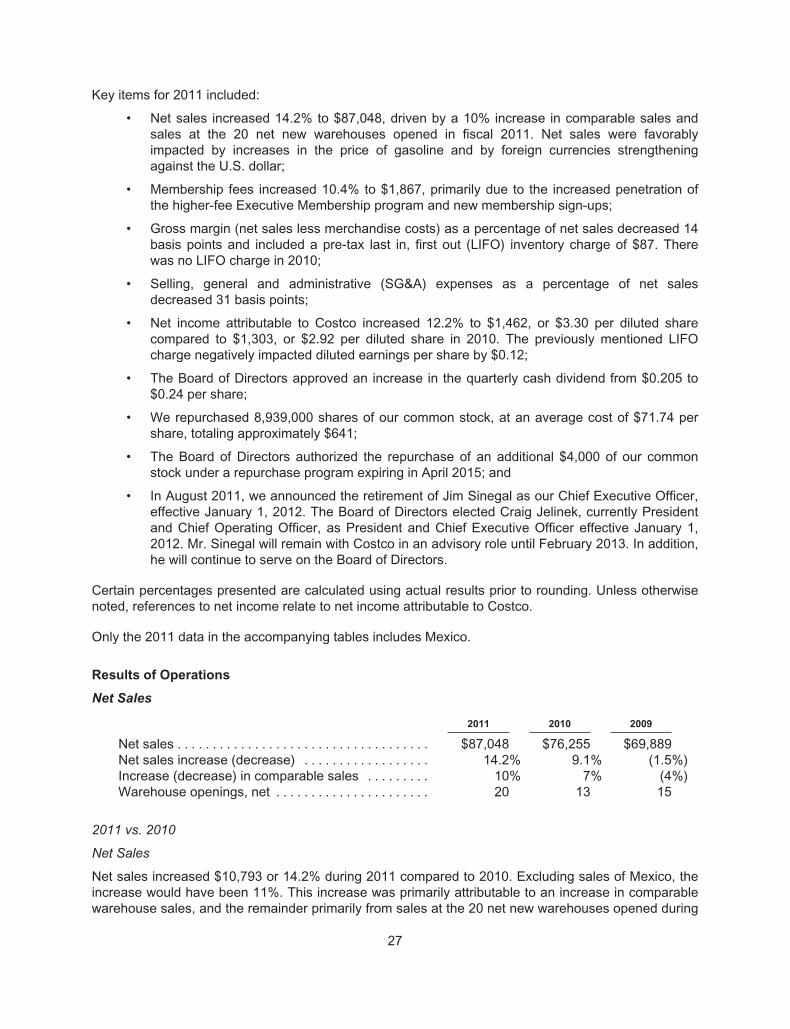
Key items for 2011 included:
• Net sales increased 14.2% to $87,048, driven by a 10% increase in comparable sales andsales at the 20 net new warehouses opened in fiscal 2011. Net sales were favorablyimpacted by increases in the price of gasoline and by foreign currencies strengtheningagainst the U.S. dollar;
• Membership fees increased 10.4% to $1,867, primarily due to the increased penetration ofthe higher-fee Executive Membership program and new membership sign-ups;
• Gross margin (net sales less merchandise costs) as a percentage of net sales decreased 14basis points and included a pre-tax last in, first out (LIFO) inventory charge of $87. Therewas no LIFO charge in 2010;
• Selling, general and administrative (SG&A) expenses as a percentage of net salesdecreased 31 basis points;
• Net income attributable to Costco increased 12.2% to $1,462, or $3.30 per diluted sharecompared to $1,303, or $2.92 per diluted share in 2010. The previously mentioned LIFOcharge negatively impacted diluted earnings per share by $0.12;
• The Board of Directors approved an increase in the quarterly cash dividend from $0.205 to$0.24 per share;
• We repurchased 8,939,000 shares of our common stock, at an average cost of $71.74 pershare, totaling approximately $641;
• The Board of Directors authorized the repurchase of an additional $4,000 of our commonstock under a repurchase program expiring in April 2015; and
• In August 2011, we announced the retirement of Jim Sinegal as our Chief Executive Officer,effective January 1, 2012. The Board of Directors elected Craig Jelinek, currently Presidentand Chief Operating Officer, as President and Chief Executive Officer effective January 1,2012. Mr. Sinegal will remain with Costco in an advisory role until February 2013. In addition,he will continue to serve on the Board of Directors.
Certain percentages presented are calculated using actual results prior to rounding. Unless otherwisenoted, references to net income relate to net income attributable to Costco.
Only the 2011 data in the accompanying tables includes Mexico.
Results of Operations
Net Sales
2011 2010 2009
Net sales . . . . . . . . . . . . . . . . . . . . . . . . . . . . . . . . . . . . $87,048 $76,255 $69,889Net sales increase (decrease) . . . . . . . . . . . . . . . . . . 14.2% 9.1% (1.5%)Increase (decrease) in comparable sales . . . . . . . . . 10% 7% (4%)Warehouse openings, net . . . . . . . . . . . . . . . . . . . . . . 20 13 15
2011 vs. 2010
Net Sales
Net sales increased $10,793 or 14.2% during 2011 compared to 2010. Excluding sales of Mexico, theincrease would have been 11%. This increase was primarily attributable to an increase in comparablewarehouse sales, and the remainder primarily from sales at the 20 net new warehouses opened during
27

2011 (24 opened, and four closed, two due to relocation and two temporarily closed for repairs due todamage caused by the March 11, 2011 Japan earthquake, one of which remained closed as of the endof 2011).
Foreign currencies strengthened against the U.S. dollar, which positively impacted net sales during2011 by approximately $1,308, or 172 basis points. Net sales were also positively impacted bygasoline price increases during 2011 by approximately $1,699, or 223 basis points, which resultedfrom a 24% increase in the average sales price per gallon.
Our sales results continued to be impacted, albeit to a lesser extent than in 2010, by general economicconditions, and those conditions may continue to have an adverse impact on spending by ourmembers. We believe, however, that due to the nature of our business model, we are better positionedthan many retailers to compete in such an environment.
Comparable Sales
Comparable sales, including Mexico for both this year and last year, increased 10% during 2011, andwere positively impacted by increases in the average amount spent by our members and in theirshopping frequency. The strengthening of foreign currencies favorably impacted comparable sales byapproximately $1,260, or 162 basis points during 2011. Gasoline price inflation positively impactedcomparable sales results by approximately $1,679, or 220 basis points during 2011. Reportedcomparable sales growth includes the negative impact of cannibalization (established warehouseslosing sales to our newly opened locations).
2010 vs. 2009
Net Sales
Net sales increased $6,366 or 9.1% during 2010 compared to 2009. The increase was primarilyattributable to an increase in comparable warehouse sales and the remainder primarily from sales atthe 13 net new warehouses opened during 2010 (14 opened and one closed due to a relocation).
Foreign currencies strengthened against the U.S. dollar, which positively impacted net sales during2010 by approximately $1,570 or 225 basis points. Net sales were also positively impacted by gasolineprice inflation during 2010 by approximately $895, or 128 basis points, which resulted from a 17%increase in the average sales price per gallon.
Comparable Sales
Comparable sales increased 7% in 2010 and were positively impacted primarily by an increase inshopping frequency. Strengthening foreign currencies positively impacted comparable sales byapproximately $1,510, or 217 basis points, in 2010. Gasoline price inflation positively impactedcomparable sales results by approximately $882, or 126 basis points, during 2010. Reportedcomparable sales growth includes the negative impact of cannibalization (established warehouseslosing sales to our newly opened locations).
Membership Fees
2011 2010 2009
Membership fees . . . . . . . . . . . . . . . . . . . . . . . . . . . . . . . . $1,867 $1,691 $1,533Membership fees increase . . . . . . . . . . . . . . . . . . . . . . . . 10.4% 10.3% 1.8%Membership fees as a percent of net sales . . . . . . . . . . . 2.15% 2.22% 2.19%Total cardholders (000’s) . . . . . . . . . . . . . . . . . . . . . . . . . . 64,000 58,000 56,000
28

2011 vs. 2010
Membership fees increased 10.4% in 2011. Excluding membership fees from Mexico, the increasewould have been 8.3% in 2011. This increase was due to the higher penetration of our higher-feeExecutive Membership program and the additional membership sign-ups at the 20 net newwarehouses opened during 2011. Our member renewal rates are consistent with recent years,currently at 89% in the U.S. and Canada, and approximately 86% on a worldwide basis.
Foreign currencies strengthened against the U.S. dollar, which positively impacted membership fees in2011 by approximately $30.
2010 vs. 2009
Membership fees increased 10.3% in 2010 compared to 2009. Membership fees in 2010 werepositively impacted due to the increased penetration of our higher-fee Executive Membership program,the continued benefit of membership sign-ups at warehouses opened in 2009, a 2009 $27 charge tomembership fees related to a litigation settlement concerning our membership renewal policy, and theadditional membership sign-ups at the 13 net new warehouses opened in 2010. Our member renewalrate at the end of 2010 was 88% in the U.S. and Canada. Foreign currencies strengthened against theU.S. dollar in 2010, which positively impacted membership fees by approximately $36.
Gross Margin
2011 2010 2009
Gross margin . . . . . . . . . . . . . . . . . . . . . . . . . . . . . . . . . . . $9,309 $8,260 $7,554Gross margin increase . . . . . . . . . . . . . . . . . . . . . . . . . . . . 12.7% 9.4% 1.1%Gross margin as a percent of net sales . . . . . . . . . . . . . . 10.69% 10.83% 10.81%
2011 vs. 2010
Gross margin as a percent of net sales decreased 14 basis points compared to 2010. Gross margin forcore merchandise categories (food and sundries, hardlines, softlines, and fresh foods), whenexpressed as a percent of core merchandise sales, rather than total net sales, increased 18 basispoints, primarily due to hardlines and food and sundries. However, when the core merchandise grossmargin is expressed as a percentage of total net sales, it decreased two basis points from the prioryear due primarily to the increased sales penetration of the lower-margin gasoline business.Warehouse ancillary and other businesses gross margins decreased by two basis points as a percentof total net sales. The gross margin comparison was negatively impacted by $87 or 10 basis points dueto a LIFO inventory charge recorded in 2011. The charge resulted from higher costs for ourmerchandise inventories, primarily food and sundries and gasoline. There was no LIFO inventorycharge recorded in 2010.
Excluding the impact of consolidating Mexico, the gross margin comparison as a percent of net saleswould have been a decrease of 18 basis points during 2011. Foreign currencies strengthened againstthe U.S. dollar, which positively impacted gross margin in 2011 by approximately $149.
2010 vs. 2009
Gross margin as a percent of net sales increased two basis points compared to 2009. Gross Margin forcore merchandise categories, when expressed as a percent of core merchandise sales, rather thantotal net sales, increased 25 basis points year-over-year, with all categories showing increases.However, the increased sales penetration of the lower margin gasoline business caused this increaseto be only six basis points when expressed as a percent of total net sales. Warehouse ancillary
29

businesses gross margins increased by three basis points as a percent of total net sales. In addition,gross margin comparisons were negatively impacted by five basis points due to a favorable $32 LIFOadjustment in 2009 compared to no LIFO adjustment in 2010. Increased penetration of the ExecutiveMembership two-percent reward program and increased spending by Executive Members negativelyaffected gross margin by two basis points. Foreign currencies strengthened against the U.S. dollar in2010, which positively impacted gross margin by approximately $183.
Selling, General and Administrative Expenses
2011 2010 2009
Selling, general and administrative expenses . . . . . . . . . $8,682 $7,840 $7,252SG&A as a percent of net sales . . . . . . . . . . . . . . . . . . . . 9.97% 10.28% 10.38%
2011 vs. 2010
SG&A expenses as a percent of net sales decreased 31 basis points compared to 2010; excluding theeffect of gasoline price inflation on net sales, the decrease was 11 basis points. The year-over-yeardecrease was due to a 15 basis point improvement in our warehouse operating costs, largely payroll.This improvement was partially offset by a non-recurring benefit of $24, or three basis points, recordedin fiscal 2010 related to the refund of a previously recorded Canadian employee tax liability.
The consolidation of Mexico, which compared to our other operating segments has lower SG&Aexpenses as a percent of its own net sales, favorably impacted SG&A expenses as a percent of netsales by seven basis points in 2011. Foreign currencies strengthened against the U.S. dollar, whichnegatively impacted SG&A during 2011 by approximately $116.
2010 vs. 2009
SG&A expenses as a percent of net sales improved ten basis points compared to 2009; excluding theeffect of gasoline price inflation on net sales SG&A expense increased three basis points. Warehouseoperating costs, excluding the effect of gasoline price inflation, increased seven basis points, primarilydue to higher employee benefit costs, particularly employee healthcare and workers’ compensation.SG&A expense comparisons were positively impacted by six basis points related to: a $24 refund of apreviously recorded Canadian employee tax liability; and a $23 charge recorded in 2009 to write downthe net realizable value of the cash surrender value of employee life insurance contracts with nocomparable charge in 2010. Foreign currencies strengthened against the U.S. dollar, which negativelyimpacted SG&A for 2010 by approximately $140.
Preopening Expenses
2011 2010 2009
Preopening expenses . . . . . . . . . . . . . . . . . . . . . . . . . . . . . . . . . . . . $46 $26 $41
Warehouse openings, including relocations . . . . . . . . . . . . . . . . . . 24 14 19
Preopening expenses include costs incurred for startup operations related to new warehouses and theexpansion of ancillary operations at existing warehouses. Preopening expenses can vary due to thenumber of warehouse openings, the timing of the opening relative to our year-end, whether thewarehouse is owned or leased, and whether the opening is in an existing, new, or international market.
30

Provision for Impaired Assets and Closing Costs, Net
2011 2010 2009
Warehouse closing expenses . . . . . . . . . . . . . . . . . . . . . . . . . . . . . . . . $8 $6 $ 9Impairment of long-lived assets . . . . . . . . . . . . . . . . . . . . . . . . . . . . . . 1 2 8
Provision for impaired assets & closing costs, net . . . . . . . . . . . . . . . . $9 $8 $17
This provision primarily includes costs related to: impairment of long-lived assets; future leaseobligations, including contract termination costs, of warehouses that have been closed or relocated tonew facilities; and accelerated depreciation, based on the shortened useful life through the expectedclosing date, on buildings to be demolished or sold and that are not otherwise impaired. Theimpairment charge in 2009 primarily related to the closing of our two Costco Home locations.
At the end of 2011 and 2010, the reserve for warehouse closing costs was $5, and primarily related tofuture lease obligations and other contractual obligations associated with exiting the properties.
Interest Expense
2011 2010 2009
Interest expense . . . . . . . . . . . . . . . . . . . . . . . . . . . . . . . . . . . . . $116 $111 $108
Interest expense primarily relates to our $900 of 5.3% and $1,100 of 5.5% Senior Notes (2007 SeniorNotes) issued in fiscal 2007. The 5.3% Senior Notes are due March 15, 2012.
Interest Income and Other, Net
2011 2010 2009
Interest income . . . . . . . . . . . . . . . . . . . . . . . . . . . . . . . . . . . . . . . . . . $41 $23 $27Earnings of affiliates and other, net . . . . . . . . . . . . . . . . . . . . . . . . . 19 65 31
Interest income and other, net . . . . . . . . . . . . . . . . . . . . . . . . . . $60 $88 $58
2011 vs. 2010
The increase in interest income year-over-year was attributable to increases in our cash and cashequivalents, including short-term investments, slightly higher interest rates, and the consolidation of ourMexico operations. The decrease in earnings of affiliates and other, net is primarily due to thepreviously discussed change in the accounting treatment of Mexico (see discussion in Note 1 to theconsolidated financial statements included in this Report). In addition, there were net gains fromforeign currency transactions and from derivative forward foreign currency contracts of $9 and $14during 2011 and 2010, respectively. See Derivatives section in Note 1 to the consolidated financialstatements included in this Report.
2010 vs. 2009
The decrease in interest income was due to lower interest rates on our cash and cash equivalents andshort-term investment balances. Interest income also includes a $12 other-than-temporary impairmentloss recognized on certain securities within our investment portfolio in 2009. No impairment wasrecognized in 2010.
The increase in earnings of affiliates and other was primarily due to an increase in earnings fromMexico, which increased due to stronger sales and the Mexican peso strengthening against the U.S.dollar. In addition, there were net gains (losses) from foreign currency transactions and from derivativeforward foreign currency contracts of $14 and ($5) in 2010 and 2009, respectively.
31
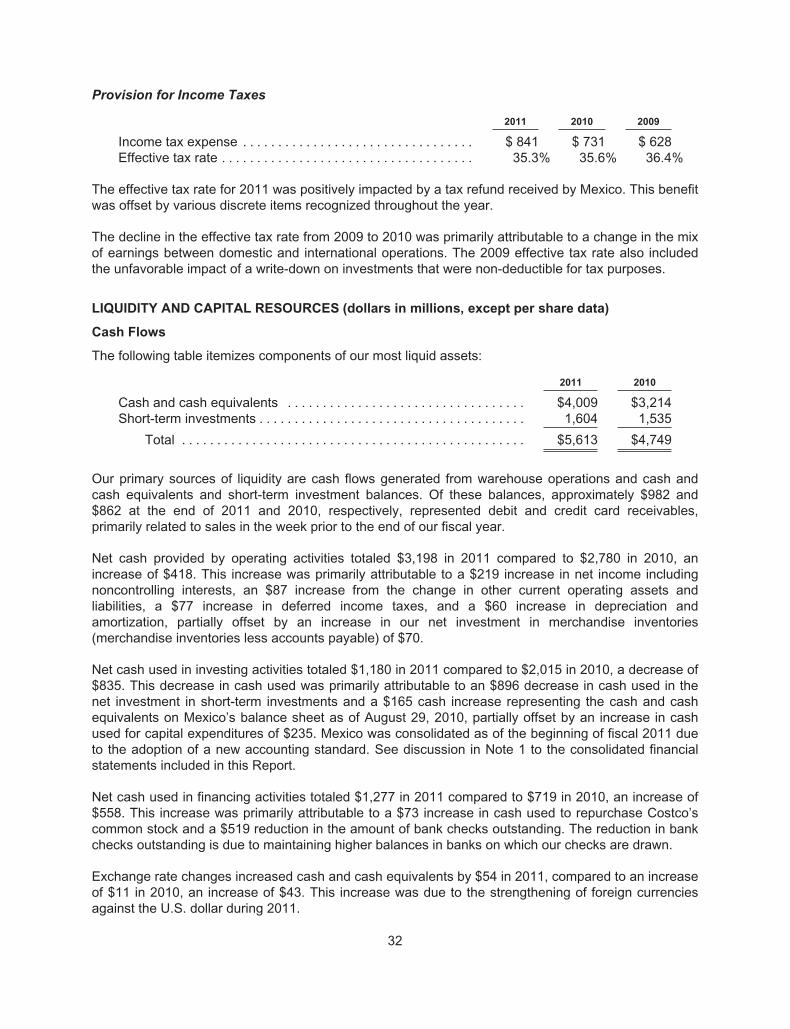
Provision for Income Taxes
2011 2010 2009
Income tax expense . . . . . . . . . . . . . . . . . . . . . . . . . . . . . . . . . $ 841 $ 731 $ 628Effective tax rate . . . . . . . . . . . . . . . . . . . . . . . . . . . . . . . . . . . . 35.3% 35.6% 36.4%
The effective tax rate for 2011 was positively impacted by a tax refund received by Mexico. This benefitwas offset by various discrete items recognized throughout the year.
The decline in the effective tax rate from 2009 to 2010 was primarily attributable to a change in the mixof earnings between domestic and international operations. The 2009 effective tax rate also includedthe unfavorable impact of a write-down on investments that were non-deductible for tax purposes.
LIQUIDITY AND CAPITAL RESOURCES (dollars in millions, except per share data)
Cash Flows
The following table itemizes components of our most liquid assets:
2011 2010
Cash and cash equivalents . . . . . . . . . . . . . . . . . . . . . . . . . . . . . . . . . . $4,009 $3,214Short-term investments . . . . . . . . . . . . . . . . . . . . . . . . . . . . . . . . . . . . . . 1,604 1,535
Total . . . . . . . . . . . . . . . . . . . . . . . . . . . . . . . . . . . . . . . . . . . . . . . . . $5,613 $4,749
Our primary sources of liquidity are cash flows generated from warehouse operations and cash andcash equivalents and short-term investment balances. Of these balances, approximately $982 and$862 at the end of 2011 and 2010, respectively, represented debit and credit card receivables,primarily related to sales in the week prior to the end of our fiscal year.
Net cash provided by operating activities totaled $3,198 in 2011 compared to $2,780 in 2010, anincrease of $418. This increase was primarily attributable to a $219 increase in net income includingnoncontrolling interests, an $87 increase from the change in other current operating assets andliabilities, a $77 increase in deferred income taxes, and a $60 increase in depreciation andamortization, partially offset by an increase in our net investment in merchandise inventories(merchandise inventories less accounts payable) of $70.
Net cash used in investing activities totaled $1,180 in 2011 compared to $2,015 in 2010, a decrease of$835. This decrease in cash used was primarily attributable to an $896 decrease in cash used in thenet investment in short-term investments and a $165 cash increase representing the cash and cashequivalents on Mexico’s balance sheet as of August 29, 2010, partially offset by an increase in cashused for capital expenditures of $235. Mexico was consolidated as of the beginning of fiscal 2011 dueto the adoption of a new accounting standard. See discussion in Note 1 to the consolidated financialstatements included in this Report.
Net cash used in financing activities totaled $1,277 in 2011 compared to $719 in 2010, an increase of$558. This increase was primarily attributable to a $73 increase in cash used to repurchase Costco’scommon stock and a $519 reduction in the amount of bank checks outstanding. The reduction in bankchecks outstanding is due to maintaining higher balances in banks on which our checks are drawn.
Exchange rate changes increased cash and cash equivalents by $54 in 2011, compared to an increaseof $11 in 2010, an increase of $43. This increase was due to the strengthening of foreign currenciesagainst the U.S. dollar during 2011.
32

Management believes that our current cash position and operating cash flows will be sufficient to meetour capital requirements for the foreseeable future. We have not provided for U.S. deferred taxes oncumulative undistributed earnings of $2,646 and $1,972 at the end of 2011 and 2010, respectively, ofcertain non-U.S. consolidated subsidiaries and other entities, including our 50% owned investment inMexico, as such earnings are deemed by us to be indefinitely reinvested. Cash and cash equivalentsand short-term investments held by these consolidated subsidiaries and other entities may not beavailable to be used for certain financing activities such as the repayment of short-term debt or torepurchase common stock. At August 28, 2011, cash and cash equivalent balances and short-terminvestments of $1,828 were held by these non-U.S. consolidated subsidiaries and other entities.
Dividends
In April 2011, our Board of Directors increased our quarterly cash dividend from $0.205 to $0.24 pershare. Our quarterly cash dividends paid in 2011 totaled $0.89 per share, as compared to $0.77 pershare in 2010.
Contractual Obligations
As of August 28, 2011, our commitments to make future payments under contractual obligations wereas follows:
Payments Due by Fiscal Year
Contractual obligations 2012 2013 to 2014 2015 to 20162017 andthereafter Total
Purchase obligations (merchandise)(1) . . . $5,879 $ — $ — $ — $ 5,879Long-term debt(2) . . . . . . . . . . . . . . . . . . . . 1,011 126 126 1,329 2,592Operating leases(3) . . . . . . . . . . . . . . . . . . . 183 357 317 1,850 2,707Purchase obligations (property,
equipment, services and other)(4) . . . . . 324 71 19 — 414Construction commitments . . . . . . . . . . . . . 191 — — — 191Capital lease obligations(2) . . . . . . . . . . . . . 13 26 26 311 376Other(5) . . . . . . . . . . . . . . . . . . . . . . . . . . . . 5 4 2 32 43
Total . . . . . . . . . . . . . . . . . . . . . . . . . . . $7,606 $584 $490 $3,522 $12,202
(1) Includes open merchandise purchase orders.
(2) Includes contractual interest payments.
(3) Operating lease obligations exclude amounts commonly referred to as common areamaintenance, taxes, and insurance and have been reduced by $183 to reflect sub-lease income.
(4) The amounts exclude certain services negotiated at the individual warehouse or regional level thatare not significant and generally contain clauses allowing for cancellation without significantpenalty.
(5) Consists of $31 in asset retirement obligations, $9 in deferred compensation obligations and $3 ofcurrent unrecognized tax benefits relating to uncertain tax positions. The total amount excludes$50 of noncurrent unrecognized tax benefits due to uncertainty regarding the timing of future cashpayments.
Expansion Plans
Our primary requirement for capital is the financing of land, buildings, and equipment costs for new andremodeled warehouses. To a lesser extent, capital is required for initial warehouse operations andworking capital. While there can be no assurance that current expectations will be realized and plans
33

are subject to change upon further review, it is our current intention to spend approximately $1,400 to$1,600 during fiscal 2012 for real estate, construction, remodeling, and equipment for warehouses andrelated operations. These expenditures are expected to be financed with a combination of cashprovided from operations and existing cash and cash equivalents and short-term investments.
We plan to open up to 20 net new warehouses in 2012, and at least one relocation of an existingwarehouse to a larger and better-located facility. In addition, the closed warehouse in Japan isexpected to re-open in the third quarter of fiscal 2012.
We opened 20 net new warehouses in 2011 and spent $1,290 on capital expenditures.
Bank Credit Facilities and Commercial Paper Programs
Credit FacilityDescription
ExpirationDate
Credit Line Activity atAugust 28, 2011
ApplicableInterest
RateEntity
Total ofall CreditFacilities
Stand-byLetter of
Credit(LC) &
Letter ofGuaranty
CommercialLC
Short-Term
BorrowingAvailable
Credit
U.S. . . . . . . . . . . . . UncommittedStandby LC
N/A $ 17 $17 $— $— $ — N/A
U.S. . . . . . . . . . . . . UncommittedCommercial LC
N/A 50 — 21 — 29 N/A
Australia(1) . . . . . . Guarantee Line N/A 10 2 — — 8 N/ACanada(1)(3) . . . . . Multi-Purpose
LineN/A 30 22 — — 8 2.35%
Japan(1)(4) . . . . . . Revolving Credit February-12 72 — — — 72 0.58%Japan(1) . . . . . . . . Bank Guaranty March-12 20 20 — — — N/AJapan(1) . . . . . . . . Revolving Credit February-12 46 — — — 46 0.58%Japan(2) . . . . . . . . Commercial LC N/A 1 — — — 1 N/AKorea(1) . . . . . . . . Multi-Purpose
LineMarch-12 11 1 1 — 9 4.39%
Mexico . . . . . . . . . . Commercial LC October-11 3 — — — 3 N/AMexico . . . . . . . . . . Commercial LC N/A 3 — — — 3 N/ATaiwan . . . . . . . . . . Multi-Purpose
LineJanuary-12 24 10 — — 14 2.75%
Taiwan . . . . . . . . . . Multi-PurposeLine
July-12 17 3 — — 14 2.79%
United Kingdom . . UncommittedMoney Market
Line
N/A 32 — — — 32 3.10%
United Kingdom . . UncommittedOverdraft Line
N/A 49 — — — 49 1.50%
UnitedKingdom(2) . . . .
Letter ofGuarantee
N/A 3 3 — — — N/A
United Kingdom . . Commercial LC N/A 3 1 — — 2 N/A
TOTAL . . . . . . . . . . . . . . . . . . . $391 $79 $22 $— $290
(1) The U.S. parent company, Costco Wholesale Corporation, guarantees this entity’s credit facility.
(2) Obligations under this facility are fully cash-collateralized by the subsidiary.
(3) The bank may cancel or restrict availability under this facility with 45-days written notice.
(4) This credit facility’s total facility amount will decrease to approximately $26 in November 2011.
34

Credit FacilityDescription
ExpirationDate
Credit Line Usage atAugust 29, 2010
ApplicableInterest
RateEntity
Total ofall CreditFacilities
Stand-byLetter of
Credit(LC) &
Letter ofGuaranty
CommercialLC
Short-Term
BorrowingAvailable
Credit
U.S. . . . . . . . . . . . . UncommittedStandby LC
N/A $ 22 $22 $— $— $ — N/A
U.S. . . . . . . . . . . . . UncommittedCommercial LC
N/A 50 — 9 — 41 N/A
Australia(1) . . . . . . Guarantee Line N/A 9 — — — 9 N/ACanada(1)(3) . . . . . Multi-Purpose
LineN/A 28 16 — — 12 2.25%
Japan(1) . . . . . . . . Revolving Credit March-11 41 — — 13 28 0.61%Japan(1) . . . . . . . . Bank Guaranty March-11 18 18 — — — N/AJapan(1) . . . . . . . . Revolving Credit February-11 41 — — 13 28 0.61%Japan(2) . . . . . . . . Commercial LC N/A 1 — — — 1 N/AKorea(1) . . . . . . . . Multi-Purpose
LineMarch-11 10 2 — — 8 3.63%
Taiwan . . . . . . . . . . Multi-PurposeLine
January-11 22 5 — — 17 2.63%
Taiwan . . . . . . . . . . Multi-PurposeLine
July-11 16 3 — — 13 2.65%
United Kingdom . . UncommittedMoney Market
Line
N/A 31 — — — 31 3.05%
United Kingdom . . UncommittedOverdraft Line
N/A 46 — — — 46 1.50%
UnitedKingdom(2) . . . .
Letter ofGuarantee
N/A 3 3 — — — N/A
United Kingdom . . Commercial LC N/A 3 1 — — 2 N/A
TOTAL . . . . . . . . . . . . . . . . . . . $341 $70 $ 9 $26 $236
(1) The U.S. parent company, Costco Wholesale Corporation, guarantees this entity’s credit facility.
(2) Obligations under this facility are fully cash-collateralized by the subsidiary.
(3) The bank may cancel or restrict availability under this facility with 45-days written notice.
For those entities with multi-purpose lines, any issuance of either letters of credit or short-termborrowings will result in a corresponding decrease in available credit. Our letter of credit facilitiesconsisted of the following at August 28, 2011 and August 29, 2010:
2011 2010
Total credit facilities for commercial and standby letter of credit . . . . . . . . $138 $123Outstanding commitments under these facilities(1) . . . . . . . . . . . . . . . . . . 101 79
(1) Includes $79 and $70 of standby letters of credit at the end of 2011 and 2010, respectively.
Financing Activities
In March 2011, we reclassified our $900 5.3% Senior Notes due March 15, 2012, originally issued inFebruary 2007, to a current liability within the current portion of long-term debt within the consolidatedbalance sheets to reflect its maturity of less than one year. Upon maturity, we intend to repay theoutstanding principal balance and associated interest with our existing liquidity sources of cash andcash equivalents and short-term investments balances.
35
In April 2010, our Japanese subsidiary paid the outstanding principal and interest balances totaling $44related to the 0.92% promissory notes due April 2010, originally issued in April 2003.
In June 2008, our Japanese subsidiary entered into a ten-year term loan in the amount of $39, with avariable rate of interest of Yen TIBOR (6-month) plus a 0.35% margin (0.79% and 0.84% at the end of2011 and 2010, respectively) on the outstanding balance. Interest is payable semi-annually inDecember and June and principal is due in June 2018.
In October 2007, our Japanese subsidiary issued promissory notes through a private placement in theamount of $85, bearing interest at 2.695%. Interest is payable semi-annually, and principal is due inOctober 2017. We guarantee all of the financial instruments issued by our Japanese subsidiary.
In February 2007, we issued $900 of 5.3% Senior Notes due March 15, 2012 (2012 Notes) at adiscount of $2 and $1,100 of 5.5% Senior Notes due March 15, 2017 (2017 Notes) at a discount of $6(together the 2007 Senior Notes). Interest on the 2007 Senior Notes is payable semi-annually onMarch 15 and September 15 of each year. The discount and issuance costs associated with the 2007Senior Notes are being amortized to interest expense over the terms of those notes. At our option, wemay redeem the 2007 Senior Notes at any time, in whole or in part, at a redemption price plus accruedinterest. The redemption price is equal to the greater of 100% of the principal amount of the 2007Senior Notes to be redeemed, or the sum of the present values of the remaining scheduled paymentsof principal and interest to maturity. Additionally, we will be required to make an offer to purchase the2007 Senior Notes at a price of 101% of the principal amount plus accrued and unpaid interest to thedate of repurchase, upon certain events as defined by the terms of the 2007 Senior Notes.
In August 1997, we sold $900 principal amount at maturity 3.5% Zero Coupon ConvertibleSubordinated Notes (Zero Coupon Notes) due in August 2017. The Zero Coupon Notes were pricedwith a yield to maturity of 3.5%, resulting in gross proceeds to the Company of $450. The remainingZero Coupon Notes outstanding are convertible into a maximum of 878,000 shares of Costco CommonStock at an initial conversion price of $22.71. Holders of the Zero Coupon Notes may require us topurchase the Zero Coupon Notes (at the discounted issue price plus accrued interest to date ofpurchase) in August 2012. At our option, we may redeem the Zero Coupon Notes (at the discountedissue price plus accrued interest to date of redemption) any time after August 2002. As of August 28,2011, $862 in principal amount of Zero Coupon Notes had been converted by note holders into sharesof Costco Common Stock, of which the principal converted during 2011, 2010 and 2009 is detailed inthe table below:
2011 2010 2009
Principal converted during period . . . . . . . . . . . . . . . . . . . . . . . . . . $ 3 $ 1 $ 25Principal converted, including the related debt discount . . . . . . . . $ 2 $ 1 $ 19Shares issued upon conversion (000’s) . . . . . . . . . . . . . . . . . . . . . 65 18 562
Derivatives
We are exposed to foreign currency exchange-rate fluctuations in the normal course of business. Wemanage these fluctuations, in part, through the use of forward foreign-exchange contracts, seeking toeconomically hedge the impact of fluctuations of foreign-exchange on known future expendituresdenominated in a foreign currency. The contracts are intended primarily to economically hedge ourexposure to U.S. dollar merchandise inventory expenditures made by our international subsidiaries orother entities whose functional currency is other than the U.S. dollar. Currently, these contracts do notqualify for derivative hedge accounting. We seek to mitigate risk with the use of these contracts and donot intend to engage in speculative transactions. These contracts do not contain any credit-risk-relatedcontingent features.
36

We seek to manage counterparty risk associated with these contracts by limiting transactions tocounterparties with which we have established banking relationships. There can be no assurance,however, that this practice effectively mitigates counterparty risk. These contracts are limited to lessthan one year in duration. See Note 1 and Note 3 to the consolidated financial statements included inthis Report for additional information on the fair value of open, unsettled forward foreign-exchangecontracts as of August 28, 2011, and August 29, 2010.
We are exposed to risks due to fluctuations in prices for energy that we consume, particularly electricityand natural gas, which we seek to partially mitigate through the use of fixed-price contracts forapproximately 36% of our warehouses and other facilities, primarily in the U.S. and Canada. We alsoenter into variable-priced contracts for some purchases of natural gas, in addition to fuel for our gasstations, on an index basis. These contracts meet the characteristics of derivative instruments butgenerally qualify for the “normal purchases or normal sales” exception under authoritative guidanceand thus require no mark-to-market adjustment.
Off-Balance Sheet Arrangements
We have no off-balance sheet arrangements that have had, or are reasonably likely to have, a materialcurrent or future effect on our financial condition or consolidated financial statements.
Stock Repurchase Programs
In April 2011, our Board of Directors authorized a new stock repurchase program in the amount of$4,000, expiring in April 2015, bringing total authorizations by our Board of Directors since inception ofthe program in 2001 to $10,800. The authorization in April 2011 revoked previously authorized butunused amounts totaling $792.
During 2011, we repurchased 8,939,000 shares of common stock, at an average price of $71.74 pershare, totaling approximately $641. During 2010, we repurchased 9,943,000 shares of common stock,at an average price of $57.14 per share, totaling approximately $568. The remaining amount availableto be purchased under our approved plan was $3,706 at the end of 2011. Purchases are made fromtime-to-time, as conditions warrant, in the open market or in block purchases and pursuant to plansunder SEC Rule 10b5-1. Repurchased shares are retired, in accordance with the WashingtonBusiness Corporation Act.
Critical Accounting Policies
The preparation of our financial statements requires that we make estimates and judgments. Wecontinue to review our accounting policies and evaluate our estimates, including those related torevenue recognition, investments, merchandise inventory valuation, impairment of long-lived assets,warehouse closing costs, insurance/self-insurance liabilities, and income taxes. We base our estimateson historical experience and on assumptions that we believe to be reasonable.
Revenue Recognition
We generally recognize sales, net of estimated returns, at the time the member takes possession ofmerchandise or receives services. When we collect payment from customers prior to the transfer ofownership of merchandise or the performance of services, the amount received is generally recordedas deferred revenue on the consolidated balance sheets until the sale or service is completed. Weprovide for estimated sales returns based on historical trends in merchandise returns, net of theestimated net realizable value of merchandise inventories to be returned and any estimated dispositioncosts. Amounts collected from members that under common trade practices are referred to as salestaxes are recorded on a net basis.
37

We evaluate whether it is appropriate to record the gross amount of merchandise sales and relatedcosts or the net amount earned as commissions. Generally, when we are the primary obligor, subjectto inventory risk, have latitude in establishing prices and selecting suppliers, influence product orservice specifications, or have several but not all of these indicators, revenue is recorded on a grossbasis. If we are not the primary obligor and do not possess other indicators of gross reporting as notedabove, we record the net amounts as commissions earned, which is reflected in net sales.
Membership fee revenue represents annual membership fees paid by our members. We account formembership fee revenue, net of estimated refunds, on a deferred basis, whereby revenue isrecognized ratably over the one-year membership period.
Our Executive members qualify for a 2% reward (which can be redeemed only at Costco warehouses),up to a maximum of approximately $500 per year, on qualified purchases made at Costco. We accountfor this 2% reward as a reduction in sales, with the related liability being classified within other currentliabilities. The sales reduction and corresponding liability are computed after giving effect to theestimated impact of non-redemptions based on historical data.
Investments
Investments are reviewed quarterly for indicators of other-than-temporary impairment. Thisdetermination requires significant judgment. We employ a methodology that considers availablequantitative and qualitative evidence. If the cost of an investment exceeds its fair value, we evaluate,among other factors, general market conditions, the duration and extent to which the fair value is lessthan cost, and our intent and ability to hold the investment. We also consider specific adverseconditions related to the financial health of and business outlook for the issuer, including industry andsector performance, operational and financing cash flow factors, and rating agency actions. Once adecline in fair value is determined to be other-than-temporary, an impairment charge is recorded and anew cost basis in the investment is established. If market, industry, and/or issuer conditionsdeteriorate, we may incur future impairments.
Merchandise Inventories
Merchandise inventories are valued at the lower of cost or market, as determined primarily by the retailinventory method, and are stated using the last-in, first-out (LIFO) method for substantially all U.S.merchandise inventories. Merchandise inventories for all foreign operations are primarily valued by theretail inventory method and are stated using the first-in, first-out (FIFO) method. We believe the LIFOmethod more fairly presents the results of operations by more closely matching current costs withcurrent revenues. We record an adjustment each quarter, if necessary, for the estimated effect ofinflation or deflation, and these estimates are adjusted to actual results determined at year-end. Due toinflation, in 2011 the merchandise inventories valued at LIFO were lower than the FIFO value, resultingin a charge to merchandise costs of $87. During 2009, due to overall net deflationary trends, theCompany recorded a $32 benefit to merchandise costs to adjust inventories valued at LIFO. At the endof 2010 and 2009, merchandise inventories valued at LIFO approximated FIFO after considering thelower of cost or market principle.
We provide for estimated inventory losses (shrink) between physical inventory counts as a percentageof net sales. The provision is adjusted periodically to reflect results of the actual physical inventorycounts, which generally occur in the second and fourth quarters of the year.
Inventory cost, where appropriate, is reduced by estimates of vendor rebates when earned or as weprogress toward earning those rebates, provided they are probable and reasonably estimable. Otherconsideration received from vendors is generally recorded as a reduction of merchandise costs uponcompletion of contractual milestones, terms of agreement, or other systematic and rational approaches.
38

Impairment of Long-Lived Assets and Warehouse Closing costs
We periodically evaluate our long-lived assets for indicators of impairment, such as a decision torelocate or close a warehouse facility. Our judgments are based on existing market and operationalconditions. Future events could cause us to conclude that impairment factors exist, requiring adownward adjustment of these assets to their then-current fair market value.
We provide estimates for warehouse closing costs for leased and owned locations to be closed orrelocated. Judgment is involved in determining any impairment or our net liability, particularly related tothe estimated sales price of owned locations and the potential sublease income at leased locations.These estimates are based on real estate conditions in the markets and our experience in thosemarkets. We make assumptions about the average period of time it would take to sublease the locationand the amount of potential sublease income for each leased location. We reassess our liability eachquarter and adjust our liability accordingly when our estimates change.
Insurance/Self-Insurance Liabilities
We use a combination of insurance and self-insurance mechanisms, including a wholly-owned captiveinsurance entity and participation in a reinsurance pool, to provide for potential liabilities for workers’compensation, general liability, property damage, directors and officers liability, vehicle liability, andemployee health care benefits. Liabilities associated with the risks that we retain are not discountedand are estimated, in part, by considering historical claims experience, demographic factors, severityfactors and other actuarial assumptions. The estimated accruals for these liabilities could besignificantly affected if future occurrences and claims differ from these assumptions and historicaltrends.
Income Taxes
The determination of our provision for income taxes requires significant judgment, the use of estimates,and the interpretation and application of complex tax laws. Significant judgment is required inassessing the timing and amounts of deductible and taxable items and the probability of sustaininguncertain tax positions. The benefits associated with uncertain tax positions are recorded in ourconsolidated financial statements only after determining a more-likely-than-not probability that thepositions will withstand challenge from tax authorities. When facts and circumstances change, wereassess these probabilities and record any changes in the consolidated financial statements asappropriate.
Recent Accounting Pronouncements
See discussion of Recent Accounting Pronouncements in Note 1 to the consolidated financialstatements included in this Report.
Quantitative and Qualitative Disclosures About Market Risk
We are exposed to financial market risk resulting from fluctuations in interest and foreign currencyexchange rates. We do not engage in speculative or leveraged transactions or hold or issue financialinstruments for trading purposes.
Interest Rate Risk
Our exposure to market risk for changes in interest rates relates primarily to our investment holdingsthat are diversified among money market funds, U.S. government and agency securities, FederalDeposit Insurance Corporation insured corporate notes, and corporate notes and bonds with effective
39

maturities of generally three months to five years at the date of purchase. The primary objective of ourinvestment activities is to preserve principal and secondarily to generate yields. The majority of ourshort-term investments are in fixed interest rate securities. These securities are subject to changes infair value due to interest rate fluctuations. A revised investment policy was approved in December2007 by our Board of Directors, limiting future investments to direct U.S. government and governmentagency obligations, repurchase agreements collateralized by U.S. government and governmentagency obligations, and U.S. government and government agency money market funds.
The investment policies of our subsidiaries are consistent with our primary objective to preserveprincipal and secondarily to generate yields. Our wholly-owned insurance subsidiary invests in U.S.government and government agency obligations, corporate notes and bonds, and asset and mortgage-backed securities with a minimum overall portfolio average credit rating of AA+. All of our foreignsubsidiaries’ investments are primarily in money market funds, investment grade securities, bankers’acceptances, bank certificates of deposit and term deposits, all denominated in their local currencies.Additionally, our Canadian subsidiary may invest a portion of its investments in U.S. dollar investmentgrade securities and bank term deposits to meet current U.S. dollar obligations.
Because most of our investments in cash and cash equivalents are short-term, interest rate changesare less likely to be material to our financial statements. Based on our overnight investments and bankbalances within cash and cash equivalents at the end of 2011 and 2010, a 100 basis point increase ordecrease in interest rates would result in an increase or decrease of approximately $29 and $23 (pre-tax), respectively, to interest income on an annual basis. For those investments that are classified asavailable-for-sale, the unrealized gains or losses related to fluctuations in market volatility and interestrates are reflected within stockholders’ equity in accumulated other comprehensive income.
The nature and amount of our long and short-term debt may vary as a result of future businessrequirements, market conditions and other factors. As of the end of 2011, our fixed-rate long-term debtincluded: $1,100 of 5.5% Senior Notes carried at $1,097; $900 of 5.3% Senior Notes carried at $900;$38 principal amount at maturity of 3.5% Zero Coupon Convertible Subordinated Notes carried at $31;and additional notes totaling $86. Additionally, our variable rate long-term debt included a 0.35% overYen Tibor (6-month) Term Loan of $39. Fluctuations in interest rates may affect the fair value of thefixed-rate debt and may affect the interest expense related to the variable rate debt. See Note 4 to theconsolidated financial statements included in this Report for more information on our long and short-term debt.
Foreign Currency-Exchange Risk
Our foreign subsidiaries conduct limited transactions in their non-functional currencies, which exposesus to fluctuations in exchange rates. We manage these fluctuations, in part, through the use of forwardforeign exchange contracts, seeking to hedge the impact of fluctuations on known future expendituresdenominated in a foreign currency. As of August 28, 2011, and August 29, 2010, we held forwardforeign exchange contracts with a notional amount of $247 and $225, respectively. At the end of 2011,the fair value of assets and liabilities recorded on our consolidated balance sheets were $1 and $2,respectively. At the end of 2010, the fair value of assets and liabilities were $1 and $3, respectively. Ahypothetical 10% strengthening of the functional currency compared to the non-functional currencyexchange rates at August 28, 2011 and August 29, 2010, would have decreased the fair value of thecontracts by $25 and $23, respectively.
40

DIRECTORS, EXECUTIVE OFFICERS AND CORPORATE GOVERNANCE
A list of Directors and nominees for Director is included in Costco’s Proxy Statement for our AnnualMeeting of Shareholders to be held on January 26, 2012. A list of the names and positions of theDirectors, as well as the Executive and Senior Officers of our Company, appears on Page 82 of thisReport. The following is a list of the names, ages and positions of the executive officers of ourCompany. All executive officers have 25 or more years of service with the Company, with theexception of Mr. Murphy who has 24 years of service.
Name Position With Company
ExecutiveOfficerSince Age
James D. Sinegal . . . . . . Chief Executive Officer. Mr. Sinegal is a co-founder of theCompany and has been a director since its inception. InFebruary 2010, Mr. Sinegal relinquished his role asPresident of the Company, which he had held since theCompany’s inception.
1983 75
Jeffrey H. Brotman . . . . . Chairman of the Board. Mr. Brotman is a co-founder of theCompany and has been a director since its inception.
1983 69
W. Craig Jelinek . . . . . . . President and Chief Operating Officer. Mr. Jelinek hasbeen President and Chief Operating Officer of theCompany since February 2010, when he also joined theBoard of Directors. Prior to that date, he was ExecutiveVice President, Chief Operating Officer, Merchandisingsince 2004.
1995 59
Richard A. Galanti . . . . . . Executive Vice President and Chief Financial Officer.Mr. Galanti has been a director of the Company sinceJanuary 1995.
1993 55
John D. McKay . . . . . . . . Executive Vice President, Chief Operating Officer,Northern and Midwest Division. Mr. McKay was SeniorVice President, General Manager, Northwest Region from2000 to March 2010.
2010 54
Paul G. Moulton . . . . . . . . Executive Vice President and Chief Information Officer.Mr. Moulton was Executive Vice President, Real EstateDevelopment until March 2010.
2001 60
James P. Murphy . . . . . . . Executive Vice President, International Division.Mr. Murphy was Senior Vice President, InternationalDivision, from September 2004 to October 2010.
2011 58
Joseph P. Portera . . . . . . Executive Vice President, Chief Operating Officer, Easternand Canadian Divisions.
1994 59
Douglas W. Schutt . . . . . . Executive Vice President, Chief Operating Officer,Merchandising. Mr. Schutt was Executive Vice President,Chief Operating Officer, Northern and Midwest Divisionfrom 2004 to March 2010.
2004 52
Thomas K. Walker . . . . . . Executive Vice President, Construction, Distribution andTraffic.
2004 71
Dennis R. Zook . . . . . . . . Executive Vice President, Chief Operating Officer,Southwest and Mexico Divisions.
1993 62
The Company has adopted a code of ethics for senior financial officers pursuant to section 406 of theSarbanes-Oxley Act. Copies of the code are available free of charge by writing to Secretary, CostcoWholesale Corporation, 999 Lake Drive, Issaquah, WA 98027. If the Company makes anyamendments to this code (other than technical, administrative, or non-substantive amendments) or
41

grants any waivers, including implicit waivers, from this code to the CEO, chief financial officer orcontroller, we will disclose (on our website or in a Form 8-K report filed with the SEC) the nature of theamendment or waiver, its effective date, and to whom it applies.
Executive Compensation
The information required by this item is incorporated herein by reference to the sections entitled“Compensation of Directors,” “Executive Compensation,” and “Compensation Discussion and Analysis”in Costco’s Proxy Statement.
MANAGEMENT’S REPORTS
Management’s Report on the Consolidated Financial Statements
Our management is responsible for the preparation, integrity and objectivity of the accompanyingconsolidated financial statements and the related financial information. The financial statements havebeen prepared in conformity with U.S. generally accepted accounting principles and necessarilyinclude certain amounts that are based on estimates and informed judgments. Our management alsoprepared the related financial information included in this Annual Report on Form 10-K and isresponsible for its accuracy and consistency with the financial statements.
The consolidated financial statements have been audited by KPMG LLP, an independent registeredpublic accounting firm, who conducted their audit in accordance with the standards of the PublicCompany Accounting Oversight Board (United States). The independent registered public accountingfirm’s responsibility is to express an opinion as to the fairness with which such financial statementspresent our financial position, results of operations and cash flows in accordance with U.S. generallyaccepted accounting principles.
Disclosure Controls and Procedures
As of the end of the period covered by this Annual Report on Form 10-K, we performed an evaluationunder the supervision and with the participation of management, including our Chief Executive Officerand Chief Financial Officer, of our disclosure controls and procedures (as defined in Rules 13a-15(e) or15d-15(e) under the Securities and Exchange Act of 1934 (the Exchange Act)). Based upon thatevaluation, our Chief Executive Officer and Chief Financial Officer concluded that, as of the end of theperiod covered by this Annual Report, our disclosure controls and procedures are effective.
There has been no change in our internal control over financial reporting (as defined in Rules 13a-15(f)or 15d-15(f) of the Exchange Act) during our most recently completed fiscal year that has materiallyaffected or is reasonably likely to materially affect our internal control over financial reporting.
The certifications required by Section 302 of the Sarbanes-Oxley Act of 2002 are filed as Exhibit 31.1in our Form 10-K filed with the SEC.
Management’s Annual Report on Internal Control over Financial Reporting
Our management is responsible for establishing and maintaining adequate internal control overfinancial reporting as defined in Rule 13a-15(f) under the Exchange Act. Our internal control overfinancial reporting is designed to provide reasonable assurance regarding the reliability of financialreporting and the preparation of financial statements for external purposes in accordance with U.S.generally accepted accounting principles and includes those policies and procedures that: (1) pertain
42

to the maintenance of records that in reasonable detail accurately and fairly reflect our transactionsand the dispositions of our assets; (2) provide reasonable assurance that our transactions are recordedas necessary to permit preparation of financial statements in accordance with generally acceptedaccounting principles, and that our receipts and expenditures are being made only in accordance withappropriate authorizations; and (3) provide reasonable assurance regarding prevention or timelydetection of unauthorized acquisition, use or disposition of our assets that could have a material effecton our financial statements.
Because of its inherent limitations, internal control over financial reporting may not prevent or detectmisstatements. Therefore, even those systems determined to be effective can provide only reasonableassurance with respect to financial statement preparation and presentation.
Under the supervision and with the participation of our management, we assessed the effectiveness ofour internal control over financial reporting as of August 28, 2011, using the criteria set forth by theCommittee of Sponsoring Organizations of the Treadway Commission (COSO) in Internal Control—Integrated Framework. Based on its assessment, management has concluded that our internal controlover financial reporting was effective as of August 28, 2011. The attestation of KPMG LLP, ourindependent registered public accounting firm, on the effectiveness of our internal control over financialreporting is included with the financial statements in this Report.
Jim SinegalChief Executive Officer
Richard A. GalantiExecutive Vice PresidentChief Financial Officer
43

REPORT OF INDEPENDENT REGISTERED PUBLIC ACCOUNTING FIRM
The Board of Directors and ShareholdersCostco Wholesale Corporation:
We have audited the accompanying consolidated balance sheets of Costco Wholesale Corporationand subsidiaries as of August 28, 2011 and August 29, 2010 and the related consolidated statementsof income, equity and comprehensive income and cash flows for each of the 52-week periods endedAugust 28, 2011, August 29, 2010, and August 30, 2009. These consolidated financial statements arethe responsibility of the Company’s management. Our responsibility is to express an opinion on theseconsolidated financial statements based on our audits.
We conducted our audits in accordance with the standards of the Public Company AccountingOversight Board (United States). Those standards require that we plan and perform the audit to obtainreasonable assurance about whether the consolidated financial statements are free of materialmisstatement. An audit includes examining, on a test basis, evidence supporting the amounts anddisclosures in the consolidated financial statements. An audit also includes assessing the accountingprinciples used and significant estimates made by management, as well as evaluating the overallconsolidated financial statement presentation. We believe that our audits provide a reasonable basisfor our opinion.
In our opinion, the consolidated financial statements referred to above present fairly, in all materialrespects, the consolidated financial position of Costco Wholesale Corporation and subsidiaries as ofAugust 28, 2011 and August 29, 2010, and the results of their operations and their cash flows for the52-week periods ended August 28, 2011, August 29, 2010, and August 30, 2009, in conformity withU.S. generally accepted accounting principles.
We also have audited, in accordance with the standards of the Public Company Accounting OversightBoard (United States), the Company’s internal control over financial reporting as of August 28, 2011,based on criteria established in Internal Control—Integrated Framework issued by the Committee ofSponsoring Organizations of the Treadway Commission (COSO), and our report dated October 14,2011 expressed an unqualified opinion on the effectiveness of the Company’s internal control overfinancial reporting.
Seattle, WashingtonOctober 14, 2011
44

REPORT OF INDEPENDENT REGISTERED PUBLIC ACCOUNTING FIRM
The Board of Directors and ShareholdersCostco Wholesale Corporation:
We have audited Costco Wholesale Corporation’s internal control over financial reporting as ofAugust 28, 2011, based on criteria established in Internal Control—Integrated Framework issued bythe Committee of Sponsoring Organizations of the Treadway Commission (COSO). The Company’smanagement is responsible for maintaining effective internal control over financial reporting and for itsassessment of the effectiveness of internal control over financial reporting, included in theaccompanying management’s annual report on internal control over financial reporting included inItem 9A. Our responsibility is to express an opinion on the Company’s internal control over financialreporting based on our audit.
We conducted our audit in accordance with the standards of the Public Company Accounting OversightBoard (United States). Those standards require that we plan and perform the audit to obtainreasonable assurance about whether effective internal control over financial reporting was maintainedin all material respects. Our audit included obtaining an understanding of internal control over financialreporting, assessing the risk that a material weakness exists, and testing and evaluating the designand operating effectiveness of internal control based on the assessed risk. Our audit also includedperforming such other procedures as we considered necessary in the circumstances. We believe thatour audit provides a reasonable basis for our opinion.
A company’s internal control over financial reporting is a process designed to provide reasonableassurance regarding the reliability of financial reporting and the preparation of financial statements forexternal purposes in accordance with generally accepted accounting principles. A company’s internalcontrol over financial reporting includes those policies and procedures that (1) pertain to themaintenance of records that, in reasonable detail, accurately and fairly reflect the transactions anddispositions of the assets of the company; (2) provide reasonable assurance that transactions arerecorded as necessary to permit preparation of financial statements in accordance with generallyaccepted accounting principles, and that receipts and expenditures of the company are being madeonly in accordance with authorizations of management and directors of the company; and (3) providereasonable assurance regarding prevention or timely detection of unauthorized acquisition, use, ordisposition of the company’s assets that could have a material effect on the financial statements.
Because of its inherent limitations, internal control over financial reporting may not prevent or detectmisstatements. Also, projections of any evaluation of effectiveness to future periods are subject to therisk that controls may become inadequate because of changes in conditions, or that the degree ofcompliance with the policies or procedures may deteriorate.
In our opinion, the Company maintained, in all material respects, effective internal control over financialreporting as of August 28, 2011, based on criteria established in Internal Control—IntegratedFramework issued by the Committee of Sponsoring Organizations of the Treadway Commission.
We also have audited, in accordance with the standards of the Public Company Accounting OversightBoard (United States), the consolidated balance sheets of the Company as of August 28, 2011 andAugust 29, 2010, and the related consolidated statements of income, equity and comprehensiveincome, and cash flows for each of the 52-week periods ended August 28, 2011, August 29, 2010, andAugust 30, 2009, and our report dated October 14, 2011 expressed an unqualified opinion on thoseconsolidated financial statements.
Seattle, WashingtonOctober 14, 2011
45

COSTCO WHOLESALE CORPORATION
CONSOLIDATED BALANCE SHEETS
(dollars in millions, except par value and share data)
August 28,2011
August 29,2010
ASSETSCURRENT ASSETS
Cash and cash equivalents . . . . . . . . . . . . . . . . . . . . . . . . . . . . . . . . . . . . . . $ 4,009 $ 3,214Short-term investments . . . . . . . . . . . . . . . . . . . . . . . . . . . . . . . . . . . . . . . . . 1,604 1,535Receivables, net . . . . . . . . . . . . . . . . . . . . . . . . . . . . . . . . . . . . . . . . . . . . . . . 965 884Merchandise inventories . . . . . . . . . . . . . . . . . . . . . . . . . . . . . . . . . . . . . . . . 6,638 5,638Deferred income taxes and other current assets . . . . . . . . . . . . . . . . . . . . . 490 437
Total current assets . . . . . . . . . . . . . . . . . . . . . . . . . . . . . . . . . . . . . . . . 13,706 11,708
PROPERTY AND EQUIPMENTLand . . . . . . . . . . . . . . . . . . . . . . . . . . . . . . . . . . . . . . . . . . . . . . . . . . . . . . . . 3,819 3,484Buildings and improvements . . . . . . . . . . . . . . . . . . . . . . . . . . . . . . . . . . . . . 10,278 9,096Equipment and fixtures . . . . . . . . . . . . . . . . . . . . . . . . . . . . . . . . . . . . . . . . . 4,002 3,513Construction in progress . . . . . . . . . . . . . . . . . . . . . . . . . . . . . . . . . . . . . . . . 269 267
18,368 16,360Less accumulated depreciation and amortization . . . . . . . . . . . . . . . . . . . . (5,936) (5,046)
Net property and equipment . . . . . . . . . . . . . . . . . . . . . . . . . . . . . . . . . 12,432 11,314
OTHER ASSETS . . . . . . . . . . . . . . . . . . . . . . . . . . . . . . . . . . . . . . . . . . . . . . . . . . 623 793
TOTAL ASSETS . . . . . . . . . . . . . . . . . . . . . . . . . . . . . . . . . . . . . . . . . . $26,761 $23,815
LIABILITIES AND EQUITY
CURRENT LIABILITIESShort-term borrowings . . . . . . . . . . . . . . . . . . . . . . . . . . . . . . . . . . . . . . . . . . $ 0 $ 26Accounts payable . . . . . . . . . . . . . . . . . . . . . . . . . . . . . . . . . . . . . . . . . . . . . . 6,544 5,947Current portion of long-term debt . . . . . . . . . . . . . . . . . . . . . . . . . . . . . . . . . 900 0Accrued salaries and benefits . . . . . . . . . . . . . . . . . . . . . . . . . . . . . . . . . . . . 1,758 1,571Accrued sales and other taxes . . . . . . . . . . . . . . . . . . . . . . . . . . . . . . . . . . . 335 322Other current liabilities . . . . . . . . . . . . . . . . . . . . . . . . . . . . . . . . . . . . . . . . . . 1,540 1,328Deferred membership fees . . . . . . . . . . . . . . . . . . . . . . . . . . . . . . . . . . . . . . 973 869
Total current liabilities . . . . . . . . . . . . . . . . . . . . . . . . . . . . . . . . . . . . . . . 12,050 10,063LONG-TERM DEBT, excluding current portion . . . . . . . . . . . . . . . . . . . . . . . 1,253 2,141DEFERRED INCOME TAXES AND OTHER LIABILITIES . . . . . . . . . . . . . . . . 885 681
Total liabilities . . . . . . . . . . . . . . . . . . . . . . . . . . . . . . . . . . . . . . . . . . . . . $14,188 $12,885
COMMITMENTS AND CONTINGENCIES
EQUITYPreferred stock $.005 par value; 100,000,000 shares authorized; no
shares issued and outstanding . . . . . . . . . . . . . . . . . . . . . . . . . . . . . . . . . 0 0Common stock $.005 par value; 900,000,000 shares authorized
434,266,000 and 433,510,000 shares issued and outstanding . . . . . . . 2 2Additional paid-in capital . . . . . . . . . . . . . . . . . . . . . . . . . . . . . . . . . . . . . . . . 4,516 4,115Accumulated other comprehensive income . . . . . . . . . . . . . . . . . . . . . . . . . 373 122Retained earnings . . . . . . . . . . . . . . . . . . . . . . . . . . . . . . . . . . . . . . . . . . . . . 7,111 6,590
Total Costco stockholders’ equity . . . . . . . . . . . . . . . . . . . . . . . . . . . . . 12,002 10,829Noncontrolling interests . . . . . . . . . . . . . . . . . . . . . . . . . . . . . . . . . . . . . . . . . 571 101
Total equity . . . . . . . . . . . . . . . . . . . . . . . . . . . . . . . . . . . . . . . . . . . . . . . 12,573 10,930
TOTAL LIABILITIES AND EQUITY . . . . . . . . . . . . . . . . . . . . . . . . . . . $26,761 $23,815
The accompanying notes are an integral part of these consolidated financial statements.
46

COSTCO WHOLESALE CORPORATION
CONSOLIDATED STATEMENTS OF INCOME
(dollars in millions, except per share data)
52 weeksended
August 28,2011
52 weeksended
August 29,2010
52 weeksended
August 30,2009
REVENUE
Net sales . . . . . . . . . . . . . . . . . . . . . . . . . . . . . . . . . . . . . . . $ 87,048 $ 76,255 $ 69,889Membership fees . . . . . . . . . . . . . . . . . . . . . . . . . . . . . . . . 1,867 1,691 1,533
Total revenue . . . . . . . . . . . . . . . . . . . . . . . . . . . . . . . . 88,915 77,946 71,422OPERATING EXPENSES
Merchandise costs . . . . . . . . . . . . . . . . . . . . . . . . . . . . . . . 77,739 67,995 62,335Selling, general and administrative . . . . . . . . . . . . . . . . . . 8,682 7,840 7,252Preopening expenses . . . . . . . . . . . . . . . . . . . . . . . . . . . . . 46 26 41Provision for impaired assets and closing costs, net . . . . 9 8 17
Operating income . . . . . . . . . . . . . . . . . . . . . . . . . . . . 2,439 2,077 1,777OTHER INCOME (EXPENSE)
Interest expense . . . . . . . . . . . . . . . . . . . . . . . . . . . . . . . . . (116) (111) (108)Interest income and other, net . . . . . . . . . . . . . . . . . . . . . . 60 88 58
INCOME BEFORE INCOME TAXES . . . . . . . . . . . . . . . . . . . . 2,383 2,054 1,727Provision for income taxes . . . . . . . . . . . . . . . . . . . . . . . . . 841 731 628
Net income including noncontrolling interests . . . . . . . . . 1,542 1,323 1,099Net income attributable to noncontrolling interests . . . . . (80) (20) (13)
NET INCOME ATTRIBUTABLE TO COSTCO . . . . . . . . . . . . $ 1,462 $ 1,303 $ 1,086
NET INCOME PER COMMON SHARE ATTRIBUTABLE TO
COSTCO:
Basic . . . . . . . . . . . . . . . . . . . . . . . . . . . . . . . . . . . . . . . . . . $ 3.35 $ 2.97 $ 2.50
Diluted . . . . . . . . . . . . . . . . . . . . . . . . . . . . . . . . . . . . . . . . . $ 3.30 $ 2.92 $ 2.47
Shares used in calculation (000’s)Basic . . . . . . . . . . . . . . . . . . . . . . . . . . . . . . . . . . . 436,119 438,611 433,988Diluted . . . . . . . . . . . . . . . . . . . . . . . . . . . . . . . . . 443,094 445,970 440,454
Dividends per share . . . . . . . . . . . . . . . . . . . . . . . . . . . . . . $ 0.89 $ 0.77 $ 0.68
The accompanying notes are an integral part of these consolidated financial statements.
47

COSTCO WHOLESALE CORPORATION
CONSOLIDATED STATEMENTS OF EQUITY
AND COMPREHENSIVE INCOME
(dollars in millions)
Common StockAdditional
Paid-inCapital
AccumulatedOther
ComprehensiveIncome
RetainedEarnings
Total CostcoStockholders’
EquityNoncontrolling
InterestsTotal
EquityShares(000’s) Amount
BALANCE AT AUGUST 31, 2008 . . . 432,513 $2 $3,543 $ 288 $5,361 $ 9,194 $ 80 $ 9,274Comprehensive Income:
Net income . . . . . . . . . . . . . . . . . . 1,086 1,086 13 1,099Unrealized gain on short-term
investments, net of ($2) tax . . . 3 3 0 3Foreign-currency translation
adjustment and other . . . . . . . . (181) (181) (4) (185)
Comprehensive income . . . . . . . . . . . . 908 9 917Stock options exercised and release
of vested restricted stock units,including tax effects . . . . . . . . . . . . . 3,794 0 75 75 75
Conversion of convertible notes . . . . . 562 0 19 19 19Repurchases of common stock . . . . . . (895) 0 (7) (50) (57) (57)Stock-based compensation . . . . . . . . . 181 181 181Cash dividends . . . . . . . . . . . . . . . . . . . (296) (296) (296)Distribution to noncontrolling
interest . . . . . . . . . . . . . . . . . . . . . . . . (9) (9)
BALANCE AT AUGUST 30, 2009 . . . 435,974 2 3,811 110 6,101 10,024 80 10,104Comprehensive Income:
Net income . . . . . . . . . . . . . . . . . . 1,303 1,303 20 1,323Unrealized gain on short-term
investments, net of ($1) tax . . . 3 3 0 3Foreign-currency translation
adjustment and other . . . . . . . . 9 9 1 10
Comprehensive income . . . . . . . . . . . . 1,315 21 1,336Stock options exercised and release
of vested restricted stock units,including tax effects . . . . . . . . . . . . . 7,461 0 205 205 205
Conversion of convertible notes . . . . . 18 0 1 1 1Repurchases of common stock . . . . . . (9,943) 0 (92) (476) (568) (568)Stock-based compensation . . . . . . . . . 190 190 190Cash dividends . . . . . . . . . . . . . . . . . . . (338) (338) (338)
BALANCE AT AUGUST 29, 2010 . . . 433,510 2 4,115 122 6,590 10,829 101 10,930Initial consolidation of noncontrolling
interest in Costco Mexico . . . . . . . . . 0 357 357Comprehensive Income:
Net income . . . . . . . . . . . . . . . . . . 1,462 1,462 80 1,542Unrealized gain on short-term
investments, net of ($1) tax . . . 1 1 0 1Foreign-currency translation
adjustment and other . . . . . . . . 250 250 24 274
Comprehensive income . . . . . . . . . . . . 1,713 104 1,817Stock options exercised and release
of vested restricted stock units,including tax effects . . . . . . . . . . . . . 9,630 0 281 281 281
Conversion of convertible notes . . . . . 65 0 2 2 2Repurchases of common stock . . . . . . (8,939) 0 (89) (552) (641) (641)Stock-based compensation . . . . . . . . . 207 207 207Cash dividends . . . . . . . . . . . . . . . . . . . (389) (389) (389)Investment by noncontrolling
interest . . . . . . . . . . . . . . . . . . . . . . . . 9 9
BALANCE AT AUGUST 28, 2011 . . . 434,266 $2 $4,516 $ 373 $7,111 $12,002 $571 $12,573
The accompanying notes are an integral part of these consolidated financial statements.
48
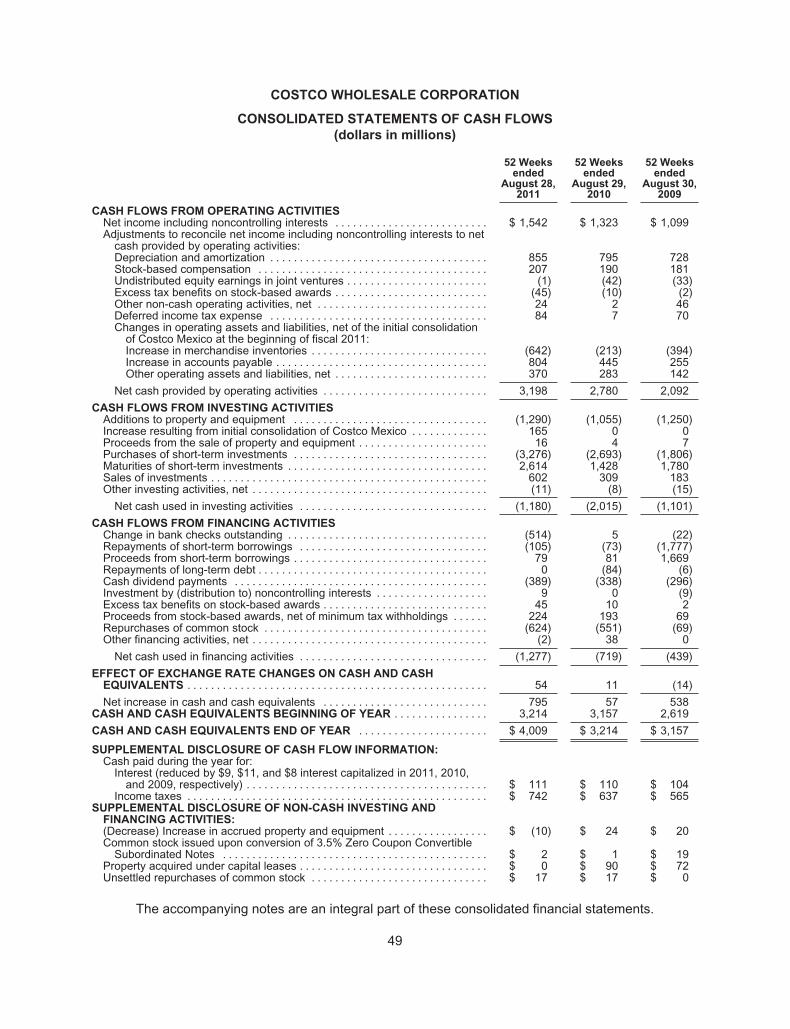
COSTCO WHOLESALE CORPORATION
CONSOLIDATED STATEMENTS OF CASH FLOWS
(dollars in millions)
52 Weeksended
August 28,2011
52 Weeksended
August 29,2010
52 Weeksended
August 30,2009
CASH FLOWS FROM OPERATING ACTIVITIESNet income including noncontrolling interests . . . . . . . . . . . . . . . . . . . . . . . . . . $ 1,542 $ 1,323 $ 1,099Adjustments to reconcile net income including noncontrolling interests to net
cash provided by operating activities:Depreciation and amortization . . . . . . . . . . . . . . . . . . . . . . . . . . . . . . . . . . . . . 855 795 728Stock-based compensation . . . . . . . . . . . . . . . . . . . . . . . . . . . . . . . . . . . . . . . 207 190 181Undistributed equity earnings in joint ventures . . . . . . . . . . . . . . . . . . . . . . . . (1) (42) (33)Excess tax benefits on stock-based awards . . . . . . . . . . . . . . . . . . . . . . . . . . (45) (10) (2)Other non-cash operating activities, net . . . . . . . . . . . . . . . . . . . . . . . . . . . . . 24 2 46Deferred income tax expense . . . . . . . . . . . . . . . . . . . . . . . . . . . . . . . . . . . . . 84 7 70Changes in operating assets and liabilities, net of the initial consolidation
of Costco Mexico at the beginning of fiscal 2011:Increase in merchandise inventories . . . . . . . . . . . . . . . . . . . . . . . . . . . . . . (642) (213) (394)Increase in accounts payable . . . . . . . . . . . . . . . . . . . . . . . . . . . . . . . . . . . . 804 445 255Other operating assets and liabilities, net . . . . . . . . . . . . . . . . . . . . . . . . . . 370 283 142
Net cash provided by operating activities . . . . . . . . . . . . . . . . . . . . . . . . . . . . 3,198 2,780 2,092
CASH FLOWS FROM INVESTING ACTIVITIESAdditions to property and equipment . . . . . . . . . . . . . . . . . . . . . . . . . . . . . . . . . (1,290) (1,055) (1,250)Increase resulting from initial consolidation of Costco Mexico . . . . . . . . . . . . . 165 0 0Proceeds from the sale of property and equipment . . . . . . . . . . . . . . . . . . . . . . 16 4 7Purchases of short-term investments . . . . . . . . . . . . . . . . . . . . . . . . . . . . . . . . . (3,276) (2,693) (1,806)Maturities of short-term investments . . . . . . . . . . . . . . . . . . . . . . . . . . . . . . . . . . 2,614 1,428 1,780Sales of investments . . . . . . . . . . . . . . . . . . . . . . . . . . . . . . . . . . . . . . . . . . . . . . . 602 309 183Other investing activities, net . . . . . . . . . . . . . . . . . . . . . . . . . . . . . . . . . . . . . . . . (11) (8) (15)
Net cash used in investing activities . . . . . . . . . . . . . . . . . . . . . . . . . . . . . . . . (1,180) (2,015) (1,101)
CASH FLOWS FROM FINANCING ACTIVITIESChange in bank checks outstanding . . . . . . . . . . . . . . . . . . . . . . . . . . . . . . . . . . (514) 5 (22)Repayments of short-term borrowings . . . . . . . . . . . . . . . . . . . . . . . . . . . . . . . . (105) (73) (1,777)Proceeds from short-term borrowings . . . . . . . . . . . . . . . . . . . . . . . . . . . . . . . . . 79 81 1,669Repayments of long-term debt . . . . . . . . . . . . . . . . . . . . . . . . . . . . . . . . . . . . . . . 0 (84) (6)Cash dividend payments . . . . . . . . . . . . . . . . . . . . . . . . . . . . . . . . . . . . . . . . . . . (389) (338) (296)Investment by (distribution to) noncontrolling interests . . . . . . . . . . . . . . . . . . . 9 0 (9)Excess tax benefits on stock-based awards . . . . . . . . . . . . . . . . . . . . . . . . . . . . 45 10 2Proceeds from stock-based awards, net of minimum tax withholdings . . . . . . 224 193 69Repurchases of common stock . . . . . . . . . . . . . . . . . . . . . . . . . . . . . . . . . . . . . . (624) (551) (69)Other financing activities, net . . . . . . . . . . . . . . . . . . . . . . . . . . . . . . . . . . . . . . . . (2) 38 0
Net cash used in financing activities . . . . . . . . . . . . . . . . . . . . . . . . . . . . . . . . (1,277) (719) (439)
EFFECT OF EXCHANGE RATE CHANGES ON CASH AND CASHEQUIVALENTS . . . . . . . . . . . . . . . . . . . . . . . . . . . . . . . . . . . . . . . . . . . . . . . . . . . 54 11 (14)
Net increase in cash and cash equivalents . . . . . . . . . . . . . . . . . . . . . . . . . . . . 795 57 538CASH AND CASH EQUIVALENTS BEGINNING OF YEAR . . . . . . . . . . . . . . . . 3,214 3,157 2,619
CASH AND CASH EQUIVALENTS END OF YEAR . . . . . . . . . . . . . . . . . . . . . . $ 4,009 $ 3,214 $ 3,157
SUPPLEMENTAL DISCLOSURE OF CASH FLOW INFORMATION:Cash paid during the year for:
Interest (reduced by $9, $11, and $8 interest capitalized in 2011, 2010,and 2009, respectively) . . . . . . . . . . . . . . . . . . . . . . . . . . . . . . . . . . . . . . . . . $ 111 $ 110 $ 104
Income taxes . . . . . . . . . . . . . . . . . . . . . . . . . . . . . . . . . . . . . . . . . . . . . . . . . . . $ 742 $ 637 $ 565SUPPLEMENTAL DISCLOSURE OF NON-CASH INVESTING AND
FINANCING ACTIVITIES:(Decrease) Increase in accrued property and equipment . . . . . . . . . . . . . . . . . $ (10) $ 24 $ 20Common stock issued upon conversion of 3.5% Zero Coupon Convertible
Subordinated Notes . . . . . . . . . . . . . . . . . . . . . . . . . . . . . . . . . . . . . . . . . . . . . $ 2 $ 1 $ 19Property acquired under capital leases . . . . . . . . . . . . . . . . . . . . . . . . . . . . . . . . $ 0 $ 90 $ 72Unsettled repurchases of common stock . . . . . . . . . . . . . . . . . . . . . . . . . . . . . . $ 17 $ 17 $ 0
The accompanying notes are an integral part of these consolidated financial statements.
49

COSTCO WHOLESALE CORPORATION
NOTES TO CONSOLIDATED FINANCIAL STATEMENTS
(dollars in millions, except share data)
Note 1—Summary of Significant Accounting Policies
Basis of Presentation
The consolidated financial statements include the accounts of Costco Wholesale Corporation, aWashington corporation, its wholly-owned subsidiaries, subsidiaries in which it has a controllinginterest, consolidated entities in which it has made equity investments or has other interests throughwhich it has majority-voting control or it exercises the right to direct the activities that most significantlyimpact the entity’s performance (Costco or the Company). The Company reports noncontrollinginterests in consolidated entities as a component of equity separate from the Company’s equity. Allmaterial inter-company transactions between and among the Company and its consolidatedsubsidiaries and other consolidated entities have been eliminated in consolidation.
In June 2009, the Financial Accounting Standards Board (FASB) issued amended guidanceconcerning whether a company’s variable interest(s) in an entity constitute a controlling financialinterest. The Company adopted this guidance on August 30, 2010 (at the beginning of its fiscal year2011). As a result of the adoption, the Company determined that its 50%-owned joint venture, CostcoMexico (Mexico), would be consolidated on a prospective basis beginning August 30, 2010. Costcooperates 32 warehouses in Mexico similar to Costco warehouses operated elsewhere.
Historically, the Company accounted for its 50% interest in Mexico under the equity method ofaccounting. The Company’s equity method investment in Mexico included in other assets in theaccompanying consolidated balance sheet as of August 29, 2010 totaled $357, which wasderecognized as part of the initial consolidation of the joint venture on August 30, 2010. Total assetsand liabilities increased by approximately 3% due to the initial consolidation and the 50%noncontrolling interest in Mexico of $357 was recorded as a component of equity as a result of theinitial consolidation. The initial consolidation of Mexico had no impact on net income or net income percommon share attributable to Costco (Net Income). The Company’s net income excludes incomeattributable to noncontrolling interests in its operations in Mexico, Korea, and Taiwan. In December2010, the Company and its 50% joint venture partner amended the Mexico joint venture agreements.As a result, the Company obtained, subject to certain continuing conditions, majority-voting control ofthe joint venture. As the Company had previously consolidated the joint venture, these amendmentsdid not impact the Company’s consolidated financial statements.
The Company operates membership warehouses that offer low prices on a limited selection ofnationally branded and select private-label products in a wide range of merchandise categories inno-frills, self-service facilities. At August 28, 2011, Costco operated 592 warehouses worldwide whichincluded: 429 U.S. locations (in 40 U.S. states and Puerto Rico), 82 Canadian locations (in nineCanadian provinces), 32 Mexico locations, 22 United Kingdom locations, nine Japan locations, eightTaiwan locations, seven Korea locations, and three Australia locations.
Fiscal Year End
The Company’s fiscal year ends on the Sunday closest to August 31. References to 2011, 2010, and2009 relate to the 52-week fiscal years ended August 28, 2011, August 29, 2010, and August 30,2009, respectively.
50

Use of Estimates
The preparation of financial statements in conformity with U.S. generally accepted accountingprinciples (GAAP) requires management to make estimates and assumptions that affect the reportedamounts of assets and liabilities and the disclosure of contingent assets and liabilities at the date of thefinancial statements and the reported amounts of revenues and expenses during the reporting period.Actual results could differ from those estimates and assumptions.
Reclassifications
Certain reclassifications have been made to prior fiscal year amounts or balances to conform to thepresentation in the current fiscal year. These reclassifications did not have a material impact on theCompany’s previously reported consolidated financial statements.
Cash and Cash Equivalents
The Company considers as cash and cash equivalents all highly liquid investments with a maturity ofthree months or less at the date of purchase and proceeds due from credit and debit card transactionswith settlement terms of less than one week. Credit and debit card receivables were $982 and $862 atthe end of 2011 and 2010, respectively.
Short-term Investments
In general, short-term investments have a maturity of three months to five years at the date ofpurchase. Investments with maturities beyond five years may be classified, based on the Company’sdetermination, as short-term based on their highly liquid nature and because such marketablesecurities represent the investment of cash that is available for current operations. Short-terminvestments classified as available-for-sale are recorded at fair value using the specific identificationmethod with the unrealized gains and losses reflected in accumulated other comprehensive incomeuntil realized. Realized gains and losses from the sale of available-for-sale securities, if any, aredetermined on a specific identification basis and all are recorded in interest income and other, net inthe consolidated statements of income. Short-term investments classified as held-to-maturity arefinancial instruments that the Company has the intent and ability to hold to maturity and are reportednet of any related amortization and are not remeasured to fair value on a recurring basis.
Fair Value of Financial Instruments
The carrying value of the Company’s financial instruments, including cash and cash equivalents,receivables, and accounts payable approximate fair value due to their short-term nature or variableinterest rates. See Notes 2, 3, and 4 for the carrying value and fair value of the Company’sinvestments, derivative instruments, and fixed rate debt.
The Company follows the authoritative guidance for fair value measurements relating to financial andnonfinancial assets and liabilities, including the presentation of required disclosures, in its consolidatedfinancial statements. This guidance defines fair value as the price that would be received to sell anasset or paid to transfer a liability (an exit price) in an orderly transaction between market participantsat the measurement date. The guidance also establishes a fair value hierarchy, which requiresmaximizing the use of observable inputs when measuring fair value. The three levels of inputs that maybe used are:
Level 1: Quoted market prices in active markets for identical assets or liabilities.
Level 2: Observable market based inputs or unobservable inputs that are corroborated bymarket data.
Level 3: Significant unobservable inputs that are not corroborated by market data.
51

The following valuation techniques are used to measure fair value:
Level 1 primarily consists of financial instruments, such as money market mutual funds, whose value isbased on quoted market prices, such as quoted net asset values published by the fund as supported inan active market, exchange-traded instruments and listed equities.
Level 2 includes assets and liabilities where quoted market prices are unobservable but observableinputs other than Level 1 prices, such as quoted prices for similar assets or liabilities, or other inputsthat are observable or can be corroborated by observable market data for substantially the full term ofthe assets or liabilities, or could be obtained from data providers or pricing vendors. The Company’sLevel 2 assets and liabilities primarily include United States (U.S.) government and agency securities,Federal Deposit Insurance Corporation (FDIC) insured corporate bonds, investments in corporatenotes and bonds, asset and mortgage-backed securities, and forward foreign exchange contracts.Valuation methodologies are based on “consensus pricing,” using market prices from a variety ofindustry-standard independent data providers or pricing that considers various assumptions, includingtime value, yield curve, volatility factors, credit spreads, default rates, loss severity, current market andcontractual prices for the underlying instruments or debt, broker and dealer quotes, as well as otherrelevant economic measures. All are observable in the market or can be derived principally from orcorroborated by observable market data, for which the Company typically receives independentexternal valuation information.
Level 3 is comprised of significant unobservable inputs for valuations from the Company’s independentdata and a primary pricing vendor that are also supported by little, infrequent, or no market activity.Management considers indicators of significant unobservable inputs such as the lengthening ofmaturities, later-than-scheduled payments, and any remaining individual securities that have otherwisematured, as indicators of Level 3. Assets and liabilities are considered Level 3 when their fair valueinputs are unobservable, unavailable or management concludes that even though there may be someobservable inputs, an item should be classified as a Level 3 based on other indicators of significantunobservable inputs, such as situations involving limited market activity, where determination of fairvalue requires significant judgment or estimation. The Company utilizes the services of a primarypricing vendor, which does not provide access to its proprietary valuation models, inputs andassumptions. While the Company is not provided access to proprietary models of the vendor, theCompany reviewed and contrasted pricing received with other pricing sources to ensure accuracy ofeach asset class for which prices are provided. The Company’s review also included an examination ofthe underlying inputs and assumptions for a sample of individual securities across asset classes, creditrating levels and various durations, a process that is continually performed for each reporting period. Inaddition, the pricing vendor has an established challenge process in place for all security valuations,which facilitates identification and resolution of potentially erroneous prices. The Company believesthat the prices received from the primary pricing vendor are representative of exit prices in accordancewith authoritative guidance, and are classified appropriately in the fair value hierarchy.
Our current financial liabilities have fair values that approximate their carrying values. Our long-termfinancial liabilities consist of long-term debt, which is recorded on the balance sheet at issuance priceless unamortized discount.
52

Receivables, net
Receivables consist of the following at the end of 2011 and 2010:
2011 2010
Vendor receivables, and other . . . . . . . . . . . . . . . . . . . . . . . . . . . . . . . . . . $487 $448Reinsurance receivables . . . . . . . . . . . . . . . . . . . . . . . . . . . . . . . . . . . . . . . 201 196Receivables from governmental entities . . . . . . . . . . . . . . . . . . . . . . . . . . . 98 64Other receivables . . . . . . . . . . . . . . . . . . . . . . . . . . . . . . . . . . . . . . . . . . . . . 96 103Third-party pharmacy receivables . . . . . . . . . . . . . . . . . . . . . . . . . . . . . . . . 86 75Allowance for doubtful accounts . . . . . . . . . . . . . . . . . . . . . . . . . . . . . . . . . (3) (2)
Receivables, Net . . . . . . . . . . . . . . . . . . . . . . . . . . . . . . . . . . . . . . . . . . $965 $884
Vendor receivables include payments from vendors in the form of volume rebates or other purchasediscounts that are evidenced by signed agreements and are reflected in the carrying value of theinventory when earned or as the Company progresses towards earning the rebate or discount and as acomponent of merchandise costs as the merchandise is sold. Vendor receivable balances aregenerally presented on a gross basis separate from any related payable due. In certain circumstances,these receivables may be settled against the related payable to that vendor. Other considerationreceived from vendors is generally recorded as a reduction of merchandise costs upon completion ofcontractual milestones, terms of the related agreement, or by other systematic approach.
Reinsurance receivables are held by the Company’s wholly-owned captive insurance subsidiary. Thereceivable balance represents amounts ceded through reinsurance arrangements, and are reflected ona gross basis, separate from the amounts assumed under reinsurance, which are presented on a grossbasis within other current liabilities on the consolidated balance sheets.
Receivables from governmental entities largely consists of various tax related items.
Third-party pharmacy receivables generally relate to amounts due from members’ insurancecompanies for the amount above their co-pay, which is collected at the point-of-sale.
Amounts are recorded net of an allowance for doubtful accounts. Management determines theallowance for doubtful accounts based on historical experience and application of the specificidentification method. Write-offs of receivables were immaterial for fiscal years 2011, 2010, or 2009.
Merchandise Inventories
Merchandise inventories consist of the following at the end of 2011 and 2010:
2011 2010
United States (primarily LIFO) . . . . . . . . . . . . . . . . . . . . . . . . . $4,548 $4,150Foreign (FIFO) . . . . . . . . . . . . . . . . . . . . . . . . . . . . . . . . . . . . . 2,090 1,488
Merchandise Inventories . . . . . . . . . . . . . . . . . . . . . . . . . $6,638 $5,638
Merchandise inventories are valued at the lower of cost or market, as determined primarily by the retailinventory method, and are stated using the last-in, first-out (LIFO) method for substantially all U.S.merchandise inventories. Merchandise inventories for all foreign operations are primarily valued by theretail inventory method and are stated using the first-in, first-out (FIFO) method. The Companybelieves the LIFO method more fairly presents the results of operations by more closely matchingcurrent costs with current revenues. The Company records an adjustment each quarter, if necessary,for the estimated effect of inflation or deflation, and these estimates are adjusted to actual resultsdetermined at year-end.
53

Due to inflation in 2011, the merchandise inventories valued at LIFO were lower than the FIFO value,resulting in a charge to merchandise costs of $87. During 2009, due to overall net deflationary trends,the Company recorded a $32 benefit to merchandise costs to adjust inventories valued at LIFO. At theend of 2010, merchandise inventories valued at LIFO approximated FIFO after considering the lower ofcost or market principle.
The Company provides for estimated inventory losses between physical inventory counts as apercentage of net sales, using estimates based on the Company’s experience. The provision isadjusted periodically to reflect the results of the actual physical inventory counts, which generally occurin the second and fourth fiscal quarters of the fiscal year. Inventory cost, where appropriate, is reducedby estimates of vendor rebates when earned or as the Company progresses towards earning thoserebates, provided that they are probable and reasonably estimable.
Property and Equipment
Property and equipment are stated at cost. In general, new building additions are separated intocomponents, each with its own estimated useful life. Depreciation and amortization expense iscomputed using the straight-line method over estimated useful lives or the lease term, if shorter.Leasehold improvements incurred after the beginning of the initial lease term are depreciated over theshorter of the estimated useful life of the asset or the remaining term of the initial lease plus anyrenewals that are reasonably assured at the date the leasehold improvement is made.
Estimated useful lives for financial reporting purposes are as follows:
Years
Buildings and improvements . . . . . . . . . . . . . . . . . . . . . . . . . . . . . . . . . . . . . . . 5 - 50Equipment and fixtures . . . . . . . . . . . . . . . . . . . . . . . . . . . . . . . . . . . . . . . . . . . 3 - 20
Repair and maintenance costs are expensed when incurred. Expenditures for remodels,refurbishments and improvements that add to or change the way an asset functions or that extend theuseful life of an asset are capitalized. Assets that were removed during the remodel, refurbishment orimprovement are retired. When assets are retired or sold, the asset costs and related accumulateddepreciation are eliminated, with any remaining gain or loss recorded.
Impairment of Long-Lived Assets
The Company periodically evaluates long-lived assets for impairment when relocating or closing awarehouse or when events or changes in circumstances occur that may indicate the carrying amountof the asset group, generally an individual warehouse, may not be fully recoverable. For asset groupsto be held and used, including warehouses to be relocated, the carrying value of the asset group isconsidered recoverable when the estimated future undiscounted cash flows generated from the useand eventual disposition of the asset group exceed the group’s net carrying value. In the event that thecarrying value is not considered recoverable, an impairment loss would be recognized for the assetgroup to be held and used equal to the excess of the carrying value above the estimated fair value ofthe asset group. For asset groups classified as held for sale (disposal group), the carrying value iscompared to the disposal group’s fair value less costs to sell. The Company estimates fair value byobtaining market appraisals from third party brokers or other valuation techniques. In 2011, 2010, and2009, the Company recorded impairment charges of $1, $2, and $11, respectively, included inprovision for impaired assets and closing costs, net and interest income and other in the consolidatedstatements of income. In 2009, the charge was primarily related to the closure of its two Costco Homelocations in July 2009.
Assets classified as held for sale were not material as of August 28, 2011 or August 29, 2010.
54

Other Assets
Other assets consist of the following at the end of 2011 and 2010:
2011 2010
Prepaid rents, lease costs, and long-term deposits . . . . . . . . . . . . . . . . . . $211 $186Tax-related assets . . . . . . . . . . . . . . . . . . . . . . . . . . . . . . . . . . . . . . . . . . . . . 179 18Goodwill, net . . . . . . . . . . . . . . . . . . . . . . . . . . . . . . . . . . . . . . . . . . . . . . . . . 74 71Cash surrender value of life insurance . . . . . . . . . . . . . . . . . . . . . . . . . . . . 64 65Other . . . . . . . . . . . . . . . . . . . . . . . . . . . . . . . . . . . . . . . . . . . . . . . . . . . . . . . 95 96Investment in Mexico . . . . . . . . . . . . . . . . . . . . . . . . . . . . . . . . . . . . . . . . . . 0 357
Other Assets . . . . . . . . . . . . . . . . . . . . . . . . . . . . . . . . . . . . . . . . . . . . . $623 $793
As previously discussed, the Company began consolidating Mexico at the beginning of 2011, on aprospective basis. The amount of retained earnings that represented undistributed earnings of Mexicowas $307 at the end of 2010. The Company did not make any capital contributions to its investment inMexico in 2010 or 2009. The investments and equity in earnings of other unconsolidated joint venturesare not material.
Tax-related assets represent amounts deposited with taxing authorities in connection with ongoingincome tax audits and the Company’s long term deferred tax assets.
Goodwill resulting from certain business combinations is reviewed for impairment in the fourth quarterof each fiscal year, or more frequently if circumstances dictate. No impairment of goodwill has beenincurred to date.
The Company adjusts the carrying value of its employee life insurance contracts to the net cashsurrender value at the end of each reporting period.
Accounts Payable
The Company’s banking system provides for the daily replenishment of major bank accounts aschecks are presented. Accordingly, included in accounts payable at the end of 2011 and 2010 are$108 and $617, respectively, representing the excess of outstanding checks over cash on deposit atthe banks on which the checks were drawn.
Insurance/Self-Insurance Liabilities
The Company uses a combination of insurance and self-insurance mechanisms, including a wholly-owned captive insurance entity and participation in a reinsurance program, to provide for potentialliabilities for workers’ compensation, general liability, property damage, directors and officers liability,vehicle liability, and employee health care benefits. The reinsurance agreement is one year in durationand new agreements are entered into by each participant at their discretion at the commencement ofthe next fiscal year. Liabilities associated with the risks that are retained by the Company are notdiscounted and are estimated, in part, by considering historical claims experience, demographicfactors, severity factors, and other actuarial assumptions. The estimated accruals for these liabilitiescould be significantly affected if future occurrences and claims differ from these assumptions andhistorical trends. As of the end of 2011 and 2010, these insurance liabilities were $595 and $541 in theaggregate, respectively, and were included in accounts payable, accrued salaries and benefits, andother current liabilities on the consolidated balance sheets, classified based on their nature.
55

The Company’s wholly-owned captive insurance subsidiary (the captive) receives direct premiums,which are netted against the Company’s premium costs in selling, general and administrativeexpenses, in the consolidated statements of income. The captive participates in a reinsurance programthat includes other third-party members. The member agreements and practices of the reinsuranceprogram limit any participating members’ individual risk. Income statement adjustments related to thereinsurance program and related impacts to the consolidated balance sheets are recognized asinformation becomes known. In the event the Company leaves the reinsurance program, the Companyis not relieved of its primary obligation to the policyholders for activity prior to the termination of theannual agreement.
Other Current Liabilities
Other current liabilities consist of the following at the end of 2011 and 2010:
2011 2010
Accrued member rewards . . . . . . . . . . . . . . . . . . . . . . . . . . . . . . . . . . . $ 602 $ 522Insurance-related liabilities . . . . . . . . . . . . . . . . . . . . . . . . . . . . . . . . . . . 276 263Tax-related liabilities . . . . . . . . . . . . . . . . . . . . . . . . . . . . . . . . . . . . . . . . 122 79Cash card liability . . . . . . . . . . . . . . . . . . . . . . . . . . . . . . . . . . . . . . . . . . 112 100Deferred sales . . . . . . . . . . . . . . . . . . . . . . . . . . . . . . . . . . . . . . . . . . . . . 141 98Other current liabilities . . . . . . . . . . . . . . . . . . . . . . . . . . . . . . . . . . . . . . 96 86Vendor consideration liabilities . . . . . . . . . . . . . . . . . . . . . . . . . . . . . . . . 66 57Sales return reserve . . . . . . . . . . . . . . . . . . . . . . . . . . . . . . . . . . . . . . . . 74 72Interest payable . . . . . . . . . . . . . . . . . . . . . . . . . . . . . . . . . . . . . . . . . . . . 51 51
Other Current Liabilities . . . . . . . . . . . . . . . . . . . . . . . . . . . . . . . . . $1,540 $1,328
Derivatives
The Company is exposed to foreign-currency exchange-rate fluctuations in the normal course ofbusiness. The Company manages these fluctuations, in part, through the use of forward foreign-exchange contracts, seeking to economically hedge the impact of fluctuations of foreign exchange onknown future expenditures denominated in a foreign-currency. The contracts are intended primarily toeconomically hedge exposure to U.S. dollar merchandise inventory expenditures made by theCompany’s international subsidiaries or other entities whose functional currency is other than the U.S.dollar. Currently, these contracts do not qualify for derivative hedge accounting. The Company seeksto mitigate risk with the use of these contracts and does not intend to engage in speculativetransactions. These contracts do not contain any credit-risk-related contingent features. The aggregatenotional amounts of forward foreign-exchange contracts were $247 and $225 at the end of 2011 and2010, respectively.
The Company seeks to manage counterparty risk associated with these contracts by limitingtransactions to counterparties with which the Company has an established banking relationship. Therecan be no assurance, however, that this practice effectively mitigates counterparty risk. The contractsare limited to less than one year in duration. See Note 3 for information on the fair value of open,unsettled forward foreign-exchange contracts as of August 28, 2011, and August 29, 2010.
The amount of net foreign-currency transaction gains or losses recognized in interest income andother, net in the accompanying consolidated statements of income relating to forward foreign-exchange contracts were nominal in 2011, 2010 and 2009. These gains and losses are largely offsetby the impact of revaluing related foreign currency denominated payables, which are also recognizedin interest income and other, net.
56

The Company is exposed to risks due to fluctuations in prices for the energy it consumes, particularlyelectricity and natural gas, which it seeks to partially mitigate through the use of fixed-price contractsfor approximately 36% of its warehouses and other facilities, primarily in the U.S. and Canada. TheCompany also enters into variable-priced contracts for some purchases of natural gas, in addition tofuel for its gas stations, on an index basis. These contracts meet the characteristics of derivativeinstruments, but generally qualify for the “normal purchases or normal sales” exception underauthoritative guidance and thus require no mark-to-market adjustment.
Foreign-Currency
The functional currencies of the Company’s international subsidiaries are the local currency of thecountry in which the subsidiary is located. Assets and liabilities recorded in foreign currencies aretranslated at the exchange rate on the balance sheet date. Translation adjustments resulting from thisprocess are recorded in accumulated other comprehensive income. Revenues and expenses of theCompany’s consolidated foreign operations are translated at average rates of exchange prevailingduring the year.
The Company recognizes foreign-currency transaction gains and losses related to revaluing allmonetary assets and liabilities denominated in currencies other than the functional currency, generallythe U.S. dollar payables of consolidated subsidiaries to their functional currency, in interest income andother, net in the accompanying consolidated statements of income. These gains and losses were $8and $13 in 2011 and 2010, respectively and not significant in 2009.
Revenue Recognition
The Company generally recognizes sales, net of estimated returns, at the time the member takespossession of merchandise or receives services. When the Company collects payments fromcustomers prior to the transfer of ownership of merchandise or the performance of services, theamounts received are generally recorded as deferred sales included in other current liabilities on theconsolidated balance sheets until the sale or service is completed. The Company reserves forestimated sales returns based on historical trends in merchandise returns, net of the estimated netrealizable value of merchandise inventories to be returned and any estimated disposition costs.Amounts collected from members, which under common trade practices are referred to as sales taxes,are recorded on a net basis.
The Company evaluates whether it is appropriate to record the gross amount of merchandise salesand related costs or the net amount earned as commissions. Generally, when Costco is the primaryobligor, is subject to inventory risk, has latitude in establishing prices and selecting suppliers, caninfluence product or service specifications, or has several but not all of these indicators, revenue isrecorded on a gross basis. If the Company is not the primary obligor and does not possess otherindicators of gross reporting as noted above, it records the net amounts as commissions earned, whichis reflected in net sales.
Membership fee revenue represents annual membership fees paid by substantially all of theCompany’s members. The Company accounts for membership fee revenue, net of estimated refunds,on a deferred basis, whereby revenue is recognized ratably over the one-year membership period. Aspreviously disclosed, effective with renewals occurring on and after March 1, 2009, the Companychanged an element of its membership renewal policy. Memberships renewed within two months afterexpiration of the current membership year are extended for twelve months from the expiration date.(Under the previous policy, renewals within six months of the expiration date were extended for twelvemonths from the expiration date.) Memberships renewed more than two months after such expirationdate are extended for twelve months from the renewal date. This change has had an immaterial effectof deferring recognition of certain membership fees paid by late-renewing members.
57
The Company’s Executive Members qualify for a 2% reward (up to a maximum of approximately fivehundred dollars per year on qualified purchases made at Costco), which can be redeemed at Costcowarehouses. The Company accounts for this reward as a reduction in sales, with the related accruedmember rewards liability included in other current liabilities on the consolidated balance sheets. Thesales reduction and corresponding liability are computed after giving effect to the estimated impact ofnon-redemptions based on historical data. The net reduction in sales was $790, $688, and $610 in2011, 2010, and 2009, respectively.
Merchandise Costs
Merchandise costs consist of the purchase price of inventory sold, inbound shipping charges and allcosts related to the Company’s depot operations, including freight from depots to selling warehouses,and are reduced by vendor consideration. Merchandise costs also include salaries, benefits anddepreciation on production equipment in certain fresh foods and ancillary departments.
Selling, General and Administrative Expenses
Selling, general and administrative expenses consist primarily of salaries, benefits and workers’compensation costs for warehouse employees, other than fresh foods departments and certainancillary businesses, as well as all regional and home office employees, including buying personnel.Selling, general and administrative expenses also include utilities, bank charges, rent and substantiallyall building and equipment depreciation, as well as other operating costs incurred to supportwarehouse operations.
Marketing and Promotional Expenses
Costco’s policy is generally to limit marketing and promotional expenses to new warehouse openings,occasional direct mail marketing to prospective new members and direct mail marketing programs toexisting members promoting selected merchandise. Marketing and promotional costs are expensed asincurred and are included in selling, general and administrative expenses in the accompanyingconsolidated statements of income.
Stock-Based Compensation
Compensation expense for all stock-based awards granted is recognized using the straight-linemethod. The fair value of restricted stock units (RSUs) is calculated as the market value of thecommon stock on the measurement date less the present value of the expected dividends forgoneduring the vesting period. The fair value of stock options is measured using the Black-Scholesvaluation model. While options and RSUs granted to employees generally vest over five years, allgrants allow for either daily or quarterly vesting of the pro-rata number of stock-based awards thatwould vest on the next anniversary of the grant date in the event of retirement or voluntary termination.The historical experience rate of actual forfeitures has been minimal. As such, the Company does notreduce stock-based compensation for an estimate of forfeitures because the estimate isinconsequential in light of historical experience and considering the awards vest on either a daily orquarterly basis. The impact of actual forfeitures arising in the event of involuntary termination isrecognized as actual forfeitures occur, which generally has been infrequent. Stock options have aten-year term. Stock-based compensation expense is predominately included in selling, general andadministrative expenses on the consolidated statements of income. See Note 7 for additionalinformation on the Company’s stock-based compensation plans.
58

Leases
The Company leases land and/or buildings at warehouses and certain other office and distributionfacilities primarily under operating leases. Operating leases expire at various dates through 2051, withthe exception of one lease in the Company’s United Kingdom subsidiary, which expires in 2151. Theseleases generally contain one or more of the following options which the Company can exercise at theend of the initial lease term: (a) renewal of the lease for a defined number of years at the then-fairmarket rental rate or rate stipulated in the lease agreement; (b) purchase of the property at the then-fair market value; or (c) right of first refusal in the event of a third party purchase offer.
The Company accounts for its lease expense with free rent periods and step-rent provisions on astraight-line basis over the original term of the lease, from the date the Company has control of theproperty. Certain leases provide for periodic rental increases based on the price indices, and some ofthe leases provide for rents based on the greater of minimum guaranteed amounts or sales volume.
The Company has entered into four capital leases for warehouse locations, expiring at various datesthrough 2040. Capital lease assets are included in buildings and improvements in the accompanyingconsolidated balance sheets. Amortization expense on capital lease assets is recorded as depreciationexpense and is predominately included in selling, general and administrative expenses. Capital leaseliabilities are recorded at the lesser of the estimated fair market value of the leased property or the netpresent value of the aggregate future minimum lease payments and are included in other currentliabilities and other liabilities. Interest on these obligations is included in interest expense.
Preopening Expenses
Preopening expenses related to new warehouses, new regional offices and other startup operationsare expensed as incurred.
Provision for Impaired Assets and Closing Costs, Net
Warehouse closing costs incurred relate principally to expenses associated with the Company’srelocation of certain warehouses (that were not otherwise impaired) to larger and better-locatedfacilities. The provisions for 2011, 2010, and 2009 included charges in the amounts indicated below:
2011 2010 2009
Warehouse closing expenses . . . . . . . . . . . . . . . . . . . . . . . . . . $8 $6 $ 9Impairment of long-lived assets . . . . . . . . . . . . . . . . . . . . . . . . 1 2 8
Provision for Impaired Assets and Closing Costs, Net . . $9 $8 $17
Warehouse closing expenses primarily relate to accelerated building depreciation based on theshortened useful life through the expected closing date and remaining lease obligations, net ofestimated sublease income, for leased locations. At the end of 2011 and 2010, the Company’s reservefor warehouse closing costs was $5 and primarily related to estimated future lease obligations andother estimated contractual obligations associated with exiting the properties.
Interest Income and Other, Net
Interest income and other, net includes:
2011 2010 2009
Interest income, net . . . . . . . . . . . . . . . . . . . . . . . . . . . . . . . . . . $41 $23 $27Earnings of affiliates and other, net . . . . . . . . . . . . . . . . . . . . . 19 65 31
Interest Income and Other, Net . . . . . . . . . . . . . . . . . . . . . $60 $88 $58
59

As previously discussed, Costco began consolidating Mexico at the beginning of 2011, on aprospective basis. For 2010 and 2009, the equity in earnings of Mexico is included in interest incomeand other, net in the accompanying consolidated statements of income, and was $41 and $32,respectively.
The Company periodically evaluates unrealized losses in its investment securities for other-than-temporary impairment using both qualitative and quantitative criteria. In the event a security is deemedto be other-than-temporarily impaired, the Company recognizes the credit loss component in interestincome and other, net in the consolidated statements of income. The Company generally only investsin debt securities.
Income Taxes
The Company accounts for income taxes using the asset and liability method. Under the asset andliability method, deferred tax assets and liabilities are recognized for the future tax consequencesattributed to differences between the financial statement carrying amounts of existing assets andliabilities and their respective tax bases and tax credits and loss carry-forwards. Deferred tax assetsand liabilities are measured using enacted tax rates expected to apply to taxable income in the years inwhich those temporary differences and carry-forwards are expected to be recovered or settled. Theeffect on deferred tax assets and liabilities of a change in tax rates is recognized in income in theperiod that includes the enactment date. A valuation allowance is established when necessary toreduce deferred tax assets to amounts expected to be realized.
The determination of the Company’s provision for income taxes requires significant judgment, the useof estimates, and the interpretation and application of complex tax laws. Significant judgment isrequired in assessing the timing and amounts of deductible and taxable items and the probability ofsustaining uncertain tax positions. The benefits of uncertain tax positions are recorded in theCompany’s consolidated financial statements only after determining a more-likely-than-not probabilitythat the uncertain tax positions will withstand challenge, if any, from tax authorities. When facts andcircumstances change, the Company reassesses these probabilities and records any changes in theconsolidated financial statements as appropriate. See Note 9 for additional information.
Net Income Attributable to Costco per Common Share
The computation of basic net income per share uses the weighted average number of shares that wereoutstanding during the period. The computation of diluted net income per share uses the weightedaverage number of shares in the basic net income per share calculation plus the number of commonshares that would be issued assuming exercise and vesting of all potentially dilutive common sharesoutstanding using the treasury stock method for shares subject to stock options and restricted stockunits and the “if converted” method for the convertible note securities.
Stock Repurchase Programs
Repurchased shares of common stock are retired, in accordance with the Washington BusinessCorporation Act. The par value of repurchased shares is deducted from common stock and the excessrepurchase price over par value is deducted from additional paid-in capital and retained earnings. SeeNote 6 for additional information.
Recently Adopted Accounting Pronouncements
As discussed above in Note 1, the Company adopted guidance related to consolidation of variableinterest entities.
60
In October 2009, the FASB issued amended guidance on revenue recognition for multiple-deliverablerevenue arrangements. Under this guidance, when vendor-specific objective evidence or third-partyevidence for deliverables in an arrangement cannot be determined, a best estimate of the selling priceis required to separate deliverables and allocate arrangement consideration using the relative selling-price method. This guidance also prescribes disclosure requirements on how the application of therelative selling price method affects the timing and amount of revenue recognition. The Companyadopted this guidance at the beginning of its fiscal year 2011. The adoption of this standard did nothave a material impact on the Company’s consolidated financial statements.
In January 2010, the FASB issued guidance to amend the disclosure requirements related to recurringand nonrecurring fair value measurements. The guidance requires disclosure of transfers of assets andliabilities between Level 1 and Level 2 of the fair value measurement hierarchy, including the reasonsand the timing of the transfers. Under Level 3 of the fair value measurement hierarchy, the guidancerequires disclosure of information on purchases, sales, issuances, and settlements on a gross basis(as opposed to a net basis) in the reconciliation of the assets and liabilities measured. The Companyadopted this guidance at the beginning of its third quarter of fiscal 2010, except for the Level 3reconciliation disclosures on the roll-forward activities, which were adopted at the beginning of its thirdquarter of fiscal 2011. The adoption of this standard did not have a material impact on the Company’sconsolidated financial statement disclosures.
Recent Accounting Pronouncements Not Yet Adopted
In May 2011, the FASB issued guidance to amend the requirements related to fair value measurementwhich changes the wording used to describe many requirements in GAAP for measuring fair value andfor disclosing information about fair value measurements. Additionally, the amendments clarify theFASB’s intent about the application of existing fair value measurement requirements. The amendedguidance is effective for interim and annual periods beginning after December 15, 2011, and is appliedprospectively. The Company plans to adopt this guidance at the beginning of its third quarter of fiscalyear 2012. Adoption of this guidance is not expected to have a material impact on the Company’sconsolidated financial statement disclosure.
In June 2011, the FASB issued guidance on presentation of comprehensive income. The newguidance eliminates the current option to report other comprehensive income and its components inthe statement of changes in equity. Instead, an entity will be required to present either a continuousstatement of net income and other comprehensive income or to present the information in two separatebut consecutive statements. The new guidance must be applied retrospectively and is effective forinterim and annual periods beginning after December 15, 2011. The Company plans to adopt thisguidance at the beginning of its third quarter of fiscal 2012. Adoption of this guidance is not expected tohave a material impact on the Company’s consolidated financial statements and will impact thefinancial statements’ presentation only.
In September 2011, the FASB issued guidance to amend and simplify the rules related to testinggoodwill for impairment. The revised guidance allows an entity to make an initial qualitative evaluation,based on the entity’s events and circumstances, to determine whether it is more likely than not that thefair value of a reporting unit is less than its carrying amount. The results of this qualitative assessmentdetermine whether it is necessary to perform the currently required two-step impairment test. The newguidance is effective for annual and interim goodwill impairment tests performed for fiscal yearsbeginning after December 15, 2011. Early adoption is permitted. The Company plans to early adoptthis guidance for its fiscal year 2012 annual impairment test. Adoption of this guidance is not expectedto have a material impact on the Company’s consolidated financial statements.
61

Note 2—Investments
The major categories of the Company’s investments are as follows:
Money market mutual funds
The Company invests in money funds that seek to maintain a net asset value of par, while limitingoverall exposure to credit, market, and liquidity risks.
U.S. government and agency securities
These U.S. government-secured debt instruments are publically traded and valued. Losses in thiscategory are primarily due to market liquidity and interest rate reductions.
Corporate notes and bonds
The Company evaluates its corporate debt securities based on a variety of factors including, but notlimited to, the credit rating of the issuer. The vast majority of the Company’s corporate debt securitiesare rated investment grade by the major rating agencies.
FDIC-insured corporate bonds
These bonds are guaranteed by the full faith and credit of the U.S. government under the FDIC’sTemporary Liquidity Guarantee Program. Losses in this category are primarily due to market liquidityand interest rate reductions.
Asset and mortgage-backed securities
The vast majority of the Company’s asset and mortgage-backed securities have investment gradecredit ratings from the major rating agencies. These investments are collateralized by residential realestate, credit card receivables, commercial real estate, foreign mortgage receivables, and leasereceivables. Estimates of fair value are based upon a variety of factors including, but not limited to,credit rating of the issuer, internal credit risk, interest rate variation, prepayment assumptions, and thepotential for default.
Certificates of deposit
Certificate of deposits are short-term interest-bearing debt instruments issued by various financialinstitutions with which the Company has an established banking relationship.
The Company’s investments at the end of 2011 and 2010, were as follows:
2011:CostBasis
UnrealizedGains
UnrealizedLosses
RecordedBasis
Available-for-sale:U.S. government and agency securities . . . . . . . . . . . $1,096 $ 8 $0 $1,104Corporate notes and bonds . . . . . . . . . . . . . . . . . . . . . 6 1 0 7FDIC-insured corporate bonds . . . . . . . . . . . . . . . . . . 208 1 0 209Asset and mortgage-backed securities . . . . . . . . . . . . 12 0 0 12
Total available-for-sale . . . . . . . . . . . . . . . . . . . . . 1,322 10 0 1,332Held-to-maturity:
Certificates of deposit . . . . . . . . . . . . . . . . . . . . . . . . . . 272 0 0 272
Total investments . . . . . . . . . . . . . . . . . . . . . . . . . $1,594 $10 $0 $1,604
62

2010:CostBasis
UnrealizedGains
UnrealizedLosses
RecordedBasis
Available-for-sale:U.S. government and agency securities . . . . . . . . . . . $1,222 $7 $0 $1,229Corporate notes and bonds . . . . . . . . . . . . . . . . . . . . . 10 1 0 11FDIC-insured corporate bonds . . . . . . . . . . . . . . . . . . 139 0 0 139Asset and mortgage-backed securities . . . . . . . . . . . . 23 0 0 23
Total available-for-sale . . . . . . . . . . . . . . . . . . . . . 1,394 8 0 1,402Held-to-maturity:
Certificates of deposit . . . . . . . . . . . . . . . . . . . . . . . . . . 133 0 0 133
Total investments . . . . . . . . . . . . . . . . . . . . . . . . . $1,527 $8 $0 $1,535
Gross unrealized gains and losses on cash equivalents were not material at August 28, 2011 andAugust 29, 2010.
The proceeds and gross realized gains and losses from sales of available-for-sale securities during2011, 2010, and 2009 are provided in the following table:
2011 2010 2009
Proceeds . . . . . . . . . . . . . . . . . . . . . . . . . . . . . . . . . . . . . . . . . . $602 $309 $183Realized gains . . . . . . . . . . . . . . . . . . . . . . . . . . . . . . . . . . . . . . 1 5 5Realized losses . . . . . . . . . . . . . . . . . . . . . . . . . . . . . . . . . . . . . 0 1 2
During 2009, the Company recognized $12 other-than-temporary impairment losses related to certainenhanced money fund investment securities, which were included in interest income and other, net inthe accompanying consolidated statements of income. At the end of 2010, the Company no longerheld any of these securities. At the end of 2011 and 2010 the Company’s available-for-sale securitiesthat were in continuous unrealized-loss position were insignificant.
The maturities of available-for-sale and held-to-maturity securities at August 28, 2011 were as follows:
Available-For-Sale Held-To-Maturity
Cost Basis Fair Value Cost Basis Fair Value
Due in one year or less . . . . . . . . . . . . . . . . . . . . . . . . . . . . $ 890 $ 892 $272 $272Due after one year through five years . . . . . . . . . . . . . . . . 426 433 0 0Due after five years . . . . . . . . . . . . . . . . . . . . . . . . . . . . . . . 6 7 0 0
Total . . . . . . . . . . . . . . . . . . . . . . . . . . . . . . . . . . . . $1,322 $1,332 $272 $272
63

Note 3—Fair Value Measurement
Assets and Liabilities Measured at Fair Value on a Recurring Basis
The tables below present information at the end 2011 and 2010, regarding the Company’s financialassets and financial liabilities that are measured at fair value on a recurring basis, and indicate thelevel within the fair value hierarchy of the valuation techniques utilized to determine such fair value. Asof these dates, the Company’s holdings of Level 3 financial assets and liabilities were immaterial.
2011: Level 1 Level 2
Money market mutual funds(1) . . . . . . . . . . . . . . . . . . . . . . . . . . . . . . . . . . . . . . . . $ 200 $ 0Investment in U.S. government and agency securities(3) . . . . . . . . . . . . . . . . . . . 0 1,177Investment in corporate notes and bonds . . . . . . . . . . . . . . . . . . . . . . . . . . . . . . . 0 7Investment in FDIC-insured corporate bonds . . . . . . . . . . . . . . . . . . . . . . . . . . . . 0 209Investment in asset and mortgage-backed securities . . . . . . . . . . . . . . . . . . . . . . 0 12Forward foreign-exchange contracts, in asset position(2) . . . . . . . . . . . . . . . . . . 0 1Forward foreign-exchange contracts, in (liability) position(2) . . . . . . . . . . . . . . . . 0 (2)
Total . . . . . . . . . . . . . . . . . . . . . . . . . . . . . . . . . . . . . . . . . . . . . . . . . . . . . . . . . . $ 200 $1,404
2010: Level 1 Level 2
Money market mutual funds(1) . . . . . . . . . . . . . . . . . . . . . . . . . . . . . . . . . . . . . . . . $1,514 $ 0Investment in U.S. government and agency securities . . . . . . . . . . . . . . . . . . . . . 0 1,229Investment in corporate notes and bonds . . . . . . . . . . . . . . . . . . . . . . . . . . . . . . . 0 11Investment in FDIC-insured corporate bonds . . . . . . . . . . . . . . . . . . . . . . . . . . . . 0 139Investment in asset and mortgage-backed securities . . . . . . . . . . . . . . . . . . . . . . 0 23Forward foreign-exchange contracts, in asset position(2) . . . . . . . . . . . . . . . . . . 0 1Forward foreign-exchange contracts, in (liability) position(2) . . . . . . . . . . . . . . . . 0 (3)
Total . . . . . . . . . . . . . . . . . . . . . . . . . . . . . . . . . . . . . . . . . . . . . . . . . . . . . . . . . . $1,514 $1,400
(1) Included in cash and cash equivalents in the accompanying consolidated balance sheets.
(2) The asset and the liability values are included in deferred income taxes and other current assetsand other current liabilities, respectively, in the accompanying consolidated balance sheets. SeeNote 1 for additional information on derivative instruments.
(3) $73 and $1,104 included in cash and cash equivalents and short-term investments, respectively,in the accompanying consolidated balance sheets.
Changes in fair value, including net transfers, of all financial assets and liabilities measured at fairvalue on a recurring basis using significant unobservable inputs (Level 3) during 2011 and 2010 wereimmaterial.
The Company reports transfers in and out of Levels 1, 2, and 3, as applicable, using the fair value ofthe individual securities as of the beginning of the reporting period in which the transfer occurred.There were no transfers in or out of Level 1, 2, or 3 during 2011 and 2010.
Assets and Liabilities Measured at Fair Value on a Nonrecurring Basis
Financial assets measured at fair value on a nonrecurring basis include held-to-maturity investmentsthat are carried at amortized cost and are not remeasured to fair value on a recurring basis. Therewere no fair value adjustments to these financial assets measured during the 2011 and 2010.
64

Nonfinancial assets measured at fair value on a nonrecurring basis include items such as long livedassets that are measured at fair value resulting from an impairment, if deemed necessary. Fair valueadjustments to these nonfinancial assets and liabilities during 2011 and 2010 were immaterial.
Note 4—Debt
Bank Credit Facilities and Commercial Paper Programs
The Company enters into various short-term bank credit facilities. At the end of 2011 and 2010, thetotal amount of credit under these facilities was $391 and $341, respectively. The total amountoutstanding was $26 at the end of 2010. There was nothing outstanding at the end of 2011. Thevarious credit facilities provide for applicable interest rates ranging from 0.58% to 4.39% in 2011 and0.61% to 3.63% in 2010.
Short-Term Borrowings
The weighted average borrowings, maximum borrowings, and weighted average interest rate under allshort-term borrowing arrangements were as follows for 2011 and 2010:
Category of AggregateShort-term Borrowings
Maximum AmountOutstanding
During the Fiscal Year
Average AmountOutstanding
During the Fiscal Year
Weighted AverageInterest Rate
During the Fiscal Year
Year ended August 28, 2011
Bank borrowings:Canada . . . . . . . . . . . . . . . . . . . . . . . $ 6 $ 4 3.00%Japan . . . . . . . . . . . . . . . . . . . . . . . . . 70 20 0.58
Bank overdraft facility:United Kingdom . . . . . . . . . . . . . . . . . 16 4 1.50
Year ended August 29, 2010
Bank borrowings:Canada . . . . . . . . . . . . . . . . . . . . . . . $ 1 $ 1 2.75%Japan . . . . . . . . . . . . . . . . . . . . . . . . . 64 39 0.63
Bank overdraft facility:United Kingdom . . . . . . . . . . . . . . . . . 5 2 1.50
Long-Term Debt
Long-term debt at the end of 2011 and 2010 consisted of the following:
2011 2010
5.5% Senior Notes due March 2017 . . . . . . . . . . . . . . . . . . . . . . . . . . . $1,097 $1,0965.3% Senior Notes due March 2012 . . . . . . . . . . . . . . . . . . . . . . . . . . . 900 8992.695% Promissory notes due October 2017 . . . . . . . . . . . . . . . . . . . . 85 770.35% over Yen TIBOR (6-month) Term Loan due June 2018 . . . . . . 39 353.5% Zero Coupon convertible subordinated notes due August
2017 . . . . . . . . . . . . . . . . . . . . . . . . . . . . . . . . . . . . . . . . . . . . . . . . . . . 31 32Other long-term debt . . . . . . . . . . . . . . . . . . . . . . . . . . . . . . . . . . . . . . . . 1 2
Total long-term debt . . . . . . . . . . . . . . . . . . . . . . . . . . . . . . . . . . . . . . . . 2,153 2,141Less current portion of 5.3% Senior Notes due March 2012 . . . . . . . . 900 0
Long-term debt, excluding current portion . . . . . . . . . . . . . . . . . . . . . . . $1,253 $2,141
In April 2010, the Company’s Japanese subsidiary paid the outstanding principal and interest balancesrelated to the 0.92% promissory notes due April 2010, originally issued in April 2003.
65
In June 2008, the Company’s Japanese subsidiary entered into a ten-year term loan with a variablerate of interest of Yen TIBOR (6-month) plus a 0.35% margin (0.79% and 0.84% at the end of 2011and 2010, respectively) on the outstanding balance. Interest is payable semi-annually in Decemberand June and principal is due in June 2018.
In October 2007, the Company’s Japanese subsidiary issued promissory notes through a privateplacement, bearing interest at 2.695%. Interest is payable semi-annually, and principal is due inOctober 2017. The Company guarantees all financing instruments issued by its Japanese subsidiary.
In February 2007, the Company issued $900 of 5.3% Senior Notes due March 15, 2012 (2012 Notes)at a discount of $2 and $1,100 of 5.5% Senior Notes due March 15, 2017 (2017 Notes) at a discount of$6 (together the 2007 Senior Notes). Interest on the 2007 Senior Notes is payable semi-annually onMarch 15 and September 15 of each year. The discount and issuance costs associated with the SeniorNotes are being amortized to interest expense over the terms of those notes. The Company, at itsoption, may redeem the 2007 Senior Notes at any time, in whole or in part, at a redemption price plusaccrued interest. The redemption price is equal to the greater of 100% of the principal amount of the2007 Senior Notes to be redeemed, or the sum of the present values of the remaining scheduledpayments of principal and interest to maturity. Additionally, the Company will be required to make anoffer to purchase the 2007 Senior Notes at a price of 101% of the principal amount plus accrued andunpaid interest to the date of repurchase, upon certain events as defined by the terms of the 2007Senior Notes. In March 2011, the Company reclassified its 2012 Notes, to a current liability within thecurrent portion of long-term debt of the consolidated balance sheets to reflect its remaining maturity ofless than one year.
In August 1997, the Company sold $900 principal amount at maturity 3.5% Zero Coupon ConvertibleSubordinated Notes (Zero Coupon Notes) due in August 2017. The Zero Coupon Notes were pricedwith a yield to maturity of 3.5%, resulting in gross proceeds to the Company of $450. The remainingZero Coupon Notes outstanding are convertible into a maximum of 878,000 shares of Costco CommonStock shares at an initial conversion price of $22.71. Holders of the Zero Coupon Notes may requirethe Company to purchase the Zero Coupon Notes (at the discounted issue price plus accrued interestto date of purchase) in August 2012. The Company, at its option, may redeem the Zero Coupon Notes(at the discounted issue price plus accrued interest to date of redemption) any time after August 2002.As of August 28, 2011, $862 in principal amount of Zero Coupon Notes had been converted by noteholders into shares of Costco Common Stock, of which the principal converted during 2011, 2010 and2009 is detailed in the table below:
2011 2010 2009
Principal converted during period . . . . . . . . . . . . . . . . . . . . . . . $ 3 $ 1 $ 25Principal converted, including the related debt discount . . . . . $ 2 $ 1 $ 19Shares issued upon conversion (000’s) . . . . . . . . . . . . . . . . . . 65 18 562
66

The carrying value and estimated fair value of long-term debt consisted of the following at the end of2011 and 2010:
2011 2010
CarryingValue
FairValue
CarryingValue
FairValue
2017 Notes . . . . . . . . . . . . . . . . . . . . . . . . . $1,097 $1,314 $1,096 $1,2952012 Notes . . . . . . . . . . . . . . . . . . . . . . . . . 900 924 899 961Zero Coupon Notes . . . . . . . . . . . . . . . . . . . 31 63 32 51Other long-term debt . . . . . . . . . . . . . . . . . . 125 134 114 122
Total long-term debt . . . . . . . . . . . . . . . . . . 2,153 2,435 2,141 2,429Less current portion . . . . . . . . . . . . . . . . . . 900 924 0 0
Long-term debt, excluding currentportion . . . . . . . . . . . . . . . . . . . . . . . . . . . $1,253 $1,511 $2,141 $2,429
The estimated fair value of the zero coupon notes is based upon quoted market prices. All of theCompany’s other debt obligations are based upon quoted market prices of similar types of borrowingarrangements.
Maturities of long-term debt during the next five fiscal years and thereafter are as follows:
2012 . . . . . . . . . . . . . . . . . . . . . . . . . . . . . . . . . . . . . . . . . . . . . . . . . . . . . . . . $ 9002013 . . . . . . . . . . . . . . . . . . . . . . . . . . . . . . . . . . . . . . . . . . . . . . . . . . . . . . . . 02014 . . . . . . . . . . . . . . . . . . . . . . . . . . . . . . . . . . . . . . . . . . . . . . . . . . . . . . . . 02015 . . . . . . . . . . . . . . . . . . . . . . . . . . . . . . . . . . . . . . . . . . . . . . . . . . . . . . . . 02016 . . . . . . . . . . . . . . . . . . . . . . . . . . . . . . . . . . . . . . . . . . . . . . . . . . . . . . . . 0Thereafter . . . . . . . . . . . . . . . . . . . . . . . . . . . . . . . . . . . . . . . . . . . . . . . . . . . 1,253
Total . . . . . . . . . . . . . . . . . . . . . . . . . . . . . . . . . . . . . . . . . . . . . . . . . . . . $2,153
Note 5—Leases
Operating Leases
The aggregate rental expense and sublease income related to certain of its operating leasearrangements, for 2011, 2010 and 2009 are as follows:
Aggregaterental
expenseSubleaseincome(1)
2011 . . . . . . . . . . . . . . . . . . . . . . . . . . . . . . . . . . . . . . . . . . . . . . $208 $102010 . . . . . . . . . . . . . . . . . . . . . . . . . . . . . . . . . . . . . . . . . . . . . . 187 102009 . . . . . . . . . . . . . . . . . . . . . . . . . . . . . . . . . . . . . . . . . . . . . . 177 10
(1) Included in interest income and other, net
Contingent rents are not material.
Capital Leases
Gross assets recorded under these leases were $170 and $169, at the end of 2011 and 2010,respectively. These assets are recorded net of accumulated amortization of $13 and $7 at the end of2011 and 2010, respectively.
67

Future minimum payments, net of sub-lease income of $183 for all years combined, during the nextfive fiscal years and thereafter under non-cancelable operating leases with terms of at least one yearand capital leases, at the end of 2011, were as follows:
Operatingleases
Capital leaseobligations
2012 . . . . . . . . . . . . . . . . . . . . . . . . . . . . . . . . . . . . . . . . . . . . . . . . . . . $ 183 $ 132013 . . . . . . . . . . . . . . . . . . . . . . . . . . . . . . . . . . . . . . . . . . . . . . . . . . . 182 132014 . . . . . . . . . . . . . . . . . . . . . . . . . . . . . . . . . . . . . . . . . . . . . . . . . . . 175 132015 . . . . . . . . . . . . . . . . . . . . . . . . . . . . . . . . . . . . . . . . . . . . . . . . . . . 162 132016 . . . . . . . . . . . . . . . . . . . . . . . . . . . . . . . . . . . . . . . . . . . . . . . . . . . 155 13Thereafter . . . . . . . . . . . . . . . . . . . . . . . . . . . . . . . . . . . . . . . . . . . . . . . 1,850 311
Total . . . . . . . . . . . . . . . . . . . . . . . . . . . . . . . . . . . . . . . . . . . . . . . . $2,707 376
Less amount representing interest . . . . . . . . . . . . . . . . . . . . . . . . . . . (207)
Net present value of minimum lease payment . . . . . . . . . . . . . . . . . . 169Less current installments(1) . . . . . . . . . . . . . . . . . . . . . . . . . . . . . . . . (3)
Long-term capital lease obligations less current installments(2) . . . $ 166
(1) Included in other current liabilities.
(2) Included in deferred income taxes and other liabilities.
Certain leases may require the Company to incur costs to return leased property to its originalcondition, such as the removal of gas tanks. Estimated asset retirement obligations associated withthese leases, which amounted to $31 and $26 at the end of 2011 and 2010, respectively, are recordedand included in deferred income taxes and other liabilities on the consolidated balance sheets.
Note 6—Stockholders’ Equity
Dividends
The Company’s current quarterly dividend rate is $0.24 per share.
Stock Repurchase Programs
The Company’s stock repurchase activity during 2011, 2010, and 2009 is summarized in the followingtable:
SharesRepurchased
(000’s)
AveragePrice per
ShareTotalCost
2011 . . . . . . . . . . . . . . . . . . . . . . . . . . . . . . . . . . . . . . . . . . 8,939 $71.74 $6412010 . . . . . . . . . . . . . . . . . . . . . . . . . . . . . . . . . . . . . . . . . . 9,943 57.14 5682009 . . . . . . . . . . . . . . . . . . . . . . . . . . . . . . . . . . . . . . . . . . 895 63.84 57
These amounts differ from the stock repurchase balances in the consolidated statements of cash flowsto the extent that repurchases had not settled at the end of the fiscal year. Purchases are made fromtime-to-time, as conditions warrant, in the open market or in block purchases, and pursuant to sharerepurchase plans under SEC Rule 10b5-1. Repurchased shares are retired.
68

Amounts remaining under stock repurchase authorizations of the Board of Directors at the end of 2011are detailed below:
Date AuthorizedAmount
AuthorizedAmount
RepurchasedAmount
Remaining
Prior to November 2007 . . . . . . . . . . . . . . . . . . . . . . . $ 4,800 $4,800 $ 0November 2007 (expired in November 2010)(1) . . . 1,000 705 0July 2008 (expired in July 2011)(2) . . . . . . . . . . . . . . 1,000 208 0April 2011 (expires April 2015) . . . . . . . . . . . . . . . . . 4,000 294 3,706
Total . . . . . . . . . . . . . . . . . . . . . . . . . . . . . . . . . . . $10,800 $6,007 $3,706
(1) In November 2010, $295 of the November 2007 authorization expired having been unused by theCompany.
(2) In April 2011, $792 of the July 2008 authorization was cancelled and replaced by the Board ofDirectors upon authorization of the April 2011 stock repurchase program.
Accumulated Other Comprehensive Income
The components of accumulated other comprehensive income, net of tax where applicable, were asfollows:
2011 2010
Unrealized gains on short-term investments . . . . . . . . . . . . . . . . $ 7 $ 6Foreign-currency translation adjustment and other . . . . . . . . . . . 366 116
Accumulated other comprehensive income . . . . . . . . . . . . . $373 $122
Note 7—Stock-Based Compensation Plans
Through the first quarter of fiscal 2006, the Company granted stock options under the Amended andRestated 2002 Stock Incentive Plan (Second Restated 2002 Plan) and predecessor plans. Since thefourth quarter of fiscal 2006, the Company has granted RSUs under the Second Restated 2002 Plan.In July 2008 the Third Restated 2002 Plan was amended by the Board of Directors (Fourth Restated2002 Plan). Under the Fourth Restated 2002 Plan, prospective grants of RSUs are subject, uponcertain terminations of employment, to quarterly, as opposed to daily vesting. Previously awarded RSUgrants continue to involve daily vesting upon certain terminations of employment. Additionally,employees who attain certain years of service with the Company will receive shares under acceleratedvesting provisions on the annual vesting date rather than upon qualified retirement. The first grantimpacted by these amendments occurred in the first quarter of fiscal 2009. In the second quarter offiscal 2010, the Fourth Restated 2002 Plan was amended following shareholder approval and is nowreferred to as the Fifth Restated 2002 Stock Incentive Plan (Fifth Restated 2002 Plan). The FifthRestated 2002 Plan authorizes the issuance of an additional 18,000,000 shares (10,285,714 RSUs) ofcommon stock for future grants in addition to grants currently authorized. Each share issued in respectof stock bonuses or stock units is counted as 1.75 shares toward the limit of shares available. TheCompany issues new shares of common stock upon exercise of stock options and vesting of RSUs.
69
Summary of Stock Option Activity
The following table summarizes stock option transactions during 2011:
Number OfOptions(in 000’s)
Weighted-AverageExercise
Price
Weighted-Average
RemainingContractual
Term(in years)
AggregateIntrinsicValue(1)
Outstanding at the end of 2010 . . . . . . . . . 13,162 $39.50Exercised . . . . . . . . . . . . . . . . . . . . . . . (7,245) 39.03
Outstanding and exercisable at the end of2011 . . . . . . . . . . . . . . . . . . . . . . . . . . . . . 5,917 $40.07 2.77 $220
(1) The difference between the exercise price and market value of common stock at August 28, 2011.
The following is a summary of stock options outstanding at the end of 2011:
Options Outstanding and Exercisable
Range of Prices
Number ofOptions(in 000’s)
WeightedAverage
RemainingContractual
Life
WeightedAverageExercise
Price
$30.41–$37.35 . . . . . . . . . . . . . . . . . . . . . . . . . . . . . . . . . 2,446 2.19 $35.38$37.44–$42.41 . . . . . . . . . . . . . . . . . . . . . . . . . . . . . . . . . 481 0.67 39.05$43.79–$43.79 . . . . . . . . . . . . . . . . . . . . . . . . . . . . . . . . . 2,649 3.59 43.79$45.99–$46.46 . . . . . . . . . . . . . . . . . . . . . . . . . . . . . . . . . 341 3.58 46.19
5,917 2.77 $40.07
Options exercisable and the weighted average exercise price at the end of 2010 and 2009:
2010 2009
Options exercisable (shares in 000’s) . . . . . . . . . . . . . . . . . . . . . . . . . . . . 13,032 16,588Weighted average exercise price . . . . . . . . . . . . . . . . . . . . . . . . . . . . . . . $ 39.43 $ 39.62
The tax benefits realized and intrinsic value related to total stock options exercised during 2011, 2010,and 2009 are provided in the following table:
2011 2010 2009
Actual tax benefit realized for stock options exercised . . . . . . . . . $ 78 $34 $10Intrinsic value of stock options exercised(1) . . . . . . . . . . . . . . . . . $227 $98 $27
(1) The difference between the exercise price and market value of common stock measured at eachindividual exercise date.
Employee Tax Consequences on Certain Stock Options
In 2010, the Company recorded a non-recurring benefit of $24 to selling, general and administrativeexpense related to a refund of a previously recorded Canadian employee tax liability.
Summary of Restricted Stock Unit Activity
RSUs granted to employees and to non-employee directors generally vest over five years and threeyears, respectively; however, the Company provides for accelerated vesting for employees that haveattained twenty-five or more years of service with the Company. Recipients are not entitled to vote or
70

receive dividends on unvested shares. At the end of 2011, 8,565,000 shares were available to begranted as RSUs to eligible employees and directors under the Fifth Restated 2002 Plan.
The following awards were outstanding at the end of 2011:
• 9,010,000 shares of time-based RSUs that vest upon continued employment over specifiedperiods of time; and
• 717,000 performance-based RSUs, of which 315,000 will be formally granted to certainexecutive officers of the Company upon the official certification of the attainment of specifiedperformance targets for 2011. Once formally granted, the restrictions lapse upon continuedemployment over specified periods of time.
The following table summarizes RSU transactions during 2011:
Number ofUnits
(in 000’s)
Weighted-AverageGrant Date Fair
Value
Non-vested at the end of 2010 . . . . . . . . . . . . . . . . . . . 9,253 $55.22Granted . . . . . . . . . . . . . . . . . . . . . . . . . . . . . . . . . 3,971 61.27Vested . . . . . . . . . . . . . . . . . . . . . . . . . . . . . . . . . . (3,322) 55.55Forfeited . . . . . . . . . . . . . . . . . . . . . . . . . . . . . . . . . (175) 55.90
Non-vested at the end of 2011 . . . . . . . . . . . . . . . . . . . 9,727 $57.56
Summary of Stock-Based Compensation
The following table summarizes stock-based compensation expense and the related tax benefits underthe Company’s plans:
2011 2010 2009
Restricted stock units . . . . . . . . . . . . . . . . . . . . . . . . . . . . . . . . . . . . . . . . . . . . $206 $171 $132Stock options . . . . . . . . . . . . . . . . . . . . . . . . . . . . . . . . . . . . . . . . . . . . . . . . . . 1 19 49
Total stock-based compensation expense before income taxes . . . . . . . . . 207 190 181Less recognized income tax benefit . . . . . . . . . . . . . . . . . . . . . . . . . . . . . . . . 67 63 60
Total stock-based compensation expense, net of income taxes . . . . . . . . . $140 $127 $121
The remaining unrecognized compensation cost related to non-vested RSUs at August 28, 2011 was$386 and the weighted-average period of time over which this cost will be recognized is 1.6 years.
Note 8—Retirement Plans
The Company has a 401(k) Retirement Plan that is available to all U.S. employees who havecompleted 90 days of employment. For all U.S. employees, with the exception of California unionemployees, the plan allows pre-tax deferrals against which the Company matches 50% of the first onethousand dollars of employee contributions. In addition, the Company provides each eligible participantan annual discretionary contribution based on salary and years of service.
California union employees participate in a defined benefit plan sponsored by their union. TheCompany makes contributions based upon its union agreement. For all the California unionemployees, the Company-sponsored 401(k) plan currently allows pre-tax deferrals against which theCompany matches 50% of the first five hundred dollars of employee contributions. In addition, theCompany will provide each eligible participant a contribution based on hours worked and years ofservice.
71
The Company has a defined contribution plan for Canadian and United Kingdom employees andcontributes a percentage of each employee’s salary. Certain other foreign operations have definedbenefit and defined contribution plans that are not material. Amounts expensed under all plans were$345, $313, and $287 for 2011, 2010, and 2009, respectively, and were included in selling, generaland administrative expenses and merchandise costs on the consolidated statements of income.
Note 9—Income Taxes
Income before income taxes is comprised of the following:
2011 2010 2009
Domestic (including Puerto Rico) . . . . . . . . . . . . . . . . . . . $1,526 $1,426 $1,426Foreign . . . . . . . . . . . . . . . . . . . . . . . . . . . . . . . . . . . . . . . . 857 628 301
Total . . . . . . . . . . . . . . . . . . . . . . . . . . . . . . . . . . . . . . . $2,383 $2,054 $1,727
The provisions for income taxes for 2011, 2010, and 2009 are as follows:
2011 2010 2009
Federal:Current . . . . . . . . . . . . . . . . . . . . . . . . . . . . . . . . . . . . . $409 $445 $396Deferred . . . . . . . . . . . . . . . . . . . . . . . . . . . . . . . . . . . . 74 1 67
Total federal . . . . . . . . . . . . . . . . . . . . . . . . . . . . . 483 446 463
State:Current . . . . . . . . . . . . . . . . . . . . . . . . . . . . . . . . . . . . . 78 79 66Deferred . . . . . . . . . . . . . . . . . . . . . . . . . . . . . . . . . . . . 14 5 12
Total state . . . . . . . . . . . . . . . . . . . . . . . . . . . . . . 92 84 78
Foreign:Current . . . . . . . . . . . . . . . . . . . . . . . . . . . . . . . . . . . . . 270 200 94Deferred . . . . . . . . . . . . . . . . . . . . . . . . . . . . . . . . . . . . (4) 1 (7)
Total foreign . . . . . . . . . . . . . . . . . . . . . . . . . . . . . 266 201 87
Total provision for income taxes . . . . . . . . . . . . . . . . . . . . $841 $731 $628
Tax benefits associated with the exercise of employee stock options and other employee stockprograms were allocated directly to equity attributable to Costco in the amount of $59, $15, and $2, in2011, 2010, and 2009, respectively.
The reconciliation between the statutory tax rate and the effective rate for 2011, 2010, and 2009 is asfollows:
2011 2010 2009
Federal taxes at statutory rate . . . . . . . . . . . . . . $834 35.0% $718 35.0% $604 35.0%State taxes, net . . . . . . . . . . . . . . . . . . . . . . . . . . 55 2.4 56 2.7 48 2.8Foreign taxes, net . . . . . . . . . . . . . . . . . . . . . . . . (66) (2.8) (38) (1.9) (24) (1.4)Other . . . . . . . . . . . . . . . . . . . . . . . . . . . . . . . . . . . 18 0.7 (5) (0.2) 0 0
Total . . . . . . . . . . . . . . . . . . . . . . . . . . . . . . . $841 35.3% $731 35.6% $628 36.4%
72

The components of the deferred tax assets and liabilities are as follows:
2011 2010
Equity compensation . . . . . . . . . . . . . . . . . . . . . . . . . . . . . . . . . . . . . . . . . . . . . . $ 89 $112Deferred income/membership fees . . . . . . . . . . . . . . . . . . . . . . . . . . . . . . . . . . . 134 118Accrued liabilities and reserves . . . . . . . . . . . . . . . . . . . . . . . . . . . . . . . . . . . . . . 429 392Other . . . . . . . . . . . . . . . . . . . . . . . . . . . . . . . . . . . . . . . . . . . . . . . . . . . . . . . . . . . 32 35
Total deferred tax assets . . . . . . . . . . . . . . . . . . . . . . . . . . . . . . . . . . . . 684 657
Property and equipment . . . . . . . . . . . . . . . . . . . . . . . . . . . . . . . . . . . . . . . . . . . . 494 414Merchandise inventories . . . . . . . . . . . . . . . . . . . . . . . . . . . . . . . . . . . . . . . . . . . . 164 170
Total deferred tax liabilities . . . . . . . . . . . . . . . . . . . . . . . . . . . . . . . . . . . . . . 658 584
Net deferred tax assets . . . . . . . . . . . . . . . . . . . . . . . . . . . . . . . . . . . . . . . . . . . . $ 26 $ 73
The deferred tax accounts at the end of 2011 and 2010 include current deferred income tax assets of$360 and $307, respectively, included in deferred income taxes and other current assets; non-currentdeferred income tax assets of $53 and $10, respectively, included in other assets; and non-currentdeferred income tax liabilities of $387 and $244, respectively, included in deferred income taxes andother liabilities.
The Company has not provided for U.S. deferred taxes on cumulative undistributed earnings of certainnon-U.S. consolidated subsidiaries, aggregating to $2,646 and $1,972 at the end of 2011 and 2010,respectively, as such earnings are deemed by the Company to be indefinitely reinvested. Because ofthe availability of U.S. foreign tax credits and complexity of the computation, it is not practicable todetermine the U.S. federal income tax liability or benefit that would be associated with such earnings ifsuch earnings were not deemed to be indefinitely reinvested.
A reconciliation of the beginning and ending amount of gross unrecognized tax benefits for 2011 and2010 is as follows:
2011 2010
Gross unrecognized tax benefit at beginning of year . . . . . . . . . . . . . . . . . $ 83 $ 80Gross increases—current year tax positions . . . . . . . . . . . . . . . . . . . . 21 29Gross increases—tax positions in prior years . . . . . . . . . . . . . . . . . . . 10 4Gross decreases—tax positions in prior years . . . . . . . . . . . . . . . . . . . (6) (1)Settlements . . . . . . . . . . . . . . . . . . . . . . . . . . . . . . . . . . . . . . . . . . . . . . . (1) (27)Lapse of statute of limitations . . . . . . . . . . . . . . . . . . . . . . . . . . . . . . . . (1) (2)
Gross unrecognized tax benefit at end of year . . . . . . . . . . . . . . . . . . . . . . $106 $ 83
Included in the balance at the end of 2011, are $64 of tax positions for which the ultimate deductibilityis highly certain but for which there is uncertainty about the timing of such deductibility. Because of theimpact of deferred tax accounting, other than interest and penalties, the disallowance of these taxpositions would not affect the annual effective tax rate but would accelerate the payment of cash to thetaxing authority to an earlier period.
The total amount of unrecognized tax benefits that, if recognized, would favorably affect the effectiveincome tax rate in future periods is $34 and $27 at the end of 2011 and 2010, respectively.
Accrued interest and penalties related to income tax matters are classified as a component of incometax expense. The Company recognized $2 of expense and $7 of income related to interest andpenalties in 2011 and 2010, respectively. Accrued interest and penalties are $12 and $9 at the end of2011 and 2010, respectively.
73

The Company is currently under audit by several taxing jurisdictions in the United States and in severalforeign countries. Some audits may conclude in the next 12 months and the unrecognized tax benefitswe have recorded in relation to the audits may differ from actual settlement amounts. It is not possibleto estimate the effect, if any, of any amount of such change during the next 12 months to previouslyrecorded uncertain tax positions in connection with the audits. The Company does not anticipate thatthere will be a material increase or decrease in the total amount of unrecognized tax benefits in thenext 12 months.
The Company files income tax returns in the United States, various state and local jurisdictions, inCanada and in several other foreign jurisdictions. With few exceptions, the Company is no longersubject to U.S. federal, state or local examination for years before fiscal 2007. The Company iscurrently subject to examination in Canada for fiscal years 2006 to present and in California for fiscalyears 2004 to present. No other examinations are believed to be material.
Note 10—Net Income Per Common and Common Equivalent Share
The following table shows the amounts used in computing net income per share and the effect onincome and the weighted average number of shares of dilutive potential common stock (shares in000’s):
2011 2010 2009
Net income available to common stockholders used in basicnet income per common share . . . . . . . . . . . . . . . . . . . . . . . . $1,462 $1,303 $1,086
Interest on convertible notes, net of tax . . . . . . . . . . . . . . . . . . . 1 1 1
Net income available to common stockholders after assumedconversions of dilutive securities . . . . . . . . . . . . . . . . . . . . . . . $1,463 $1,304 $1,087
Weighted average number of common shares used in basicnet income per common share . . . . . . . . . . . . . . . . . . . . . . . . 436,119 438,611 433,988
Stock options and RSUs . . . . . . . . . . . . . . . . . . . . . . . . . . . . . . . 6,063 6,409 5,072Conversion of convertible notes . . . . . . . . . . . . . . . . . . . . . . . . . 912 950 1,394
Weighted number of common shares and dilutive potential ofcommon stock used in diluted net income per share . . . . . . . 443,094 445,970 440,454
Anti-dilutive stock options and RSUs . . . . . . . . . . . . . . . . . . . . . 0 1,141 8,045
Note 11—Commitments and Contingencies
Legal Proceedings
The Company is involved from time to time in claims, proceedings and litigation arising from itsbusiness and property ownership. The Company is a defendant in the following matters, among others:
A class action was filed on May 15, 2009, on behalf of present and former hourly employees inCalifornia, in which the plaintiff principally alleges that the Company’s routine closing procedures andsecurity checks cause employees to incur delays that qualify as uncompensated working time. MaryPytelewski v. Costco Wholesale Corp., Superior Court for the County of San Diego,Case No. 37-2009-00089654. The case was removed to the United States District Court, SouthernDistrict of California (San Diego), Case No. 09-CV-02473-AJB (BGS). On December 14, 2010, thecourt certified two classes of hourly non-exempt employees subject to the Company’s closing lockdownprocedures: one under California law for California non-union employees who were subject to theclosing procedures between May 15, 2005, and October 1, 2009; and a nationwide class under federal
74
law for full-time employees who were subject to the closing procedures between March 1, 2008, andOctober 1, 2009. The case has been renamed Eric Stiller v. Costco Wholesale Corp. and the partiesare conducting discovery. A similar class action was filed on November 20, 2009, in the State ofWashington. Raven Hawk v. Costco Wholesale Corp., King County Superior Court,Case No. 09-242196-0-SEA. On December 3, 2010, the court granted in part plaintiff’s motion for classcertification; the class certified consists of people employed in Washington state warehouses fromNovember 2006 through November 2009 who had clocked out and were detained during closingprocedures without compensation. Trial has been scheduled for February 13, 2012.
On July 14, 2010, a putative class action was filed alleging that the Company unlawfully failed to payovertime compensation, denied meal and rest breaks, failed to pay minimum wages, failed to provideaccurate wage-itemization statements, and willfully failed to pay termination wages allegedly resultingfrom misclassification of certain California department managers as exempt employees. OnSeptember 3, 2010, the Company removed the case to federal court. The court remanded the action,and the Company’s petition to the Ninth Circuit for permission to appeal the remand order was denied.On June 24, 2011, defendants filed a motion to strike the class and certain other allegations from thecomplaint. On July 26, 2011, the court granted the motion in part, without leave to amend, strikingallegations predating December 31, 2008, which are covered by a prior class settlement. The Courtalso granted the motion with respect to allegations post-dating December 31, 2008, but granted plaintiffleave to amend. On August 25, 2011, plaintiff filed an amended complaint, and on September 20,2011, defendants renewed the motion to strike. The motion is set for hearing on October 13, 2011.Manuel Medrano v. Costco Wholesale Corp., and Costco Wholesale Membership, Inc., Superior Courtof California (Los Angeles), Case No. BC441597.
In Velazquez v. Costco, filed April 4, 2011, now pending in U.S. District Court for the Central District ofCalifornia, Case No. CV11-00508 JVS (RNBx), three former California Receiving Managers seek classtreatment for their claim that Costco misclassified California Receiving Managers as exempt. OnOctober 11, 2011, the court denied plaintiffs’ motion for class certification.
On May 12, 2011, a putative class action was filed on behalf of California employees alleging that theCompany failed to provide its cashiers with seats, in violation of California law. The complaint alsoalluded to purported overtime violations and missed meal periods and rest breaks. On August 10,2011, the Company removed the case to federal court. On August, 17, 2011, the Company filed amotion to dismiss the class action complaint. On August 30, 2011, the plaintiff voluntarily dismissed thecase, and a dismissal without prejudice was entered. Suzanne Justice v. Costco Wholesale Corp.,United States District Court (Los Angeles), Case No. LACV11-6563-ODW (JEMx).
Claims in the above actions (other than Hawk) are made under various provisions of the CaliforniaLabor Code and the California Business and Professions Code. Plaintiffs seek restitution/disgorgement, compensatory damages, various statutory penalties, punitive damages, interest, andattorneys’ fees.
A case brought as a class action on behalf of certain present and former female managers, in whichplaintiffs allege denial of promotion based on gender in violation of Title VII of the Civil Rights Act of1964 and California state law. Shirley “Rae” Ellis v. Costco Wholesale Corp., United States DistrictCourt (San Francisco), Case No. C-04-3341-MHP. Plaintiffs seek compensatory damages, punitivedamages, injunctive relief, interest and attorneys’ fees. Class certification was granted by the districtcourt on January 11, 2007. On September 16, 2011, the United States Court of Appeals for the NinthCircuit reversed the order of class certification and remanded to the district court for furtherproceedings.
75

Class actions stated to have been brought on behalf of certain present and former Costco members:
Numerous putative class actions have been brought around the United States against motor fuelretailers, including the Company, alleging that they have been overcharging consumers by sellinggasoline or diesel that is warmer than 60 degrees without adjusting the volume sold to compensate forheat-related expansion or disclosing the effect of such expansion on the energy equivalent received bythe consumer. The Company is named in the following actions: Raphael Sagalyn, et al., v. ChevronUSA, Inc., et al., Case No. 07-430 (D. Md.); Phyllis Lerner, et al., v. Costco Wholesale Corporation, etal., Case No. 07-1216 (C.D. Cal.); Linda A. Williams, et al., v. BP Corporation North America, Inc., etal., Case No. 07-179 (M.D. Ala.); James Graham, et al. v. Chevron USA, Inc., et al., Civil ActionNo. 07-193 (E.D. Va.); Betty A. Delgado, et al., v. Allsups, Convenience Stores, Inc., et al., CaseNo. 07-202 (D.N.M.); Gary Kohut, et al. v. Chevron USA, Inc., et al., Case No. 07-285 (D. Nev.); MarkRushing, et al., v. Alon USA, Inc., et al., Case No. 06-7621 (N.D. Cal.); James Vanderbilt, et al., v. BPCorporation North America, Inc., et al., Case No. 06-1052 (W.D. Mo.); Zachary Wilson, et al., v.Ampride, Inc., et al., Case No. 06-2582 (D. Kan.); Diane Foster, et al., v. BP North America Petroleum,Inc., et al., Case No. 07-02059 (W.D. Tenn.); Mara Redstone, et al., v. Chevron USA, Inc., et al.,Case No. 07-20751 (S.D. Fla.); Fred Aguirre, et al. v. BP West Coast Products LLC, et al., Case-No. 07-1534 (N.D. Cal.); J.C. Wash, et al., v. Chevron USA, Inc., et al.; Case No. 4:07cv37 (E.D. Mo.);Jonathan Charles Conlin, et al., v. Chevron USA, Inc., et al.; Case No. 07 0317 (M.D. Tenn.); WilliamBarker, et al. v. Chevron USA, Inc., et al.; Case No. 07-cv-00293 (D.N.M.); Melissa J. Couch, et al. v.BP Products North America, Inc., et al., Case No. 07cv291 (E.D. Tex.); S. Garrett Cook, Jr., et al., v.Hess Corporation, et al., Case No. 07cv750 (M.D. Ala.); Jeff Jenkins, et al. v. Amoco Oil Company, etal., Case No. 07-cv-00661 (D. Utah); and Mark Wyatt, et al., v. B. P. America Corp., et al.,Case No. 07-1754 (S.D. Cal.). On June 18, 2007, the Judicial Panel on Multidistrict Litigation assignedthe action, entitled In re Motor Fuel Temperature Sales Practices Litigation, MDL Docket No 1840, toJudge Kathryn Vratil in the United States District Court for the District of Kansas. On February 21,2008, the court denied a motion to dismiss the consolidated amended complaint. On April 12, 2009,the Company agreed to a settlement involving the actions in which it is named as a defendant. Underthe settlement, which is subject to final approval by the court, the Company agreed, to the extentallowed by law, to install over five years from the effective date of the settlement temperature-correcting dispensers in the States of Alabama, Arizona, California, Florida, Georgia, Kentucky,Nevada, New Mexico, North Carolina, South Carolina, Tennessee, Texas, Utah, and Virginia. Otherthan payments to class representatives, the settlement does not provide for cash payments to classmembers. On August 18, 2009, the court preliminarily approved the settlement. On August 13, 2010,the court denied plaintiffs’ motion for final approval of the settlement. On February 3, 2011, a revisedsettlement agreement was submitted for court approval. On September 22, 2011, the courtpreliminarily approved the revised settlement.
The Company has been named as a defendant in two purported class actions relating to sales oforganic milk. Hesse v. Costco Wholesale Corp., No. C07-1975 (W.D. Wash.); Snell v. Aurora DairyCorp., et al., No. 07-CV-2449 (D. Col.). Both actions claim violations of the laws of various states,essentially alleging that milk provided to Costco by its supplier Aurora Dairy Corp. was improperlylabeled “organic.” Plaintiffs filed a consolidated complaint on July 18, 2008. With respect to theCompany, plaintiffs seek to certify four classes of people who purchased Costco organic milk. Aurorahas maintained that it has held and continues to hold valid organic certifications. The consolidatedcomplaint seeks, among other things, actual, compensatory, statutory, punitive and/or exemplarydamages in unspecified amounts, as well as costs and attorneys’ fees. On June 3, 2009, the districtcourt entered an order dismissing with prejudice, among others, all claims against the Company. As aresult of an appeal by the plaintiffs, on September 15, 2010, the court of appeals affirmed in part andreversed in part the rulings of the district court and remanded the matter for further proceedings.Plaintiffs have filed amended complaints.
76

In Verzani, et ano., v. Costco Wholesale Corp., No. 09 CV 2117 (United States District Court for theSouthern District of New York), a purported nationwide class action, the plaintiffs allege claims forbreach of contract and violation of the Washington Consumer Protection Act, based on the failure ofthe Company to disclose on the label of its “Shrimp Tray with Cocktail Sauce” the weight of the shrimpin the item as distinct from the accompanying cocktail sauce, lettuce, and lemon wedges. Thecomplaint seeks various forms of damages (including compensatory and treble damages anddisgorgement and restitution), injunctive and declaratory relief, attorneys’ fees, costs, and prejudgmentinterest. On April 21, 2009, the plaintiff filed a motion for a preliminary injunction, seeking to prevent theCompany from selling the shrimp tray unless the Company separately discloses the weight of theshrimp and provides shrimp consistent with the disclosed weight. By orders dated July 29 andAugust 6, 2009, the court denied the preliminary injunction motion and dismissed the claim for breachof contract, and on July 21, 2010, the court of appeals summarily affirmed these rulings. OnSeptember 28, 2010, the district court denied the motion of one plaintiff to file an amended complaint.On September 20, 2011, the court of appeals affirmed the rulings of the district court.
In Kilano, et. ano, v. Costco Wholesale Corp., No. 2:10-cv-11456-VAR-DAS (United States DistrictCourt for the Eastern District of Michigan), filed on April 12, 2010, a purported class action was filed onbehalf of certain Michigan Executive level-members who received 2% rewards. Plaintiffs allege that theCompany “guarantees” that the member will receive rewards of no less than the fifty dollar differencebetween Executive and Gold Star membership and that the Company is required to but has failed toautomatically reimburse members whose rewards are less than this difference. Plaintiffs allegeviolations of the Michigan Consumer Protection Act, breach of contract, and unjust enrichment. Theyseek compensatory and statutory damages, injunctive relief, costs, and attorneys’ fees. The Companyfiled an answer denying the material allegations of the complaint. On April 5, 2011, the court deniedplaintiff’s motion for class certification. On July 22, 2011, plaintiffs sought leave to file an amendedcomplaint.
On March 15, 2011, Robles, et al., v. Costco Wholesale Corporation was filed as a purported classaction in the United States District Court for the Northern District of Illinois, Case No. 11-CV-1785.Plaintiffs seek to represent a class composed of all disabled persons with ambulatory impairments whodepend upon the use of a wheelchair and are allegedly unable to obtain optometry services at theCompany. Plaintiffs allege that the Company has failed to remove architectural barriers that prevent fulland equal enjoyment of and access to its eye examination services. They allege violations of Title III ofthe Americans with Disabilities Act and the Rehabilitation Act of 1973. They seek injunctive relief andcompensatory damages, costs, and attorneys’ fees. The Company has filed an answer denying thematerial allegations of the complaint.
Three shareholder derivative lawsuits were filed, ostensibly on behalf of the Company, against certainof its current and former officers and directors, relating to the Company’s stock option grants. One suit,Sandra Donnelly v. James Sinegal, et al., Case No. 08-2-23783-4 SEA (King County Superior Court),was filed in Washington state court on or about July 17, 2008. Plaintiff alleged, among other things,that individual defendants breached their fiduciary duties to the Company by “backdating” grants ofstock options issued between 1997 and 2005 to various current and former executives, allegedly inviolation of the Company’s shareholder-approved stock option plans. On April 3, 2009, on theCompany’s motion the court dismissed the action, following the plaintiff’s disclosure that she hadceased to own Costco common stock, a requirement for her to pursue a derivative action. The secondaction, Pirelli Armstrong Tire Corp. Retiree Medical Benefits Trust v. James Sinegal, et al., CaseNo. 2:08-cv-01450-TSZ (United States District Court for the Western District of Washington), was filedon or about September 29, 2008, and named as defendants all but one of the Company’s directors andcertain of its senior executives. Plaintiff alleged that defendants approved the issuance of backdatedstock options, concealed the backdating of stock options, and refused to vindicate the Company’srights by pursuing those who obtained improper incentive compensation. The third action, Daniel
77

Buckfire v. James D. Sinegal, et al., No. 2:09-cv-00893-TSZ (United States District Court for theWestern District of Washington), was filed on or about June 29, 2009, and contains allegationssubstantially similar to those in the Pirelli action. On August 12, 2009, the court entered an orderconsolidating the Pirelli and Buckfire actions. On October 2, 2009, plaintiffs Pirelli and Buckfire filed aconsolidated amended complaint. On November 16, 2009, the defendants filed motions to dismiss theamended complaint on various grounds, including that plaintiffs failed to properly allege why a pre-suitdemand had not been made on the Board of Directors. On September 20, 2010, a special committeeof the Board of Directors of the Company approved an agreement in principle with the plaintiffs thatwould terminate the litigation. The agreement, which was subject among other things to federal districtcourt approval, provided that the Company will pay an amount not to exceed $4.85 million in attorneys’fees to plaintiffs’ counsel and will adopt or maintain certain governance, control and other processchanges. On December 20, 2010, the parties executed a stipulation of settlement, and on January 14,2011, plaintiffs filed a motion for court approval of the settlement. On February28, 2011, the courtentered an order that preliminarily approved, subject to further consideration at a settlement hearing,the proposed settlement of the action involving, among other things, a dismissal of the consolidatedderivative actions with prejudice. On June 10, 2011, the court granted final approval to the settlement,and the case has been dismissed.
On October 4, 2006, the Company received a grand jury subpoena from the United States Attorney’sOffice for the Central District of California, seeking records relating to the Company’s receipt andhandling of hazardous merchandise returned by Costco members and other records. The Companyhas entered into a tolling agreement with the United States Attorney’s Office.
The Environmental Protection Agency (EPA) issued an Information Request to the Company, datedNovember 1, 2007, under the Clean Air Act. The EPA sought records regarding warehouses in thestates of Arizona, California, Hawaii, and Nevada relating to compliance with regulations concerningair-conditioning and refrigeration equipment. On March 4, 2009, the Company was advised by theDepartment of Justice that the Department was prepared to allege that the Company has committed atleast nineteen violations of the leak-repair requirements of 40 C.F.R. § 82.156(i) and at least seventy-four violations of the recordkeeping requirements of 40 C.F.R. § 82.166(k), (m) at warehouses in thesefour states. The Company has responded to these allegations, is engaged in communications with theDepartment about these and additional allegations made by letter dated September 10, 2009, and hasentered into tolling agreements. Substantial penalties may be levied for violations of the Clean Air Act.The Company is cooperating with this inquiry.
On October 7, 2009, the District Attorneys for San Diego, San Joaquin and Solano Counties filed acomplaint, People of the State of California v. Costco Wholesale Corp., et al, No. 37-2009-00099912(Superior Court for the County of San Diego), alleging on information and belief that the Company hasviolated and continues to violate provisions of the California Health and Safety Code and the Businessand Professions Code through the use of certain spill clean-up materials at its gasoline stations. Reliefsought includes, among other things, requests for preliminary and permanent injunctive relief, civilpenalties, costs and attorneys’ fees. On September 2, 2010, the court dismissed the complaint withoutprejudice. An amended complaint was filed on September 13, 2010.
The Company has received notices from most states stating that they have appointed an agent toconduct an examination of the books and records of the Company to determine whether it hascomplied with state unclaimed property laws. In addition to seeking the turnover of unclaimed propertysubject to escheat laws, the states may seek interest, penalties, costs of examinations, and other relief.The State of Washington conducted such an examination on its own behalf and on February 4, 2011issued an assessment. The Company filed suit on March 4, 2011, to contest the assessment.
78
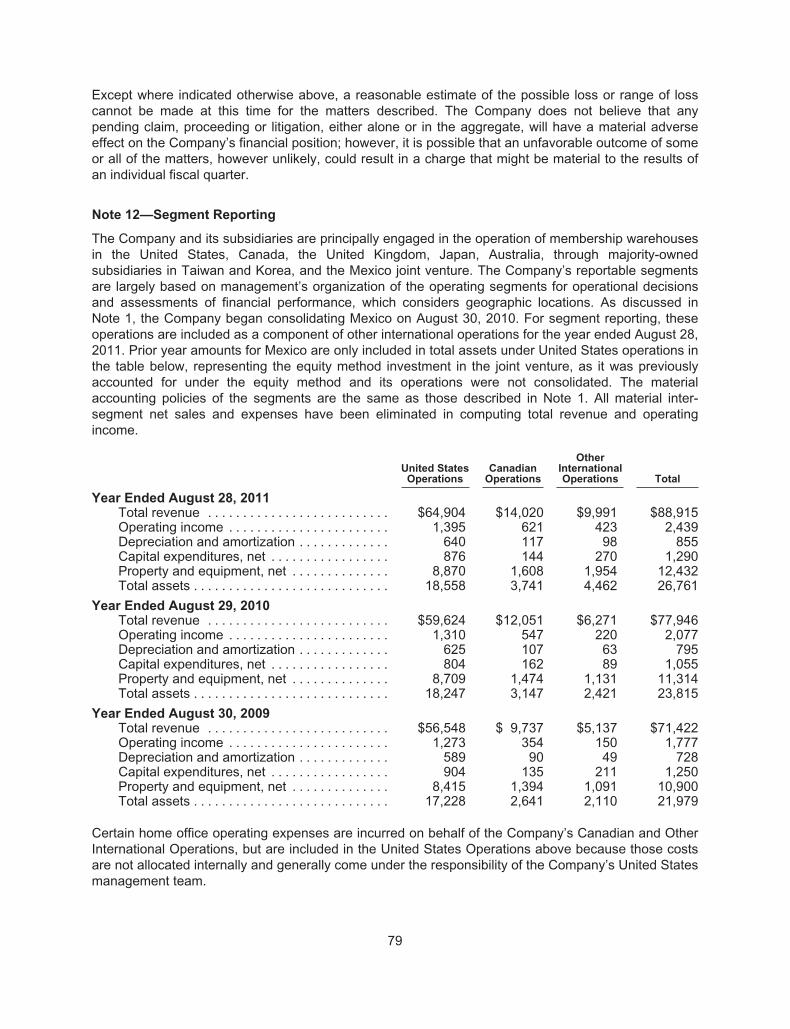
Except where indicated otherwise above, a reasonable estimate of the possible loss or range of losscannot be made at this time for the matters described. The Company does not believe that anypending claim, proceeding or litigation, either alone or in the aggregate, will have a material adverseeffect on the Company’s financial position; however, it is possible that an unfavorable outcome of someor all of the matters, however unlikely, could result in a charge that might be material to the results ofan individual fiscal quarter.
Note 12—Segment Reporting
The Company and its subsidiaries are principally engaged in the operation of membership warehousesin the United States, Canada, the United Kingdom, Japan, Australia, through majority-ownedsubsidiaries in Taiwan and Korea, and the Mexico joint venture. The Company’s reportable segmentsare largely based on management’s organization of the operating segments for operational decisionsand assessments of financial performance, which considers geographic locations. As discussed inNote 1, the Company began consolidating Mexico on August 30, 2010. For segment reporting, theseoperations are included as a component of other international operations for the year ended August 28,2011. Prior year amounts for Mexico are only included in total assets under United States operations inthe table below, representing the equity method investment in the joint venture, as it was previouslyaccounted for under the equity method and its operations were not consolidated. The materialaccounting policies of the segments are the same as those described in Note 1. All material inter-segment net sales and expenses have been eliminated in computing total revenue and operatingincome.
United StatesOperations
CanadianOperations
OtherInternationalOperations Total
Year Ended August 28, 2011Total revenue . . . . . . . . . . . . . . . . . . . . . . . . . . $64,904 $14,020 $9,991 $88,915Operating income . . . . . . . . . . . . . . . . . . . . . . . 1,395 621 423 2,439Depreciation and amortization . . . . . . . . . . . . . 640 117 98 855Capital expenditures, net . . . . . . . . . . . . . . . . . 876 144 270 1,290Property and equipment, net . . . . . . . . . . . . . . 8,870 1,608 1,954 12,432Total assets . . . . . . . . . . . . . . . . . . . . . . . . . . . . 18,558 3,741 4,462 26,761
Year Ended August 29, 2010Total revenue . . . . . . . . . . . . . . . . . . . . . . . . . . $59,624 $12,051 $6,271 $77,946Operating income . . . . . . . . . . . . . . . . . . . . . . . 1,310 547 220 2,077Depreciation and amortization . . . . . . . . . . . . . 625 107 63 795Capital expenditures, net . . . . . . . . . . . . . . . . . 804 162 89 1,055Property and equipment, net . . . . . . . . . . . . . . 8,709 1,474 1,131 11,314Total assets . . . . . . . . . . . . . . . . . . . . . . . . . . . . 18,247 3,147 2,421 23,815
Year Ended August 30, 2009Total revenue . . . . . . . . . . . . . . . . . . . . . . . . . . $56,548 $ 9,737 $5,137 $71,422Operating income . . . . . . . . . . . . . . . . . . . . . . . 1,273 354 150 1,777Depreciation and amortization . . . . . . . . . . . . . 589 90 49 728Capital expenditures, net . . . . . . . . . . . . . . . . . 904 135 211 1,250Property and equipment, net . . . . . . . . . . . . . . 8,415 1,394 1,091 10,900Total assets . . . . . . . . . . . . . . . . . . . . . . . . . . . . 17,228 2,641 2,110 21,979
Certain home office operating expenses are incurred on behalf of the Company’s Canadian and OtherInternational Operations, but are included in the United States Operations above because those costsare not allocated internally and generally come under the responsibility of the Company’s United Statesmanagement team.
79

Note 13—Quarterly Financial Data (Unaudited)
The two tables that follow reflect the unaudited quarterly results of operations for 2011 and 2010.
52 Weeks Ended August 28, 2011(1)
FirstQuarter
12 Weeks
SecondQuarter
12 Weeks
ThirdQuarter
12 Weeks
FourthQuarter
16 WeeksTotal 52Weeks
REVENUENet sales . . . . . . . . . . . . . . . . . . . . . . . . . . . . . $ 18,823 $ 20,449 $ 20,188 $ 27,588 $ 87,048Membership fees . . . . . . . . . . . . . . . . . . . . . . . 416 426 435 590 1,867
Total revenue . . . . . . . . . . . . . . . . . . . . . . 19,239 20,875 20,623 28,178 88,915OPERATING EXPENSES
Merchandise costs . . . . . . . . . . . . . . . . . . . . . 16,757 18,235(2) 18,067(2) 24,680(2) 77,739Selling, general and administrative . . . . . . . . 1,941 2,038 1,991 2,712 8,682Preopening expenses . . . . . . . . . . . . . . . . . . . 12 4 8 22 46Provision for impaired assets and closing
costs, net . . . . . . . . . . . . . . . . . . . . . . . . . . . 4 2 1 2 9
Operating income . . . . . . . . . . . . . . . . . . 525 596 556 762 2,439OTHER INCOME (EXPENSE)
Interest expense . . . . . . . . . . . . . . . . . . . . . . . (26) (27) (27) (36) (116)Interest income and other, net . . . . . . . . . . . . 5 4 5 46 60
INCOME BEFORE INCOME TAXES . . . . . . . . . . 504 573 534 772 2,383Provision for income taxes . . . . . . . . . . . . . . . 172 204 193 272 841
Net income including noncontrollinginterests . . . . . . . . . . . . . . . . . . . . . . . . . . . . 332 369 341 500 1,542
Net income attributable to noncontrollinginterests . . . . . . . . . . . . . . . . . . . . . . . . . . . . (20) (21) (17) (22) (80)
NET INCOME ATTRIBUTABLE TO COSTCO . . $ 312 $ 348 $ 324 $ 478 $ 1,462
NET INCOME PER COMMON SHAREATTRIBUTABLE TO COSTCO:
Basic . . . . . . . . . . . . . . . . . . . . . . . . . . . . . . . . . $ 0.72 $ 0.80 $ 0.74 $ 1.09 $ 3.35
Diluted . . . . . . . . . . . . . . . . . . . . . . . . . . . . . . . $ 0.71 $ 0.79 $ 0.73 $ 1.08 $ 3.30
Shares used in calculation (000’s)Basic . . . . . . . . . . . . . . . . . . . . . . . . . . . . . . . . . 434,099 436,682 436,977 436,596 436,119Diluted . . . . . . . . . . . . . . . . . . . . . . . . . . . . . . . 441,360 443,186 443,570 443,518 443,094
Dividends per share . . . . . . . . . . . . . . . . . . . . . . . . $ 0.205 $ 0.205 $ 0.240 $ 0.240 $ 0.89
(1) As discussed in Note 1, the Company began consolidating Mexico on August 30, 2010.
(2) Includes a $6, $49, and $32 increase to merchandise costs for a LIFO inventory adjustment for the second, third andfourth quarters, respectively. (See note 1—Merchandise Inventories).
80

52 Weeks Ended August 29, 2010
FirstQuarter
12 Weeks
SecondQuarter
12 Weeks
ThirdQuarter
12 Weeks
FourthQuarter
16 WeeksTotal 52Weeks
REVENUENet sales . . . . . . . . . . . . . . . . . . . . . . . . . . . . . $ 16,922 $ 18,356 $ 17,385 $ 23,592 $ 76,255Membership fees . . . . . . . . . . . . . . . . . . . . . . . 377 386 395 533 1,691
Total revenue . . . . . . . . . . . . . . . . . . . . . . 17,299 18,742 17,780 24,125 77,946OPERATING EXPENSES
Merchandise costs . . . . . . . . . . . . . . . . . . . . . 15,081 16,396 15,494 21,024 67,995Selling, general and administrative . . . . . . . . 1,777 1,873(3) 1,789 2,401 7,840Preopening expenses . . . . . . . . . . . . . . . . . . . 11 3 3 9 26Provision for impaired assets and closing
costs, net . . . . . . . . . . . . . . . . . . . . . . . . . . . 2 0 3 3 8
Operating income . . . . . . . . . . . . . . . . . . 428 470 491 688 2,077OTHER INCOME (EXPENSE)
Interest expense . . . . . . . . . . . . . . . . . . . . . . . (24) (26) (27) (34) (111)Interest income and other, net . . . . . . . . . . . . 18 30 10 30 88
INCOME BEFORE INCOME TAXES . . . . . . . . . . 422 474 474 684 2,054Provision for income taxes . . . . . . . . . . . . . . . 152 169 163 247 731
Net income including noncontrollinginterests . . . . . . . . . . . . . . . . . . . . . . . . . . . . 270 305 311 437 1,323
Net income attributable to noncontrollinginterests . . . . . . . . . . . . . . . . . . . . . . . . . . . . (4) (6) (5) (5) (20)
NET INCOME ATTRIBUTABLE TO COSTCO . . $ 266 $ 299 $ 306 $ 432 $ 1,303
NET INCOME PER COMMON SHAREATTRIBUTABLE TO COSTCO:
Basic . . . . . . . . . . . . . . . . . . . . . . . . . . . . . . . . . $ 0.61 $ 0.68 $ 0.69 $ 0.99 $ 2.97
Diluted . . . . . . . . . . . . . . . . . . . . . . . . . . . . . . . $ 0.60 $ 0.67 $ 0.68 $ 0.97 $ 2.92
Shares used in calculation (000’s)Basic . . . . . . . . . . . . . . . . . . . . . . . . . . . . . . . . . 437,173 439,786 440,973 437,071 438,611Diluted . . . . . . . . . . . . . . . . . . . . . . . . . . . . . . . 444,849 446,918 448,391 444,289 445,970
Dividends per share . . . . . . . . . . . . . . . . . . . . . . . . $ 0.180 $ 0.180 $ 0.205 $ 0.205 $ 0.77
(3) Includes a $22 charge related to a change in employee benefits whereby certain unused time off will now be paidannually to our employees.
Note 14—Subsequent Event
On October 5, 2011, the Company’s Japanese subsidiary entered into an agreement to issuepromissory notes through a private placement, bearing interest at 1.18%. These yen denominatednotes are being issued in two series, with separate funding dates: $79 on October 5, 2011 and $52 onDecember 20, 2011. For both series of notes, interest is payable semi-annually, and principal is due onOctober 5, 2018. The Company guarantees all financing instruments issued by its Japanesesubsidiary.
81

DIRECTORS AND OFFICERS
BOARD OF DIRECTORS
Jeffrey H. BrotmanChairman of the Board, Costco
Dr. Benjamin S. Carson, Sr., M.D.(b)*
Professor and Director of Pediatric Neurosurgery,Johns Hopkins Medicine
Susan L. Decker(a)
Former President of Yahoo! Inc.Daniel J. Evans(a)(c)
Chairman, Daniel J. Evans Associates; Former U.S.Senator and Governor of the State of Washington
Richard A. GalantiExecutive Vice President and Chief FinancialOfficer, Costco
William H. Gates(c)*
Co-Chair of the Bill and Melinda Gates FoundationHamilton E. James
President and Chief Operating Officer,The Blackstone Group
W. Craig JelinekPresident and Chief Operating Officer, Costco
Richard M. LibensonA Founder, former Director and Executive Officer ofThe Price Company
John W. MeisenbachPresident of MCM, A Meisenbach Company
Charles T. Munger(a)*(b)
Vice Chairman of the Board of Berkshire Hathaway, Inc.;Chairman of the Board of Daily Journal Corporation
Jeffrey S. RaikesCEO of the Bill and Melinda Gates Foundation
Jill S. Ruckelshaus(b)(c)
Director, various non-profit organizationsJames D. Sinegal
Chief Executive Officer, Costco
Board Committees(a) Audit Committee(b) Compensation Committee(c) Nominating and Governance Committee* 2011 Committee Chair
EXECUTIVE AND SENIOR OFFICERS
Joel BenolielSenior Vice President, Administration & ChiefLegal Officer
Andree BrienSenior Vice President, National Merchandising –Canadian Division
Jeffrey H. BrotmanChairman of the Board
Donald E. BurdickSenior Vice President, Special Projects
Charles V. BurnettSenior Vice President, Pharmacy
Roger A. CampbellSenior Vice President, General Manager – SoutheastRegion
Richard C. ChavezSenior Vice President, Costco Wholesale Industries &Business Development
Victor A. CurtisSenior Vice President, Pharmacy
John B. GahertySenior Vice President, General Manager – MidwestRegion
Richard A. GalantiExecutive Vice President, Chief Financial Officer
Jaime GonzalezSenior Vice President, General Manager – Mexico
Bruce GreenwoodSenior Vice President, General Manager – Los AngelesRegion
Robert D. HicokSenior Vice President, General Manager – San DiegoRegion
Dennis A. HooverSenior Vice President, General Manager – Bay AreaRegion
W. Craig JelinekPresident and Chief Operating Officer
Dennis E. KnappSenior Vice President, Merchandising – Non-Foods
Franz E. LazarusSenior Vice President, Administration – Global Operations
Jeffrey R. LongSenior Vice President, General Manager – NortheastRegion
Jeffrey LyonsSenior Vice President, Merchandising – Fresh Foods
John MatthewsSenior Vice President, Human Resources & RiskManagement
John D. McKayExecutive Vice President, COO – Northern Division
Russell D. MillerSenior Vice President, General Manager – WesternCanada Region
Ali MoayeriSenior Vice President, Construction
Paul G. MoultonExecutive Vice President, Chief Information Officer
James P. MurphyExecutive Vice President, International
David S. PettersonSenior Vice President, Corporate Controller
Joseph P. PorteraExecutive Vice President, COO – Eastern & CanadianDivisions and Chief Diversity Officer
Pierre RielSenior Vice President, General Manager – EasternCanada Region
Ginnie RoeglinSenior Vice President, Ecommerce & Publishing
Timothy L. RoseSenior Vice President, Merchandising – Foods & Sundries
Douglas W. SchuttExecutive Vice President – Merchandising
James D. SinegalChief Executive Officer
John D. ThelanSenior Vice President, Operations – Depots
Ron M. VachrisSenior Vice President, General Manager – NorthwestRegion
Thomas K. WalkerExecutive Vice President, Construction & Distribution
Louise WendlingSenior Vice President, Country Manager – Canada
Dennis R. ZookExecutive Vice President, COO – Southwest Division& Mexico
82
VICE PRESIDENTS
Jeffrey AbadirOperations – Bay Area Region
Sandi A. BabinsGMM – Foods & Sundries – WesternCanada Region
Bryan BlankOperations – San Diego Region
Christopher BolvesOperations – Northwest Region
Alan BubitzGMM – Bakery, Service Deli and FoodCourt
Deborah CainGMM – Foods – Northwest Region
Deborah CalhounGMM – Foods – San Diego Region
Patrick CallansCorporate Purchasing and BusinessCenters
Mike CasebierOperations – San Diego Region
Richard ChangCountry Manager – Taiwan
Jeffrey M. ColeGasoline, Car Wash & 1-Hour Photo
Julie L. CruzOperations – Southeast Region
Wendy DavisOperations – Midwest Region
Richard DelieGMM – Corporate Non-Foods
Gerard J. DempseyOperations – Southeast Region
Preston C. DraperCountry Manager – Korea
John T. EaganGMM – Foods – Los Angeles Region
Frank FarconeOperations – Los Angeles Region
Timothy K. FarmerGMM – Corporate Non-Foods
Christopher E. FlemingOperations – Western Canada Region
Murray FlemingGMM – Hardlines – Canadian Division
Jack S. FrankReal Estate Development – West
Gary GiacomiGMM – Non-Foods – Northwest Region
Lorelle GilpinMarketing – Canadian Division
Cynthia GlaserGMM – Corporate Non-Foods
Joseph Grachek IIIMerchandise Accounting Controller
Darby GreekOperations – Bay Area Region
Nancy GrieseGMM – Corporate Foods
Isaac HamaouiGMM – Hardlines – Canadian Division
William HansonGMM – Foods – Midwest Region
Doris E. HarleyGMM – Foods – Southeast Region
David HarruffOperations – Northwest Region
Timothy HaserInformation Systems
James HayesOperations – Northwest Region
Daniel M. HinesFinancial Accounting Controller
Mitzi HuGMM – Imports
Ross HuntHuman Resources, Finance & IS –Canadian Division
Jeff IshidaReal Estate – Eastern Division
Arthur D. Jackson, Jr.Administration & Community Giving
Harold E. KaplanCorporate Treasurer
James KlauerGMM – Corporate Non-Foods
Gary KotzenGMM – Corporate Foods
Paul LathamMembership, Marketing, Services &Costco Travel
Robert LeuckOperations – Northeast Region
Gerry LibenGMM – Ancillaries – Canadian Division
Phil LindBusiness Centers
Steve MantanonaGMM – Merchandising – Mexico
Tracy Mauldin-AveryGMM – Foods – Bay Area Region
Mark MaushundOperations – Los Angeles Region
Susan McConnahaOperations – Bakery & Food Court
David MessnerReal Estate Development
John MinolaCorporate Counsel
Sarah MogkOperations – Depots
Robert E. NelsonFinancial Planning & Investor Relations
Pietro NenciGMM – Corporate Foods – CanadianDivision
Court NewberryEcommerce Merchandising
Patrick J. NooneCountry Manager – Australia
Richard J. OlinLegal, General Counsel
Mario OmossOperations – San Diego Region
Frank PadillaGMM – Corporate Produce & Fresh Meat
Stephen M. PappasCountry Manager – United Kingdom
Shawn ParksOperations – Los Angeles Region
Michael ParrottGMM – Corporate Non-Foods
Michael PollardEcommerce Operations
Steven D. PowersOperations – Southeast Region
Paul PulverOperations – Northeast Region
Aldyn J. RoyesOperations – Southeast Region
Yoram RubanenkoOperations – Northeast Region
James RutherfordInformation Systems
Drew SakumaOperations – Bay Area Region
Janet ShanksGMM – Fresh Foods – CanadianDivision
Louie SilveiraOperations – Midwest Region
Michael J. SinegalCountry Manager – Europe
David SkinnerOperations – Eastern Canada Region
James StaffordGMM – Foods – Northeast Region
Richard StephensOperations – Pharmacy
Kimberley L. SuchomelGMM – International
John SullivanAssociate General Counsel & ChiefCompliance Officer
Gary SwindellsOperations – Eastern Canada Region
Mauricio TalayeroChief Financial Officer – Mexico
Ken J. TheriaultCountry Manager – Japan
Keith H. ThompsonConstruction
Adrian ThummlerOperations – Mexico
Diane TucciOperations – Eastern Canada Region
Scott TylerOperations – Western Canada Region
Azmina ViraniGMM – Non-Foods – Canadian Division
Richard WebbOperations – Texas Region
Jack WeisblyGMM – Corporate Non-Foods
Shannon WestGMM – Corporate Non-Foods
Rich WilcoxOperations – Northeast Region
Craig WilsonFood Safety & Quality Assurance
Charlie A. WintersOperations – Fresh Meat, Produce &Service Deli
83

ADDITIONAL INFORMATION
A copy of Costco’s annual report to the Securities and Exchange Commission on Form10-K andquarterly reports on Form 10-Q will be provided to any shareholder upon written request directed toInvestor Relations, Costco Wholesale Corporation, 999 Lake Drive, Issaquah, Washington 98027.Internet users can access recent sales and earnings releases, the annual report and SEC filings, aswell as our Costco Online web site, at http://www.costco.com. E-mail users may direct their investorrelations questions to [email protected]. All of the Company’s filings with the SEC may be obtainedat the SEC’s Public Reference Room at Room 1580, 100 F Street NE, Washington, DC 20549. Forinformation regarding the operation of the SEC’s Public Reference Room, please contact the SEC at1-800-SEC-0330. Additionally, the SEC maintains an internet site that contains reports, proxy andinformation statements and other information regarding issuers that file electronically with the SEC atwww.sec.gov.
Corporate Office
999 Lake DriveIssaquah, WA 98027
(425) 313-8100
Division Offices
Northern DivisionNorthwest Region1045 Lake DriveIssaquah, WA 98027
Bay Area Region2820 Independence DriveLivermore, CA 94551
Midwest Region1901 West 22nd Street, 2nd FloorOak Brook, IL 60523
Southwest DivisionLos Angeles Region11000 Garden Grove, #201Garden Grove, CA 92843
San Diego Region4649 Morena Blvd.San Diego, CA 92117
Texas Region
1701 Dallas Parkway, Suite 201Plano, TX 75093
Eastern DivisionNortheast Region45940 Horseshoe Drive, Suite 150Sterling, VA 20166
Southeast Region3980 Venture Drive NW, #W100Duluth, GA 30096
Canadian DivisionEastern Region415 Hunt Club Road WestOttawa, ON K2E 1C5
Western Region4500 Still Creek DriveBurnaby, BC V5C 0E5
International DivisionUnited Kingdom Region213 Hartspring LaneWatford, EnglandWD25 8JS
Japan Region3-1-4 Ikegami-ShinchoKawasaki-ku Kawasaki-shiKanagawa, 210-0832 Japan
Korea Region65, 3-ga Yangpyung-dongYoungdeungpo-guSeoul, Korea 150-963
Taiwan Region255 Min Shan StreetNeihu, Taipei, Taiwan 114
Australia RegionGround Floor17-21 Parramatta Rd.Lidcombe, NSW, 2141
Mexico RegionBoulevard Magnocentro #4Col. San FernandoLa Herradura 52765Huixquilucan, Mexico
Annual MeetingThursday, January 26, 2012 at 4:00 PMMeydenbauer Center11100 NE 6th StreetBellevue, Washington 98004
Independent Public AccountantsKPMG LLP801 Second Avenue, Suite 900Seattle, WA 98104
Transfer AgentBNY Mellon Shareowner ServicesCostco Shareholder RelationsP. O. Box 358015Pittsburgh, PA 15252-8015Telephone: (800) 249-8982TDD for Hearing Impaired: (800) 231-5469Outside U.S.: (201) 680-6578Website: www.bnymellon.com/shareowner/equityaccess
Stock Exchange ListingThe NASDAQ Global Select MarketStock Symbol: COST
84
