annual report 2017 - vostoknewventures.com · kpi key performance indicator mena middle east and...
TRANSCRIPT


GLOSSARY
of terms and acronyms used in the annual report
AGM Annual General Meeting
AI Artificial Intelligence
ARPU Average Revenue Per User
bln Billion
CBR The Central Bank of the Russian Federation
CIS Commonwealth of Independent States (former Soviet Union)
CRM Customer Relationship Management
E Estimate
EBITDA Earnings Before Interest, Taxes, Depreciation and Amortization
EV Enterprise Value, i.e. stock exchange value + net liability
EUR Euro
FX Foreign exchange rate
GDP Gross Domestic Product
IPO Initial Public Offering
IRR Internal Rate of Return
k Thousand
KPI Key Performance Indicator
MENA Middle East and North Africa
MICEX One of the leading Russian stock exchanges
mln Million
MSCI MSCI Inc., an independent provider of research-driven insights and tools for institutional investors
n/a Not applicable
NAV Net Asset Value
OTA Online Travel Agency
pa Per annum
RTS Russian Trading System, the leading trading place for Russian shares
RUB Russian Rubles
SDR Swedish Depository Receipt
SEK Swedish Kronor
UAE United Arab Emirates
UMV Unique Monthly Visitor
USD United States Dollars
Y-o-Y Year-on-Year
FINANCIAL CALENDAR 2018
Interim report for the first three months May 15, 2018
General meeting of shareholders 2018 May 16, 2018
Interim report for the first six months August 15, 2018
Interim report for the first nine months November 14, 2018
Financial accounts bulletin February 13, 2019
Annual report 2018 March/April 2019

��03��
Annual Report 2017
ContentsManaging Director’s introduction . . . . . . . . . . . . . . . . . . . . . . . . . . .04Avito Study . . . . . . . . . . . . . . . . . . . . . . . . . . . . . . . . . . . . . . . . . . . . .07Interview with Brant Rubin . . . . . . . . . . . . . . . . . . . . . . . . . . . . . . . .13Investment portfolio . . . . . . . . . . . . . . . . . . . . . . . . . . . . . . . . . . . . . .16
Avito . . . . . . . . . . . . . . . . . . . . . . . . . . . . . . . . . . . . . . . . . . . . . . . . . . . 21BlaBlaCar . . . . . . . . . . . . . . . . . . . . . . . . . . . . . . . . . . . . . . . . . . . . . . . 23Gett . . . . . . . . . . . . . . . . . . . . . . . . . . . . . . . . . . . . . . . . . . . . . . . . . . . . 25Propertyfinder . . . . . . . . . . . . . . . . . . . . . . . . . . . . . . . . . . . . . . . . . . 26babylon . . . . . . . . . . . . . . . . . . . . . . . . . . . . . . . . . . . . . . . . . . . . . . . . 27OneTwoTrip . . . . . . . . . . . . . . . . . . . . . . . . . . . . . . . . . . . . . . . . . . . . 28Wallapop . . . . . . . . . . . . . . . . . . . . . . . . . . . . . . . . . . . . . . . . . . . . . . . 29Hemnet . . . . . . . . . . . . . . . . . . . . . . . . . . . . . . . . . . . . . . . . . . . . . . . . 30Merro . . . . . . . . . . . . . . . . . . . . . . . . . . . . . . . . . . . . . . . . . . . . . . . . . . 31Naseeb Networks . . . . . . . . . . . . . . . . . . . . . . . . . . . . . . . . . . . . . . . . 32CarZar . . . . . . . . . . . . . . . . . . . . . . . . . . . . . . . . . . . . . . . . . . . . . . . . . 33El Basharsoft . . . . . . . . . . . . . . . . . . . . . . . . . . . . . . . . . . . . . . . . . . . . 34Vezeeta . . . . . . . . . . . . . . . . . . . . . . . . . . . . . . . . . . . . . . . . . . . . . . . . . 35Agente Imóvel . . . . . . . . . . . . . . . . . . . . . . . . . . . . . . . . . . . . . . . . . . . 36KEH AB . . . . . . . . . . . . . . . . . . . . . . . . . . . . . . . . . . . . . . . . . . . . . . . . 37Debt investments . . . . . . . . . . . . . . . . . . . . . . . . . . . . . . . . . . . . . . . . 37
Corporate Governance Report . . . . . . . . . . . . . . . . . . . . . . . . . . . . . .38Company information . . . . . . . . . . . . . . . . . . . . . . . . . . . . . . . . . . . . .46The Vostok New Ventures share . . . . . . . . . . . . . . . . . . . . . . . . . . . .48Financial summary . . . . . . . . . . . . . . . . . . . . . . . . . . . . . . . . . . . . . . .50Board, management and auditors . . . . . . . . . . . . . . . . . . . . . . . . . . .52Administration report . . . . . . . . . . . . . . . . . . . . . . . . . . . . . . . . . . . .54Income statements – Group . . . . . . . . . . . . . . . . . . . . . . . . . . . . . . . .57Balance sheets – Group . . . . . . . . . . . . . . . . . . . . . . . . . . . . . . . . . . .58Statement of Changes in Equity – Group . . . . . . . . . . . . . . . . . . . . .59Cash flow statements – Group . . . . . . . . . . . . . . . . . . . . . . . . . . . . . .60Alternative Performance Measures – Group . . . . . . . . . . . . . . . . . .61Income statement – Parent . . . . . . . . . . . . . . . . . . . . . . . . . . . . . . . .62Balance sheet – Parent . . . . . . . . . . . . . . . . . . . . . . . . . . . . . . . . . . . .63Statement of Changes in Equity – Parent . . . . . . . . . . . . . . . . . . . . .64Cash flow statement – Parent . . . . . . . . . . . . . . . . . . . . . . . . . . . . . .65Notes to the financial statements . . . . . . . . . . . . . . . . . . . . . . . . . . .66Declaration . . . . . . . . . . . . . . . . . . . . . . . . . . . . . . . . . . . . . . . . . . . . .83Independent Auditor’s Report . . . . . . . . . . . . . . . . . . . . . . . . . . . . . .84
Cor
pora
te G
over
nanc
eIn
trod
ucti
on
Fina
ncia
l Inf
orm
atio
nIn
vest
men
t Por
tfol
io

��04����04��
Managing Director’s introduction
2017 was an inspiring year. Our largest holding con-tinued to grow revenues, grow earnings even faster and turn earnings into cash dividends to its sharehold-ers. The analogy with Rightmove in 2007 that we have touched upon before still holds very well. Rightmove tri-pled revenues during the 10 years following 2007 whilst maintaining world class margins. We believe Avito is on the same route, possibly even at a faster rate.
We have seen network effects continue to be built in our other large holdings, most notably BlaBlaCar. We are full of confidence, knowing that earnings and cash flow must always come after building a leading position in liquidity. Building liquidity takes time, but when critical mass has been attained then barriers to entry are high. Stable high cash margins follow. We clearly see liquid-ity continuing to be built, with BlaBlaCar now having 60 million members and 18 million travelers per quar-ter compared to the 20 million members and 10 million travelers per quarter when we first invested back in 2015.
We are very happy to have invested into another com-pany within the health sector, babylon. The health indus-try is one of the last sectors to be properly disrupted by digital. Due to the size, complexity of the space and also the presence of regulations which differ from market to market, visibility into the end status post digital dis-ruption is low, in turn hiking the risk premium associ-ated with investments into the changes. This situation creates the potential for very high returns. Apart from focusing on the areas which have the potential to benefit from network effects, I believe our persistent emphasis on backing strong entrepreneurs is especially important here. A strong entrepreneur will be able to navigate the shifts at sea to successfully steer his or her ship to that unknown promised land of a digital, mobile, efficient, affordable and available best-in-class health sector.
In addition to babylon (our largest investment during 2017) we initiated exposure to a couple of very excit-ing young companies. Agente Imóvel aims to become the Zillow of Brazil, while CarZar aims to disrupt the second-hand car market of South Africa with an Auto1- inspired model. These investments are small in relation to Avito of course, but it is important to remember that Avito started as a EUR 4 mln investment once upon a time. Small things can grow!
During the year, we also exited the Delivery Hero debt investment in connection with the company’s IPO
in summer 2017. Delivery Hero was a successful invest-ment for us, generating 22% IRR through coupon pay-ments and equity compensation. We still hold a small number of shares in Delivery Hero as per year-end that were under lock-up following the IPO until late Decem-ber 2017.
We continue to search for opportunities in young companies with strong entrepreneurs that have the potential to assume characteristics of natural monopo-lies through network effects. We also focus on compa-nies that operate in large addressable markets all-in pro-viding us with sizeable upside on our risk taking. Taking on exposure to companies with investable risk-reward is what Vostok New Ventures is all about. Ever since our inception in 1996 we have aimed to take on risk if the potential reward compensates well for this. Our struc-ture of permanent capital allows us to take a long-term view which is helpful, especially in our investment niche of building essentially liquid markets which is an ende-vour which requires patience but which in turn builds very high and sustainable value.
Typically, our main risk exposure does not come from the business model. The common denominator amongst all our portfolio companies are that they have the poten-tial to assume characteristics of a natural monopoly through network effects – high barriers to entry in turn providing high and sustainable margins.
We do however have the ability to invest into com-panies at an early stage, which naturally brings a higher level of risk than when you enter at a mature stage. This higher risk is compensated for by the fact that compa-nies that have yet to prove themselves get priced at a lower valuation than when they have generated visibility on potential future cash flows. To mitigate the risk with investing at a young stage we try to make sure that the founders are entrepreneurs with the right capacities to manage the often long road of building a successful com-pany. There is no definitive checklist of what it takes in a person but hard-working, visionary, adaptable, humble, stubborn, experienced, lucky… come to mind. We have met many over the years and have developed some sense of whom to back and whom not to back.
Our traditional geographical hunting ground is emerging markets, even though we have of late also started investing in companies which are starting out in developed markets.
Introduction

��05����05��
A large part of our portfolio is subject to emerging markets. In fact, having worked in emerging markets since 1995 one could argue that operating in these geog-raphies is a core to us, perhaps even a competitive advan-tage. Even so, the individual emerging markets differ a lot from each other and there is no uniform rulebook. However, there are common characteristics, and I think one can say that we have developed some kind of a do and do not sense over the years.
One common denominator amongst these various countries collectively called emerging markets are that they are less mature in terms of the institutions of a developed country that help build trust. I note that whilst populist forces are on the march across most developed markets today, the institutions of trust become even more important. The judiciary, the right to vote, an inde-pendent central bank, accountability of politicians, etc etc. These are on the whole less developed in emerging markets, leading to less trust. This is especially evident in times of external shocks, when absence of trust leads to higher macro volatility. One of the better examples of this is the impact of a fall in the oil price on the Rus-sian economy. I would argue that Russia is continuously improving, maybe not at the pace that political observers and commentators would like it to, but still improving. It will be interesting to witness what the aftermath of the current election period will bring in terms of reforms.
However, the point is that the areas in which we are active are subject to higher macro volatility than developed markets. It therefore becomes even more important that other forces are clearly moving in the right direction. On the macro front we want be exposed to a large middle class being formed or continuously growing stronger and larger. If this keeps on happening then we can take that macro volatility. The Egyptian
pound devalued by half during the course of last year. If all other factors were constant then the vaue of our Egyptian holdings would in USD terms have decreased by 50%. Thankfully, our Egyptian investments are developing well and hence have been able to recoup a lot of the value that the high macro volatility of a deval-uation caused. Part of the reason that they are doing well is that there is a growing middle class giving rise to a growing demand for the services that our portfolio companies in Egypt provide.
We feel we have a good capacity to analyse and deal with these types of risk and aim to deliver value to our shareholders by selectively taking on exposure to them where the potential reward is high!
AvitoWe have per the end of the year refined our valuation model for Avito to capture the “Rightmove-à-la-2007” mode that the company is now in and to better reflect the company’s earnings growth. This mode entails rev-enue growth in the range of 25–35% but at consistently high margins, in turn providing earnings growth at the higher end of the global benchmarks. At the end of the day, what matters for valuations are earnings, and our new mark on Avito captures this. Our new mark for Avito is USD 4.5 bn, compared to USD 3.4 bn at the end of 2016.
The graph above shows the relationship between the EV/EBITDA multiple and earnings growth for a large set of listed online classifieds peers. Earnings growth of some 22–26% corresponds to an EV/EBITDA multiple of around 20–22x.
Avito continues to convert their earnings into div-idends for shareholders. During 2015 we received USD 30.57 mln in dividends and for the calendar year of 2017 we received a total of USD 8.2 mln in dividends (of which
EV/EBITDA 2018E vs. EBITDA CAGR 2018E–2020E30x 30x
25x 25x
20x 20x
15x 15x
10x 10x
5x 5x
0x 0x
0% 5% 10% 15% 20% 25% 30% 35%
Rightmove REA Group
Schibsted
58.com
Zillow
AutohomeAutotrader
Zoopla
Carsales
Scout24SEEK
Trade meeBay
Axel Springer
Avito
Introduction

��06����06��
USD 6.8 mln was accounted for as a receivable on our balance sheet already at year-end 2016). In January 2018 we received an additional USD 10.2 mln in dividends.
In terms of absolute sums, USD 4.5 bn for Avito is not an aggressive number. We believe this company is en route to making USD 300 mln in EBITDA some years out, which results in an undemanding multiple of 15x, whilst emerging markets peers such as MercadoLibre and Info Edge (not included in the graph on page 5 as they would skew the trendline substantially) are trading at 20x+ on earnings three years out. Also, as a useful sanity check, Australia’s online classifieds sector (incorporated in sev-eral different companies) is currently valued at some USD 13 bn combined.
Going forward, we will report Avito’s financial per-formance on a bi-annual basis to align our reporting with Avito’s majority shareholder Naspers. On a quarter-ly basis, we will continue to report a selection of opera-tional KPIs so that you will be able to continue to follow Avito’s development.
20182018 has started in an interesting fashion, including some volatility in markets. We very much look forward to the rest of it. At the beginning of 2018 we have made several new investments and we are currently evaluating some other new investments but, as always, comparing them to the risk-reward profile of our existing portfolio and the opportunity of our own stock.
Per BriliothManaging Director
Introduction

��07����07��
Avito Study
Introduction
Below is part one and two of an on-going deep dive into Avito originally included in the reports for the third and fourth quarter 2017. Part 3, which will focus on another of Avito’s key verticals will be included in the report for the first quarter 2018.
Avito study – a collection of verticals (originally published in the report for the third quarter 2017)BackgroundClassified companies are often divided into verticals (Rightmove, Autotrader, Zillow, REA Group, etc) or hor-izontals (Blocket, Leboncoin, OLX).
Verticals have the benefit of a more specialized offer-ing and a more clearly defined market positioning, which often make them the go to resources for anyone who wants to sell something of value in that specific vertical. Furthermore, market-leading verticals become “must haves” for professional sellers and therefore have sub-stantial pricing power. However, they have limited touch points with consumers. Horizontals, on the other hand, have a much higher stickiness with consumers. In the mobile age, they often get a piece of the very valuable real estate on consumers’ smartphones. In market after market, we have seen horizontals expanding their traffic market share at the expense of verticals. However, due to a too generic product, limited sales efforts and lack of a strong vertical positioning, they have historically not had the pricing power of verticals. They have also been seen as more vulnerable to disruptors (e.g., Facebook Marketplace) and to pressure on advertising revenues.
In the vertical vs. horizontal taxonomy, Avito is cur-rently considered a horizontal. However, thanks to Avito’s deliberate verticalization strategy during the past 5 years, it also makes sense from an investor’s perspective to ana-lyze and evaluate Avito’s long-term potential as a collec-tion of verticals. In this study, we will provide our analysis supporting this view and also present our way of thinking of the potential future value of Avito if considered as a col-lection of verticals. In subsequent Vostok New Ventures reports, we will dive deeper into each of the verticals.
What are the key differences between a vertical and a horizontal? In table 1, we have done an overview of what we believe distinguishes verticals from horizontals in a number of key areas.
Where does Avito stand?In each of these key areas, we think Avito is becoming more similar to the vertical classifieds players (table 2).
Still, Avito gets considerable horizontal synergiesStill, Avito does get a lot of synergies through making common solutions and collaborating across verticals where it makes sense.
By working across verticals, Avito gets economies of scale versus purely vertical competitors. The economies of scale translate into lower costs than vertical competi-tors, which means higher margins which, everything else equal, warrants a higher valuation.
In addition to the above, Avito also has a consider-able advantage by being a single entry point. As more and more traffic moves to mobile devices, the real estate on consumers screens becomes more and more valuable. Having a single entry point to a number of verticals is a great advantage here – consumers often simply do not bother to download multiple vertical offerings but tend to use one horizontal marketplace. This is reflected in the higher share of mobile traffic of horizontals compared to verticals, which can be seen in multiple markets.
Implications for how investors will look at Avito’s future valuation potentialWe believe there are three concrete implications for Avi-to’s long-term potential when looking at Avito as a col-lection of verticals rather than a horizontal.
1. Higher pricing power to drive top line growthBy comparing Avito to other horizontals, we believe investors are underestimating the future earnings power of Avito given their current positioning in each of the verticals. The future earnings power of Avito is better estimated by benchmarking each vertical independently to vertical leaders in other market. Avito has moved away from selling “pay as you go” products to moving profes-sional clients to recurring subscriptions, very much in line with the leading vertical players internationally.
2. Lower risk of disruption reduces discount rate and warrants higher multiples
Investors tend to view horizontals as more vulnerable for disruption than verticals, and this is probably rea-sonable. But given Avito’s strong positioning in the ver-

��08����08��
Introduction
ticals and given the high share of revenues coming from professional users in high ticket categories (a segment where social networks have historically been very weak), the risk of disruption in Avito’s case is lower than for hor-izontal players.
Another risk factor has been pressure on advertising revenues as giants such as Facebook and Google take a larger and larger share of advertisers’ revenues. Avito currently has a very low dependence on third party advertising revenues and we believe that future revenue growth will mainly come from other sources.
Table 2: Where does Avito stand?
Product portfolio
• Increasingly tailored products to suit needs of each vertical. Products packaged into subscriptions that are sold on a recurring basis with high uptake among professional users
• Launched completely new vertical offerings in e.g. real estate (Domofond) and auto (Autoteka) to take advantage of market opportunities
• Custom made vertical products on the core Avito platform, e.g. CV database in Jobs• Custom made software solutions for professional users (ActiAgent for real estate agents,
ActiDealer for auto dealers, moving into other verticals as well with similar offerings)
Organization and sales
• Heads of each vertical,• Vertical unit in product and development team to solve vertical specific pain points• Large, dedicated vertical commercial/sales teams with sales reps who have built long
relationships for many years with key clients to build retention, step by step expanding ARPU (Average Revenue Per User) as product offering grows
Market positioning
• Top of mind in all categories• Not just seen as a “flea market” but Avito Auto, Avito Jobs, etc., each have high awareness in
their respective category. Market leader in each of the verticals.
Table 1: What are the key differences between a vertical and a horizontal?
Vertical Horizontal
Product and monetization
• Dedicated for the vertical needs of both professional users and consumers
• Recurring subscription revenues from professional users
• “One size fits all” across categories• “Pay as you go” monetization products
Organization and sales
• Organization set up to serve the needs of the users in the vertical
• Large sales forces building relations with professional users, high share of total revenues from professionals
• Organization set up to serve the needs of the “lowest common denominator” across verticals
• Large share of self service sales, i.e. customers buying services directly online, large share of revenues from private users
Market positioning
• The go to place when you want to sell or buy something of value
• Top of mind in the vertical, highest share of leads
• “Flea market”, mainly for used goods, low ticket items
• Number two after vertical specialist, complementary marketplace for lower end items

��09����09��
Introduction
3. Synergies between verticals to deliver best in class margins
Avito has a cost advantage over vertical players due to fact that they can develop common solutions where it makes sense. Furthermore, advertising efforts also have scale effects since advertising for one vertical Avito brand often spills over to others. Lastly, Avito operates in a very large market and has already reached significant scale. We believe that Avito will be able to reach best in class margins of at least 70%.
Top down long-term valuation potential of Avito using international benchmarksGiven Avito’s market position as the clear number one in the key verticals and their verticalized approach, we don’t see any reasons for why Avito shouldn’t be able to mone-tize in line with leading international vertical peers over time and therefore attract a similar market cap, adjusted to the transaction values in the verticals in Russia.
Table 3: Top down long term valuation of Avito using international benchmarks
Vertical Peer Market size ratio
compared to Russia
Implied market cap (USD bln)
Explanation of market size ratio (i.e. how the size of the peer’s market relates to the Russian market)
Auto Auto Trader (UK) 2.9 Approximately same number of used cars sold per year. Price
point in Russia lower
Real Estate
Rightmove (UK) 3.4 Number of transaction of secondary homes in Russia 2 times
larger, but average UK home 3 times more expensive
Jobs Seek (ANZ) 1.5 Russian job market substantially larger (6x), but average salary only a fraction of that in Australia and New Zeeland.
Services – 0.5 No good comparable publicly listed. Based on current run rate and Thumbtack raising at USD 1.3 bln
General Mercadolibre (LatAm) 2.2 Mercadolibre’s addressable market 4.5 times larger in terms of
population. GDP/capita relatively similar
Total 10.5
What we have done in table 3 is to:1. Look up an international peer with a position similar
to the one we believe Avito will reach over time 2. Calculate a “market size ratio”, i.e. how the size of the
peer’s market relates to the Russian market. Here we have looked at both how the number of transactions compares and how the average value per transaction compares
3. Calculated an “implied market cap”, which essentially is the current market cap of the peer divided by the market size ratio
Reaching a level of revenues and profits that would jus-tify a valuation north of USD 10 bln will not happen overnight, but our view is that over time Avito should be able to reach such numbers given the “winner takes all” dynamics of the market and the company’s position.
��10����10��
Introduction
Avito study: Real Estate (originally published in the report for the fourth quarter of 2017)In the last quarterly report we presented the case for looking at Avito as a collection of verticals rather than a horizontal player when assessing the company’s long-term potential. In this report we kick off the deep dives in each of Avito’s verticals, starting with Real Estate.
BackgroundOur view is that the intrinsic value of a classifieds prop-erty can be derived from the total addressable market multiplied with the property’s share of leads generated in that specific vertical.
The logic behind this is quite simple. Advertisers in a given vertical have a bag of money to spend on advertising. This bag of money can grow bigger (or smaller) with time, but the size of the advertising spend is unlikely to change with more than single digit percentage numbers per year. The total addressable market is often fairly stable.
What can change relatively quick, however, is how advertisers chose to distribute this spend.
In the last decade we have seen a tremendous shift in spend from offline to online. Advertisers have sim-ply followed consumers as they have shifted their time allocated from offline to online, from print classifieds to online classifieds. As consumers’ time allocation shifts from one type of media to another, so does the number of leads generated. And as one resource starts working better than the other – that is, starts generating more leads – advertisers move their spend to the best perform-ing sources.
In the long run, a property’s share of leads generat-ed and share of spend should converge. In the short to medium term there might be nuances in different prop-erties’ monetization strategies, sales capabilities, etc., but we prefer to take the long view.
Therefore, in this report we will first look at the addressable market – in this case the Russian real estate market – and then at Avito’s competitive position on this market. We will then use those data points as input for a discussion for Avito’s real estate vertical potential on a stand alone basis.
The Russian real estate marketThe inner workings of real estate markets might differ substantially from country to country. In some countries
the real estate agent profession is licensed, in others (like Russia) all you need to call yourself an agent is a mobile phone and an account on the largest classifieds property. In some countries agents have exclusive mandates (i.e. the seller is bound to sell with the chosen agent for a period of time), and in other (like Russia) a property can be marketed by an unlimited number of agents.
Despite the differences, our experience is that the way agents think about marketing spend is remarkably similar. The price of the property multiplied with the commission rate equals the agent’s gross proceeds from a sale. Every agent understands that a certain percentage – often around 5–10% – needs to be allocated to market-ing of the property. Each agent of course want to mini-mize this number, but the way the market works in most countries agents understands that this is a necessary cost of doing business. Again, there might be nuances deepening on region and subsets of the market, but our experience is that the above is correct on a high level.
So the formula for deciding the total addressable mar-ket is quite straight forward: number of properties sold per year * average price * average commission * share of gross revenue allocated to marketing.
The Russian real estate market is huge in terms of number of transactions – we believe that around 2.5 mil-lion properties are transacted every year in a way relevant to Avito. The total number of transactions is substantially higher, but some of those transactions are not relevant to Avito since they happen without agents or are between family members or similar. 2.5 million is our rather con-servative estimate (Avito’s main business is in secondary sales – Avito is not as strong in new homes yet). This can be compared with 1.2 million homes on the UK market, the home of both Rightmove (USD 5.7 bn market cap) and Zoopla (USD 2.1 bn market cap). Or it can be compared with the Australian market where 0.5 million homes are sold each year and where REA Group is the leading prop-erty marketplace (USD 7.8 bn market cap with 94% of its revenues coming from the Australian market).
However, the average selling price in Russia is rela-tively low in an international perspective, much because of the weak rouble. We have used the pricing function on Domofond.ru and based on that made the assumption that the average price is RUB 4.0 mln.
The commission is typically between 2–3% – much in line with international benchmarks.

��11����11��
Introduction
These numbers result in a total addressable market of about RUB 17.5 bn per year, summarized in the table below.
Metric NumberNumber of properties per year 2.5 mlnAverage selling price RUB 4 mlnAverage commission 2–3%Share of gross revenue allocated to marketing 5–10%Total addressable market Ca. RUB 17.5 bn
Internet’s share of spendAccording to the AKAR, The Association of Russian Advertisers, Internet surpassed TV as the largest adver-tising channel in terms of spend in the third quarter of 2017. This is a major milestone in the structural shift towards online, and the trend will continue. More than 40% of budgets are now allocated to online channels. Among smaller advertisers – such as real estate agents – the share of spend going to online is naturally much higher since this type of advertisers cannot afford TV. We think it is reasonable to assume that at least half of RE agent’s spend is allocated to online channels. So of the RUB 17.5 bn we assume that agents spend, around RUB 8.5–9.0 bn is directed to online channels.
Avito’s position on the Russian real estate marketAvito’s position on the Russian real estate market is immensely strong. In this section we will walk you through the different products Avito offers in the verti-cal and what market position the company has reached in the vertical by aggressively pushing these products to the market.
Avito Real Estate – Russia’s leading RE vertical under Avito’s umbrella brandThe Real Estate section of Avito has been present since the very early days, but it was not until 2012 that the com-pany started to put serious efforts and resources behind creating awareness about the RE vertical for the general public. At this time, a large part of the transactions still happened through agents sitting on closed databases with objects for sale, and classifieds sites were mostly used to attract potential clients with fake items that were too good to be true. Through consistent marketing, sales
and content moderation efforts, Avito Real Estate man-aged to build a functioning marketplace which quickly grew into the largest federal real estate marketplace in Russia.
Domofond – a 100% owned stand-alone vertical second only to Avito Real EstateDomofond was started as a joint venture between Avito and South Africa’s Property24. The rationale for launch-ing was that there was no dedicated federal real estate vertical in Russia at the time, and that the Russian real estate market certainly is large enough to have both a leading horizontal player (Avito) and a vertical player. Unless Avito themselves took the position, someone else would. Among the pure Real Estate verticals, Domofond is now the largest federal vertical.
ActiAgent – a SaaS offering simplifying agents’ daily lifeActiAgent is a software for agents where they can man-age all their listings in a easy and intuitive way. Whereas the listing interface on Avito is built for private users, ActiAgent is built solely for professional users with their needs in mind. This creates a stronger connection between Avito and the agents, and become an even great-er part of their everyday work.
Market positionAvito has a strong position in the real estate vertical in Russia with Avito Real Estate and Avito’s wholly owned dedicated vertical Domofond. Together they are the clear market leader in the space. We estimate that Avito has 60–70% market share in terms of traffic and ultimately also leads. This is supported by research performed by independent market researchers, e.g. “sales tests” where the same homes are published on all services available and then the response is measured and from what site the response came. Similar numbers are reached for Avito when you ask people who have used Internet to search for properties about what service they actually used.
For the purposes of this exercise, we assume that agents allocate their spend in the same proportions as they get their leads. That is, that 2/3 of the budget goes to Avito.
��12����12��
Introduction
Valuation approach Using this top down approach to calculate the pricing power and “fair revenue share” of Avito Real Estate, we land at approximately RUB 5.5–6.0 bn for the current year.
Zillow trade at 22.5 times 2018 earnings, Rightmove at 20.7 and REA Group at 20.1, but they all have sub-stantially slower growth rate than Avito. A peer group of online classifieds in emerging markets trade at 27.4 times 2018 earnings. Given the growth rate of Avito, the quality of the company and for the reasons laid out in the 3Q17 report (higher pricing power, lower risk for disruption and synergies to drive best in class margins) we think a multiple of 25 is fully justified for Avito Real Estate on a stand alone basis. Assuming 60% EBITDA margin, we believe that the present value of the RE vertical only is somewhere around RUB 90 bn or USD 1.5 bn.
In the last report we calculated “implied market caps” of each verticals where we took a much longer horizon. In that report, we assigned a long term value potential of USD 3.4 bn to the RE vertical based on the current mar-ket cap of Rightmove and the relative sizes of the Russian and UK real estate markets. We still believe this number makes sense. With time, a number of important factors play into the Avito’s hands: 1) the overall marketing bud-gets in Russia will grow, 2) more and more will move over to online, 3) Avito will take an even larger share of overall spend thanks to the industry dynamics, and 4) Avito will continue to launch new and innovative prod-ucts expanding the market further.

��13����13��
Interview with Brant Rubin
Tell us about yourself? Who are you? Background? What are you doing now?Most know me as the guy always pitching Schibsted and Vostok as investment opportunities. I’m still that guy. I’ve still yet to see a better model in the world than the online classifieds model, and in consequence have stud-ied it in great depth, and likewise invested significant sums in various classifieds opportunities globally, over time. And continue to be an investor in the sector today.
Most recently, I’ve launched Vor Capital, Europe’s first Internet fund, to capitalize on great investment opportunities like classifieds and others across Europe. “An Internet fund in Europe?” I get that a lot. Europe doesn’t get a ton of attention for its Internet businesses, which is what I like about it. Great, local, niche monop-olies that most have never heard of, and thus can be bought at attractive prices.
Prior to launching Vor, I was with Luxor Capital Group, a NY-based investment fund, for nearly 7 years, first in NY, and then re-locating to London to build Luxor’s European presence, before launching Vor last August. Investments in Schibsted and Vostok itself were two of our larger investments at Luxor – at one point we held more than 10% of Schibsted and 40% or so of Vostok. The latter with particular success, thanks in part to great management teams at both Vostok and Avito.
But more direct to your question, I’m from Chicago originally, studied at Yale and Columbia Business School, and in-between was with Morgan Stanley’s Investment Banking Division and Oak Street Capital Management, each in Chicago. And these days I’m using nearly every hour to prepare Vor for launch. We’ve assembled an amaz-ing team, and aim to launch this summer from London. It’s incredibly exciting to build a small business. We’re now positioned for success, and I’m incredibly excited by the investment opportunities I’m seeing today.
Why are you interested in online classifieds?I was first introduced to classifieds while in business school at Columbia in late 2010, via a business by name of Rightmove. We had a visiting professor, a London-based investment manager, who introduced us to a UK-based business – un-named in our case study – but which I later learned was a UK-based business by name of Rightmove. Rightmove, which trades in London, has since grown
into a bellwether of the online classified sector, and the beneficiary of a titanic shift in advertising spend from print newspapers to online. I can’t put a finger on exactly what it was about that case study and Rightmove that inspired me as it did, but it did. The model just resonated with me. Pricing power, subscription-based, high-visi-bility revenue, 60% EBITDA margins (at the time, now 70–75%), almost no on-going capital requirements. Just an awesome financial model – with incredible, and what I suspected was under-appreciated, defensibility. I stopped everything else I was doing and studied Right-move as much as I could, soon after investing a good chunk of my net worth in the business.
I’ve since looked at almost every prospective invest-ment thru a “Rightmove lens” – looking for similar business models, with similarly attractive business and investment characteristics. Avito, Finn, Leboncoin, Blocket, TradeMe, craigslist – these are basically Right-move clones. They might not look exactly like Rightmove to their end users, but the competitive forces driving the businesses are more alike than most perceive, and are effectively the same. Network effects and consumer habit, in tandem, become incredibly powerful at scale, and incredibly difficult to defeat.
How do you gauge the threat of mobile only competitors and Facebook Marketplace?Look at craigslist. Its consumer interface looks like it was built in the 1980’s (it was actually launched in 1995). The site is littered with spam, scams, and crime. And in a mobile Internet world, craigslist does not even have a mobile app!!! And yet craigslist still stands strong today. And is the 9th largest Internet site in the US! Incredible.
So, let’s take “LetGo”, a mobile-only classifieds player in the US. It gets a lot of headlines as the next “craigslist killer”, and I suspect has burned almost half a billion dol-lars ($!$) in an attempt to build liquidity. Yet, based on the data I review, it seems to be the equivalent of a flea in comparison to craigslist, and a flea with stalled growth. LetGo’s performance against Finn.no in Norway is even more embarrassing.
And thus while I am watching and tracking the pro-gression of mobile-only classifieds competition and FB Marketplace closely, I think their ability to materially displace the likes of a Finn, Blocket, Avito, or Leboncoin, are slim.
Introduction

��14����14��
And with these new market entrants – how do you see them impacting the key verticals of Auto, Real Estate etc, especially in the professional seller segment?I’d think the probability of success for new players – whether FB Marketplace, or a mobile-only challenger – is super low. Whereas I do see that these new marketplac-es may reach ample liquidity and successfully co-exist alongside the incumbent platforms, I’d think that their activity will be primarily confined to low-value goods or other smaller niches. There is a reason for that. There is a spectrum of activity on a classifieds site like an Avito or Blocket (or craigslist or Leboncoin). Within that spec-trum, there are some activities where the seller wants to maximize his convenience (that is, just sell his stuff, eas-ily, with less sensitivity to the sale price of the item), and on the other end of the spectrum, activities where the seller is willing to sacrifice some convenience for price maximization. The verticals – whether selling a car, or real estate – fall in the latter category. When selling your home, you’ll want to broadcast the sale of your home to the widest audience of home buyers possible. Likewise, with your car. Where does one find the largest audience of potential homebuyers, to continue that example? In the UK, Rightmove. In Norway, Finn. In Russia, Avito. These sites have already aggregated all the available home-for-sale inventory, and that inventory has attract-ed a large, targeted audience of homebuyers. Which ensures that home sellers and agents must list on these sites, or risk not reaching the widest audience possible. It’s a beautiful virtuous circle. Whereas that same vir-tuous circle doesn’t necessarily exist when you’re selling your used couch. You just want it sold, whether marketed to the largest audience possible or not.
What can incumbents do to fight this? Can you highlight some good/bad examples you have seen in the market relating to this?Incumbents, counter to some market narratives, are in a position of strength. The virtuous circle is already spin-ning for them. They just need to keep it spinning. Ensure that they maintain the widest inventory of cars or homes, and that both sellers and buyers are having positive expe-riences selling or buying on the site. This requires that they continue to advance their technology and migrate alongside the consumer. As the consumer moves from desktop to mobile, they must move their experience with
it. From mobile to whatever is next, move with it. On the seller side, continue to provide value for the seller, not just in the form of liquidity, but in tangible value-add tools for Real Estate and Car sellers – whether software or data analytics or both. The stronger the captivity of the platform to each seller and buyer, the better.
What has in your mind been the largest surprises and market shifts you did not expect to see over the last 2 years.As much as I am a believer in the classifieds model, any time the likes of a Facebook or Google or Amazon set their sites on your business, you have to worry. What has surprised me most is the resiliency of these models, even in the face of what has been intense and rising competi-tion in recent years, including from Facebook and very well-funded mobile-only players like LetGo or Youla. I expected resiliency, but these businesses seem to contin-ue to perform as if competition doesn’t exist. Take Finn.no, for example. It has not only survived an onslaught from LetGo, but has actually re-accelerated revenue growth (from 8% in 2016 to almost 20% in 2017), all while materially improving its mobile experience (and thus further lessening any threat from new mobile com-petitors). Avito, likewise, 29% y/y revenue growth in Q4 with expanding margins? Impressive.
What is the next step for online classifieds? What trends to do you think will become the most important to follow?I’d suspect rising competition in recent years has and will continue to galvanize the industry. The pace of inno-vation will improve materially, in response, and in con-sequence I think the opportunities for these businesses will only increase, rather than the opposite. If we circle back to the Rightmove example, this business, despite how far it has developed financially (~$5bn market cap), is still taking only a sliver of the value it provides. Does a home seller need anything other than Rightmove to sell a home? Does he/she need an agent? Perhaps, but prob-ably not, and certainly not for at least a sub-set of the home selling universe. Thus, whereas market narratives seem to point to models like PurpleBricks (a low-touch, online estate agent model) as potentially disruptive to a Rightmove, I would think the effect is the opposite. The potential dis-intermediation of the agency, or the effect
Introduction

��15����15��
of bringing the home seller closer to the transaction itself, should only highlight the value a Rightmove pro-vides in the home-selling value chain. That is, nearly all of it. I think these models will capture more of that value over time.
Other business models with similar strength in network effects? Food takeaway? Taxi hailing businesses like Gett or Uber Have you looked at the likes of BlaBlaCar? Verticals in services?I love the food takeaway models. They of course share many parallels with online classifieds. As the variety and depth of restaurants on their platforms grow, the appeal to the consumer of the platform increases, and as they thus attract more consumers, the appeal of the platform to the restaurants grows. That is a powerful network effect, just as in classifieds. Further, and maybe more impor-tantly for this model, consumers prove to be incredibly sticky. Once you’ve learned to use a food platform app, have entered your credit card info, and have made a few orders from a selection of restaurants, your inclination to migrate to another platform entirely is super low. As relatively simple as learning another app might be, when you’re hungry, it’s the last thing you want to do. Plus it’s a business model with high frequency of interaction. Much in the same way a Rightmove or Hemnet attracts a user a few times a week (real estate voyeurism), thereby mak-ing that user less and less inclined to try another app or site as use becomes habitual, food platform users make a few orders per week, likewise becoming habitual behav-ior. That’s powerful.
BlaBaCar I think is incredibly cool. I don’t think most appreciate that more than 50% or so of BlaBla’s routes are effectively monopolies. So, yes, BlaBla will com-pete with discount buses and trains from Paris to Lyon (though is unlikely to face irrationally low pricing from that same bus and train competition over time, as it is now), but for the majority of its long-distance routes, there is no alternative for the rider. BlaBla is thus cre-ating a dense, wide, long-distance travel infrastructure, and one that improves and widens with every driver and rider. Incredibly cool.
We have in our recent reports made the comparison between Avito of today and Rightmove 8–10 years ago in terms of long-term growth potential – do you think that’s a fair analogy?An analogy for certain, but an unfair one. Avito can be so much better. Just by nature. Given it is the Right-move of Russia, at a very early stage of its monetization potential, but of course is so much more. And with so much more traffic/capita than Rightmove, and thus the ability to extend and expand its revenue streams into new businesses that Rightmove has and will never have. A better starting point for analogy would be that Avito is the AutoTrader and Rightmove of Russia, but that again doesn’t give due credit to the opportunities Avito will have in Jobs and Services marketplaces, in eCommerce generally, and in Avito’s ability to create new revenue streams which I haven’t even thought of today.
Top stock pick and you cannot say Vostok New Ventures?Schibsted’s valuation continues to confound, relative to the quality of its asset base and near, medium, and long-term earnings power. And to say that Avito is mis-priced today would be a dramatic understatement. But yet I’m finding even better opportunities than either today. And am eager to put this capital to work for Vor’s investors.
Introduction

��16����16��
Investment portfolio
Portfolio Structure – Net Asset ValueThe investment portfolio stated at market value as at December 31, 2017, is shown below.
Company Fair value, USD
Dec 31, 2017
Percentage weight
Fair value, USD
Dec 31, 2016
Fair value change per share, USD
2017
Avito2 591,938,454 62.2% 449,281,016 32% 1
BlaBlaCar2 118,615,542 12.5% 107,738,524 -18% 1
Gett2 59,198,650 6.2% 50,358,980 18% 1
Propertyfinder2 28,704,345 3.0% 19,999,199 44% 1
babylon2 23,335,857 2.5% – 8% 1,3
OneTwoTrip2 20,810,533 2.2% 14,958,960 39% 1
Wallapop2 13,533,279 1.4% 11,520,768 17% 1
Hemnet (through YSaphis S.A. and Merro Partners S.A.)2 11,207,369 1.2% 10,252,714 9% 1,3
Merro2 9,358,731 1.0% 12,384,907 -24% 1
Naseeb Networks (Rozee and Mihnati)2 4,203,772 0.4% 4,034,693 4% 1
CarZar2 3,521,186 0.4% – – 1
El Basharsoft (Wuzzuf and Forasna)2 2,347,911 0.2% 1,158,956 68% 1
Vezeeta (DrBridge)2 1,833,313 0.2% 894,724 49% 1
KEH AB (YouScan)2 1,526,375 0.2% 3,515,204 -57% 1
Agente Imóvel2 1,000,000 0.1% – – 1
Carable (Garantibil)2 – – 2,198,526 -100% 1
Delivery Hero AG, equity 888,401 0.1% 2,137,575 20% 1
Delivery Hero AG, equity component – – 1,147,070 – 1
Delivery Hero AG, debt – – 24,074,461
Kite Ventures, loan – – 7,698,611
Liquidity management 8,023,392 0.8% –
Cash 51,078,919 5.4% 34,780,024
Total investment portfolio 951,126,029 100.0% 758,134,913
Borrowings -71,541,440 -32,399,831
Other net receivables/liabilities 405,089 -219,172
Total NAV 879,989,679 725,515,910
1. This investment is shown in the balance sheet as financial asset at fair value through profit or loss. 2. Private equity investment.3. Valuation change due to exchange rate movement.
Investment Portfolio

��17����17��
100
0 0
100
80 80
60 60
40 40
20 20
2007 2008 2009 2010 2011 2012 2013 2014 2015 2016 2017
Quarterly NAV per share (columns) and SDR (dotted line) price development May 2007–December 2017 (SEK/SDR)
The Group’s net asset value as at December 31, 2017, was USD 879.99 mln, corresponding to USD 10.40 per share. Given a SEK/USD exchange rate of 8.2322 the val-ues were SEK 7,244.35 mln and SEK 85.65 respectively.
The group’s net asset value per share in USD increased by 22.8% over the period January 1, 2017–December 31, 2017. During the same period the MSCI Emerging Mar-kets index increased by 7.1% in USD terms.
During the period January 1, 2017–December 31, 2017, the investment portfolio, which represents the largest part of the Group’s net asset value, has increased by USD 192.99 mln. Movements of the investment port-folio are (USD mln):
Opening balance 758.14Additions 43.32Disposals -2.55Net change in loan receivables -37.62Interest income 3.92Exchange differences 1.93Change in fair value 167.69Change in cash 16.30Closing balance 951.13
Major portfolio events during 2017 were investments in three new portfolio companies: babylon (GBP 17.3 mln), CarZar (USD 3.0 mln) and Agente Imóvel (USD 1.0 mln), and a number of smaller investments in four existing portfolio companies: BlaBlaCar, El Basharsoft, Vezeeta and Propertyfinder.
During 2017, Vostok New Ventures sold the majori-ty of its shares in Delivery Hero (USD 2.5 mln) ahead of the companys IPO. The Company’s debt investment in Delivery Hero was repaid to the Company following the Delivery Hero IPO. During 2017 the Company also redeemed its SEK 300 mln 2016/2019 bond and issued new 2017/2020 unsecured bonds of SEK 600 mln listed on Nasdaq Stockholm.
At the end of December, 2017, the four biggest invest-ments were Avito (62.2%), BlaBlaCar (12.5%), Gett (6.2%) and Propertyfinder (3.0%).
Investment Portfolio
��18����18��
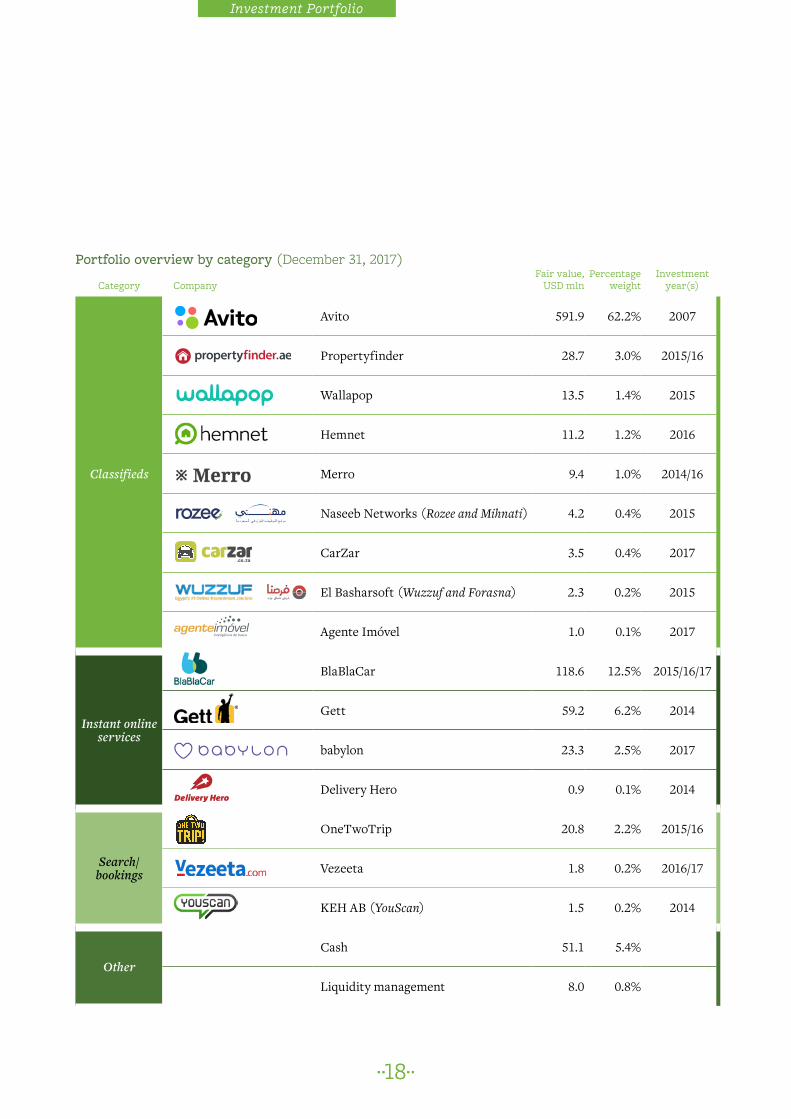
Portfolio overview by category (December 31, 2017)
Category CompanyFair value,
USD mlnPercentage
weightInvestment
year(s)
Classifieds
Avito 591.9 62.2% 2007
Propertyfinder 28.7 3.0% 2015/16
Wallapop 13.5 1.4% 2015
Hemnet 11.2 1.2% 2016
Merro 9.4 1.0% 2014/16
Naseeb Networks (Rozee and Mihnati) 4.2 0.4% 2015
CarZar 3.5 0.4% 2017
El Basharsoft (Wuzzuf and Forasna) 2.3 0.2% 2015
Agente Imóvel 1.0 0.1% 2017
Instant online services
BlaBlaCar 118.6 12.5% 2015/16/17
Gett 59.2 6.2% 2014
babylon 23.3 2.5% 2017
Delivery Hero 0.9 0.1% 2014
Search/ bookings
OneTwoTrip 20.8 2.2% 2015/16
Vezeeta 1.8 0.2% 2016/17
KEH AB (YouScan) 1.5 0.2% 2014
OtherCash 51.1 5.4%
Liquidity management 8.0 0.8%
Investment Portfolio

��19����19��
The Vostok New Ventures investment portfolio (December 31, 2017)
Classifieds 69.9%
Instant online services 21.3%
Search/booking 2.6%
Other 6.2%
Cash 5.4%Liquidity management 0.8%
OneTwoTrip 2.2%
Vezeeta 0.2%
KEH AB 0.2%
BlaBlaCar 12.5%
Gett 6.2%
babylon 2.5%Delivery Hero 0.1%
Avito 62.2%
Propertyfinder 3.0%Wallapop 1.4%
Hemnet 1.2%Merro 1.0%
Naseeb Networks 0.4%CarZar 0.4%
El Basharsoft 0.2%Agente Imóvel 0.1%
Portfolio weight by asset class
December 31, 2017 December 31, 2016Type Fair value, USD mln Percentage weight Fair value, USD mln Percentage weightEquity investments 892.03 93.8% 691.58 91.2%Debt investments – – 31.77 4.2%Liquidity management 8.02 0.8% – –Cash 51.08 5.4% 34.78 4.6%Total investment portfolio 951.13 100.0% 758.13 100.0%Borrowings -71.54 -32.40
Other net receivables/liabilities 0.41 -0.22
Net asset value 879.99 725.52
Investment Portfolio

��20����20��
and Domofond is ActiAgent, a SaaS offering simplify-ing agents’ daily life. ActiAgent is a software for agents where they can manage all their listings in a easy and intuitive way. Whereas the listing interface on Avito is built for private users, ActiAgent is built solely for pro-fessional users with their needs in mind. This creates a stronger connection between Avito and the agents, and become an even greater part of their everyday work. The Russian real estate market is underdeveloped and holds great promise for the future. Some of the most profitable and highest valued international classifieds sites are real estate portals, including the likes of Rightmove, Zillow, REA Group and SeLoger.
In the Auto vertical Avito is focused on a similar strat-egy with its Autoteka product, which offers a thourough history for used cars in Russia, where you see milage, change of ownership and accident reports etc. etc as well as ActiDealer, a softaware similar to ActiAgent but for professional used car dealers in Russia to manage their inventory.
ValuationAs per December 31, 2017, Vostok New Ventures values its stake in Avito to USD 591.9 mln (USD 4.5 bn for the entire company) on the basis of a EV/EBITDA peer mul-tiples valuation model. As per December 31, 2017, the model has been further refined to better reflect Avito’s strong EBITDA growth compared to the listed peer group. This represents a 31.8% increase in valuation compared with Vostok’s valuation as per year-end 2016. The main drivers of the revaluation during 2017 are the refined valuation model as well as a stronger ruble and slightly higher peer multiples.
As per December 31, 2017, Vostok New Ventures owns a 13.2% stake in the company on a fully diluted basis.
Other shareholders in Avito are Naspers (majority shareholder), Baring Vostok and the two founders.
During 2017, Vostok New Ventures received a total of USD 8.2 mln in dividends from Avito. The dividends were paid during the first (USD 6.8 mln) and second (USD 1.4 mln) quarters of 2017.
Avito is the largest and most liquid online classifieds platform in Russia, and the clear market leader in terms of visitors and ads. During 2017, the company has con-tinued to deliver strong growth and profitability. Avito’s firm market-leading position has proven to be a key fac-tor in terms of the potential to reach high profitability similar to that of peers in other countries. Avito is the leading brand and with strong brand awareness through-out Russia. Compared to western countries, Russia still lags behind in terms of low proportion of internet users in relation to the total population. According to International Telecommunication Union (ITU) Russia now has just over 100 mln internet users. The market for internet-related services continues to grow in correla-tion with an increased internet penetration. The Russian e-commerce market is also expected to grow with the increasing internet penetration and consumers and businesses migrating online. In 2017, research agency Data Insight estimated the C2C market of general goods in Russia to RUB 295 bn (USD 5.1 bn) and 90 million transactions.
VerticalsDuring 2017, Avito has continued to strengthen its posi-tion in the key verticals, Auto, Real Estate (RE) and Jobs and Services with an increasing product offering for pro-fessional sellers. Domofond, the designated real estate portal for the Russian market, launched in 2014, contin-ues to grow and is the largest property vertical by visitors after Avito itself in the Russian market.
Domofond.ru is a designated property vertical servic-ing real estate agencies and developers in the growing Russian real estate market. Domofond aims to be the leading property vertical in Russia and will help Avito create a stronger brand and improve monetization in the real estate segment. Domofond is still in a develop-ment phase and does not generate any significant reve-nues. During 2015 and 2016, and 2017 Avito has invested material amounts in Domofond for marketing purposes, and the vertical has launched TV campaigns in Moscow, St. Petersburg and many of the most populous cities in Russia.
Since launch, Domofond has had strong, although from a low base, monthly growth in visitors. In January 2017, Domofond had 12.5 million visits according to Similarweb. Another important component of Avito RE
Investment Portfolio

��21����21��
Avito Quarterly Key Performance Indicators
FY 2016 1Q 2017 2Q 2017 3Q 2017 4Q 2017 FY 2017 FY y-o-y change
Revenue, RUB mln 11,678 3,290 3,865 4,070 4,241 15,466 32%Adjusted EBITDA, RUB mln 6,261 2,002 2,458 2,326 2,232 9,018Adjusted EBITDA margin 54% 61% 64% 57% 53% 58% Listers, mln 43 11.2 12.0 11.4 12.2 46.9 9%
avito.ru
Share of total portfolio:
62.2%
Avito
Key performance indicators 2017¹• Revenues of RUB 15,466 mln (USD 268.5 mln2), up
32% compared with 2016 (RUB 11,678 mln). • Adjusted EBITDA margin of 58% or RUB 9,018 mln
(USD 156.6 mln2), compared with 2016 (Adjusted EBITDA margin of 54% or RUB 6,261 mln).
• Listers amounted to 46.9 mln compared with 43 mln for the previous year.
1. Unaudited figures from Avito.2. Translated with FX rate of 57.6002 as of December 31, 2017.3. Source: internal company information.
Non-financial highlights during 2017• According to Mediascope, Avito is among top-10
most popular Russian websites with a monthly audience of 32 million
• The number of listings on Avito increased by 18% in 2017
• Avito strengthen its users’ experience in the fol-lowing areas:V More relevant search V Open history of every seller’s listings V Search of goods by photo V Verification of landowners in long term rent
category V Launch of AvitoPro for professional users V Recommendations V Anonymous number protecting users in Auto
and Real Estate verticals from SMS spammers • Avito celebrated 10 years in 2017. Massive ‘People
to people’ communication campaign, dedicated to Avito users, was launched. The outreach was ensured with promo and ATL tools – TV com-mercial and massive outdoor advertising based on visual images of ‘common users’. The cam-paign was successful both in terms of brand truth impact and audience outreach. 44.5 million people saw the 10-year anniversary TV commercial.
Investment Portfolio
6,166,470Vostok New Ventures’ number of shares as at
December 31, 2017
591.9Total value (USD mln)
13.2%Share of
total shares outstanding
2007Investment
year
+32%Value development
2017 (in USD)
��22����22��
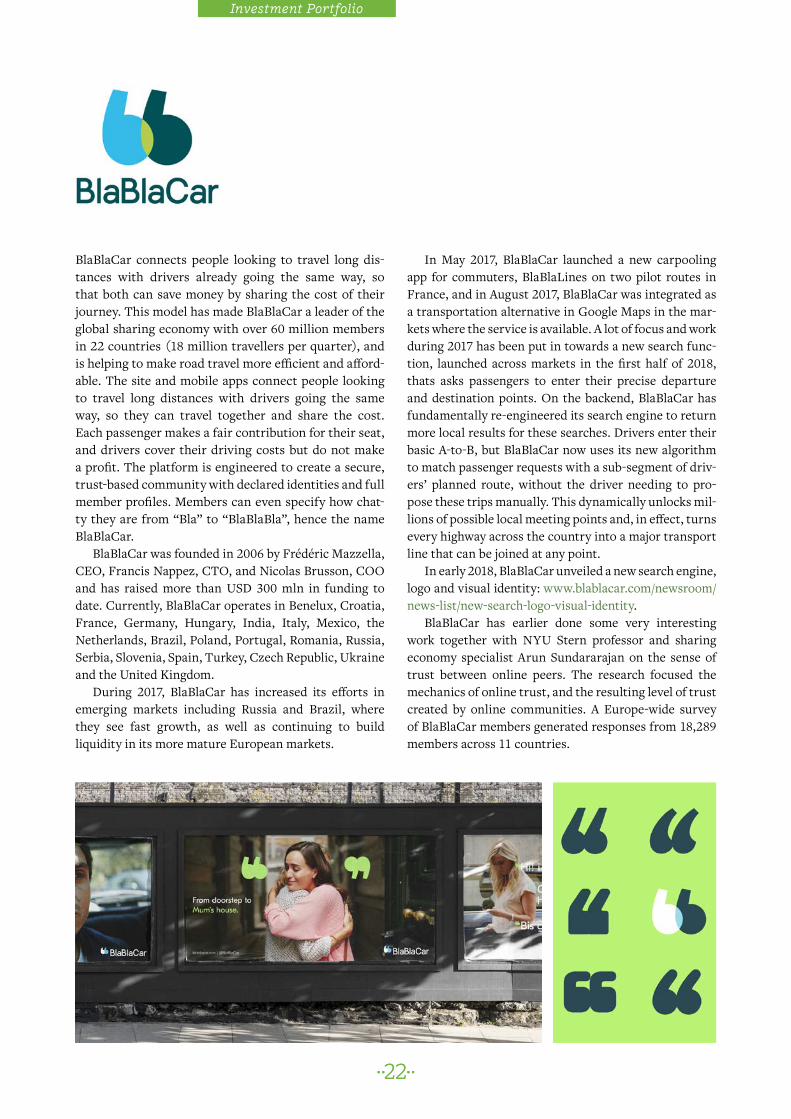
In May 2017, BlaBlaCar launched a new carpooling app for commuters, BlaBlaLines on two pilot routes in France, and in August 2017, BlaBlaCar was integrated as a transportation alternative in Google Maps in the mar-kets where the service is available. A lot of focus and work during 2017 has been put in towards a new search func-tion, launched across markets in the first half of 2018, thats asks passengers to enter their precise departure and destination points. On the backend, BlaBlaCar has fundamentally re-engineered its search engine to return more local results for these searches. Drivers enter their basic A-to-B, but BlaBlaCar now uses its new algorithm to match passenger requests with a sub-segment of driv-ers’ planned route, without the driver needing to pro-pose these trips manually. This dynamically unlocks mil-lions of possible local meeting points and, in effect, turns every highway across the country into a major transport line that can be joined at any point.
In early 2018, BlaBlaCar unveiled a new search engine, logo and visual identity: www.blablacar.com/newsroom/news-list/new-search-logo-visual-identity.
BlaBlaCar has earlier done some very interesting work together with NYU Stern professor and sharing economy specialist Arun Sundararajan on the sense of trust between online peers. The research focused the mechanics of online trust, and the resulting level of trust created by online communities. A Europe-wide survey of BlaBlaCar members generated responses from 18,289 members across 11 countries.
BlaBlaCar connects people looking to travel long dis-tances with drivers already going the same way, so that both can save money by sharing the cost of their journey. This model has made BlaBlaCar a leader of the global sharing economy with over 60 million members in 22 countries (18 million travellers per quarter), and is helping to make road travel more efficient and afford-able. The site and mobile apps connect people looking to travel long distances with drivers going the same way, so they can travel together and share the cost. Each passenger makes a fair contribution for their seat, and drivers cover their driving costs but do not make a profit. The platform is engineered to create a secure, trust-based community with declared identities and full member profiles. Members can even specify how chat-ty they are from “Bla” to “BlaBlaBla”, hence the name BlaBlaCar.
BlaBlaCar was founded in 2006 by Frédéric Mazzella, CEO, Francis Nappez, CTO, and Nicolas Brusson, COO and has raised more than USD 300 mln in funding to date. Currently, BlaBlaCar operates in Benelux, Croatia, France, Germany, Hungary, India, Italy, Mexico, the Netherlands, Brazil, Poland, Portugal, Romania, Russia, Serbia, Slovenia, Spain, Turkey, Czech Republic, Ukraine and the United Kingdom.
During 2017, BlaBlaCar has increased its efforts in emerging markets including Russia and Brazil, where they see fast growth, as well as continuing to build liquidity in its more mature European markets.
Investment Portfolio

��23����23��
blablacar.comBlaBlaCar
2017 highlights• 60+ mln members• 18 mln travellers per quarter• BlaBlaPass launched in Poland with further markets coming in 2018• Enhanced search function on the platform resulting in exponentially larger number of potential trips• Pilot of daily commuting product BlaBlaLines launched in France• BlaBlaCar integrated in Google maps
Below is a graph showing one of the many inter-esting results of the survey. The level of trust BlaBlaCar members had towards other members came behind family in friends, but before colleagues, neighbors and other social media contacts. The full report ‘Entering the trust age’ is available here: www.blablacar.com/trust.
Since 2015, Vostok New Ventures has invested a total of EUR 107 mln into BlaBlaCar. The most recent trans-action (EUR 2.3 mln) was completed during the fourth quarter of 2017.
As per December 31, 2017, Vostok New Ventures owns approximately 9.3% of BlaBlaCar on a fully diluted basis and the investment is valued on the basis of a valuation model focused on multiples of GMV (Gross Merchandise Volume) and revenue as the last transaction on market terms is now more than 12 months old.
BlaBlaCar’s founders (from left): Frédéric Mazzella (CEO), Francis Nappez (CTO) and Nicolas Brusson (COO).
Investment Portfolio
Share of total portfolio:
12.5%
Percentage of respondents who ranked 4 or 5 out of 5 their level of trust in…
Member with full profile on BlaBlaCar
Friends
Colleague
Neighbour
Family
Social media contact 16%
94%
92%
88%
58%
42%
Study based on 18,289 respondents in 11 countries.
Source: BlaBlaCar and NYU Stern, Entering the Trust Age (2016).
14,492,319Vostok New Ventures’ number of shares as at
December 31, 2017
118.6Total value (USD mln)
9.3%Share of
total shares outstanding
2015/16/17Investment years
-18%Value development
2017 (in USD)

��24����24��
Gett’s most recent shareholders include the Volkswa-gen Group, who invested USD 300 mln in the company in 2016, and Sberbank, who has provided the company with a seven-year USD 100 mln debt facility, which also includes an equity component.
In late April 2017, Gett announced its acquisition of Juno in NYC in a deal worth USD 200 mln. Gett and Juno share a passion for treating drivers and riders better, as well as an unrelenting focus on quality. Since its foun-dation, Juno experienced tremendous growth, providing the highest-quality service in NYC. With this acquisi-tion, Gett is now set to become the second-largest ride sharing app in NYC (after Uber).
In October 2017, Gett announced a strategic partner-ship with Carey International for business travelers. The partnership expands Gett’s global footprint to over 1,000 cities worldwide through Carey International’s exclusive Global Franchise Network.
As per December 31, 2017, the Gett investment is val-ued at USD 59.2 mln, based on a valuation model follow-ing the company’s progress since last funding round led by Volkswagen in 2016 (now more than 12 months old) and the acquisition of Juno during 2017.
Gett is a global ride sharing app built on a simple idea – if you treat drivers better, they will treat riders better.
A leading provider in Europe, Gett is currently active in four countries and across 100+ cities, including Mos-cow, London, and NYC. Gett’s technology enables con-sumers to instantly book on-demand transportation, delivery and logistics. The addressable market for the company within its existing markets is worth some USD 30 bn. Of this Gett’s revenues are typically some 15–30% depending on whether it is servicing a private or busi-ness client. In total, Gett has raised over USD 640 mln in venture funding.
Gett is a company driven by quality; it means Gett does everything to put drivers first, resulting in the best-rated drivers in all markets in which it operates. The best drivers, in turn, deliver the highest quality rides to Gett’s riders.
With its focus on quality, Gett is equally successful in both B2C and B2B markets. As the global leader in corporate transportation, Gett already serves more than 12,000 leading global corporations today, using its “Gett for Business” product. The corporate market offers high-er profitability and also immense growth opportunities, as competition is lower. Gett deals solely with licensed drivers, making it a safe and valid option within the European and NYC regulatory framework.
Investment Portfolio

��25����25��
gett.comGett
2017 highlights• 12,000+ B2B clients• 4 countries and 100+ cities• 150,000+ veichles running on the Gett platform• Acquired Juno in the US and rebranded Gett’s US operations to Juno• Strategic partnership with Carey International
Investment Portfolio
Share of total portfolio:
6.2%
18,171,609Vostok New Ventures’ number of shares as at
December 31, 2017
59.2Total value (USD mln)
3.6%Share of
total shares outstanding
2014Investment
year
+18%Value development
2017 (in USD)

��26����26��
Propertyfinder Group was founded 10 years ago by Michael Lahyani and operates real estate classifieds platforms in seven countries across the MENA region (Middle East/North Africa). Propertyfinder is the clear market leader in UAE and Qatar and in at the top together with a few competitors in its other markets. Propertyfinder is headquartered in Dubai, employs more than 150 people and is profitable in its core markets as well as on group level in terms of EBITDA. In 2017 Propertyfinder acquired a minority stake in Turkish property vertical Zingat.
Vostok New Ventures invested USD 20 mln for 10% in primary equity of the company during the fourth quar-ter 2015. During the third quarter of 2017, Vostok New Ventures acquired a small number of secondary shares in the company for a total of USD 500k. The transaction is deemed small and not transacted at market terms and therefore not suitable as basis for valuation of the invest-ment in Propertyfinder.
As per December 31, 2017, Vostok New Ventures val-ues its stake in Propertyfinder to USD 28.7 mln (USD 278 mln for the entire company) on the basis of an EV/Sales peer multiples valuation model. This valuation represents a 44% increase in valuation compared to Vostok’s initial investment into the company. The valua-tion increase is driven by a strong revenue growth during 2017 and a positive outlook for 2018.
propertyfinder.aePropertyfinder
2017 highlights• Propertyfinder’s CRM product myCRM has seen strong growth in adoption during 2017• 94% yoy increase in unpaid traffic • 66% yoy growth in subscription clients• Continued strong market leadership in the region
Group KPI development 4Q17• Total page views are up 38.3% year on year• Total sessions are up 23.0% year on year• Total leads generated are up 48.8% year on year• Total unique users are up 23.8% year on year
Investment Portfolio
Share of total portfolio:
3.0%
142,308Vostok New Ventures’ number of shares as at
December 31, 2017
28.7Total value (USD mln)
10.1%Share of
total shares outstanding
2015/16Investment
years
+44%Value development
2017 (in USD)

��27����27��
babylon launched in 2015 and is a pioneer in personal digital healthcare globally. babylon’s technology, avail-able from any mobile phone or personal computer world-wide, aims to put an accessible and affordable health ser-vice into the hands of every person on Earth. babylon has brought together one of the largest teams of scien-tists, clinicians, mathematicians and engineers to focus on combining the ever-growing computing power of machines, with the best medical expertise of humans. In December 2017 babylon had over 1.3 mln registrations, and also runs a pilot program in Rwanda. On Novem-ber 6, 2017, babylon launched GP at Hand, its service for
the National Health Service (NHS) funded healthcare, across most of London and as per year end 2017, babylon had received 30,000 new user applications for the service in total. During 2017 babylon also received a USD 750k grant by the Gates Foundation to support and furthe scale its service in Rwanda.
In April 2017, Vostok New Ventures invested GBP 17.3 mln in primary shares in babylon in the context of a larg-er GBP 48 mln (USD 60 mln) financing round.
As per December 31, 2017, the babylon investment is valued at GBP 17.3 mln (USD 23.3 mln), on the basis of this latest transaction in the company.
babylonhealth.combabylon
* Attributable to currency exchange differences.
2017 highlights• babylon released an advanced AI diagnostics platform capable of beeing as accurate as a doctor in over
80% of all primary care consultations• Built one of the largest primary care medical knowledge databases globally, incorporating ~530 mln
datapoints• Tripled appointments in the UK to 2,000 per week and globally to 10,000 per week.• High quality of product – 25,000 five-star ratings and a net promoter score of 93• 750k registered members in Rwanda• 180 employees
Share of total portfolio:
2.5%
Investment Portfolio
84,246Vostok New Ventures’ number of shares as at
December 31, 2017
23.3Total value (USD mln)
10%Share of
total shares outstanding
2017Investment
year
+8%*Value development
2017 (in USD)

��28����28��
OneTwoTrip (OTT) is the leading OTA in Russia, while also operating in 9 other counties in CIS, Eastern Europe and developed markets offering a fully-integrated multi-product and multi-platform OTA running on their own proprietary IT systems. OTT is the number one player in a leading e-commerce segment with the best overall product proposition, nimble and bottom-line focused executive team and rapidly growing mobile channel. Opportunity to participate in the ongoing growth in online penetration of travel products, coupled with diversification of revenue streams, including major upside opportunities in(1) hotel cross-sell,(2) dynamic packaging (tickets + lodging combo), and(3) geographic expansion.
The Russian online travel market was more than USD 11 bn in 2016 and is expected to double by 2022 driven by overall travel market growth and increasing online trav-el penetration. Online travel is the largest sole segment of e-commerce in Russia and is similar in size but has 1.5x faster growth as compared to the market for online retailing of all physical goods combined.
In December 2016, Vostok New Ventures agreed to invest an additional USD 5.8 mln in OTT through a pur-chase of secondary shares from an existing investor in the company. The additional investment was disbursed in January 2017. Following the transaction, Vostok New Ventures owns 16.7% of the company on a fully diluted basis.
Vostok New Ventures has invested a total of USD 12.2 mln in OTT during 2015 and 2016. As per December 31, 2017, the company is valued based on an EV/Sales peer multiples model.
Investment Portfolio
onetwotrip.comOneTwoTrip
2017 highlights• Traffic: +64% total traffic, 2x cumulative mobile installs (to 3 mln+)• Units: +55% overall growth and +75% mobile growth• Non-avia products units: 3x railways growth, 2x hotels growth• GMV(turnover): +42% overall growth in USD• Net revenue: +49% growth in USD• Share of non-avia products in revenue increased 2 times from 8% to 17% (25% share in contribution margin)• New products and platforms: tours launch, B2B solution, mobile WL/SDK• New markets: launch of Poland and Turkey, rapid growth in Kazakhstan
96,228Vostok New Ventures’ number of shares as at
December 31, 2017
20.8Total value (USD mln)
16.7%Share of
total shares outstanding
2015/16Investment
years
+39%Value development
2017 (in USD)
Share of total portfolio:
2.2%

��29����29��
Wallapop is an online marketplace that enables users to buy and sell goods in categories such as fashion, deco-ration, motorcycles, electronics, and more. The compa-ny was founded by Agustin Gomez, Gerard Olivé and Miguel Vicente in January 2013.
Wallapop has over a short space of time taken great strides in terms of market share in online classifieds in Spain and is also making good inroads to France. Wallapop is also active in the UK and in the US. During the fall of 2015, Wallapop increased its marketing efforts in the US, taking on competitors such as Craigslist and Ebay. In the second quarter of 2016, Wallapop announced it would merge it US business with Naspers’ owned Letgo. As part of this merger the new US compa-ny raised further funding from its existing shareholders. During the fourth quarter of 2016, the US joint-venture raised further funding to continue to build on its efforts on the US market.
In the end of 2016, Wallapop started monetizing in Spain, letting users pay to highlight their listings for 24 hours. The price of the highlight varies slightly by type of product and region, but it is around EUR 2 in Wallapop’s main urban markets such as Barcelona, Madrid and London. In 2017, Wallapop launched an in-app payment
service, Wallapay, to further improve the transactions between its users. The company also launched a delivery service in the second half of the year, where Wallapop facilitates the delivery of the item.
Vostok New Ventures has in total invested approxi-mately USD 9 mln in three separate transactions during 2015. As per December 31, 2017, Vostok New Ventures indirectly owns approximately 2.9% of the company and values its indirect stake in the company to USD 13.5 mln on the basis of the latest primary transaction in the com-pany, adjusted for the latest transaction based valuation of Wallapop’s share in Letgo US, both of which closed in 2017.
wallapop.comWallapop
* Shares held indirectly through a limited partnership.
Share of total portfolio:
1.4%
21,872*Vostok New Ventures’ number of shares as at
December 31, 2017
13.5Total value (USD mln)
2.9%Share of
total shares outstanding
2015Investment
year
+17%Value development
2017 (in USD)
Investment Portfolio

��30����30��
Hemnet is Sweden’s largest online property portal, founded in 1998, with almost three million unique vis-itors each week to its mobile and desktop products. The popularity of Hemnet is unique and every day Swedes spend in total 12.5 years surfing on Hemnet.
In 2017, 204,000 homes for sale were published on Hemnet, an increase of 13% from 2016. During 2016, the company generated revenue of SEK 253.6 mln (2015: 182) and EBIT of SEK 67.4 mln (2015: 46.5), at the time of writing, Hemnet’s financial result for 2017 had not been published yet. Hemnet has a strong position in the Swedish market with substantial network effects through its relationships with real estate brokers and home sellers alike. Hemnet is in an excellent position to continue to grow its business.
During 2017 several key hires were made to Hemnet, including the recruitment of a new CEO – Cecilia Beck-Friis who has a long and successful background from media and digital companies. Erik Segerborg also joined from Avito as new head of strategy and marketing.
The investment in Hemnet was made together with Henrik Persson and Pierre Siri through a co-investment vehicle, YSaphis S.A., which alongside General Atlantic and Sprints Capital acquired a majority in Hemnet in December 2016.
hemnet.seHemnet
Key performance indicators January–November 2017• 204,000 total listings, up 13% yoy• SEK 546 bn in aggregated property value (asking price), up 24% yoy• 991 million clicks, up 25% yoy• 52,500 houses listed, up 11% yoy• 102,600 apartments listed, up 13% yoy• 2.8 million visitors per week, up 13% yoy
Vostok New Ventures invested SEK 93.3 mln (USD 10.3 mln) in YSaphis S.A., which translates into an equi-ty exposure of approximately 5.9% in Hemnet on a fully diluted basis immediately after closing. The transaction was closed in early January 2017. As per December 31, 2017, Vostok New Ventures values its investment on the basis of this transaction.
81,024,902Vostok New Ventures’ number of shares as at
December 31, 2017
11.2Total value (USD mln)
5.9%Share of
total shares outstanding
2016Investment
year
+9%*Value development
2017 (in USD)
* Attributable to currency exchange differences.
Investment Portfolio
Share of total portfolio:
1.2%

��31����31��
Merro is an investment holding company that focuses on online marketplace businesses with network effects in predominantly developing markets. Merro was founded in 2014 by Henrik Persson, Michael Lahyani and Pierre Siri. Henrik Persson was formerly Head of Investments at Kinnevik and is our partner from many ventures, most notably Avito. Michael Lahyani is the founder and CEO of Propertyfinder, the largest real estate property portal in the MENA region. Pierre Siri has a long background within online classifieds, which includes the role as CEO and investor in Blocket.se, the Swedish online classi-fieds asset that is today owned by Schibsted and in many ways the benchmark asset for online classifieds players globally.
Merro’s portfolio includes a number of investments, of which the majority of the NAV is online classifieds in the MENA region. The MENA investments are Opensooq, the leading online classifieds operator in the MENA region, Propertyfinder, the leading property vertical in the MENA region, Dubicars, a car classifieds website in the UAE. Selected other holdings are outlined below.
• Opensooq represents the largest value in Merro’s port-folio. Opensooq continues to grow its position in the MENA region with increasing traffic and usage across the 8 markets in which it operates. During any given month Opensooq generates 21 million leads from pros-pecting buyers to 1.2 million product listings, with 1.3 billion page views in total.
• Propertyfinder represents the second largest value in Merro’s portfolio. Over the past ten years, Property-finder has quickly become the leading real estate clas-sified website in the UAE, Qatar, Bahrain and Lebanon
and is growing in popularity in the Kingdom of Saudi Arabia, Egypt and Morocco.
• Dubicars generates nearly 1.5 million weekly page views and facilitates the sale of almost 1,000 cars per week across the UAE.
• Yta.se makes it easy to find your company’s next office. By combining an exhaustive marketplace of supply with a world class team of office experts and AI-au-tomation, Yta.se’s hybrid marketplace captures the entire leasing transaction.
• TipTapp, a mobile marketplace in Sweden which oper-ates “reverse classifieds” where consumers can post listings with products they will pay to get rid of, most often bulky trash that would otherwise have to be transported to a recycling center or similar.
• QuintoAndar is an end-to-end real estate rentals ser-vice in Brazil that connects landlords and tenants. With significant pain points within rental legislation in Brazil which effectively requires a co-signer to guar-antee rent obligations. QuintoAndar removes this fric-tion by baking in a free insurance product to the end users’ contract as well as improving the general pro-cesses of searching for properties, arranging viewings and contracts signing.
• CloudSight is a technology company that simplifies the creation of classifieds listings dramatically through its image recognition and classification API.
As per December 31, 2017, Merro is valued on basis of a sum of the parts (sotp)-valuation model as there has been no transaction in the company in the most recent 12 months. The sotp valuation is 24% lower than the latest transaction in the company, mainly driven by a revised valuation of Opensooq, which represents the majority of the fair value of Merro.
merro.coMerro
Share of total portfolio:
1.0%
10,900Vostok New Ventures’ number of shares as at
December 31, 2017
9.4Total value (USD mln)
22.5%Share of
total shares outstanding
2014/16Investment
years
-24%Value development
2017 (in USD)
Investment Portfolio

��32����32��
Naseeb Networks operates leading employment market-places in Pakistan (Rozee) and Saudi Arabia (Mihnati) focused on facilitating the matching between jobseek-ers and employment opportunities. Its complete range of end-to-end employment solutions are used by over 10,000 companies and 5 million job seekers, processing over 1.5 million job applications every month.
ROZEE.PK is Pakistan’s market leading employment marketplace used by over 65,000 employers and HR managers to find talent. The site is visited by over 60% of the country’s online population each and processes over 40,000 applications a day. ROZEE.PK won the pres-tigious Brand of the Year award from the Prime Minister of Pakistan two years in a row.
It is estimated the over 1,000,000 people have found jobs through ROZEE.PK.
naseebnetworks.com rozee.pk mihnati.comNaseeb Networks(Rozee and Mihnati)
As KSA’s largest indigenous hiring platform, Mihnati is intimately familiar with the unique challenges faced by Saudi employers. Ranging from working with the Ministry of Labor to navigating Nitaqat requirements, Mihnati solutions are tailor made for KSA. Mihnati has the country’s largest database of over 650,000 Saudi qualified professionals.
Back in 2013, Naseeb Networks completed its acqui-sition of Mihnati.com, Saudi Arabia’s largest indig-enous recruiting solutions provider. After its initial market dominance in Pakistan, Naseeb Networks has grown Mihnati’s profitability and visits by leveraging its advanced cloud based recruitment product portfolio, back office operations and business expertise in employ-ment marketplaces.
Vostok New Ventures invested USD 4.5 mln in Naseeb during 2015 in connection with a total funding round that amounted to USD 6.5 mln and included participa-tion from Piton Capital. As per December 31, 2017, Vostok New Ventures values Naseeb on the basis of a peer mul-tiples valuation model as the latest transaction is more than 12 months old. The model, based on EV/Sales mul-tiples of listed international peers in the recruitment and online classifieds space, generates a valuation of USD 4.2 mln for Vostok New Ventures’ stake in the company. This is 4% higher than Vostok New Ventures’ valuation as per December 31, 2016. The revaluation is driven by a decreased revenue forecast and higher peer multiples.
11,481,176Vostok New Ventures’ number of shares as at
December 31, 2017
4.2Total value (USD mln)
23.7%Share of
total shares outstanding
2015Investment
year
+4%Value development
2017 (in USD)
Share of total portfolio:
0.4%
Investment Portfolio
Rozee highlights• More than 5 million registered professionals• Over 75,000 employers with accounts on ROZEE.PK• 150+ new job postings each day• 45.5 million job applications processed• 7 million unique visitors per year

��33����33��
CarZar is a South African stats-based used cars mar-ketplace servicing consumers looking to sell their cars and auto dealers looking for inventory. CarZar prices the vehicles using national data and their own proprietary algorithm, to offer consumers a convenient way to sell their vehicle.
CarZar is founded and run by Michael Muller and Fernando Azevedo Pinherio out of Capetown, South Africa.
Vostok New Ventures invested USD 1.5 mln into CarZar during the second quarter of 2017 in the context of a larger financing round. In November 2017, Vostok New Ventures invested an additional USD 1.5 mln into the company. As per December 31, 2017, Vostok New Ventures values its investment in CarZar on the basis of this latest transaction in the company.
carzar.co.zaCarZar
Share of total portfolio:
0.4%
831Vostok New Ventures’ number of shares as at
December 31, 2017
3.5Total value (USD mln)
16.4%Share of
total shares outstanding
2017Investment
years
–Value development
2017 (in USD)
Investment Portfolio
Highlights• During May–December 2017, Carzar’s organic traffic grew by 262%• Vehicle acqusition grew by 200% in January 2018 compared to February 2017
��34����34��
Wuzzuf is one of the leading jobs verticals in Egypt. Its main competitor is Bayt, a regional jobs vertical centered around UAE. Wuzzuf focuses on white collar workers with English CVs. In terms of monthly jobs postings with-in this area it leads versus Bayt and is quickly catching up also in terms of traffic. It has as much as 27% of the market for new graduates looking for jobs in its focus area.
Interestingly also it has a second brand, Forasna, which focuses on the enormous and virtually untapped blue-collar market in Egypt. Although a younger venture compared to Wuzzuf, a successful product in this area is something that has a potential far beyond the borders of Egypt and with very little competition.
Wuzzuf was founded in 2009 by Ameer Sherif, an Egyptian national, who we believe is very driven. His ability to bootstrap the company, particularly through the political events of 2011, and turn it to profitability in 2014 is a testament to his dedication. The company is also backed by the US venture fund 500 Startups.
During the second quarter of of 2017, Vostok New Ventures invested an additional USD 0.2 mln in El Basharsoft in the form of secondary shares in the company.
As per December 31, 2017, Vostok New Ventures values its investment into el Basharsoft on the basis of a peer multiples valuation model as the latest primary transaction is more than 12 months old. The model, based on EV/Sales multiples of listed international peers in the recruitment and online classifieds space generates a valuation of USD 2.3 mln for Vostok New Ventures’ stake in the company. This is 68% higher than Vostok
basharsoft.com wuzzuf.net forasna.comEl Basharsoft(Wuzzuf and Forasna)
New Ventures’ valuation as per year-end 2016 driven by strong revenue growth, a positive outlook for 2018 and higher peer group multiples.
339Vostok New Ventures’ number of shares as at
December 31, 2017
2.3Total value (USD mln)
17.0%Share of
total shares outstanding
2015Investment
year
+68%Value development
2017 (in USD)
Share of total portfolio:
0.2%
2017 highlights• Wuzzuf and Forasna saw strong growth in 2017• Revenues grew by 2.1x yoy• Joblistings grew by 2x during the year• Strong market leading position in terms of listings as well as traffic
0
20
40
60
80
100
0
20
40
60
80
100
2014 2015 2016 2017 2018
Weekly interest over time, 5 years (March 2013–February 2018, highest point=100)T Wuzzuf (Egypt) T Forasna (Egypt) T Bayt (Egypt)
Source: Google Trends, March 2018
El Basharsoft staff, December 2016
Investment Portfolio

��35����35��
Vezeeta is the MENA leader in Healthcare IT platforms. The company is pioneering the shift to automate the booking world of doctors creating a healthcare ecosys-tem by connecting various healthcare providers using our other digital cloud based solutions.
Vezeeta is solving major problems faced by patients when trying to reach doctors. Vezeeta is offering a free user friendly online search engine and app where one can search for doctors by speciality, area, and fees. More than 20,000 patients’ reviews and rating are available to help patients decide on the doctor with the best medical service and the least waiting time.
During the third quarter of 2016, Vostok New Ventures invested USD 1.5 mln into Vezeeta in the con-text of a larger funding round. In April 2017, Vostok New Ventures invested an additional USD 0.33 mln in Vezeeta in an extension of the 2016 financing round. The extend-ed round finally closed in June 2017.
vezeeta.comVezeeta(DrBridge)
2017 highlights• UX Product updates resulting 30% better conversion• Updated new doctors’ app providing practice management, scheduling and a medical news feed• Reached 1 million likes on Facebook• Hit peak of 2,000 bookings per day in Egypt
358,069Vostok New Ventures’ number of shares as at
December 31, 2017
1.8Total value (USD mln)
7.9%Share of
total shares outstanding
2016/17Investment
years
+49%Value development
2017 (in USD)
Investment Portfolio
Share of total portfolio:
0.2%
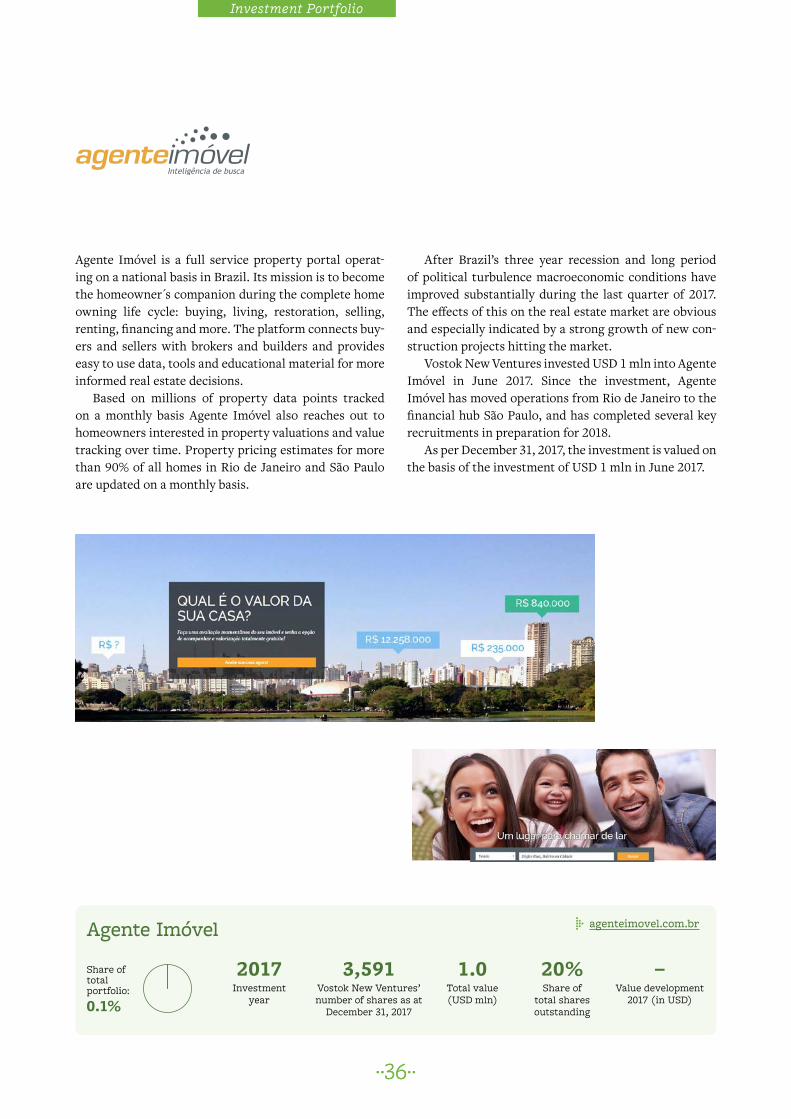
��36����36��
Agente Imóvel is a full service property portal operat-ing on a national basis in Brazil. Its mission is to become the homeowner s companion during the complete home owning life cycle: buying, living, restoration, selling, renting, financing and more. The platform connects buy-ers and sellers with brokers and builders and provides easy to use data, tools and educational material for more informed real estate decisions.
Based on millions of property data points tracked on a monthly basis Agente Imóvel also reaches out to homeowners interested in property valuations and value tracking over time. Property pricing estimates for more than 90% of all homes in Rio de Janeiro and São Paulo are updated on a monthly basis.
agenteimovel.com.brAgente Imóvel
After Brazil’s three year recession and long period of political turbulence macroeconomic conditions have improved substantially during the last quarter of 2017. The effects of this on the real estate market are obvious and especially indicated by a strong growth of new con-struction projects hitting the market.
Vostok New Ventures invested USD 1 mln into Agente Imóvel in June 2017. Since the investment, Agente Imóvel has moved operations from Rio de Janeiro to the financial hub São Paulo, and has completed several key recruitments in preparation for 2018.
As per December 31, 2017, the investment is valued on the basis of the investment of USD 1 mln in June 2017.
3,591Vostok New Ventures’ number of shares as at
December 31, 2017
1.0Total value (USD mln)
20%Share of
total shares outstanding
2017Investment
year
–Value development
2017 (in USD)
Share of total portfolio:
0.1%
Investment Portfolio

��37����37��
KEH AB is a holding company that owns a significant position in social media monitoring company YouScan.
KEH AB previously owned and operated Yell.ru and EatOut.ru.
Yell.ru is an online local search utility with user reviews about local companies and services in Russia. In December 2017, KEH entered into an agreement to sell all yell.ru related IP.
YouScan is a social media monitoring platform that helps brand owners to listen to consumer opinions post-ed online about their products and competitors, and manage their brands online. The company has seen strong growth during 2016 and 2017.
Vostok New Ventures values KEH AB on the basis of a valuation model for the holding in YouScan based on a revenue multiple plus the company cash balance and expected proceeds from the sale of Yell.ru. The main driver of the revaluation of KEH during 2017, despite the strong performance of YouScan, were disapointing developments of EatOut.ru, which was shut down, and Yell.ru. The majority of the fair value of KEH is attrib-utable to the holding in YouScan. Vostok New Ventures owns 33.9% of KEH AB as per December 31, 2017.
youscan.ioKEH AB(YouScan)
8,808,426Vostok New Ventures’ number of shares as at
December 31, 2017
1.5Total value (USD mln)
33.9%Share of
total shares outstanding
2014Investment
year
-57%Value development
2017 (in USD)
Share of total portfolio:
0.2%
Delivery Hero Delivery Hero (DHH) is a worldwide network of online food ordering sites with over 300,000 restaurants con-nected to its service. The company operates in 33 coun-tries across five continents, including Germany, Sweden, UK, Korea, China and India. Delivery Hero’s restaurant partners generate more than one billion USD in annual sales via online orders or mobile applications and deliver more than 14 million meals every month. Delivery Hero has more than 3,000 employees around the world.
Vostok New Ventures invested EUR 25 mln into senior secured debt of Delivery Hero in the summer of 2014. In August 2015, the loan was restructured which resulted in new terms including an additional equity component and an amended nominal interest rate. The new nominal interest rate was 7.25–10.25% and the loan maturity date was in August 2018.
In early July 2017 Delivery Hero (DH) repaid the EUR 25 mln loan following its listing on the Frankfurt stock exchange. As per December 31, 2017, the remaining equi-ty holding in is valued at USD 0.89 mln as per the last closing bid price in December 2017.
Kite VenturesKite Ventures is a global venture investment company spe-cializing in marketplace and transactional network invest-ments. The firm seeks to invest in companies in Europe and New York. Kite Ventures was founded in 2009 and has invested over USD 250 mln across 20 portfolio companies.
As per December 31, 2017 Vostok New Ventures no longer has an outstanding loan balance to Kite following a final repayment during the first quarter of 2017. Vostok New Ventures owns an equity component linked to Kite Ventures’ underlying portfolio, which as per December 31, 2017 is valued at zero.
Liquidity managementThe Company also has investments in money market funds, as part of its liquidity management operations. As per December 31, 2017, the liquidity management invest-ments are valued at USD 8 mln, based on the latest NAV of each fund.
Debt investments
Investment Portfolio

��38����38��
Corporate Governance Report
The current Swedish Corporate Governance Code (the “Code”) came into force on December 1, 2016. The rules of the Code are a supplement to the main provisions of the Swedish Companies Act (2005:551) regarding a company’s organization, but also to the relatively extensive self-regula-tion that exists for corporate governance. The Code is based on the principle of “comply or explain”. According to this principle a company may choose whether it wants to follow a clause in the Code, or explain why it has chosen not to.
CORPORATE GOVERNANCE CODE APPLICATION Vostok New Ventures Ltd (the “Company”) is an exempt-ed company established under the Bermuda Companies Act 1981. Since depository receipts representing the Company’s shares are listed on a Swedish regulated mar-ket, however, the Company endeavors to apply the Code. The Company will apply the Code in full to the extent it is compliant with the Bermudian Companies Act, or, where applicable, explain deviations from it. At present, the Company deviates from the Code in that it does not have an Internal Audit function and that the Board of Directors does not have a designated Audit Committee, as further explained below. The main principles of cor-porate governance in the Company are described below.
Shareholders’ meetingsThe Annual General Meeting (“AGM”) is the highest decision-making body of the Company, in which all shareholders are entitled to attend in person or by proxy. The AGM of the Company is held in Stockholm, Sweden, in the Swedish language, once per year, no later than six months after the end of the financial year. The task of the AGM is to report on the financial results and take deci-sions on corporate matters, including payment of divi-dends and amendments to the Articles of Association. The AGM also appoints members of the Board of Direc-tors and auditors, and establishes the remuneration of the Board of Directors and the auditors. The 2017 AGM was held on May 16, 2017.
Major ShareholdersThe largest shareholder – and the only shareholder with a holding representing more than 10 percent of the shares of the Company – is Ruane, Cunniff & Goldfarb (Ruane Cunniff), whose shareholding as at year-end 2017 amounted to 13,585,125 depository receipts, repre-senting a total of 16.1 percent of the outstanding shares
of the Company. The shares are held through various legal entities controlled by Ruane Cunniff. The next larg-est shareholder is Swedbank Robur Funds, with a total of 8,250,718 shares representing 9.8 percent of the shares and votes in the Company.
Nomination CommitteeShareholders in the Company have the right to nominate members of the Board of Directors, and auditors, to the AGM.
At the Company’s 2017 AGM it was resolved to estab-lish a Nomination Committee consisting of representa-tives of the three largest shareholders of the Company, as at the last banking day of August 2017. The Nomina-tion Committee for the 2018 Annual General Meeting consists of the following members: Jake Hennemuth, appointed by Ruane Cunniff, Evert Carlsson, appoint-ed by Swedbank Robur Funds, and Jonathan Green, appointed by Luxor Capital. At the Nomination Commit-tee’s first meeting Evert Carlsson was elected Chairman of the Committee. The Nomination Committee’s task is to prepare proposals for the following resolutions at the 2018 AGM: (i) election of the chairman of the AGM, (ii) the election of Board members, (iii) the election of the Chairman of the Board, (iv) the remuneration of the directors, (v) election of auditors and remuneration of the Company’s auditors, and (vi) proposals on the nom-ination process for the AGM 2019.
In proposing Board members for election at the AGM, the Nomination Committee is guided by section 4 of the Code, which contains provisions regarding diversity and breadth of qualifications, experience and background, gender equality, and the directors’ independence of the company, its executive management and major shareholders.
Appointment and Remuneration of the Board of Directors and the AuditorsRules on appointment and removal of Directors are con-tained in clauses 4.1.1 through 4.1.3 of the Company’s Bye-Laws, which are available on the Company’s website. Under the Bye-Laws, the Board shall consist of not less than 3 and not more than 15 directors with no alter-nate directors. The Board is appointed annually at the AGM for the period until the closing of the next AGM. The term of office of a director may be terminated pre-maturely at the director’s own request to the Board or by the general meeting. In addition, the office of a direc-
Corporate Governance

��39����39��
tor may be terminated prematurely by the Board upon the occurrence of any of the following events: (i) if he becomes of unsound mind or a patient for any purpose of any statute or applicable law relating to mental health; (ii) if he becomes bankrupt or compounds with his creditors; or (iii) if he is prohibited by law from being a director. Where a director’s term of office is terminated prematurely, then the other directors shall take steps to have a new director appointed by the general meeting, for the remaining term of the office. However, such new appointment may be postponed until the next AGM at which an election of directors shall take place, provided that the remaining directors form a quorum and that the remaining number of directors is not less than the pre-scribed minimum number of directors.
Auditors are elected by the AGM for a term of one year at a time.
The 2017 Board of DirectorsThe Company’s 2017 AGM resolved, in accordance with the Nomination Committee’s proposal, to re-elect Josh Blachman, Per Brilioth, Victoria Grace, Lars O Grön-stedt, Ylva Lindquist and Keith Richman, with Lars O Grönstedt as Chairman. All Directors are independent vis-à-vis the Company and its management, with the exception of Per Brilioth, who is Managing Director of the Company. All Directors are independent of the Com-pany’s major shareholders.
For a detailed presentation of the current Board, see the section “Board of Directors, group management and auditors”.
Board meetingsThe Board of Directors meets at least three times per year in person, and more frequently when necessary. In addi-tion, meetings are conducted by telephone if considered necessary, and, on occasion, resolutions may be passed by circulation. The Managing Director is in regular con-tact with the Chairman of the Board of Directors as well as with the other members of the Board of Directors.
Evaluation of the Board of Directors and Managing DirectorThe Chairman of the Board annually conducts an evalu-ation of the Board by distributing self-assessment forms and conducting one-on-one interviews with the other Board members with a view to assessing how well the Board functions and whether there are areas that need
improvement or competences that are deemed lacking. The Chairman compiles the results of the self-assess-ment forms and interviews and presents them to the Nomination Committee along with any issues raised by Board members during the year.
The Board evaluates the work of the Managing Direc-tor at one of the three regular in person meetings in the form of a discussion in camera (without management present) at which the perfomance of senior management is also discussed.
Work and ResponsibilitiesThe Board of Directors adopts decisions on overall issues affecting the Group which include preparing and issuing investment recommendations to the Board of the sub-sidiary. The Board of Directors’ primary duties are the organization of the Company and the management of the Company’s operations including: • Decisions regarding the focus of the business and
adoption of Company policies;• Supply of capital;• Appointment and regular evaluation of the work of the
Managing Director and Company management;• Approval of the reporting instructions for the Compa-
ny management;• Ensuring that the Company’s external communica-
tions are open, objective and appropriate for target audiences;
• Ensuring that there is an effective system for follow-up and control of the Company’s operations and financial position vis-à-vis the established goals; and
• Follow-up and monitoring that the operations are car-ied out within established limits in compliance with laws, regulations, stock exchange rules, and custom-ary practice on the securities market.
• As there is no Audit Committee appointed, the Board in its entirety is responsible for reviewing the finan-cial reports issued by the Company, including the four quarterly reports as well as the annual report, and for addressing any critical accounting issues, including:W matters of internal control and application of rele-
vant accounting principles and laws.W any uncertainties in presented values, changes in
estimates and appraisals.W significant events after the reporting period.W proposals for addressing established irregularities.W discussing any other issues that might affect the
quality of the Company’s reporting.
Corporate Governance

��40����40��
• The Board shall on a continuous basis (at least once a year) meet with the Company’s auditors to stay informed of the direction and extent of the audit. The Board and the auditors shall also discuss the coordina-tion between internal control and external audit and the auditors’ views on potential risks to the Company’s quality of reporting.
• The Board shall on an annual basis in connection with the end of the financial year, evaluate the performance by the Company’s auditors. They shall inform the nomination committee of the result of the valuation, to be considered when they nominate auditors for the Annual General Meeting (“AGM”).
• The Board shall further assist the nomination commit-tee in the process of nominating auditors and propos-ing the remuneration for the auditors.
Sub-committees of the BoardGiven the central role that valuation of unlisted holdings plays in the Company’s accounts, the Board has hith-erto taken the view that all Board members need to be informed and involved in the Company’s reporting. For this reason, the Board has not formed an Audit Comit-tee. The Board of Directors does not have any other sub-committees.
ManagementThe Managing Director, who is a member of both the Board of Directors as well as of group management, prepares and issues investment recommendations in co-operation with the other members of the Board. For a detailed presentation of the management, see the section “Board of Directors, group management and auditors”.
Group Management in 2017Per Brilioth: Managing Director.Nadja Borisova: Chief Financial Officer.Anders F. Börjesson: General Counsel.
A full description of the group management can be found on page 53 of the 2017 Annual Report.
Investor RelationsThe Investor Relations function of the Company is han-dled in-house by Björn von Sivers.
Remuneration of the Board of Directors and group managementRemuneration of the Company’s Board of DirectorsAt the 2017 AGM it was resolved that the remuneration of the Board of Directors be set at a total of USD 349 thousand, with USD 133 thousand to the Chairman and USD 54 thousand to each of the four other Directors who were not employed by the Company.
Remuneration of the senior managementThe remuneration principles for senior management currently in force were adopted at an Extra General Meeting held on May 18, 2007 and were last confirmed at the Annual General Meeting held on May 16, 2017 and read as follows:
“The remuneration to the Managing Director and other members of the senior management shall consist of fixed salary, variable remuneration, other benefits and pension benefits. Except for the Managing Director, the senior management currently includes two individuals. The total remuneration shall correspond to the prevailing
Composition of the Board of Directors, elected on May 16, 2017, including meeting attendanceName Elected to
the boardPosition Connection to
the CompanyAttended
Board meetingsAnnual Board fee,
USD thousand¹Lars O Grönstedt 2010 Chairman Independent 100% 133Josh Blachman 2013 Member Independent 100% 54Per Brilioth 2007 Member Management 100% –Victoria Grace 2015 Member Independent 100% 54Ylva Lindquist 2015 Member Independent 100% 54Keith Richman 2013 Member Independent 100% 54Number of meetings 12 349
1. The table shows the remuneration as resolved at the 2017 Annual General Meeting on May 16, 2017. Prior to that date, the remuneration had been USD 130 thousand to the Chairman and USD 53 thousand to ordinary Board members who were not employed by the Company, as resolved at the 2016 AGM.
Corporate Governance

��41����41��
market conditions and be competitive. The fixed and vari-able remuneration shall correspond to the respective indi-vidual’s responsibility and authority. The variable com-ponent should, in the first instance, be covered within the parameters of the Company’s option plan and shall, where payable in other instances, be subject to an upper limit in accordance with market terms and specific objectives for the Company and/or the individual. The period of notice of termination of employment shall be three to six months in the event of termination by the member of the senior man-agement. In the event of termination by the Company, the total of the period of notice of termination and the period during which severance compensation is payable shall not exceed 12 months. Pension benefits shall be either bene-fit-based or contribution based or a combination thereof, with individual retirement ages. Benefit based pension benefits are conditional on the benefits being earned during a pre-determined period of employment. The Board of Directors shall be entitled to deviate from these guidelines in individual cases should special reasons exist.”
In 2017, as in previous years, the Board deviated from these principles insofar as variable remuneration grant-ed to management was not based on “specific objectives for the company and/or the individual”, as required under the principles, which was motivated by the suc-cessful exit of Zameen at 2.4x, the Avito dividend, partial exit in Gett and the receipt of the final proceeds from the Quandoo exit. In its proposal to the 2018 AGM, the Board has proposed that the principles be updated to reflect the recent practice of the Board and to recti-fy a number other provisions which had become obso-lete, e.g., reference to option plan, which has since been replaced by a long term incentive program. The proposed principles are as follows:
“The Board of Directors proposes that the Meeting resolves to approve the following management remuner-ation principles etc. The remuneration to the Managing Director and other members of the senior management shall consist of fixed salary, variable remuneration, other bene-fits and pension benefits. Except for the Managing Director, the senior management currently includes two individuals.
The total remuneration shall correspond to the prevail-ing market conditions and be competitive. The fixed and variable remuneration shall correspond to the respective individual’s responsibility and authority. The variable component should, in the first instance, be covered with-in the parameters of the Company’s Long Term Incentive Plan and shall, where payable in other instances, be related
to milestone accomplishments of the Company and/or its portfolio investments, e.g., particularly successful invest-ments, exits or similar events.
The period of notice of termination of employment shall be three to six months in the event of termination by the member of the senior management. In the event of termi-nation by the Company, the total of the period of notice of termination and the period during which severance com-pensation is payable shall not exceed 12 months.
Pension benefits shall be contribution based with indi-vidual retirement ages.
The Board of Directors shall be entitled to deviate from these guidelines in individual cases should special reasons exist.”
In 2017, the Managing Director received a fixed annu-al salary of approximately USD 478 thousand and was awarded an ex gratie payment in the amount of USD 515 thousand. The Managing Director has a pension plan based on Swedish market practice, which is accounted for as a defined contribution plan in accordance with IAS 19. The premium is calculated on the basis of the Manag-ing Director’s base salary. The Managing Director is enti-tled to 12 months’ full salary in the event of termination by the Company. Should he himself choose to resign the notice period is six months.
The combined fixed annual salary to the other senior executives amounted to a total of approximately USD 381 thousand. In 2017, the senior management was also awarded ex gratie payments in the aggregate amount of USD 154 thousand. The other senior executives have a pension plan based on Swedish market practice, which is accounted for as a defined contribution plan in accor-dance with IAS 19. The premium is calculated on the basis of base salary. The employment agreements of the other members of the group management have a mutual notice period of three months.
In awarding the ex gratie payments to the Managing Director and senior management despite the absence of specific objectives communicated to the beneficiaries in advance, the Board relied on its right to deviate from the guidelines as set out above. The deviation was motivat-ed by the successful exit in several portfolio companies during 2016.
Share repurchase authorizationWhile share repurchases in Swedish companies require authorization by the General Meeting, neither Bermu-dan company law nor the Company’s Bye-Laws contains
Corporate Governance

��42����42��
any restriction against repurchasing own shares. On May 16, 2016, Vostok New Ventures disclosed that the Company’s Board of Directors had resolved to renew the buy-back mandate of up to 10 percent of the SDRs that were outstanding of the time of the resolution. The Board resolved on a renewed mandate for an aditional 10 percent of outstanding SDRs on August 11, 2017. During 2017, Vostok New Ventures repurchased a total of 50,507 SDRs under the 2016 mandate and renewed 2017 man-date. The bought back shares are held in treasury and may be used to settle future obligations to participants in the Company’s share-based long term incentive pro-grams (see below).
Incentive programIncentive program for the CompanyA share-based incentive program was adopted at the Annual General Meeting held on May 5, 2010 (the “2010 Incentive Program”). The program is described in detail in note 23. A total of 100,000 call options under the 2010 Incentive Program are outstanding as at December 31, 2017.
Incentive program for the Company’s portfolio companiesAt an Extra General Meeting held on August 29, 2007, an incentive program was adopted under which the Compa-ny may issue and transfer call options to members of the executive management and other employees related to investments in non-listed portfolio companies to create opportunities for employees to take part in any future increase in value. By enabling the Company’s employees to subscribe for call options of shares in portfolio com-panies, opportunities are created for employees to take part in any future increase in value, in a similar mode as for individuals that are working within so-called private equity companies. The options shall entitle the holder to acquire shares in the portfolio company from Group companies at a certain exercise price corresponding to 110–150 percent of the market value of the shares in the portfolio company at the time of the transfer of the options. The term of the options shall be no longer than five years. The Company shall be entitled to repurchase the options at market value if the holder ceases to be an employee of the Group. The number of options issued can correspond to no more than 10 percent of the under-lying shares in a portfolio company owned by Vostok New Ventures. The Directors of the Board who are not
employed by the Company shall not be entitled to partic-ipate in the program. As of yet no call options have been granted under this program.
Share-based incentive program (LTIP 2016)At the 2016 Annual General Meeting held on May 17, 2016, it was resolved to implement a share-based long-term incentive program for management and key per-sonnel in the Vostok New Ventures group. The program runs from January 1, 2016 through March 31, 2019, and encompasses a maximum of 430,000 shares, correspond-ing to a dilution of 0.59% of the total number of shares outstanding. Program participants purchase shares in the Company, and for each purchased share is entitled to receive a number of additional shares, so-called perfor-mance shares, free of charge, subject to fulfillment of a performance condition set by the Board of Directors on the basis of the Company’s Net Asset Value. Pursuant to IFRS 2, the costs for the program will be reported over the profit and loss statement during the vesting period (August 31, 2016 through December 31, 2018).
The rights to receive shares automatically convert into ordinary shares (Swedish Depository Receipts) at the end of the program at an exercise price of nil. The participants do not receive any dividends and are not entitled to vote in relation to the rights to receive shares during the vesting period. If a participant ceases to be employed by the group within this period, the rights will be forfeited, except in limited circumstances that are approved by the Board on a case-by-case basis.
Share-based incentive program (LTIP 2017)At the 2017 Annual General Meeting held on May 16, 2017, it was resolved to implement a share-based long-term incentive program for management and key per-sonnel in the Vostok New Ventures group. The program runs from January 1, 2017 through March 31, 2020, and encompasses a maximum of 450,000 shares, correspond-ing to a dilution of 0.53% of the total number of shares outstanding. Program participants purchase shares in the Company, and for each purchased share is entitled to receive a number of additional shares, so-called perfor-mance shares, free of charge, subject to fulfillment of a performance condition set by the Board of Directors on the basis of the Company’s Net Asset Value. Pursuant to IFRS 2, the costs for the program will be reported over the profit and loss statement during the vesting period (May 16, 2017 through December 31, 2019).
Corporate Governance

��43����43��
The rights to receive shares automatically convert into ordinary shares (Swedish Depository Receipts) at the end of the program at an exercise price of nil. The participants do not receive any dividends and are not entitled to vote in relation to the rights to receive shares during the vesting period. If a participant ceases to be employed by the group within this period, the rights will be forfeited, except in limited circumstances that are approved by the Board on a case-by-case basis.
Other matters related to remunerationThere are no agreements on severance payment or pensions for the Board of Directors with the exception for the Managing Director in his capacity as Managing Director, see “Remuneration to the Managing Director and other senior executives” above. Except as otherwise stated there are no reserved or accrued amounts in the Company for pensions or other post-employment remu-nerations or post-assignment for members of the Board of Directors or the senior executives.
AuditorsAt the Company’s AGM held on May 16, 2017, the audit firm PricewaterhouseCoopers AB, Sweden, was appoint-ed as auditor for the period up to the next AGM.
Ulrika Ramsvik, born 1973. Authorized Public Accoun-tant, Auditor in charge. Auditor in the Company since 2012. PricewaterhouseCoopers AB, Gothenburg, Sweden.
Bo Hjalmarsson, born 1960. Authorized Public Accoun-tant, Co-signing auditor. Auditor in the Company since 2014. PricewaterhouseCoopers AB, Stockholm, Sweden.
During the year, the auditing firm has not had any other significant assignments from Vostok New Ventures in addition to auditing work specified in the section “Inde-pendent Auditor’s Report” on pages 84–86.
Internal controlThe Board of Directors is responsible for the Company’s organization and administration of the Company’s activ-ities, which includes internal control. Internal control in this context regards those measures taken by the Com-pany’s Board of Directors, management and other per-sonnel, to ensure that bookkeeping, asset management and the Company’s financial condition in general are
controlled in a reliable fashion and in compliance with relevant legislation, applicable accounting standards and other requirements for listed companies. This con-trol is exercised by the Board in its entirety. This report on internal control is made in accordance with section 7.4 of the Code, which governs internal control over the financial reporting, and in accordance with guidance provided by FAR, the institute for the accounting pro-fession in Sweden, and by the Confederation of Swedish Enterprise.
Vostok New Ventures is an investment company whose main activity is the management of financial investments. As such, the Company’s internal control over financial reporting is focused primarily on ensur-ing an efficient and reliable process for managing and reporting on purchases, sales and holdings of shares and equity-related instruments. According to the Swedish Corporate Governance Code, the board shall ensure that the company has an adequate internal control and shall continuously evaluate the company’s internal control system. Since Vostok New Ventures is a relatively small organization, the Board has decided that an internal audit function is not needed, since the internal control can be maintained through the work methods described above. The system of internal control is normally described in terms of five different areas that are a part of the interna-tionally recognized framework introduced in 1992 by The Committee of Sponsoring Organizations in the Treadway Commission (COSO). These areas, described below, are control environment, risk assessment, control activities, information and communication and monitoring.
Management continuously monitors the Company’s operations in accordance with the guidelines set out below.
Control environmentThe control environment, which forms the basis of inter-nal control over financial reporting, to a large extent exists of the core values which the Board of Directors commu-nicate and themselves act upon. Vostok New Ventures’ ambition is that values such as precision, professionalism and integrity should permeate the organization. Another important part of the control environment is to make sure that such matters as the organizational structure, chain of command and authority are well defined and clearly communicated. This is achieved through written instruc-tions and formal routines for division of labor between the Board of Directors on the one hand, and management
Corporate Governance

��44����44��
and other personnel on the other. The Board of Directors establishes the general guidelines for Vostok New Ven-tures’ core business, which comprises purchases, sales and holdings of shares and equity-related instruments. To ensure a reliable and easily foreseeable procedure for purchases and sales of securities the Company has estab-lished a sequential process for its investment activities. The Board of Directors as a whole is responsible for iden-tifying and reviewing potential investments or divest-ments. After review, a majority is needed to issue a recom-mendation for sale or purchase, upon which investment decisions are formally made by the board of directors of Vostok New Ventures (Cyprus) Limited. As for the invest-ment process, as for all other company activities they are governed by internal guidelines and instructions. Vostok New Ventures has a small and flat organizational struc-ture. The limited number of staff members and the close cooperation among them contribute to high transparency within the organization, which complements fixed formal control routines. Vostok New Ventures’ Chief Financial Officer is responsible for the control and reporting of the Company’s consolidated economic situation to manage-ment and Board of Directors.
Risk assessmentThe Board of Directors of Vostok New Ventures is responsible for the identification and management of significant risks for errors in the financial reporting. The risk assessment specifically focuses on risks for irregu-larities, unlawful benefit of external parties at Vostok New Ventures’ expense and risks of loss or embezzle-ment of assets. It is the ambition of Vostok New Ventures to minimize the risk of errors in the financial reporting by continuously identifying the safest and most effec-tive reporting routines. An internal control review is performed by management and assessed by the Board of Directors on a quarterly basis in connection with the review of the Company’s quarterly reports. The Com-pany’s flat organizational structure and open internal communication facilitate the work to identify potential shortcomings in the financial reporting, and also simpli-fy implementation of new, safer routines. The Board of Directors puts most effort into ensuring the reliability of those processes that are deemed to hold the greatest risk for error or where potential errors would have the most significant negative effect. Among other things this includes establishing clearly stated requirements for the classification and description of income statement and
balance sheet items according to generally accepted accounting principles and applicable legislation. Anoth-er example is the routine of a sequential procedure for investment recommendations and approvals of the same.
Control activitiesTo verify compliance with the requirements and routines established in response to the risk assessment made, a number of concrete control activities need to be put in place. The purpose of the control activities is to prevent, detect and rectify any weaknesses and deviations in the financial reporting. For Vostok New Ventures’ part such control activities include the establishment of verifiable written decisions at every instance in the investment pro-cedure. In addition, after every completed transaction, purchase or sale, the whole process is examined to verify the validity of the transaction, from recommendation to approval, execution and entry of the transaction into the Company’s books. Bank and share ledger reconciliations are also performed and compared to reported financial statement items. Control activities also include permanent routines for the presentation and reporting of company accounts, for example monthly reconciliations of Vostok New Ventures’ assets and liabilities as well as quarterly rec-onciliation of portfolio changes. Special focus is also put on making sure that the requirements and routines for the accounting procedure, including consolidation of accounts and creation of interim and full year reports comply with pertinent legislation as well as generally accepted account-ing principles and other requirements for publicly listed companies. Controls have also been carried out to ensure that the IT-/computer systems involved in the reporting process have a sufficiently high dependability.
Regulatory ComplianceVostok New Ventures acknowledges the importance of complying with international best practice in relation to such fields as anti-bribery, anti-money laundering and international sanctions. These issues become all the more relevant with the Company’s expanding geographic footprint, which includes jurisdictions which are subject to international sanctions and with a percieved height-ened risk for corruption. To ensure full compliance by the Company and its portfolio companies with interna-tional norms, the Company has commissioned a tailored Compliance Tool Box, which includes checklists for use before and after investing, due diligence questionnaires and model contract clauses, all with the aim of ensuring
Corporate Governance

��45����45��
that compliance permeates all aspects of the investment process. Now in its second year of operation, manage-ment is still implementing and adjusting its content to make sure that the right balance between stringent con-trol and expediency are maintained.
Information and communicationVostok New Ventures has tried to ensure an efficient and accurate provision of information internally and exter-nally. For this purpose the Company has established fixed routines and invested in reliable technical appli-cations to guarantee a fast and reliable way of sharing information throughout the organization. Internal pol-icies and general guidelines for financial reporting are communicated between the Board of Directors, manage-ment and other personnel through regular meetings and e-mails. Vostok New Ventures’ flat organizational struc-ture and limited number of staff members further con-tributes to the efficient sharing of accurate information internally. To ensure the quality of the external report-ing, which is an extension of the internal reporting, there is a written communication policy which sets out what information shall be communicated and how it shall be communicated.
MonitoringThe Board of Directors receives monthly NAV reports and detailed quarterly reports on Vostok New Ventures’ financial position and changes in its holdings. The Com-pany’s financial situation and strategy are discussed at every board meeting, as well as any problems in the busi-ness and financial reporting since the last board meet-ing. Potential reported shortcomings are followed up via management. The Company prepares interim reports four times annually which are reviewed by the board. A review of the Company’s accounts is also performed by the Auditors at least once a year in addition to the com-prehensive audit in connection with the Annual Report.
Vostok New Ventures is in full compliance with the NOREX member rules for issuers, which are rules and regulations for members and trading in the SAXESS system for each exchange in the NOREX-alliance, i.e. Nasdaq Nordic Exchanges in Copenhagen, Helsinki, Ice-land and Stockholm, and Oslo Börs. There has not been any infringement to fair practices on the Swedish stock market.
AUDITOR’S REPORT ON THE CORPORATE GOVERNANCE STATEMENTTo the general meeting of the shareholders in Vostok New Ventures Ltd, corporate identity number 39861.
Engagement and responsibilityIt is the board of directors who is responsible for the cor-porate governance statement for the year 2017 on pages 38–45 and that it has been prepared in accordance with the Swedish Annual Accounts Act.
The scope of the auditOur examination has been conducted in accordance with FAR’s auditing standard RevU 16 The auditor’s examina-tion of the corporate governance statement. This means that our examination of the corporate governance state-ment is different and substantially less in scope than an audit conducted in accordance with International Stan-dards on Auditing and generally accepted auditing stan-dards in Sweden. We believe that the examination has provided us with sufficient basis for our opinions.
OpinionsA corporate governance statement has been prepared. Disclosures in accordance with chapter 6 section 6 the second paragraph points 2-6 of the Swedish Annu-al Accounts Act and chapter 7 section 31 the second paragraph the same law are consistent with the annual accounts and the consolidated accounts and are in accor-dance with the Swedish Annual Accounts Act.
Stockholm, March 28, 2018
PricewaterhouseCoopers AB
Ulrika Ramsvik Authorized Public Accountant
Auditor in charge
Bo HjalmarssonAuthorized Public Accountant
Corporate Governance

��46����46��
Company information
Vostok New Ventures LtdBermuda
Bond 2017/2020 debt
Vostok New Ventures (Cyprus) LimitedCyprus100%
Vostok New Ventures AB Sweden 100%
Vostok Co-Investment Coöperatief B.A. The Netherlands
El Basharsoft (Wuzzuf) 17.0%
Naseeb Networks (Rozee) 23.7%
Hemnet 5.9% Avito 13.2%
Merro 22.5%BlaBlaCar 9.3%
CarZar 16.4%Gett 3.6%
Vezeeta 7.9%Propertyfinder 10.1%
babylon 10.0%
OneTwoTrip 16.7%
Wallapop 2.9%
KEH AB (YouScan) 33.9%
Agente Imóvel 20.0%
Delivery Hero 0.1%
Vostok New Ventures Group organization structure as at December 31, 2017
Corporate Governance

��47����47��
BackgroundVostok New Ventures Ltd (“Vostok New Ventures”, the “Company”) was incorporated in Bermuda on April 5, 2007 with corporate identity number 39861. Swedish Depository Receipts (SDRs) representing the Vostok New Ventures shares are listed on the Nasdaq Nordic Exchange Stockholm, Mid Cap segment with the ticker: VNV SDB. There were approximately 8,000 shareholders as at the end of December 2017.
Group structureAs of December 31, 2017, the Vostok New Ventures Ltd Group consisted of the Bermudian parent company Vostok New Ventures Ltd; one wholly-owned Cypriot subsidiary, Vostok New Ventures (Cyprus) Limited; one controlled Dutch cooperative, Vostok Co-Investment Coöperatief B.A.; and one wholly-owned Swedish sub-sidiary, Vostok New Ventures AB.
The parent company’s business is to act as the hold-ing company of the Group and therefore own, manage and finance the holding in its wholly owned Cypriot subsidiary, Vostok New Ventures (Cyprus) Limited. Vostok New Ventures (Cyprus) Limited is responsi-ble for the Group’s portfolio (in some cases via Vostok Co-Investment Coöperatief B.A). Vostok New Ventures AB provides information and support services to the par-ent company.
Operating policyBusiness conceptVostok New Ventures is an investment company with the business concept of using experience, expertise and a widespread network to identify and invest in assets with considerable potential for value appreciation, with a focus on companies with network effects.
The sector mandate is broad and the proposition is to create shareholder value by investing in assets that are associated with risks which Vostok New Ventures is well-equipped to manage. Such typical risks include corporate governance risks, liquidity risks and operational risks.
StrategyThe Company’s investment strategy is to run invest-ments into primarily equity holdings in private compa-nies with a high return potential.
Organisation of activitiesThe Board of Directors meets in person at least three times a year and more frequently if needed. In addition to this, meetings are conducted by telephone confer-ence when necessary. Between meetings, the Managing Director has regular contact with the Chairman of the Board and the other Board members. The Board of Directors adopts decisions on overall issues affecting the Vostok New Ventures group.
The Managing Director prepares and issues invest-ment recommendations in cooperation with the other members of the Board of Directors.
Recommendations on investments are made by the Board of Directors of the parent company to the Board of the Cypriot subsidiary. Investment decisions are then taken by the Board of Directors of Vostok New Ventures (Cyprus) Limited.
More information on the organisation of the Company’s activities is provided in the Administration Report and the Corporate Governance Report.
Corporate Governance

��48����48��
The Vostok New Ventures share
Share informationAll the shares carry one vote each. The shares are traded as depository receipts (SDR) in Stockholm, where Pareto Securities AB is the custodian bank. A depository receipt carries the same dividend entitlement as the underlying share and the holder of a depository receipt has a cor-responding voting right at shareholders’ meetings. The holder of a depository receipt must, however, follow cer-tain instructions from the custodian bank in order to have the right to participate in shareholders’ meetings.
DividendsNo dividend has been proposed for the year.
Buy-back of own sharesWith a view to limiting a possible net asset discount and maximizing shareholder value, the Vostok New Ventures articles of association provide that the Company may buy back its own shares. Such purchases may be made within the stipulated capital limits, provided that the bought back shares are immediately canceled.
On May 16, 2016, Vostok New Ventures disclosed that the Company’s Board of Directors had resolved to renew the buy-back mandate of up to 10 percent of the SDRs that were outstanding of the time of the resolution. The Board resolved on a renewed mandate for an adition-al 10 percent of outstanding SDRs on August 11, 2017. During 2017, Vostok New Ventures repurchased a total of 1,105,952 SDRs (2016: 50,507) SDRs under the two mandates. The bought back shares are held in treasury and may be used to settle future obligations to partici-pants in the Company’s share-based long term incentive program (see above).
New shares issuedNo new shares were issued during 2017.
The marketThe Vostok New Ventures share (SDR) is traded on Nas-daq Stockholm, Mid Cap segment since July 4, 2007.
Share turnoverThe average daily turnover during 2017 was 108,000 shares (2016: 100,000 shares). Trading has been con-ducted 100 percent of the time.
Codes Assigned to Vostok New Ventures’ ShareRecent and historic quotes for Vostok New Ventures’ share are easily accessible on a number of business por-tals as well as via professional financial and real-time market data providers. Below are some of the symbols and codes under which the Vostok New Ventures share can be found.
ISIN Code: SE0007278965Nasdaq Stockholm short name (ticker): VNV SDBReuters: VNVsdb.STYahoo Finance: VNV-SDB.STGoogle Finance: STO:VNV-SDBBloomberg: VNVSDB:SS
Largest shareholders as per December 31, 2017The shareholder list below as per December 31, 2017, shows the ten largest owners at that time. The number of shareholders in Vostok New Ventures on December 31, 2017 amounted to around 8,000 (2016: 8,700).
Owner Holding, SDRs
Holding, percent
01 Ruane, Cunnif & Goldfarb Inc.* 13,585,125 16.1%02 Swedbank Robur Funds 8,250,718 9.8%03 Alecta Pension Insurance 7,650,000 9.0%04 T Rowe Price* 5,142,704 6.1%05 Fidelity Funds* 4,349,396 5.1%06 Second Swedish National Pension Fund 4,276,599 5.1%07 Luxor Capital Group L.P.* 4,151,367 4.9%08 Armor Advisors LLC* 3,567,000 4.2%09 Catella Funds 1,524,176 1.8%10 Carnegie Funds 1,330,000 1.6%
10 largest owners 53,827,085 63.6%Other 30,755,272 36.4%Total (approx. 8,000 owners) 84,582,357 100.0%
* As per latest notification to the Company or latest regulatory filing.
Source: Euroclear Sweden AB and holdings known to Vostok New Ventures.
Corporate Governance

��49����49��
0 0
10 100
20 200
300
400
30
40
50
70
80
100
90
60
Jan2016
Jan2017
Apr AprJul JulOct Oct
Vostok New Ventures share price development 2016–2017T Vostok New Ventures SDR, SEK (left axis)T RTS Index, adjusted (left axis)T MSCI Emerging Markets Index, adjusted (left axis)T Vostok New Ventures average daily turnover, ’000 SDRs (right axis)
Sources: Nasdaq Sweden, Moscow Exchange, MSCI
Corporate Governance

��50����50��
Income statement in brief(Expressed in USD thousands) 2017 2016 2015 2014 2013
Result from financial assets 167,691 133,840 120,812 -124,540 374,411Dividend/coupon and other operating income 1,357 6,760 31,544 4,316 885Operating expenses -6,305 -6,666 -5,196 -4,296 -10,614Dividend withholding tax expenses/repayments – – – – -23Operating result 162,743 133,934 147,160 -124,521 364,659
Net financial items -1,289 1,630 -1,911 -2,877 148Result before tax 161,454 135,563 145,250 -127,398 364,807
Tax -68 -89 -68 -48 -182Net result for the year 161,386 135,474 145,182 -127,446 364,626
Balance sheet in brief(Expressed in USD thousands) Dec 31, 2017 Dec 31, 2016 Dec 31, 2015 Dec 31, 2014 Dec 31, 2013
Non-current fixed assets 53 48 – 5 11Non-current financial assets 900,047 715,656 486,988 375,530 388,828Current financial assets – 7,699 9,072 – 1,261Cash and cash equivalents 51,079 34,780 43,660 14,050 246,572Tax receivables and other current receivables 2,600 7,147 392 374 460Total assets 953,779 765,330 540,111 389,959 637,133
Equity 879,990 725,516 503,435 388,470 633,966Long-term debts 71,541 32,400 – – –Current tax liability 431 412 393 369 402Other current liabilities and accrued expenses 1,817 7,002 36,282 1,120 2,764Total equity and liabilities 953,779 765,330 540,111 389,959 637,133
Cash flow in brief(Expressed in USD thousands) 2017 2016 2015 2014 2013
Cash flow from operating activities -10,892 -25,926 12,411 –112,452 216,667Cash flow from investing activities – -52 – – -4Cash flow from financing activities 19,059 20,715 16,883 -117,919 -1,929Cash flow for the year 8,166 -5,263 29,294 -230,371 214,735
Exchange rate differences in cash and cash equivalents 8,133 -3,618 315 -2,152 -4Cash and cash equivalents at the beginning of the year 34,780 43,660 14,050 246,572 31,841Cash and cash equivalents at the end of the year 51,079 34,780 43,660 14,050 246,572
Financial summary
Corporate Governance

��51����51��
Key ratios2017 2016 2015 2014 2013
Equity ratio, percent 92.26 94.80 93.21 99.62 99.50Return on equity, percent 18.06 21.18 32.56 -24.93 75.68Return on capital employed, percent 18.06 21.18 32.56 -24.93 75.68Debt/equity ratio, multiple 0.08 0.04 – – –Interest coverage ratio, multiple 22.37 72.68 – – –Net asset value, MUSD 880 726 503 388 634¹Exchange rate at balance sheet date,SEK/USD 8.2322 9.0971 8.3524 7.8117 6.5084Net asset value, MSEK 7,244 6,600 4,205 3,035 4,126¹RTS Index 1,154.43 1,152.33 757.04 790.71 1,442.73Development RTS Index, percent 0.2 52.2 -4.3 -45.2 -5.5MSCI Emerging Markets Index 1,158.45 862.28 794.14 956.31 1,002.69Development MSCI Emerging Markets Index, percent 34.3 8.6 -17.0 -4.6 -5.0
Share dataEarnings per share, USD 1.89 1.77 1.97 -1.62 4.10Diluted earnings per share, USD 1.89 1.77 1.97 -1.62 4.10Net asset value per share, USD 10.40 8.47 6.85 5.24 7.05¹Net asset value per share, SEK 85.65 77.02 57.21 40.95 45.89¹Net asset value development per share in USD, percent 23 24 31 -39 1102Net asset value development per share in USD including the effect of the redemption programs, percent 23 24 31 -39 92Number of shares outstanding at year-end 84,582,357 85,688,309 73,499,555 74,097,331 89,903,020Weighted average number of shares outstanding 85,263,922 76,544,877 73,573,384 78,489,261 88,899,415– diluted 85,404,011 76,544,877 73,573,384 78,489,261 88,923,775
EmployeesAverage number of employees during the period 5 6 4 4 6
1. After distribution of holdings in Black Earth Farming Limited and RusForest AB to the shareholders through the 2013 redemption program.2. Excluding the effect of the redemption programs.
Definitions of the key ratiosEquity ratio, percentEquity ratio is defined as Shareholders’ equity in relation to total assets.
Return on equity, percentReturn on equity is defined as net result for the year divided by average equity.
Return on capital employed, percentReturn on capital employed is defined as net result plus interest expenses plus/less exchange differences on financial loans divided by the average capital employed (the average total assets less non-interest bearing liabilities over the year).
Debt/equity ratio, multipleDebt/equity ratio, multiple is defined as interest-bearing liabilities in relation to Shareholders’ equity.
Interest coverage ratioInterest coverage ratio is defined as net result plus interest and taxes divided by interest expenses.
RTS IndexA Russian stock market index consisting of Russia’s 50 most liquid and capitalized shares. The RTS Index is denominated in USD.
Development of RTS indexChange in index compared to previous accounting year.
Development of MSCI Emerging Markets indexChange in index compared to previous accounting year.
Net asset valueNet asset value is defined as shareholders’ equity.
Earnings/share, USDis defined as result for the period divided by the adjusted average weighted number of shares for the year.
Diluted earnings/share, USDis defined as result for the year divided by the adjusted average weighted number of shares for the year calculated on a fully diluted basis.
Net asset value per share, USDShareholders’ capital divided by the number of shares outstanding at year-end.
Net asset value development per share in USD, percentChange in net asset value per share in USD compared with previous accounting year, in percent.
Corporate Governance

��52����52��
Board, management and auditors
Board of DirectorsLars O GrönstedtChairmanSwedish citizen, born 1954. Member of the board since 2010 and Chairman since 2013. Lars O Grönstedt holds a BA in languages and literature from Stockholm University and an MBA from Stockholm School of Economics. Mr. Grönstedt spent most of his professional life at Handelsbanken. He was CEO of the bank 2001–2006 and Chairman 2006–2008. Today he is, among other things, senior advisor to NordStream 2, chair-man of Manetos AB and Manetos Smart Buildings AB, Eastnine AB, Realcap Ventures AB and Vostok Emerging Finance Ltd, deputy chairman of the Swedish National Debt Office and speaker of the elected body of repre-sentatives of Trygg-Stiftelsen. Holdings in Vostok New Ventures: 4,400 SDRs (including holdings through an endowment insurance). Remuneration: USD 133 thou-sand. No agreement regarding severance pay or pension.
Josh BlachmanBoard memberUS citizen, born 1974. Member of the board since 2013. Josh Blachman is a Founder and Managing Director of Atlas Peak Capital, an investment firm focused on pri-vate technology companies. Prior to co-founding Atlas Peak Capital, Josh Blachman was a Vice President at Saints Capital where he completed a variety of invest-ments in private technology companies. Previously, Josh Blachman worked in the Corporate Development groups at Microsoft and Oracle where he evaluated and executed both acquisitions and investments. Josh Blachman holds Bachelor and Master of Science degrees in Industrial Engineering from Stanford University and an MBA from the Stanford Graduate School of Business. Holdings in Vostok New Ventures: none. Remuneration: USD 54 thousand. No agreement regarding severance pay or pension.
Victoria GraceBoard memberUS citizen, born 1975. Member of the board since 2015. Victoria Grace is Founding Partner of Colle Capital Partners, LP, an opportunistic, early stage technology venture fund. Previously, Ms Grace has been a part-ner at Wall Street Technology Partners LP, a mid-stage technology fund, and a Director at Dresdner Kleinwort Wasserstein Private Equity Group. Ms Grace has also worked for a Los Angeles-based venture capital/incuba-tor firm and in investment banking at Salomon Brothers, and has extensive experience in originating, structur-ing and monitoring venture capital transactions. Ms Grace holds a B.A. in Economics and Biochemistry from Washington University in St. Louis. Holdings in Vostok New Ventures: 2,500 through closely related person. Remuneration: USD 54 thousand. No agreement regard-ing severance pay or pension.
Ylva LindquistBoard memberSwedish citizen, born 1961. Member of the board since 2015. Ylva Lindquist is Vice President & General Counsel, EMEIA, at Xylem Inc., supporting all Xylem entities in Europe, Middle East, India and Africa. Xylem is a leading global water technology company with oper-ations in more than 150 countries with annual revenue of approx. USD 4 billion and 12,500 employees. Xylem Inc. is listed on the New York Stock Exchange. Prior to join-ing Xylem, Ylva Lindquist was Partner at Hammarskiöld & Co and prior to that an associate at Lagerlöf & Leman Advokatbyrå. She has also been a law clerk at Stockholm City Court. Ylva Lindquist holds a Master of Laws from Stockholm University. Holdings in Vostok New Ventures: none. Remuneration: USD 54 thousand. No agreement regarding severance pay or pension.
Corporate Governance

��53����53��
Keith RichmanBoard memberUS citizen, born 1973. Member of the board since 2013. Professional and educational background: Keith Richman is Founder and President of Defy Media, an Internet entertainment community for men. Prior to co-found-ing Defy Media, Keith Richman was the Co-Founder and Vice-President of OnePage (acquired by Sybase 2002) and Co-Founder and Director of Business Development for Billpoint Inc. (acquired by eBay in 1999). Previous posts include Director of Corporate Planning at the Walt Disney Company, where he focused on consumer prod-ucts, cable and emerging media. Keith Richman holds Bachelor and Master of Arts degrees in International Policy Studies from Stanford University. Holdings in Vostok New Ventures: 10,057 SDRs. Remuneration: USD 54 thousand. No agreement regarding severance pay or pension.
Per BriliothManaging Director and Board memberSwedish citizen, born 1969. Member of the Board and Managing Director since 2007. Between 1994 and 2000, Per Brilioth was head of the Emerging Markets section at Hagströmer & Qviberg and he has worked close to the Russian stock market for a number of years. Per Brilioth is a graduate of Stockholm University and holds a Master of Finance from London Business School. Other signifi-cant board assignments: member of the boards of Vostok Emerging Finance Ltd, Tethys Oil AB and LeoVegas AB, and Chairman of the board of Pomegranate Investment AB. Holdings in Vostok New Ventures: 215,000 SDRs (including holdings through an endowment insurance), of which 25,000 are Saving DRs under LTIP 2016 and 25,000 are Saving DRs under LTIP 2017. Salary and variable remuneration: USD 993 thousand. Agreement regarding severance pay and pension: Per Brilioth has the right of twelve months’ full salary in the event of ter-mination by the Company. Should he resign on his own initiative, he must give six months’ notice. Per Brilioth enjoys a contribution-based pension plan in line with Swedish market practice.
Group managementPer Brilioth: Managing Director. See also heading “Board of Directors” above.
Nadja Borisova: Chief Financial Officer. Swedish and Russian Citizen, born 1968. Employed since 2010. Holdings in Vostok New Ventures as at the Balance Date1: 27,500 SDRs, of which 8,000 are Saving DRs under LTIP 2016 and 8,000 are Saving DRs under LTIP 2017.
Anders F. Börjesson: General Counsel. Swedish citizen, born 1971. Employed since 2008. Holdings in Vostok New Ventures: 35,750 SDRs, of which 8,000 are Saving DRs under LTIP 2016 and 8,000 are Saving DRs under LTIP 2017.
Auditors
PricewaterhouseCoopers AB
Ulrika Ramsvik, born 1973. Authorized public accountant, Auditor in charge. Auditor in the Company since 2012. PricewaterhouseCoopers AB, Gothenburg, Sweden.
Bo Hjalmarsson, born 1960. Authorized public accoun-tant, Co-signing auditor. Auditor in the Company since 2014. PricewaterhouseCoopers AB, Stockholm, Sweden.
1. Current holding: 38,500 SDRs.
Corporate Governance

��54����54��
Administration report
The Board of Directors and the Managing Director of Vostok New Ventures Ltd, corporate identity num-ber 39861, hereby present the annual report for the financial year January 1, 2017–December 31, 2017.
Group ResultDuring the year, the result from financial assets at fair value through profit or loss amounted to USD 167.69 mln (2016: 133.84), mainly driven by the revaluation of Avito and Gett. Dividend income from Avito was USD 1.36 mln (2016: 6.76).
Net operating expenses amounted to USD -6.30 mln (2016: -6.67), which includes variable compensation paid to the employees of the Company in the amount of USD 0.99 mln (including social fees USD 0.24 mln).
Net financial items were USD -1.29 mln (2016: 1.63).Net result for the year was USD 161.45 mln (2016:
135.47). Total shareholders’ equity amounted to USD 879.99
mln on December 31, 2017 (December 31, 2016: 725.52).
Liquid assetsThe liquid assets of the group, defined as cash and bank deposits adjusted for concluded but not yet settled share transactions, amounted to USD 51.08 mln on December 31, 2017 (December 31, 2016: 34.80).
The Company also has investments in money market funds, as part of its liquidity management operations. As per December 31, 2017, the liquidity management invest-ments are valued at USD 8 mln.
Portfolio performanceDuring the year January 1, 2017–December 31, 2017, Vostok New Ventures’ net asset value per share has increased by 22.8%. During the same period the Russian RTS index increased by 0.2% in USD terms.
During the year January 1, 2017–December 31, 2017, gross investments in financial assets were USD 49.0 mln (2016: 31.7), and proceeds from sales were USD 2.55 mln (2016: 7.83). As at December 31, 2017, Vostok New Ven-tures’ four biggest investments were Avito (62.2%), BlaB-laCar (12.5%), Gett (6.2%) and Propertyfinder (3.0%).
Major events of the yearDuring 2017, the Company made equity investments in three new portfolio companies: babylon (USD 21.7 mln), CarZar (USD 1.5 mln) and Agente Imóvel (USD 1.0 mln) and follow-on investments in four existing portfolio companies: BlaBlaCar (USD 8.5 mln), CarZar (USD 1.5 mln), Vezeeta (USD 0.3 mln) and El Basharsoft (USD 0.2 mln). During 2017, Vostok New Ventures sold most of its shares in Delivery Hero (USD 2.6 mln). During 2017, the Company issued SEK 600 mln senior bond listed on Nas-daq Stockholm and redeemed the Company’s entire SEK 300 mln bond due to early repayment by Delivery Hero of its loan of EUR 25 mln to the Company.
During 2017, the largest revaluations of financial assets were Avito (USD 142.7 mln) and Gett (USD 8.8 mln).
During 2017, the Company has repurchased 1,105,952 SDRs.
Parent CompanyThe parent company finances the Cypriot subsidiary’s operations on market terms, The net result for the year was USD 3.42 mln (2016: 1.57). Financial assets at fair value through profit or loss refers to liquidity manage-ment investments.
Board meetingsThe Board of Directors currently comprises six Direc-tors, all of which were re-elected at the Annual General Meeting on May 16, 2017. During the year, the Board has held seven board meetings, of which three in person and four by telephone conference, and has passed five resolu-tions by circulation. The Directors represent a number of nationalities. Board meetings are conducted in English. The work and the composition of the Board are described in detail in the Corporate Governance Report.
Corporate governance reportA complete report on Vostok New Ventures’ application of the Swedish Corporate Governance Code is included on pages 38–45.
Financial Information
��55����55��
Personnel At year-end, Vostok New Ventures had five persons employed in Sweden.
Treatment of retained earningsThe group’s total retained earnings amount to USD 733,850 thousand.
The Board of Directors propose that the retained earnings and the additional paid in capital of the par-ent company USD 246,062 thousand, which include the year’s profit of USD 3,417 thousand, be brought forward, and that no dividends be paid for the year.
Financial Information

��56����56��
Share dataYear Event Change in
number of sharesNumber of
sharesPar value,
USDChange in share
capital, USDShare capital,
USD
April 2007 Incorporation – 1 0.00 – –
July 2007 New share issue 46,020,900 46,020,901 1.00 46,020,901 46,020,901
February 2009 Rights issue 46,020,901 92,041,802 1.00 46,020,901 92,041,802
June 2009 In-kind issue 8,949,173 100,990,975 1.00 8,949,173 100,990,975
2011 Repurchase of shares -2,520,775 98,470,200 1.00 -2,520,775 98,470,200
January–July 2012 Repurchase of shares -8,516,827 89,953,373 1.00 -8,516,827 89,953,373
September 2012 Split and redemption program – 89,953,373 -0.50 -44,976,687 44,976,687
December 2012 Repurchase of shares -234,094 89,719,279 0.50 -117,047 44,859,640
January 2013 Repurchase of shares -1,509,279 88,210,000 0.50 -754,640 44,105,000
May 2013 Split and redemption program 88,210,000 -0.15 -13,231,500 30,873,500
August 2013 Exercise of employee options 1,693,020 89,903,020 0.35 592,557 31,466,057
June 2014 Exercise of employee options 24,360 89,927,380 0.35 8,526 31,474,583
2014 Repurchase of shares -15,830,049 74,097,331 0.35 -5,540,517 25,934,066
2015 Repurchase of shares -597,776 73,499,555 0.35 -209,222 25,724,844
July 2015 Split and redemption program 73,499,555 -0.03 -2,204,987 23,519,858
August 2016 In-kind issue 6,866,766 80,366,321 0.32 2,197,365 25,717,223
August 2016 Cancellation of repurchased shares -50,507 80,315,814 0.32 -16,162 25,701,061
November 2016 In-kind issue 4,154,495 84,470,309 0.32 1,329,438 27,030,499
December 2016 Exercise of employee options 1,218,000 85,688,309 0.32 389,760 27,420,259
2017 Repurchase of shares -1,105,952 84,582,357 0.32 353,905 27,066,354
December 31, 2017 84,582,357 0.32 27,066,354
Financial Information

��57����57��
Income statements – Group
(Expressed in USD thousands) Note 2017 2016
Result from financial assets at fair value through profit or loss¹ 6 167,691 133,840
Dividend and coupon income 7 1,357 6,760
Operating expenses 8, 23, 24 -6,305 -6,666
Operating result 162,743 133,934
Financial income and expenses
Interest income 14, 15 4,153 4,748
Interest expense 14, 19 -7,090 -1,908
Currency exchange gains/losses, net 1,648 -1,210
Net financial items -1,289 1,630
Result before tax 161,454 135,563
Taxation 9 -68 -89
Net result for the year 161,386 135,474
Earnings per share (in USD) 10 1.89 1.77
Diluted earnings per share (in USD) 10 1.89 1.77
1. Financial assets at fair value through profit or loss (including listed bonds) are carried at fair value. Gains or losses arising from changes in the fair value of the ‘financial assets at fair value through profit or loss’ category are presented in the income statement within ‘Result from financial assets at fair value through profit or loss’ in the period in which they arise.
Statement of comprehensive income(Expressed in USD thousands) 2017 2016 Net result for the year 161,386 135,474
Other comprehensive income for the year
Items that may be classified subsequently to profit or loss:
Currency translation differences 160 -83
Total other comprehensive income for the year 160 -83
Total comprehensive income for the year 161,546 135,391
Total comprehensive income for the years above is entirely attributable to the equity holders of the parent company.
Financial Information

��58����58��
(Expressed in USD thousands) Note Dec 31, 2017 Dec 31, 2016
NON-CURRENT ASSETS
Tangible non-current assets
Property, plant and equipment 11 53 48
Total tangible non-current assets 53 48
Financial non-current assets
Financial assets at fair value through profit or loss 12, 13 900,047 691,582
Non-current loan receivables 12, 14, 15 – 24,074
Total financial non-current assets 900,047 715,656
CURRENT ASSETS
Cash and cash equivalents 12, 17 51,079 34,780
Current loan receivables 12, 14, 15 – 7,699
Tax receivables 394 317
Other current receivables 16 2,206 6,830
Total current assets 53,679 49,626
TOTAL ASSETS 953,779 765,330
SHAREHOLDERS’ EQUITY (including net result for the financial period) 18 879,990 725,516
NON-CURRENT LIABILITIES
Interest bearing liabilities
Long-term debts 19 71,541 32,400
Total non-current liabilities 71,541 32,400
CURRENT LIABILITIES
Non-interest bearing current liabilities
Tax payables 431 412
Other current liabilities 20 1,090 6,732
Accrued expenses 727 270
Total current liabilities 2,248 7,414
TOTAL SHAREHOLDERS’ EQUITY AND LIABILITIES 953,779 765,330
Balance sheets – Group
Financial Information

��59����59��
(Expressed in USD thousands) Note Share capital
Additional paid in capital
Other reserves
Retained earnings
Total
Balance at January 1, 2016 23,520 42,996 -85 437,005 503,435
Net result for the year January 1, 2016 to December 31, 2016 – – – 135,474 135,474
Other comprehensive income for the year
Currency translation differences – – -83 – -83
Total comprehensive income for the year January 1, 2016 to December 31, 2016 – – -83 135,474 135,391
Transactions with owners:
Proceeds from shares issued 3,917 82,714 – – 86,631
Redemption program – – – -6 -6
Value of employee services:
- Employees share option scheme – 130 – – 130
- Share-based long-term incentive program 23 – 231 – – 231
Buy back of own shares -16 -280 – – -296
Total transactions with owners 3,900 82,795 – -6 86,690
Balance at December 31, 2016 27,420 125,791 -168 572,473 725,516
Balance at January 1, 2017 27,420 125,791 -168 572,473 725,516
Net result for the year January 1, 2017 to December 31, 2017 – – – 161,386 161,386
Other comprehensive income for the year
Currency translation differences – – 160 – 160
Total comprehensive income for the year January 1, 2017 to December 31, 2017 – – 160 161,386 161,546
Transactions with owners:
Value of employee services:
- Share-based long-term incentive program 23 – 1,136 – – 1,136
Buy back of own shares -354 -7,854 – – -8,208
Total transactions with owners -354 -6,718 – – -7,072
Balance at December 31, 2017 27,066 119,073 -8 733,858 879,990
Statement of Changes in Equity – Group
Financial Information

��60����60��
(Expressed in USD thousands) Note 2017 2016
OPERATING ACTIVITIES
Result before tax 161,454 135,563
Adjustment for:
Interest income -4,153 -4,748
Interest expense 7,090 1,908
Currency exchange gains/-losses -1,648 1,210
Result from financial assets at fair value through profit or loss -167,691 -133,840
Dividend and coupon income -1,357 -6,760
Other non-cash adjustments 1,254 231
Change in current receivables -2,029 133
Change in current liabilities 606 136
Net cash used in operating activities -6,474 -6,166
Investments in financial assets -49,080 -31,661
Sales of financial assets 2,546 7,830
Increase of loan receivables – 2,205
Repayment of loan receivables 36,060 –
Dividend and coupon income 8,118 –
Interest received 1,773 1,997
Interest paid -3,707 –
Tax paid -128 -131
Net cash flow used in operating activities -10,892 -25,926
INVESTMENT ACTIVITIES
Investments in office equipment – -52
Net cash flow used in investment activities – -52
FINANCING ACTIVITIES
Proceeds from borrowings 19 65,001 34,563
Repayment of borrowings 19 -37,734 -20,730
Redemption program transaction fees – -6
Share issue in-kind transaction costs – -512
Proceeds from options issued to employees – 130
Proceeds from shares issued – 7,566
Buy back of own shares -8,208 -296
Net cash flow from financing activities 19,059 20,715
Cash flow for the year 8,166 -5,263
Cash and cash equivalents at beginning of the year 34,780 43,660
Exchange gains/losses on cash and cash equivalents 8,133 -3,618
Cash and cash equivalents at end of year 51,079 34,780
Cash flow statements – Group
Financial Information

��61����61��
Alternative Performance Measures – Group
2017 2016
Return on capital employed, %¹ 18.06 21.18
Equity ratio, %2 92.26 94.80
Shareholders’ equity/share, USD³ 10.40 8.47
Earnings/share, USD⁴ 1.89 1.77
Diluted earnings/share, USD⁵ 1.89 1.77
Net asset value/share, USD⁶ 10.40 8.47
Weighted average number of shares for the financial period 85,263,922 76,544,877
Weighted average number of shares for the financial period (fully diluted) 85,404,011 76,544,877
Number of shares at balance sheet date⁷ 84,582,357 85,688,309
1. Return on capital employed is defined as the Group’s result for the period plus interest expenses plus/less exchange differences on financial loans divided by the average capital employed (the average total assets less non-interest bearing liabilities over the period). Return on capi-tal employed is not annualized.
2. Equity ratio is defined as shareholders’ equity in relation to total assets.3. Shareholders’ equity/share is defined as shareholders’ equity divided by total number of shares.4. Earnings/share is defined as result for the period divided by average weighted number of shares for the year.5. Diluted earnings/share is defined as result for the year divided by average weighted number of shares for the year calculated on a fully diluted
basis.6. Net asset value/share is defined as shareholders’ equity divided by total number of shares.7. Number of shares at balance sheet date as per December 31, 2017, excludes 1,105,952 repurchased SDRs.
As of July 3, 2016, new guidelines on APMs (Alternative Performance Measures) are issued by ESMA (the Euro-pean Securities and Markets Authority). APMs are finan-cial measures other than financial measures defined or specified by International Financial Reporting Stan-dards (IFRS).
Vostok New Ventures regularly uses alternative per-formance measures to enhance comparability from peri-od to period and to give deeper information and provide
meaningful supplemental information to analysts, inves-tors and other parties.
It is important to know that not all companies calcu-late alternative performance measures identically, there-fore these measurements have limitations and should not be used as a substitute for measures of performance in accordance with IFRS.
Below you find our presentation of the APMs and how we calculate these measures.
Financial Information

��62����62��
(Expressed in USD thousands) Note 2017 2016
Result from financial assets at fair value through profit or loss -327 954
Operating expenses 8 -6,481 -6,854
Operating result -6,808 -5,900
Financial income and expenses
Interest income 15,740 10,627
Interest expense -7,017 -1,908
Currency exchange gains/losses, net 1,502 -1,248
Net financial items 10,225 7,471
Net result for the financial period 3,417 1,571
Statement of comprehensive income(Expressed in USD thousands) 2017 2016 Net result for the year 3,417 1,571
Other comprehensive income for the year
Items that may be classified subsequently to profit or loss:
Currency translation differences – –
Total other comprehensive income for the year – –
Total comprehensive income for the year 3,417 1,571
Income statement – Parent
Financial Information

��63����63��
(Expressed in USD thousands) Note Dec 31, 2017 Dec 31, 2016
NON-CURRENT ASSETS
Financial non-current assets
Shares in subsidiaries 22 84,389 84,389
Financial assets at fair value through profit or loss 12 8,023 1,147
Loan receivables – 24,074
Receivables from Group companies 22, 24 206,303 165,237
Total financial non-current assets 298,715 274,847
CURRENT ASSETS
Cash and cash equivalents 47,829 27,639
Loan receivables – 7,699
Other current receivables 62 45
Total current assets 47,891 35,383
TOTAL ASSETS 346,605 310,230
SHAREHOLDERS’ EQUITY (including net result for the financial period) 18 273,128 276,783
NON-CURRENT LIABILITIES
Interest bearing liabilities
Long-term debts 71,541 32,400
Total non-current liabilities 71,541 32,400
CURRENT LIABILITIES
Non-interest bearing current liabilities
Liabilities to group companies 22 1,165 704
Other current liabilities 20 107 114
Accrued expenses 664 229
Total current liabilities 1,936 1,047
TOTAL SHAREHOLDERS’ EQUITY AND LIABILITIES 346,605 310,230
Balance sheet – Parent
Financial Information

��64����64��
(Expressed in USD thousands) Note Share capital
Additional paid in capital
Retained earnings
Total
Balance at January 1, 2016 23,520 42,996 122,006 188,523
Net result for the year January 1, 2016 to December 31, 2016 – – 1,571 1,571
Other comprehensive income for the year
Currency translation differences – – – –
Total comprehensive income for the year January 1, 2016 to December 31, 2016 – – 1,571 1,571
Transactions with owners:
Proceeds from shares issued 3,917 82,714 – 86,631
Redemption program – – -6 -6
Value of employee services:
- Employees share option scheme – 130 – 130
- Share-based long-term incentive program 23 – 231 – 231
Buy back of own shares -16 -280 – -296
Total transactions with owners 3,900 82,795 -6 86,690
Balance at December 31, 2016 27,420 125,791 123,571 276,783
Balance at January 1, 2017 27,420 125,791 123,571 276,783
Net result for the year January 1, 2017 to December 31, 2017 – – 3,417 3,417
Other comprehensive income for the year
Currency translation differences – – – –
Total comprehensive income for the year January 1, 2017 to December 31, 2017 – – 3,417 3,417
Transactions with owners:
Value of employee services:
- Share-based long-term incentive program 23 – 1,136 – 1,136
Buy back of own shares -354 -7,854 – -8,208
Total transactions with owners -354 -6,718 – -7,072
Balance at December 31, 2017 27,066 119,073 126,988 273,128
Statement of Changes in Equity – Parent
Financial Information

��65����65��
(Expressed in USD thousands) Note 2017 2016
OPERATING ACTIVITIES
Result before tax 3,417 1,572
Adjustment for:
Interest income -15,740 -10,627
Interest expense 7,017 1,908
Currency exchange gains/-losses -1,502 1,248
Result from financial assets at fair value through profit or loss 1,124 -954
Other non-cash adjustments 1,136 –
Change in current receivables and liabilities 1,025 422
Net cash used in operating activities -3,523 -6,433
Investments in financial assets -8,000 828
Increase of loan receivables – 2,205
Repayments of loan receivables 36,060 –
Interest received 1,773 1,997
Interest paid -3,707 –
Net cash flow from/used in operating activities 22,603 -1,403
INVESTING ACTIVITIES
Loan to the companies within the Group -29,462 -1,048
Net cash flow used in investing activities -29,462 -1,048
FINANCING ACTIVITIES
Proceeds from borrowings 19 65,001 34,563
Repayment of borrowings 19 -37,734 -20,730
Proceeds from options issued to employees – 130
Redemption program transaction fees – -6
Share issue in-kind transactions costs – -512
Proceeds from shares issued – 7,566
Buy back of own shares -8,208 -296
Net cash flow from financing activities 19,059 20,715
Cash flow for the year 12,200 18,263
Cash and cash equivalents at beginning of the year 27,639 12,964
Exchange gains/losses on cash and cash equivalents 7,990 -3,589
Cash and cash equivalents at end of year 47,829 27,639
Cash flow statement – Parent
Financial Information
��66����66��
Notes to the financial statements(Expressed in USD thousand unless indicated otherwise)
Note 1 General informationIntroductionVostok New Ventures Ltd (“Vostok New Ventures”, or “the Company”) was incorporated in Bermuda on April 5, 2007 with corporate identity number 39861.
The Vostok New Ventures Group was formed in 2007, in connection with the restructuring of the Vostok Gas Group. Vostok New Ventures is an investment company with the business concept of using expe-rience, expertise and a widespread network to identify and invest in assets with considerable potential for value appreciation, with a focus on companies with network effects.
These Group consolidated financial statements were authorized for issue by the Board of Directors on March 28, 2018.
The principal accounting policies adopted in the preparation of these financial statements are set out below.
Note 2 Significant accounting policiesAccounting basisThe consolidated and the parent company financial statements are prepared in accordance with International Financial Reporting Standards, IFRS, as adopted by EU, as at December 31, 2017. The con-solidated financial statements have been prepared under the historical cost convention, as modified by the revaluation of financial assets at fair value through profit and loss.
The preparation of financial statements in conformity with IFRS requires the use of certain critical accounting estimates. It also requires management to exercise its judgement in the process of applying the Group’s accounting policies. The areas involving a higher degree of judgement or complexity, or areas where assumptions and estimates are significant to the consolidated financial statements are disclosed in Note 4.
Changes in accounting policy and disclosuresNew and amended standards adopted by the GroupThere are no new or revised IFRS standards that are effective for the first time for the financial year beginning on or after 1 January 2017 that have had a material impact on the Group.
New standards and interpretations not yet adoptedA number of new standards and amendments to standards and inter-pretations are effective for annual periods beginning after January 1, 2017, and have not been applied in preparing these consolidated finan-cial statements.
IFRS 9, ‘Financial instruments’, addresses the classification, mea-surement and recognition of financial assets and financial liabilities. The complete version of IFRS 9 was issued in July 2014. It replaces the guidance in IAS 39 that relates to the classification and measurement of financial instruments. IFRS 9 retains but simplifies the mixed mea-surement model and establishes three primary measurement catego-ries for financial assets: amortised cost, fair value through other com-prehensive income and fair value through profit or loss. The basis of classification depends on the entity’s business model and the contrac-tual cash flow characteristics of the financial asset. Investments in equity instruments are required to be measured at fair value through profit or loss with the irrevocable option at inception to present chang-es in fair value in other comprehensive income not recycling. There is now a new expected credit losses model that replaces the incurred loss impairment model used in IAS 39. For financial liabilities, there were no changes to classification and measurement except for the recogni-tion of changes in own credit risk in other comprehensive income, for liabilities designated at fair value through profit or loss. IFRS 9 relax-es the requirements for hedge effectiveness by replacing the bright
line hedge effectiveness tests. It requires an economic relationship between the hedged item and hedging instrument and for the hedged ratio to be the same as the one management actually use for risk man-agement purposes. Contemporaneous documentation is still required but is different to that currently prepared under IAS 39. The standard is effective for accounting periods beginning on or after January 1, 2018. Early adoption is permitted. The Group has analysed the imple-mentation of IFRS 9 and have concluded that there is no significant impact on the financial statements of the Company other than addi-tional disclosure requirements.
IFRS 15, ‘Revenue from contracts with customers’, deals with revenue recognition and establishes principles for reporting useful informa-tion to users of financial statements about the nature, amount, tim-ing and uncertainty of revenue and cash flows arising from an entity’s contracts with customers. Revenue is recognised when a customer obtains control of a good or service and thus has the ability to direct the use and obtain the benefits from the good or service. The standard replaces IAS 18 ‘Revenue’ and IAS 11 ‘Construction contracts’ and related interpretations. The standard is effective for annual periods beginning on or after January 1, 2018 and earlier application is permit-ted. The Group has analysed the new standard and sees no significant impact on the Group’s financial statements.
IFRS 16, ‘Leases’, affects primarily the accounting by leases and will result in the recognition of almost all leases on balance sheet. The standard removes the current distinction between operating and financing leases and requires recognition of an asset (the right to use the leased item) and a financial liability to pay rentals for virtually all lease contracts. An optional exemption exists for short-term and low-value leases. The income statement will also be affected because the total expense is typically higher in the earlier years of a lease and lower in later years. Additionally, operating expense will be replaced with interest and depreciation, thereby increasing the operating result. Operating cash flows will be higher as cash payments for the principal portion of the lease liability are classified within financing activities. Only the part of the payments that reflects interest can continue to be presented as operating cash flows. The accounting by lessors will not significantly change. Some differences may arise as a result of the new guidance on the definition of a lease. Under IFRS 16, a contract is, or contains, a lease if the contract conveys the right to control the use of an identified asset for a period of time in exchange for consideration. The standard is mandatory for financial years com-mencing on or after January 1, 2019.
The Company’s leasing commitments consist only of lease agree-ments for premises therefore will the new standard not have a signifi-cant impact on the Company’s financial reports.
At this stage, the group does not intend to adopt the standard before its effective date. The Group intends to apply the simplified transition approach and will not restate comparative amounts for the year prior to first adoption.
There are no other IFRSs or IFRIC interpretations that are not yet effective that would be expected to have a material impact on the Group.
Financial periodThe financial year comprises the period January 1–December 31.
Principles of consolidationSubsidiariesSubsidiaries are all entities (including structured entities) over which the Group has control. The Group controls an entity when the Group is exposed to or has rights to variable returns from its involvement with the entity and has the ability to affect those returns through its power over the entity. Subsidiaries are fully consolidated from the date on which control is transferred to the Group. They are deconsol-idated from the date that control ceases. The Group applies the acqui-sition method to account for business combinations.
Financial Information

��67����67��
Inter-company transactions, balances and unrealized gains on trans-actions between Group companies are eliminated. Unrealized losses are also eliminated. When necessary, amounts reported by subsidiaries have been adjusted to conform with the Group’s accounting policies.
In accordance with IFRS 10 Consolidated Financial Statements the Group values its investments (portfolio companies) at fair value. Vostok New Ventures falls within the classification of an investment company as its business concept is to use experience, expertise and a widespread network to identify and invest in assets with considerable potential for value appreciation and obtain a return.
Investments in associated companiesAssociated companies are all entities where the Company has the right to exercise significant influence, which is normally the case when the Company holds between 20% and 50% of the voting rights. As Vostok New Ventures falls within the classification of an investment company, all investments in associates are accounted for by applying fair value. On increase/decrease of the investments in associated companies, the Group makes an assessment of fair value for the total investment.
Segment reportingOperating segments are reported in a manner consistent with the inter-nal reporting provided to the chief operating decision maker in the same way as for a Swedish company governed by the Swedish Companies Act and the Swedish Corporate Governance Code. The board of directors of an investment company is by necessity deeply involved in investment decisions and monitoring portfolio companies’ performance. The Board has therefore been identified as the chief operating decision maker of the Company for purposes of internal reporting. In the internal report-ing of the Company, there is only one operating segment.
Foreign currency translation(a) The functional and presentational currency Items included in the financial statements of each of the Group’s entities are measured using the currency of the primary economic environment in which the entity operates (‘the functional currency’). The function-al currency of the Parent Company and its Cypriot subsidiary is USD, which is also considered to be the presentational currency of the Group.
b) Transactions and balances Transactions in currencies other than USD are translated into USD at the rate of exchange that was in effect at the transaction date.
Monetary assets and liabilities denominated in foreign currencies are translated at rates of exchange prevailing at the balance sheet date. Realized and unrealized exchange gains/losses on portfolio investments, which include loan receivables, investments in associat-ed companies, and financial assets at fair value through profit or loss are recognized in profit or loss as part of the result from each of the categories of financial assets, which are included in the investment portfolio. Realized and unrealized exchange gains/losses on other assets and liabilities are reported among financial items.
c) Group companiesAs at the reporting date, the assets and liabilities of subsidiaries that have not the same functional currency as the Parent Company are translated into the presentation currency of the Group at rates of exchange prevailing at the balance sheet date. Their income state-ments are translated at the average exchange rate for the year. The exchange differences arising on the translation are recognized as other comprehensive income. The following exchange rates have been used:
Average ClosingSEK 8.5380 8.2322
Property, plant and equipmentProperty, plant and equipment are stated at historical cost less accu-mulated depreciation. Depreciation on furniture, fittings and equip-ment is based on cost on a straight-line basis of estimated useful life of three and five years. The assets’ residual values and useful lives are reviewed, and adjusted if appropriate, at each balance sheet date.
Financial AssetsThe Group classifies its financial assets in the following categories: financial assets at fair value through profit or loss and loans and
receivables. The classification depends on the purpose for which the financial assets were acquired. Management determines the classifi-cation of its financial assets at initial recognition. Purchases and sales of financial assets are recognized on trade-date – the date on which the Group commits to purchase or sell the asset. Financial assets are derecognized when the rights to receive cash flows from the invest-ments have expired or have been transferred and the Group have transferred substantially all risks and rewards of ownership.
Financial assets at fair value through profit or lossThis category has two subcategories: – Designated. The first includes any financial asset that is designat-ed on initial recognition as one to be measured at fair value with fair value changes in profit or loss. – Held for trading. The second category includes financial assets that are held for trading. All derivatives (except those designated as hedg-ing instruments) and financial assets acquired or held for the purpose of selling in the short term or for which there is a recent pattern of short-term profit taking are held for trading.
The Group classifies all its financial assets at fair value through profit or loss in the subcategory designated. Assets in this category are classified as current assets if expected to be settled within 12 months; otherwise, they are classified as non-current. Financial assets are securities held in listed and unlisted companies.
Financial assets carried at fair value through profit or loss is ini-tially recognized at fair value and transaction costs are expensed in the income statement. Thereafter they are subsequently carried at fair value. Gains or losses arising from changes in the fair value of the ‘financial assets at fair value through profit or loss’ category are pre-sented in the income statement within ‘Result from financial assets at fair value through profit or loss’ in the period in which they arise. Dividend income from financial assets at fair value through profit of loss is recognized in the income statement as “Dividend income” when the Group’s right to receive payments is established. Interest income from financial assets at fair value through profit or loss is rec-ognized as a part of the fair value change.
The fair values of quoted investments are based on current bid pric-es. If the market for a financial asset is not active (and for unlisted securities), the Group establishes fair value by using valuation tech-niques. These include the use of recent arm’s length transactions, ref-erence to other instruments that are substantially the same, discount-ed cash flow analysis, and multiples valuation making maximum use of market inputs and relying as little as possible on entity-specific inputs.
Loans and receivablesLoans and receivables are non-derivative financial assets with fixed or determinable payments that are not traded in an active market. They are included in current assets, except for maturities greater than 12 months after the balance sheet date. These are classified as non-cur-rent assets. The Group’s loans and receivables comprise ‘Non-current loan receivables’, ‘Current loan receivables’, ‘Other current receiv-ables’ and ‘Cash and cash equivalents’ in the balance sheet.
Investments in loans and receivables are initially recognized at fair value plus transaction costs. Loans and receivables are carried at amor-tized cost using the effective interest method. Interest on loan receiv-ables which are considered parts of the investment portfolio is presented in the income statement as ‘Result from loan receivables’ among operat-ing income items. Interest on other loans and receivables is presented in the income statement as ‘Interest income’ among financial items.
A financial asset or group of assets is impaired, and impairment losses are recognised, only if there is objective evidence as a result of one or more events that occurred after the initial recognition of the asset. An entity is required to assess at each balance sheet date wheth-er there is any objective evidence of impairment. If any such evidence exists, the entity is required to do a detailed impairment calculation to determine whether an impairment loss should be recognised.
The amount of the loss is measured as the difference between the asset’s carrying amount and the present value of estimated cash flows discounted at the financial asset’s original effective interest rate. Impairment losses on portfolio investments are presented in the income statement within ‘Result from loan receivables’. Impairment losses on other financial assets are recognized in the income state-ment as ‘Other financial expenses’ among financial items.
Financial Information

��68����68��
Financial liabilitiesBorrowings are initially recognized at fair value, net of transaction costs incurred. Borrowings are subsequently measured at amortized cost. Any difference between the proceeds (net of transaction costs) and the redemption amount is recognized in profit or loss over the peri-od of the borrowings using the effective interest method. Borrowings are classified as current liabilities unless the Group has an uncondi-tional right to defer settlement of the liability for at least 12 months after the reporting period.
Cash and cash equivalentsCash and bank include cash and bank balances and other short-term high-ly liquid investments with original maturities of three months or less.
Share capitalOrdinary shares are classified as equity. Share issue costs associated with the issuance of new equity are treated as a direct reduction of the proceeds. Buy back of own shares is, after cancellation of the shares, recorded as a reduction of the share capital with the nominal value of shares bought back, and as a reduction of the additional paid in capital or the retained earnings with the amount paid after reduction of trans-action costs for the shares in excess of the nominal value.
Current and deferred income taxThe current income tax charge is calculated on the basis of the tax laws enacted or substantively enacted at the balance sheet date in the countries where the company’s subsidiaries and associates operate and generate taxable income. Management periodically evaluates positions taken in tax returns with respect to situations in which applicable tax regulations is subject to interpretation and establishes provisions where appropriate on the basis of amounts expected to be paid to the tax authorities.
Deferred income tax is provided in full, using the liability method, on temporary differences arising between the tax bases of assets and liabilities and their carrying amounts in the consolidated financial statements. However, the deferred income tax is not accounted for if it arises from initial recognition of an asset or liability in a transaction other than a business combination that at the time of the transaction affects neither accounting nor taxable profit or loss. Deferred income tax is determined using tax rates (and laws) that have been enacted or substantially enacted by the balance sheet date and are expected to apply when the related deferred income tax asset is realized or the deferred income tax liability is settled.
Deferred income tax assets are recognised to the extent that it is probable that future taxable profit will be available against which the temporary differences can be utilised.
Deferred income tax is provided on temporary differences arising on investments in subsidiaries except where the timing of the reversal of the temporary difference is controlled by the Group and it is prob-able that the temporary difference will not reverse in the foreseeable future. The Group currently has no temporary differences and has no deferred income tax recognised.
Employee benefitsShort-term obligationsLiabilities for wages and salaries, including non-monetary benefits that are expected to be settled wholly within 12 months after the end of the period in which the employees render the related service are rec-ognised in respect of employees’ services up to the end of the reporting period and are measured at the amounts expected to be paid when the liabilities are settled. The liabilities are presented as current employee benefit obligations in the balance sheet.
Pension obligationsThe Group has a defined contribution pension plan which is based on Swedish market practice. The Group has no further obligations once the contributions have been paid. The contributions are reported as a cost recognised as employee benefit pension expense in profit or loss when they are due.
Share-based remunerationThe Group operates an equity-settled, share-based compensation plan. The fair value of the employee services received in exchange for the
grant of the options is recognised as an expense. The total amount to be expensed over the vesting period is determined by reference to the fair value of the options granted, excluding the impact of any non-market vesting conditions (for example, profitability and sales growth targets). Non-market vesting conditions are included in assumptions about the number of options that are expected to become exercisable. At each balance sheet date, the entity revises its estimates of the number of options that are expected to become exercisable. It recognizes the impact of the revision of original estimates, if any, in the income statement, and a corresponding adjustment to equity over the remaining vesting period.
The proceeds received net of any directly attributable transaction costs are credited to share capital (nominal value) and additional paid in capital when the options are exercised.
Long-term incentive program (LTIP 2016 and LTIP 2017)Through the long-term incentive program, the company will grant shares to the participants at nil consideration. The fair value of deferred shares granted to employees for nil consideration under the long-term incentive program is recognised as an expense over the rel-evant service period, being the period to which the services are per-formed and the vesting period of the shares. The fair value is measured at the grant date of the shares and is recognised in equity. The number of shares expected to vest is estimated based on the non-market vest-ing conditions. The estimates are revised at the end of each reporting period and adjustments are recognised in profit or loss and in equity.
Where shares are forfeited due to a failure by the employee to satis-fy the service conditions, any expenses previously recognised in rela-tion to such shares are reversed effective the date of the forfeiture.
Any social security contributions payable in connection with the grant are considered an integral part of the grant itself and the charges are treated as cash-settled transactions.
Revenue recognitionRevenue comprises the fair value of the consideration received in the ordinary course of the Group’s activities.
For investments held at both the start and end of year, the change in value consists of the difference in the market value between these dates. For investments acquired during the year, the change in value consists of the difference between cost and the market value at the end of the year. For investments sold during the year, the change in value consists of the difference between the sales price received and the value of investments at the start of the year. All changes in value are reported in the income statement within ’Result from financial assets at fair value through profit or loss’ or ‘Result from loan receivables’, depending on from what category of assets the changes in value relate.
Dividend income is recognised when the right to receive payment is established. Furthermore, dividend income is accounted for inclusive of withholding taxes. These withholding taxes are shown either as an expense in the income statement, or as a current receivable, depend-ing on whether or not the withholding tax is refundable.
Interest income on non-current loan receivables is recognised on a time-proportion basis using the effective interest method. When a receivable is impaired, the Group reduces the carrying amount to its recoverable amount, being the estimated future cash flow discounted at the original effective interest rate of the instrument, and contin-ues unwinding the discount as interest income. Interest income on impaired non-current loan receivables is recognised using the original effective interest rate.
Interest income on current loan receivables and other receivables is recognised taking into account accrued interest on the balance sheet date.
Other consideration received in the ordinary course of the Group’s activities is reported as “other income” in the income statement.
LeasesLeases in which a significant portion of the risks and rewards of own-ership are retained by the lessor are classified as operating leases. Payments made under operating leases are charged to the income statement on a straight-line basis over the period of the lease. The Group’s leases are exclusively operating leases, and refer mainly to office rents and office machines.
Financial Information

��69����69��
Note 3 Financial risk managementFinancial risk factorsThe Group’s activities expose it to a variety of financial risks: mar-ket risks (including foreign exchange risk, price risk and interest rate risk), credit risk, liquidity risk and cash flow interest-rate risk.
Risk management is carried out by management under policies approved by the Board of Directors.
Market riskMarket risk is the risk that the fair value or cash flows of a financial instrument will fluctuate due to changes in market prices. Market risk reflects foreign exchange risk, price risks and interest rate risk.
Foreign exchange riskThe Group operates internationally and is exposed to foreign exchange risk arising from various currency exposures, mainly with respect to the Swedish Krona (SEK), the Russian Ruble (RUB), British Pound (GBP) and Euro (EUR).
At December 31, 2017, if the USD had strengthened by 10.0% against the SEK with all other variables held constant, post-tax profit for the year and equity would have been USD 3.5 mln higher (2016: 0.33), mainly as a result of foreign exchange losses on translation of SEK-denominated cash and debt balances. Profit is more sensitive to movement in SEK/USD exchange rates in 2017 than 2016 because of the increase in SEK-denominated financial assets and long-term debts.
At December 31, 2017, if the USD had strengthened by 10.0% against the EUR with all other variables held constant, post-tax profit for the year and equity would have been USD 14.47 mln lower (2016: 13.79), mainly as a result of foreign exchange losses on translation of EUR-denominated investments in financial assets at fair value through profit and loss, debt investments and tax receivables. Profit is more sensitive to movement in EUR/USD exchange rates in 2017 than 2016 because of the increase in EUR-denominated financial assets, mainly BlaBlaCar and Wallapop, which estimates are based in EUR as per December 2017.
At December 31, 2017, if the USD had strengthened by 10.0% against the GBP with all other variables held constant, post-tax profit for the year and equity would have been USD 4.54 mln lower (2016: –), mainly as a result of foreign exchange losses on translation of GBP-denominated investments in financial assets at fair value through profit and loss, debt investments and tax receivables. Profit is more sensitive to movement in GBP/USD exchange rates in 2017 than 2016 because of GBP-denominated financial assets in babylon, which esti-mates are based in GBP as per December 2017.
At December 31, 2017, if the USD had strengthened by 10.0% against the RUB with all other variables held constant, post-tax profit for the year and equity would have been unchanged (2016: 0). Revenues and cash flows of Avito, KEH AB, OneTwoTrip, BlaBlaCar, Hemnet and partly Gett are exposed to the foreign exchange risks arising mainly with respect to RUB, SEK and EUR.
ExposureThe Group’s management monitors the exchange rate fluctuations on a continuous basis and per today no currency derivate and hedging are made. The Group’s exposure to foreign currency risk at the end of the reporting period, expressed in USD, was as follows:
Dec 31, 2017 Dec 31, 2016SEK EUR GBP SEK EUR GBP
Financial assets at fair value 11,207 133,037 23,336 12,451 154,317 –Cash and cash equivalents 20,759 27,094 101 23,766 4,060 –Other current receivables 2,159 – – – – –Long-term debts -71,541 – – -32,400 – –
Price riskThe Group has a very limited exposure to listed equity securities price risk since 99.9% of the Company’s investment are of private equity nature.
The private equity investments are also exposed to share price risks and classified on the consolidated balance sheet as financial
assets at fair value through profit and loss. The Group takes an active role in portfolio companies mainly through Board representation. 10% decrease in the price of the non-quoted shares at December 31, 2017 would have affected post-tax profit and equity by approximately USD 89 mln (2016: 60).
Market interest rate riskThe Group is not exposed to a market interest rate risk because of no outstanding loan receivables.
Credit riskCredit risk is the risk that one party to a financial instrument will cause a loss for the other party by failing to pay for its obligation.
Within the Group’s portfolio investments operations, credit risk arises from non-current and current loan receivables. See further Notes 14 and 15. For the investments in loan receivables, there are no formal restrictions with respect to the counterparty’s credit rating.
The Group is also exposed to counterparty credit risk on cash and cash equivalents and deposits with banks and financial institutions. The majority of cash is placed in bank accounts with financial institu-tions with high credit rating and a significant part of cash is placed in cash securities which are fully protected in the event of a bankruptcy of the custodian institution since securities on account are separate from the custodian’s balance sheet and thus never become a part of the custodian’s bankruptcy estate.
Liquidity riskLiquidity risk is the risk that an entity will have difficulties in paying its financial liabilities.
For the Group, prudent liquidity risk management implies main-taining sufficient cash. As at December 31, 2017, approximately 6% of the Group’s Net Assets Value comprises cash balances. Cash balances net of financial liability of USD 72 million represent approximately 8% of the Group’s Net Assets Value.
The Group has a financial liability as per December 31, 2017 in the amount of USD 72 mln as compared to USD 32 mln on December 31, 2016.
The table below shows the Company’s contracted financial cash flows for the coming periods.Contracted financial cash flows (mln) Dec 31, 2017 Dec 31, 2016Borrowings 3–12 months 4.1 2.3Borrowings 1–2 years 78.9 40.2
Cash flow interest rate riskThe majority of the Group’s financial assets are non-interest bear-ing, and the majority of outstanding interest-bearing liabilities carry a fixed interest. As a result, the Group is not subject to significant amount of risk due to fluctuations in the prevailing levels of market interest rates.
Capital risk managementThe Group’s objectives when managing capital are to safeguard the Group’s ability to continue as a going concern in order to provide returns for shareholders. Up to 2009, the Group’s investments were partly financed through debt after which the Board decided on a new financial strategy with zero net debt. The Group continues to work with financial leverage only on a restrictive basis during shorter peri-ods of time.
The current outstanding bond of USD 71.54 mln allows the Company to remain flexible and agile around investment activities and its liquidity management operations.
Operating and sector-related risksEmerging markets and country-specific risksThe risks associated with Russia and other emerging markets are com-mon to all investments in these territories and are not characteristic of any specific portfolio holding. An investment in Vostok New Ventures will be subject to risks associated with ownership and management of investments and in particular to risks of ownership and management in Russia and other emerging markets.
As these countries are still, from an economic point of view, in a phase of development, investments are affected by unusually large
Financial Information

��70����70��
fluctuations in profit and loss and other factors outside the Company’s control that may have an adverse impact on the value of Vostok New Ventures’ equity. Investors should therefore be aware that investment activity in Russia and other emerging markets entails a high level of risk and requires special consideration of factors, including those mentioned here, which are usually not associated with investment in shares in better regulated countries.
Unstable state administration, could have an adverse impact on investments. None of the emerging markets has a fully developed legal system comparable to that in more developed countries. Existing laws and regulations are sometimes applied inconsistently and both the independence and efficiency of the court system constitute a significant risk. Statutory changes have taken place and will proba-bly continue to take place at a rapid pace, and it remains difficult to predict the effect of legislative changes and legislative decisions for companies. Vostok New Ventures will invest in market segments that the Company is active in or will be active in. It could be more difficult to obtain redress or exercise one’s rights in emerging markets than in more mature legal systems.
Acquisition and disposal riskAcquisitions and disposals are by definition a natural element in Vostok New Ventures’ activities. All acquisitions and disposals are subject to uncertainty. The Company’s explicit exit strategy is to sell its holdings to strategic investors or via the market. There are no guar-antees that the Company will succeed in selling its participations and portfolio investments at the price the shares are being traded at on the market at the time of the disposal or valued at the balance sheet. Vostok New Ventures may therefore fail to sell its holdings in a port-folio company or be forced to do so at less than its maximum value or at a loss. If Vostok New Ventures disposes of the whole or parts of an investment in a portfolio company, the Company may receive less than the potential value of the participations, and the Company may receive less than the sum invested.
Vostok New Ventures operates in a market that may be subject to competition with regard to investment opportunities. Other investors may thus compete with Vostok New Ventures in the future for the type of investments the Company intends to make. There is no guar-antee that Vostok New Ventures will not in the future be subject to competition which might have a detrimental impact on the Company’s return from investments. The Company can partially counter this risk by being an active financial owner in the companies Vostok New Ventures invests in and consequently supply added value in the form of expertise and networks.
Despite the Company considering that there will be opportunities for beneficial acquisitions for Vostok New Ventures in the future, there is no guarantee that such opportunities for acquisition will ever arise or that the Company, in the event that such opportunities for acquisition arose, would have sufficient resources to complete such acquisitions.
Accounting practice and other informationPractice in accounting, financial reporting and auditing in Russia and other emerging markets cannot be compared with the corresponding practices that exist in the Western World. This is principally due to the fact that accounting and reporting have only been a function of adaptation to tax legislation. The Soviet tradition of not publishing information unnecessarily is still evident. The formal requirements for Russian companies are less broad in terms of publishing informa-tion than in more developed markets. In addition, access to exter-nal analysis, reliable statistics and historical data is inadequate. The effects of inflation can, moreover, be difficult for external observers to analyse. Although special expanded accounts are prepared and audit-ing is undertaken in accordance with international standard, no guar-antees can be given with regard to the completeness or dependabili-ty of the information. Inadequate information and weak accounting standards may be imagined to adversely affect Vostok New Ventures in future investment decisions.
Corporate governance riskMisuse of corporate governance remains a problem in Russia and other emerging markets. Minority shareholders may be badly treat-ed in various ways, for instance in the sale of assets, transfer pricing, dilution, limited access to Annual General Meetings and restrictions
on seats on boards of directors for external investors. In addition, sale of assets and transactions with related parties are common. Transfer pricing is generally applied by companies for transfer of value from subsidiaries and external investors to various types of holding compa-nies. It happens that companies neglect to comply with the rules that govern share issues such as prior notification in sufficient time for the exercise of right of pre-emption. Prevention of registration of shares is also widespread. Despite the fact that independent authorized reg-istrars have to keep most share registers, some are still in the hands of the company management, which may thus lead to register manip-ulation. A company management would be able to take extensive stra-tegic measures without proper consent from the shareholders. The possibility of shareholders exercising their right to express views and take decisions is made considerably more difficult.
Inadequate accounting rules and standards have hindered the development of an effective system for uncovering fraud and increas-ing insight. Shareholders can conceal their ownership by acquiring shares through shell company structures based abroad which are not demonstrably connected to the beneficiary, which leads to self-serv-ing transactions, insider deals and conflicts of interest. The role of the Russian financial inspectorate as the regulator of the equity market to guarantee effective insight and ensure that fraud is uncovered is complicated by the lack of judicial and administrative enforcement instruments.
Deficiencies in legislation on corporate governance, judicial enforcement and corporate legislation may lead to hostile take-overs, where the rights of minority shareholders are disregarded or abused, which could affect Vostok New Ventures in a detrimental manner.
Dependence on key individualsVostok New Ventures is dependent on its senior executives. Its Managing Director, Per Brilioth, is of particular significance to the development of the Company. It cannot be ruled out that Vostok New Ventures might be seriously affected if any of the senior executives left the Company.
Investments in growth marketsInvestments in growth markets such as Russia and other emerging markets entail a number of legal, economic and political risks. Many of these risks cannot be quantified or predicted, neither are they usually associated with investments in developed economies.
There are inherent difficulties and risks in investing in internet market places and online classifieds including but not limited to the ability to monetize and expand in new verticals, execution risks, inter-net regulatory and compliance matters, competitors risks, technical platform risks.
International capital flowsEconomic unrest in a growth market tends also to have an adverse impact on the equity market in other growth countries or the share price of companies operating in such countries, as investors opt to re-allocate their investment flows to more stable and developed mar-kets. The Company’s share price may be adversely affected during such periods. Financial problems or an increase in perceived risk related to a growth market may inhibit foreign investments in these markets and have a negative impact on the country’s economy. The Company’s operations, turnover and profit development may also be adversely affected in the event of such an economic downturn.
Political instabilityRussia has undergone deep political and social change in recent years. The value of Vostok New Ventures’ assets may be affected by uncer-tainties such as political and diplomatic developments, social or reli-gious instability, changes in government policy, tax and interest rates, restrictions on the political and economic development of laws and regulations in Russia, major policy changes or lack of internal con-sensus between leaders, executive and decision-making bodies and strong economic groups. These risks entail in particular expropria-tion, nationalisation, confiscation of assets and legislative changes relating to the level of foreign ownership. In addition, political chang-es may be less predictable in a growth country such as Russia than in other more developed countries. Such instability may in some cases have an adverse impact on both the operations and share price of the
Financial Information

��71����71��
Company. Since the collapse of the Soviet Union in 1991, the Russian economy has, from time to time, shown– significant decline in GDP– weak banking system with limited supply of liquidity to foreign
companies– growing black and grey economic markets– high flight of capital– high level of corruption and increased organised economic crime– hyperinflation– significant rise in unemployment
The Russian economy is largely dependent on the production and export of oil and natural gas, which makes it vulnerable to fluctua-tions in the oil and gas market. A downturn in the oil and gas market may have a significant adverse impact on the Russian economy.
Note 4 Critical accounting estimates and assumptionsThe management of Vostok New Ventures Ltd has to make estimates and judgements when preparing the Financial Statements of the Group. Uncertainties in the estimates and judgements could have an impact on the carrying amount of assets and liabilities and the Group’s result. The most important estimates and judgements in rela-tion thereto are:
Fair value of unlisted financial assetsThe estimates and judgements when assessing the fair value of unlist-ed financial assets at fair value through profit or loss are continually evaluated and are based on historical experience and other factors, including expectations of future events that are believed to be reason-able under the circumstances.
Fair value estimationThe table below analyses financial instruments carried at fair value, by valuation method. The different levels have been defined as follows:– Quoted prices (unadjusted) in active markets for identical assets or
liabilities (level 1).– Inputs other than quoted prices included within level 1 that are
observable for the asset or liability, either directly (that is, as prices) or indirectly (that is, derived from prices) (level 2).
– Inputs for the asset or liability that are not based on observable mar-ket data (that is, unobservable inputs) (level 3).
The Group’s assets that are measured at fair value at December 31, 2017:Level 1 Level 2 Level 3 Total
balanceFinancial assets at fair value through profit or loss 8,912 54,431 836,704 900,047Total assets 8,912 54,431 836,704 900,047
The Group’s assets that are measured at fair value at December 31, 2016:Level 1 Level 2 Level 3 Total
balanceFinancial assets at fair value through profit or loss – 233,592 457,990 691,582Total assets – 233,592 457,990 691,582
The following table presents the Group’s changes of financial assets in level 3.
2017 2016Opening balance January 1 457,990 5,662Transfers to level 3 206,747 343,999Change in fair value 171,967 108,329Closing balance December 31 836,704 457,990
The fair value of financial instruments traded in active markets is based on quoted market prices at the balance sheet date. A market is regarded as active if quoted prices are readily and regularly avail-able from an exchange, dealer, broker, industry group, pricing service, or regulatory agency, and those prices represent actual and regularly occurring market transactions on an arm’s length basis. The quoted
market price used for financial assets held by the Group is the current bid price. These instruments are included in level 1.
The fair value of financial instruments that are not traded in an active market is determined by using valuation techniques. These valuation techniques maximize the use of observable market data where it is available and rely as little as possible on entity specific esti-mates. If all significant inputs required to fair value an instrument are observable, the instrument is included in level 2. If one or more of the significant inputs is not based on observable market data, the instru-ment is included in level 3.
Investments in assets that are not traded on any market will be held at fair value determined by recent transactions made at prevail-ing market conditions or different valuation models depending on the characteristics of the company as well as the nature and risks of the investment. These different techniques may include discounted cash flow valuation (DCF), exit-multiple valuation also referred to as Leveraged Buyout (LBO) valuation, asset-based valuation as well as forward-looking multiples valuation based on comparable traded companies. Usually, transaction-based valuations are kept unchanged for a period of 12 months unless there is cause for a significant change in valuation. After 12 months, the Group usually derives fair value for non-traded assets through any of the models described above.
The validity of valuations based on a transaction is inevitably eroded over time, since the price at which the investment was made reflects the conditions that existed on the transaction date. At each reporting date, possible changes or events subsequent to the relevant transaction are assessed and if this assessment implies a change in the investment’s fair value, the valuation are adjusted accordingly. No sig-nificant events in the portfolio companies, which have had an impact on the valuations, has occurred since the latest transactions except as described below. The transaction-based valuations are also frequent-ly assessed using multiples of comparable traded companies for each unlisted investment or other valuation models.
Vostok New Ventures follows a structured process in assessing the valuation of its unlisted investments. Vostok New Ventures evaluate company specific and external data relating to each specific invest-ment on a monthly basis. The data is then assessed at monthly and quarterly valuation meetings by senior management. If internal or external factors are deemed to be significant further assessment is undertaken and the specific is revalued to the best fair value estimate. Revaluations are approved by the Board of Directors in connection with the Company’s financial reports.
AvitoThe Group’s investment in Avito is valued as a level 3 investment as per December 31, 2017.
As per December 31, 2017, Vostok New Ventures has valued Avito on the basis of a refined EV/EBITDA multiples valuation model. The latest transaction in the company was announced on October 23, 2015. Naspers Ltd, one of Avito’s shareholders, acquired secondary shares from other existing shareholders to increase its stake from 17.4% to 67.9% of the outstanding shares in Avito at an equity valuation of USD 2.7 bn, which included cash in the company of approximately USD 240 mln. The transaction closed in November 2015. Vostok New Ventures has deemed the latest transaction in the company not to be the best fair value estimate of Avito as per December 31, 2017. Avito has performed very well with revenue growth of approximately 31% y-o-y during 2017. Considering the time passed since the last transac-tion and the company’s continued progress in mind, a future looking EV/EBITDA peer multiples model has been deemed to generate the best fair value estimate as per December 31, 2017. The model values Vostok’s stake in Avito to USD 591.9 mln, or USD 4.5 bn for the 100% of the company. This is 32% higher compared with the model-based valuation as per December 31, 2016. Using exactly the same model as per year-end 2016, Avito would have been valued at USD 3.7 bn as per year-end 2017.
Financial Information

��72����72��
EV/EBITDA 2018E vs. EBITDA CAGR 2018E–2020E30x 30x
25x 25x
20x 20x
15x 15x
10x 10x
5x 5x
0x 0x
0% 5% 10% 15% 20% 25% 30% 35%
Rightmove REA Group
Schibsted
58.com
Zillow
AutohomeAutotrader
Zoopla
Carsales
Scout24SEEK
Trade meeBay
Axel Springer
Avito
The peer group includes 16 listed online classifieds peers including REA Group, Rightmove, Autotrader, Scout24 and 58.com. The average multiple of the peer group is 16.9x and the median multiple is 15.6x, and the multiple applied on Avito has been adjusted to better reflect Avito’s strong EBITDA growth compared to the listed peer group.
Below tables show the sensitivity in the model-generated valuation in relation to USD/RUB and the peer multiple used as per December 31, 2017.
Sensitivity EBITDA multiple–15% –10% 21.0x +10% +15%
Valuation of Vostok New Ventures’ Avito investment, USD million 506 535 592 649 678
Sensitivity EBITDA CAGR21% 22% 23% 24% 25%
Valuation of Vostok New Ventures’ Avito investment, USD million 569 580 592 603 615
Sensitivity USD/RUB–15% –10% 57.54 +10% +15%
Valuation of Vostok New Ventures’ Avito investment, USD million 517 540 592 656 693
BlaBlaCarAs per December 31, 2017, the BlaBlaCar investment is classified as a level 3 investment valued on the basis of multiples of Gross Merchandise Value (GMV) and net revenue. Vostok New Ventures has invested a total of EUR 109.5 mln in BlaBlaCar and owns approximate-ly 9.3% of BlaBlaCar on a fully diluted basis as per December 31, 2017. The company valuation as per December 2017, is 17% lower due to a change from a transaction based valuation based on the last trans-action on market terms which closed in the fourth quarter 2016 to a model based valuation. During 2017 there have been a number of small secondary transactions in the company where Vostok New Ventures has acquired additional shares in the company. These transactions, which have been driven by the sellers needing liquidity, have not been done at fair value and are not used in the fair value estimation of the company as per December 31, 2017. The model, first used in the third quarter 2017 reflects BlaBlaCar’s continued GMV growth but less than originally expected net revenue development. As only a few markets monetize at a mature level, net revenue alone does not capture the fair value of BlaBlaCar. In this respect GMV is a good metric as it captures value also in large pre-monetization markets such as Russia. Currently, the vast majority of BlaBlaCar’s net revenue is generated in France and a few other European markets and is denominated in EUR. The model looks at both a forward GMV multiple and a forward net revenue multiple, to best reflect bot monetized and non-monetized markets. BlaBlaCar’s GMV is the value transacted by the platform, i.e. riders paying drivers their proportionate share for the cost of the trip. Net revenue is the percent BlaBlaCar takes in commission either directly through a fee at each ride or through a subscription-based model. BlaBlaCar monetize (takes a percent of the price of each ride) only in the most developed markets where France is the largest reve-nue contributor. In most market BlaBlaCar does not yet take any fee and their take rate in those markets is zero. As per year-end 2017, the company has over 60 mln members and 18 mln travelers per quarter.
Sensitivity in model-based BlaBlaCar valuation as per December 31, 2017
-15% -10%EV/Sales multiple +10% +15%
Valuation of Vostok New Ventures’ BlaBlaCar investment, USD million 100.8 106.7 118.6 130.5 136.4
Sensitivity in model-based BlaBlaCar valuation as per December 31, 2017
-15% -10%France
GMV +10% +15%Valuation of Vostok New Ventures’ BlaBlaCar investment, USD million 113.3 115.0 118.6 122.1 123.9
GettAs per December 31, 2017, the Gett investment is classified as a level 3 investment as it is valued on the basis of a valuation model based on discounted cash flows. The model is based on a five year forecast with the main assumptions of a 18.5% WACC and a 2.6% long-term growth rate. As per December 31, 2017, Vostok New Ventures’ holding is valued at USD 59.2 mln. The company has continued to perform well in its four markets, although they are facing tough competition in the Russian market following the merger of Yandex.Taxi and Uber in that market. This has also been reflected in the model.
Sensitivity of WACC in model-based Gett valuation as per December 31, 2017
16.5% 17.5% 18.5% 19.5% 20.5%Valuation of Vostok New Ventures’ Gett investment, USD million 71.4 64.9 59.2 54.2 49.9
PropertyfinderAs per December 31, 2017, the Propertyfinder investment is clas-sified as a level 3 investment as it is valued at USD 28.7 mln on the basis of EV/Sales-multiple valuation model. The median multiple of the peer group is 7.7x and consists of a number of listed real estate verticals including, but not limited to, Scout24, Rightmove and REA Group. The model-based valuation is approximately 42% higher than the previous transaction-based valuation. The revaluation is driven by Propertyfinder’s strong net revenue growth as well us moving the model to look further out in the future.
Sensitivity in model-based Property finder valuation as per December 31, 2017
-15% -10%EV/Sales multiple +10% +15%
Valuation of Vostok New Ventures’ Propertyfinder investment, USD million 24.4 25.8 28.7 31.6 33.0
babylonAs per December 31, 2017, the babylon investment is classified as a level 2 investment as it is valued on the basis of the latest transaction in the company. In the second quarter of 2017, Vostok New Ventures invested USD 21.7 mln (GBP 17.3 mln) in the company in the context of a USD 60 mln financing round. As per December 31, 2017, the large financing round in 2Q17 is deemed the best fair value estimate of the company as the company is performing in line with plan and no sig-nificant internal or external factors have been deemed to warrant a revaluation of the company.
OneTwoTripAs per December 31, 2017, OneTwoTrip is classified as a level 3 invest-ment as it is valued at USD 20.8 mln on the basis of future EV/Net Sales-multiple valuation model, compared to a transaction-based val-uation as per December 31, 2016. This is approximately 21% higher than the value per share as of December 31, 2016. The revaluation is mainly driven by OTT’s revenue growth. The model-based valua-tion is deemed as the best fair value estimate of OneTwoTrip as per December 31, 2017. The median multiple of the peer group is 4.2x and consists of a number of listed online travel agencies (OTAs) includ-ing, but not limited to Ctrip, MakeMyTrip and Webjet. Vostok New
Financial Information

��73����73��
Ventures owns 16.7% of the company on a fully diluted basis as per December 31, 2017, which is an increase from 14.6% as per year-end 2016, due to a non-exercised option held by another shareholder that lapsed during 2017.
Sensitivity in model-based OneTwoTrip valuation as per December 31, 2017
-15% -10% +10% +15%Valuation of Vostok New Ventures’ OneTwoTrip investment, USD million 17.7 18.7 20.8 22.9 23.9
WallapopAs per December 31, 2017, Wallapop is classified as a level 2 invest-ment as it is valued on the basis of the latest transaction in the compa-ny and the latest transaction in the Wallapop-owned Letgo US, both of which were concluded during 2017. Vostok New Ventures did not participate in either transaction and its indirect stake in the company is valued at USD 13.5 mln. As per December 31, 2017, the two transac-tions in 3Q17 are deemed to generate the best fair value estimate for the company as the company is performing in line with plan and no significant internal or external factors have been deemed to warrant a revaluation of the company since the transactions.
Hemnet (through YSaphis S.A. and Merro Partners S.A.)As per December 31, 2017, Hemnet is classified as a level 2 investment as it is valued on the basis of the latest transaction in the company, which closed in early January 2017. In December 2016, Vostok New Ventures invested a total of SEK 93.3 mln (USD 10.3 mln) in the company through the co-investment vehicle Merro Partners S.A. As per December 31, 2017, the transaction that closed in the beginning of 2017 is deemed the best fair value estimate of the company as the company is performing in line with plan and no significant internal or external factors have been deemed to warrant a revaluation of the company.
MerroAs per December 31, 2017, Merro is classified as a level 3 investment and is valued on the basis of a Sum of the Parts valuation model. As per December 31, 2017 Vostok New Ventures stake in the company is valued to USD 9.4 mln which is 24% lower than the last transaction in the company. The main driver of the revaluation is a revised valuation of Opensooq which is attributable to the majority of the fair value of Merro. As per December 31, 2017, Opensooq accounts for 61% of the fair value estimate of Merro.
Sensitivity in Sum of the Parts-based Merro valuation as per December 31, 2017
-15% -10%Opensooq valuation +10% +15%
Valuation of Vostok New Ventures’ Merro investment, USD million 8.5 8.8 9.4 9.9 10.2
Naseeb NetworksAs per December 31, 2017, Naseeb Networks is classified as a level 3 investment as it is valued on the basis of a future looking EV/Sales peer multiples valuation model. The model values Vostok’s stake in Naseeb Networks to USD 4.2 mln compared to USD 4.0 mln as per December 31, 2016.
The peer group includes four online classifieds/jobs portal peers including SEEK, Infoedge, and 51job. The average multiple of the peer group is 8.3x and the median multiple is 6.8x.
Sensitivity in model-based Naseeb valuation as per December 31, 2017
-15% -10%EV/Sales multiple +10% +15%
Valuation of Vostok New Ventures’ Naseeb investment, USD million 3.6 3.8 4.2 4.6 4.8
CarZarAs per December 31, 2017, CarZar is classified as a level 2 investment as it is valued on the basis of the latest transaction in the company, which closed in November 2017. Vostok New Ventures invested an
additional USD 1.5 mln in the company, which brings VNV’s total investment to USD 3.0 mln.
El Basharsoft As per December 31, 2017, el Basharsoft (Wuzzuf and Forasna) is clas-sified as a level 3 investment as it is valued on the basis of a forward looking EV/Sales peer multiples valuation model. The model values Vostok New Ventures’ stake in el Basharsoft to USD 2.3 mln compared to the latest transaction in the company which closed in the end of July 2015 with a valuation of USD 1 mln for Vostok New Ventures’ stake. Vostok New Ventures owns 17.0% of el Basharsoft on a fully diluted basis as per December 31, 2017 following a smaller secondary transaction in the company in the second quarter of 2017.
The peer group includes four online classifieds/jobs portal peers including SEEK, Infoedge, and 51job. The average multiple of the peer group is 8.3x and the median multiple is 6.8x.
Sensitivity in model-based el Basharsoft valuation as per December 31, 2017
-15% -10%EV/Sales multiple +10% +15%
Valuation of Vostok New Ventures’ el Basharsoft investment, USD million 2.0 2.1 2.3 2.6 2.7
VezeetaAs per December 31, 2017, Vezeeta (DrBridge) is classified as a level 2 investment as it is valued on the basis of the latest transaction in the company which is an extension of the financing round of 2016 and closed in the second quarter of 2017. Vostok New Ventures invested an additional 0.33 mln in the company. As per December 31, 2017, Vostok New Ventures values its investment in Vezeeta to USD 1.8 mln.
KEH AB (YouScan and other assets)Following the latest transaction in the company which closed in the first quarter of 2015, Vostok New Ventures owns 33.9% of KEH AB fully diluted. As per December 31, 2017, all value in KEH AB is derived from a sales-multiple based valuation of YouScan. This model-ap-proach is deemed the best fair value estimate of KEH as per December 31, 2017. The model generates a valuation approximately 56% lower than the valuation used at year-end 2016. KEH AB is classified as a level 3 investment.
Sensitivity in model-based KEH AB valuation as per September 30, 2017
-15% -10%EV/Sales multiple +10% +15%
Valuation of Vostok New Ventures’ KEH AB investment, USD thousand 1,297 1,373 1,526 1,679 1,755
Agente ImóvelAs per December 31, 2017, Agente Imóvel is classified as a level 2 investment as it is valued on the basis of the latest transaction in the company, which closed in the second quarter of 2017. Vostok New Ventures invested a total of USD 1.0 mln in the company.
Carable (Garantibil AB)In April 2017, Garantibil applied for corporate restructuring. The restructuring failed, and the company was placed in bankruptcy on August 1, 2017.
Delivery Hero (equity)As per December 31, 2017, the equity holding in Delivery Hero is valued on the basis of the latest closing price of Delivery Hero in December 2017 following its IPO. The valuation amounts to USD 0.89 mln.
Liquidity management (Level 1)As per December 31, 2017, Vostok New Ventures own USD 8.0 mln in money market funds as part of the Company’s liquidity management operations. The funds are quoted on a daily basis and the fair value as per December 31, 2017, is the last published NAV as per year-end 2017.
Financial Information

��74����74��
Loan receivablesThe fair value estimation of loan receivables relating to Delivery Hero and Kite Ventures (Kite was fully repaid in January 2017 and Delivery Hero in July 2017) is outlined in the table below. Fair value estimation of loan receivables Dec 31,
2017Dec 31,
2016Short-term – 7,699Long-term – 24,074Total loan receivables – 31,773
As per December 31, 2017, the company does not have any outstanding loan receivables.
Note 5 GeneralIncorporation and legal structureVostok New Ventures Ltd (the Company or the Parent Company) is an investment company with its focus on portfolio investments with con-siderable potential for value appreciation. The Company was incorpo-rated in Bermuda on April 5, 2007, as an exempted limited liability com-pany under the Bermuda Companies Act 1981. The Swedish Depository Receipts of Vostok New Ventures (SDB) are listed on the Nasdaq Nordic Exchange Stockholm, Mid Cap section. Ticker: VNV SDB.
As of December 31, 2017, the Vostok New Ventures Ltd Group consisted of the Bermudian parent company Vostok New Ventures Ltd; one wholly-owned Cypriot subsidiary, Vostok New Ventures (Cyprus) Limited; one majority-owned Dutch cooperative, Vostok Co-Investment Coöperatief B.A.; and one wholly-owned Swedish sub-sidiary, Vostok New Ventures AB.
The registered office of the Company is in Hamilton, Bermuda (Codan Services Ltd, 2 Church Street, Hamilton, Bermuda). Vostok New Ventures AB’s registered office is at Hovslagargatan 5, 111 48 Stockholm, Sweden.
Note 6 Result from financial assets at fair value through profit or loss
Group 2017
Group 2016
Proceeds from sale of financial assets at fair value through profit or loss 2,546 7,830Acquisition value of sold financial assets at fair value through profit or loss -2,333 -3,040Change in fair value of remaining financial assets at fair value through profit or loss 167,477 129,050Result from financial assets at fair value through profit or loss 167,691 133,840
During 2017 and 2016 result from financial assets at fair value through profit or loss comprises the result from fair value changes of financial assets that have been designated on initial recognition as assets to be measured at fair value with fair value changes in profit or loss.
Note 7 Dividend and coupon income
Group 2017
Group 2016
Dividend and coupon income recognized in the income statement¹,2 1,357 6,761whereof unsettled at balance sheet date – 6,761Tax withheld on dividends – –Net proceeds from dividends and coupons, net of tax, recognized in the income statement during the year 1,357 6,761
1. 2017: USD 1.4 mln coming from the Avito dividend. 2. 2016: USD 6.8 mln coming from the Avito dividend in December
2016.
Note 8 Operating expenses by nature
Group
2017
Group
2016
Parent Company
2017
Parent Company
2016Employee benefit expense (Note 23) 4,595 4,807 1,946 287Depreciation and write down of property, plant and equipment – – – –Operating lease expenses 136 120 – –Service agreement between Vostok New Ventures AB and Vostok New Ventures Ltd – – 3,413 4,886Other expenses 1,574 1,739 1,122 1,681Total operating expenses 6,305 6,666 6,481 6,854
Lease rentals amounting to TUSD 136 (2016: 120) relating to rent of office space in Stockholm have been recognized in the income statement.
Note 9 TaxCorporate income tax – generalThe parent company, Vostok New Ventures Ltd, is exempted and therefore not liable for tax in Bermuda.
The Group’s Cypriot entity is subject to corporation tax on taxable profits at the rate of 12.5% (2016: 12.5%).
Under certain conditions, interest may be exempt from income tax and only subject to defence contribution at the rate of 30% as from April 29, 2013 (August 31, 2011–April 28, 2013: 15%).
In certain cases dividends received from abroad may be subject to defence contribution at the rate of 30% (2016: 30%).
Any gains from disposal of qualified securities are not subject to corporate tax in Cyprus.
As from the tax year 2012, brought forward losses of the prior five years may be utilized.
During 2017, the Swedish subsidiary’s profits are subject to Swedish income tax at the rate of 22% (2016: 22%).
Income tax expenseGroup
2017Group
2016Current tax -68 -89Deferred tax – –Taxation -68 -89
The tax on the Group’s result before tax differs from the theoretical amount that would arise using the tax rate of the countries where the Group operates as follows:
Group 2017
Group 2016
Result before tax 135,563 145,250Result before tax 161,454 135,563Tax calculated at domestic tax rates applicable to profits in the respective countries -19,770 -16,782Tax effects of:
– Income not subject to tax 21,449 17,724– Expenses not deductible for tax purposes -1,747 -1,031– Adjustment in respect of prior years – –– Utilisation of previously unrecognised tax losses – –– Tax losses for which no deferred income tax
asset was recognised – -2Tax charge -68 -89
The weighted average applicable tax rate was 13% (2016: 13%).
Deferred taxDeferred income tax assets are recognized for tax loss carry forwards to the extent that the realization of the related tax benefit through future taxable profits is probable.
Financial Information

��75����75��
Note 10 Earnings per shareBasic earnings per share have been calculated by dividing the net result for the financial year by the weighted average number of shares in issue during the year.
Diluted earnings per share have been calculated by adjusting the weighted average number of ordinary shares outstanding to assume conversion of all dilutive ordinary shares. Share options are the only category of dilutive potential ordinary shares for the company. For the share options, a calculation is made in order to determine the number of shares that would have been acquired at fair value (determined as the average annual market share price of the Company’s shares) based on the monetary value of the subscription rights to outstanding share options. The number of shares calculated as above is compared with the number of shares that would have been issued assuming the exer-cise of the options.
2017 2016Profit attributable to the equity holders of the company 161,386 135,474Weighted average number of ordinary shares on issue 85,263,922 76,544,877Earnings per share, basic 1.89 1.77Adjustment for dilution effect of incentive options 140,089 –Weighted average number of ordinary shares for diluted 85,404,011 76,544,877Earnings per share, diluted 1.89 1.77
Note 11 Property, plant and equipmentGroup
At January 1, 2016Cost or valuation –Accumulated depreciation –Net book amount –
Year ended December 31, 2016Opening net book amount –Additions 48Disposals –Write downs –Depreciation charge –Exchange differences –Closing net book amount 48
At December 31, 2016Cost or valuation 48Accumulated depreciation –Net book amount 48
Year ended December 31, 2017Opening net book amount 48Additions –Disposals –Write downs –Depreciation charge –Exchange differences 5Closing net book amount 53
Depreciations amounting to net USD 0 thousand (2016: 0) for the Vostok New Ventures Group have been recognized among operating expenses in the income statement (see also Note 8).
Note 12 Financial instruments by categoryThe accounting policies for financial instruments have been applied to the line items below:
December 31, 2017 – GroupAssets as per balance sheet
Loans and receivables
Assets at fair value through profit and loss
– designated
Total
Financial assets at fair value through profit or loss – 900,047 900,047Loan receivables – – –Cash and cash equivalents 51,079 – 51,079Total assets 51,079 900,047 951,126
Liabilities as per balance sheetLiabilities at
amortised costTotal
Borrowings 71,541 71,541Total liabilities 71,541 71,541
December 31, 2016 – GroupAssets as per balance sheet
Loans and receivables
Assets at fair value through profit and loss
– designated
Total
Financial assets at fair value through profit or loss – 691,582 691,582Loan receivables 31,773 – 31,773Cash and cash equivalents 34,780 – 34,780Total assets 66,553 691,582 758,135
Liabilities as per balance sheetLiabilities at
amortised costTotal
Borrowings 32,400 32,400Total liabilities 32,400 32,400
December 31, 2017 – Parent CompanyAssets as per balance sheet
Loans and receivables
Assets at fair value through profit and loss
– designated
Total
Financial assets at fair value through profit or loss – 8,023 8,023Loan receivables – – –Cash and cash equivalents 47,829 – 47,829Receivables from Group Companies 206,303 – 206,303Total assets 254,132 8,023 262,155
Liabilities as per balance sheetLiabilities at
amortised costTotal
Borrowings 71,541 71,541Total liabilities 71,541 71,541
Financial Information

��76����76��
December 31, 2016 – Parent CompanyAssets as per balance sheet
Loans and receivables
Assets at fair value through profit and loss
– designated
Total
Financial assets at fair value through profit or loss – 1,147 1,147Loan receivables 31,773 – 31,773Cash and cash equivalents 27,639 – 27,639Receivables from Group Companies 165,236 – 165,236Total assets 224,648 1,147 225,795
Security/Company name Currency Number of shares held Dec 31, 2017
Fair value (USD), Dec 31,
2017
Ownership share, %
Number of shares held
Dec 31, 2016
Fair value (USD), Dec 31,
2016
Ownership share, %
GroupAvito USD 6,166,470 591,938,454 13.2% 6,166,470 449,281,016 13.3%BlaBlaCar EUR 14,492,319 118,615,542 9.3% 12,238,079 107,738,524 8.0%Gett USD 18,171,609 59,198,650 3.6% 18,171,609 50,358,980 4.2%Propertyfinder USD 142,308 28,704,345 10.1% 137,916 19,999,199 10%babylon GBP 84,246 23,335,857 10.0% – – –OneTwoTrip USD 96,228 20,810,533 16.7% 96,228 14,958,960 14.6%Wallapop EUR 21,872 13,533,279 2.9% 21,872 11,520,786 2.9%Hemnet SEK 81,024,902 11,207,369 5.9% n/a 10,252,714 7.0%Merro USD 10,900 9,358,731 22.5% 10,900 12,384,907 21.6%Naseeb Networks (Rozee and Mihnati) USD 11,481,176 4,203,772 23.7% 11,481,176 4,034,693 23.7%CarZar USD 831 3,521,186 16.4% – – –El Basharsoft (Wuzzuf and Forasna) USD 339 2,347,911 17.0% 1,152,956 14.8%Vezeeta USD 358,069 1,833,313 7.9% 292,965 894,724 7.8%KEH AB (YouScan) USD 8,808,426 1,526,375 33.9% 8,808,426 3,515,204 33.9%Agente Imóvel USD 3,591 1,000,000 20.0% – – –Carable SEK – – – 18,332 2,198,526 7.68%Delivery Hero AG, equity EUR – 888,401 – – 2,137,575 –Total non current financial assets at fair value through profit or loss 892,023,718 691,581,816
Parent CompanyEquity component of Delivery Hero loan – 1,147,070Total non current financial assets at fair value through profit or loss – 1,147,070
The assets specified in the table below are investments in financial assets at fair value through profit or loss.
Parent Company
2017
Parent Company
2016Beginning of the year 1,147 1,021Additions 8,000 –Transfer from Vostok New Ventures Ltd to Vostok New Ventures (Cyprus) Limited -828 -828Disposals -319 –Change in fair value 23 954End of the year 8,023 1,147
Liabilities as per balance sheetLiabilities at
amortised costTotal
Borrowings 32,400 32,400Total liabilities 32,400 32,400
Note 13 Non-current financial assets at fair value through profit or loss
Group 2017
Group 2016
Beginning of the year 691,582 463,538Additions 43,320 102,034Reclassifications – –Disposals -2,546 -3,040Change in fair value for the year 167,691 129,050End of the year 900,047 691,582
Financial Information

��77����77��
Change in financial assets at fair value through profit or lossCompany Opening balance
Jan 1, 2017, USD
Investments/ (disposals), net,
USD
FV change, USD
Closing balanceDec 31, 2017,
USD
Percentage weight of total
portfolioAvito AB 449,281,016 203 142,657,235 591,938,454 62.2%BlaBlaCar 107,738,524 8,423,250 2,453,768 118,615,542 12.5%Gett 50,358,980 – 8,839,670 59,198,650 6.2%Propertyfinder 19,999,199 500,073 8,205,073 28,704,345 3.0%babylon – 21,709,025 1,626,832 23,335,857 2.5%OneTwoTrip 14,958,960 – 5,851,573 20,810,533 2.2%Wallapop 11,520,768 – 2,012,511 13,533,279 1.4%Hemnet (through YSaphis S.A. and Merro Partners S.A.) 10,252,714 – 954,655 11,207,369 1.2%Merro 12,384,907 – -3,026,176 9,358,731 1.0%Naseeb Networks (Rozee and Mihnati) 4,034,693 – 169,079 4,203,772 0.4%CarZar – 3,000,000 521,186 3,521,186 0.4%El Basharsoft (Wuzzuf and Forasna) 1,158,956 236,786 952,169 2,347,911 0.2%Vezeeta (DrBridge) 894,724 333,334 605,255 1,833,313 0.2%KEH AB (YouScan and other assets) 3,515,204 – -1,988,829 1,526,375 0.2%Agente Imóvel – 1,000,000 – 1,000,000 0.1%Carable (Garantibil AB) 2,198,526 117,742 -2,316,268 – –Delivery Hero AG, equity 2,137,575 -1,749,058 499,884 888,401 0.1%Delivery Hero AG, equity component 1,147,070 -797,046 -350,024 – –Liquidity management – 8,000,000 23,392 8,023,392 0.8%Total 691,581,816 40,774,309 167,690,984 900,047,110
Note 14 Non-current loan receivables
Group 2017
Group 2016
Beginning of the year 24,075 23,450Additions – –Repayments -29,954 -1,997¹Interest income 3,906 3,612Reclassifications – –Exchange differences 1,973 -990Interest expense/Revaluation – –End of the year 0 24,075
1. Includes Delivery Hero monthly interest payments and one-time interest payment from Kite Ventures during 2015.
Counterparty Credit rating Dec 31, 2017
Nominal value Dec 31, 2017
Nominal value Dec 31, 2016
Carrying value Dec 31, 2017
Carrying value Dec 31, 2016
Terms of interest
Maturity
Delivery Hero AG – – 26,291 – 24,075 7.25%/8.75%/10.25% Aug 2018Total – 26,291 – 24,075
In August 2014, Vostok New Ventures invested EUR 25 mln in senior secured debt of Delivery Hero with 9.5–10.5 per cent annual nominal interest. The loan also included a smaller equity component in which Vostok New Ventures has received a number of shares and warrants in the company. As per December 31, 2014 the warrants had been converted into equity and the total value of the equity component amounted to USD 7.3 mln. In February 2015, 85 per cent of the equity
component was sold for a total purchase price of approximately USD 9.4 mln. In August 2015, the loan was restructured which resulted in new terms including an additional equity component and amended nominal interest rate. The new nominal interest rate was 7.25–10.25% and the loan maturity date was in August 2018. In early July 2017, Delivery Hero repaid the EUR 25 mln loan following its listing on the Frankfurt stock exchange.
Financial Information

��78����78��
Note 15 Current loan receivables
Group 2017
Group 2016
Beginning of the year 7,699 9,072Additions – –Repayments -7,664 -2,205Reclassifications – –Interest income 12 1,136Exchange differences -47 -304End of the year 0 7,699
Counterparty Credit rating Dec 31, 2017
Nominal value Dec 31, 2017
Nominal value Dec 31, 2016
Carrying value Dec 31, 2017
Carrying value Dec 31, 2016
Terms of interest
Maturity
Kite Ventures Partners III Ltd – – 7,699 – 7,699 13% Sep 2016/March 2017Total – 7,699 – 7,699
In September 2014, Vostok New Ventures invested EUR 8 mln in senior secured debt of Kite Ventures. The debt carried 13 per cent annual nominal interest and had 2-year maturity.
On September 18, 2016, Kite invoked its right under the loan agree-ment to a six-month grace period, whereby the term of the loan was
extended by up to another six months, i.e., until March 17, 2017. A partial loan repayment in the amount of EUR 2 mln was received in October 2016. The Kite loan was fully repaid in January 2017.
The Kite loan features a smaller equity component, which on December 31, 2017 and December 31, 2016 had no value.
Note 16 Other current receivables
Group
Dec 31, 2017
Group
Dec 31, 2016
Parent Company
Dec 31, 2017
Parent Company
Dec 31, 2016
Prepayments and accrued income 166 6,830 62 45Other receivables 2,040 – – –Total 2,206 6,830 62 45
Note 17 Cash and cash equivalentsCash, cash equivalents and bank overdrafts include the following for the purposes of the cash flow statement:
Group Dec 31,
2017
Group Dec 31,
2016Cash and cash equivalents 51,079 34,780of which short-term investments equivalent to cash – –Total 51,079 34,780
Note 18 Share capital and additional paid in capitalGroup and Parent Company
Number of shares held
Share capital
Additional paid in capital
At January 1, 2016 73,499,555 23,520 42,996New shares issued 12,239,261 3,917 82,714Redemption program – – –Repurchase of own shares -50,507 -16 -280Value of employee services:– Employee share option scheme – – 231– Share-based long-term incentive
program – – 130At December 31, 2016 85,688,309 27,420 125,791New shares issued – – –Redemption program – – –Repurchase of own shares -1,105,952 -354 -7,854Value of employee services:– Employee share option scheme – – –– Share-based long-term incentive
program – – 1,136At December 31, 2017 84,582,357 27,066 119,073
On May 14, 2014, Vostok New Ventures’ Board of Directors, acting under Bermudan law and the Company’s bye-laws, mandated the management of Vostok New Ventures to repurchase up to 10 percent of the Swedish Depository Receipts (SDRs) of the Company then out-standing during the period until the next AGM.
During 2017, Vostok New Ventures repurchased 1,105,952 (2016: 50,507) SDRs under the 2017 repurchase mandate.
There are currently 100,000 (2016: 100,000) ordinary shares avail-able under the employee share option scheme. Each option entitles the holder to one new share (SDR) in Vostok New Ventures Ltd. For more information on the options, see Note 23.
Financial Information

��79����79��
Note 19 Borrowings
Group
Dec 31, 2017
Group
Dec 31, 2016
Parent Company
Dec 31, 2017
Parent Company
Dec 31, 2016
Borrowings 71,541 32,400 71,541 32,400Total 71,541 32,400 71,541 32,400
Change in interest-bearing loans, Group and Parent CompanyNon-cash transactions
Opening balance
2017
Cash trans-actions
Interest expense
Exchange differences
Closing balance
2017Interest-bearing loans 32,400 27,267 3,574 8,300 71,541Change in interest-bearing loans 32,400 27,267 3,574 8,300 71,541
The fair value of interest-bearing loans are estimated to correspond to the carrying value.
Bonds 2016/2019On June 2, 2016, the Company announced that it had successfully placed three-year senior secured bonds in the amount of SEK 300 mil-lion. The bonds, maturing in June 2019, bore a fixed coupon of 6.50% with quarterly interest payments.
The bonds were listed for trading on Nasdaq Stockholm. The first day of trading was July 8, 2016. On July 12, 2017, the Company announced that the board of directors had resolved to redeem the Company’s entire SEK 300,000,000 bond 2016/2019 with ISIN SE0008406367. The bond was redeemed due to the early repayment by Delivery Hero AG of its loan of EUR 25 mln to the Company. The Bond was redeemed on August 17, 2017.
Bonds 2017/2020On June 22, 2017, the Company announced that it had successfully placed three-year senior secured bonds in the amount of SEK 600 mil-lion within a total frame of SEK 800 million. The bonds, maturing on June 22, 2020, bear a fixed coupon of 5.50% with quarterly interest payments.
The bonds are listed for trading on Nasdaq Stockholm. The first day of trading was July 19, 2017. The value of the bond debt as per December 31, 2017 was USD 71.54 million.
Note 20 Other current liabilities
Group
Dec 31, 2017
Group
Dec 31, 2016
Parent Company
Dec 31, 2017
Parent Company
Dec 31, 2016
Other current liabilities 307 5,949 107 114Accrued tax liability 783 783 – –Total 1,090 6,732 107 114
Note 21 Pledged assets and contingent liabilitiesPledged assetsOn August 17, 2017, the Company redeemed the three-year senior secured bonds in the amount of SEK 300 million due to the early repay-ment by Delivery Hero AG of its loan of EUR 25 mln to the Company.
The Bonds were secured by a first priority pledge over shares in the Company’s wholly owned subsidiary Vostok New Ventures (Cyprus) Limited and by a charge over the Company’s cash and custody account. Due to the early redemption of the senior secured bond there were no pledged assets in the Company by December 31, 2017.
Group
Dec 31, 2017
Group
Dec 31, 2016
Parent Company
Dec 31, 2017
Parent Company
Dec 31, 2016
Pledged assets 0 532,128 0 84,389Total 0 532,128 0 84,389
Contingent liabilitiesThe Swedish Tax Agency (STA) has audited Vostok New Ventures AB’s VAT returns for the period January 2013–December 2014 during 2015. According to the STA’s decision, Vostok New Ventures AB is obliged to pay an additional amount of output VAT of SEK 13,767,907 together with tax penalties of SEK 2,753,579 (in total about USD 2 mln) on the services supplied to Vostok New Ventures Ltd. Vostok New Ventures AB has appealed the STA’s decision to the administrative court. On June 1, 2017, the County Administrative Court in Stockholm issued its ruling in which they chose to agree with the Swedish Tax Agency. Vostok New Ventures AB has appealed the ruling to the Court of Appeal and currently sees no grounds for making provisions for potential addi-tional taxes ensuing from this matter, which is also supported by our legal advisors. However, this is considered to be a contingent liability.
Note 22 Shares in subsidiariesParent Company
Country Number of shares
Share of capital
and votes, %
Book value Dec 31,
2017 USD
thousand
Book value Dec 31,
2016 USD
thousandVostok New Ventures (Cyprus) Limited Cyprus 150,000 100 84,389 84,389
Other subsidiaries of the GroupVostok New Ventures AB Sweden 1,000 100Vostok Co-Investment Coöperatief B.A
The Nether-lands N/A
Total 84,389 84,389
All the companies are included in the consolidated financial state-ments, except Vostok Co-Investment Coöperatief B.A. which is a spe-cial purpose vehicle to own shares in some portfolio companies.
Note 23 Employee benefit expense
Group
2017
Group
2016
Parent Company
2017
Parent Company
2016Wages and salaries 2,130 3,249 350 287Social security costs 1,012 1,097 393 112Pensions costs 241 218 – –Other employee benefit expenses 1,214 243 1,203 231Total employee benefit expense 4,597 4,807 1,946 630
Group
2017
Group
2016
Parent Company
2017
Parent Company
2016Salaries and other remunera-tions to the management and the Board of Directors of the parent and its subsidiaries 3,150 3,285 1,415 518Salaries and other remunera-tions to other employees 423 425 139 –Total salaries 3,573 3,710 1,553 518
Decisions regarding remuneration to managers are made by the Board of Directors. The Managing Director has the right to 12 months’ salary in the event of the termination of appointment on part of the compa-ny. He must himself observe 6 months’ notice of termination. The rest of the management has a notice period of three months, which also applies to the company in the event of termination on part of the com-pany. No notice period applies to the Board of Directors. The average number of persons employed by the Group during the year, excluding members of the Board of Directors, was 5 (6), of which 3 (4) were men. The average number of persons in the management was 3 (3), of which 2 were men (2).
Financial Information

��80����80��
Group 2017Base salaries/
board feeVariable
compensationsPension
expensesShares based
compensationsTotal
Lars O Grönstedt 133 – – – 133Josh Blachman 54 – – – 54Victoria Grace 54 – – – 54Ylva Lindquist 54 – – – 54Keith Richman 54 – – – 54Per Brilioth 478 515 101 649 1,743Other management and board members of subsidiaries 381 154 106 415 1,057Total 1,209 669 207 1,065 3,150
Group 2016Base salaries/
board feeVariable
compensationsPension
expensesShares based
compensationsTotal
Lars O Grönstedt 114 – – – 114Josh Blachman 43 – – – 43Victoria Grace 43 – – – 43Ylva Lindquist 43 – – – 43Keith Richman 43 – – – 43Per Brilioth 433 996 97 135 1,661Other management and board members of subsidiaries 363 785 93 96 1,337Total 1,082 1,781 190 231 3,285
Parent 2017Base salaries/
board feeVariable
compensationsPension
expensesShares based
compensationsTotal
Lars O Grönstedt 133 – – – 133Josh Blachman 54 – – – 54Victoria Grace 54 – – – 54Ylva Lindquist 54 – – – 54Keith Richman 54 – – – 54Per Brilioth – – – 649 649Other management and board members of subsidiaries – – – 415 415Total 350 – – 1,065 1,415
Parent 2016Base salaries/
board feeVariable
compensationsPension
expensesShares based
compensationsTotal
Lars O Grönstedt 114 – – – 114Josh Blachman 43 – – – 43Victoria Grace 43 – – – 43Ylva Lindquist 43 – – – 43Keith Richman 43 – – – 43Per Brilioth – – – 135 135Other management and board members of subsidiaries – – – 96 96Total 286 – – 231 518
Bonuses were paid out during 2017 in connection with the successful exit in several portfolio companies during 2016.
The managing director has a defined contribution pension plan, according to the Group’s pension policy which is based on Swedish ITP-standards. The Group has no further obligations once the contri-butions have been paid. The contributions are recognized as employee benefit pension expense in profit or loss when they are due. The pen-sion is not tied to the managing director’s employment and is based on the managing director’s base salary. All other employees also have defined contribution pension plans, according to the Group’s pension policy which is based on Swedish ITP-standards.
The 2010 Incentive ProgramThe Annual General Meeting held on May 5, 2010 decided in accor-dance with the proposal from the Board of Directors to adopt an incen-tive program (the “2010 Incentive Program”) entitling present and future employees to be allocated call options to acquire shares repre-sented by Swedish Depositary Receipts in Vostok New Ventures Ltd.
The terms of the 2010 Incentive Program were subsequently adjusted to reflect the results of the Share Split and Mandatory Redemption Programs concluded in October 2012 and June 2013 and again in July 2015 in connection with the spin-off of Vostok Emerging Finance Ltd. Adjusted figures are shown below, with original terms in parentheses.
The 2010 Incentive Program is governed by the following terms and conditions:
Principal Conditions and Guidelines– The exercise price for the Options shall correspond to 120 percent of
the market value of the Swedish Depositary Receipts at the time of the granting of the Options.
– The Options may be exercised during an exercise period of one month starting three years from the time of the granting.
– For employees resident outside of Sweden, no premium shall be paid for the Options and the Options may only be exercised if the holder is still employed within the Group at the time of exercise.
Financial Information

��81����81��
– For employees resident in Sweden, the employees may elect either of the following alternatives:a) No premium shall be paid for the Options and the Options may
only be exercised if the holder is still employed within the Group at the time of exercise (same as for employees resident outside of Sweden); or
b) The Options shall be offered to the employee at a purchase price corresponding to the market value of the Options at the time of the offer. The Options shall be fully transferable and will thereby be considered as securities. This also means that Options granted under this option (b) are not contingent upon employment and will not lapse should the employee leave his or her position within the Group.
– Options may be issued by the Company or by other Group companies.
Preparation and AdministrationThe Board of Directors, or a designated committee appointed by the Board of Directors, shall be authorized to determine the detailed terms and conditions for the Options in accordance with the principal conditions and guidelines set forth above. The Board of Directors may make necessary adjustments to satisfy certain regulations or market conditions abroad. The Board of Directors shall also be authorized to resolve on other adjustments in conjunction with material changes affecting the Group or its business environment, which would mean that the described conditions for the incentive scheme would no lon-ger be appropriate.
AllocationThe incentive scheme is proposed to include granting of not more than 5,115,600 (originally 2,000,000) options. Allocation of Options to the Managing Director shall not exceed 2,557,800 (originally 1,000,000) Options and allocation to each member of the executive manage-ment or to other key employees shall not exceed 1,023,120 (originally 400,000) Options.
The allocation of Options shall be decided by the Board of Directors (or by the Compensation Committee), taking into consideration, among other things, the performance of the employee and his or her importance to the Group. Specific criteria to be considered include the employee’s ability to manage and develop the existing portfolio and to identify new investment opportunities and evaluate conditions of new investments as well as return on capital or estimated return on capital in investment targets. The employees will not initially be offered the maximum allocation of Options and a performance-relat-ed allocation system will be maintained since allocation of additional Options within the mandate given by the General Meeting will require fulfilment of stipulated requirements and targets. The Compensation Committee shall be responsible for the evaluation of the performance of the employees. The outcome of stipulated targets shall, if possible, be reported afterwards.
Directors who are not employed by the Group shall not be able to participate in the scheme.
Bonus for employees resident in Sweden under option (b)In order to stimulate the participation in the scheme by employees resident in Sweden electing option (b) above, the Company intends to subsidize participation by way of a bonus payment which after tax corresponds to the Option premium. Half of the bonus will be paid in connection with the purchase of the Options and the remaining half at exercise of the Options, or, if the Options are not exercised, at maturi-ty. In order to emulate the vesting mechanism offered by the employ-ment requirement under option (a) above, the second bonus payment is subject to the requirement that the holder is still an employee of the Group at the time of exercise or maturity, as the case may be. Thus, for employees in Sweden who choose option (b), the participation in the scheme includes an element of risk.
Dilution and costsA total of 5,115,600 (originally 2,000,000) options were autho-rized under the 2010 Option Program. A total of 100,000 (originally 1,218,000) options are currently outstanding. If all options are fully exercised, the holders will acquire shares represented by Swedish Depositary Receipts corresponding to a maximum of approximately 0.12 percent of the share capital as at December 31, 2017. The pro-
posed number of Options was chosen to meet allocation requirements for the subsequent couple of years, also taking into account possible future recruitment needs.
The total negative cash flow impact for the bonus payments described above is estimated to approximately SEK 20,000,000 over the life of the incentive scheme, provided that all Options are offered to employees resident in Sweden, that all such employees choose to purchase the Options under option (b) above, and that all Option holders are still employed by the Company at the time of maturity of the Options.
Other costs for the incentive scheme, including fees to external advisors and administrative costs for the scheme are estimated to amount to approximately SEK 250 thousand for the duration of the Options.
PurposeThe purpose of the incentive scheme is to create conditions that will enable the Company to retain and recruit competent employees to the Group as well as to promote long-term interests of the Company by offering its employees the opportunity to participate in any favourable developments in the value of the Company. The Board of Directors is of the opinion that the adoption of an incentive scheme is particu-larly justified given the absence of any variable bonus scheme for the employees in the Company.
Current Status of the 2010 Incentive ProgramA total of 1,717,380 (originally 705,000) out of the 5,115,600 options authorized under the 2010 Incentive Program were issued to employ-ees in 2010 and 2011. Of these, a total of 1,495,500 options, entitling to the purchase of 1,693,020 SDRs with a strike price of SEK 12.83 (originally 31.41) matured and were exercised in August 2013, and the remaining 21,000, entitling to the purchase of 24,360 at a strike price of SEK 19.18 (originally 46.94) matured and were exercised in June, 2014. A total of 1,218,000 (originally 1,160,000) out of the remain-ing 3,312,351 (originally 3,154,620) call options available for issue under the same program were issued to employees in 2013, of which 525,000 (originally 500,000) to the Managing Director, and exercised in December, 2016.
A total of 100,000 out of the remaining 2,094,351 were issued to employees in 2016. These have a strike price of SEK 58.19 and mature in July 2019. All employees chose to purchase their awarded options at fair market value, under option (b) above.
Options Outstanding under the 2010 Incentive ProgramIssued
2016Total
Dec 31, 2017Management and board members of subsidiariesOther 100,000 100,000Total – 100,000Strike price, SEK1
58.19Market value per option at the time of issue, SEK2 10.56Option life June 7, 2016–July 31, 2019Exercise period June 1, 2019–July 31, 2019
1. The strike price for the options was calculated as 120% of the aver-age last paid price of the ten trading days leading up to the day of issue in line with the rules of the 2010 Incentive Program.
2. The market value at the time of issue was calculated with the help of the Black & Scholes options valuation model. The significant inputs into the model were share price at the grant date, exercise price, standard deviation of expected share price returns based on an analysis of historical share prices, option life; and the Swedish market interest rate at the grant date. The original value as calcu-lated on the date of grant and based on original number of options was SEK 7.46. The significant inputs into the model were a share price of SEK 50.75, a volatility of 37.5%, a dividend yield of 0%, an expected option life of three years and an annual risk-free interest rate of -0.38%.
Financial Information

��82����82��
Movements in the number of share options outstanding and their weighted average prices are as follows:
Average exercise price in SEK/share
Options Dec 31, 2017
Options Dec 31, 2016
At opening balance day 58.19 100,000 1,218,000Modified – – –Forfeited – – –Exercised – – -1,218,000Granted – – 100,000At closing balance day 58.19 100,000 100,000
Out of the 100,000 options (2016: 100,000) 0 options (2016: 0) were exercisable.
Share options outstanding at the end of the year have the following expiry dates and exercise prices:
Exercise price, SEK
Options Dec 31, 2017
Options Dec 31,2016
July 2019 58.19 100,000 100,000At the end of the financial year 100,000 100,000
Share-based incentive program (LTIP 2016)At the 2016 Annual General Meeting held on May 17, 2016, it was resolved to implement a share-based long-term incentive program for management and key personnel in the Vostok New Ventures group. The program runs from January 1, 2016 through March 31, 2019, and encompasses a maximum of 430,000 shares, corresponding to a dilu-tion of 0.59% of the total number of shares outstanding. Program par-ticipants purchase shares in the company, and for each purchased share is entitled to receive a number of additional shares, so-called perfor-mance shares, free of charge, subject to fulfillment of a performance condition set by the Board of Directors on the basis of the Company’s Net Asset Value. Pursuant to IFRS 2, the costs for the program will be reported over the profit and loss statement during the vesting period (August 31, 2016 through December 31, 2018).
The rights to receive shares automatically convert into ordinary shares (Swedish Depository Receipts) at the end of the program at an exercise price of nil. The participants do not receive any dividends and are not entitled to vote in relation to the rights to receive shares during the vesting period. If a participant ceases to be employed by the group within this period, the rights will be forfeited, except in limited circumstances that are approved by the board on a case-by-case basis.
The fair value of the rights at grant date was estimated by taking the market price of the company’s shares on that date which was SEK 64.25 (USD 7.52) per share without adjustment for any dividends that will not be received by the participants on their rights during the vesting period.
Total expenses, excluding social taxes, arising from share-based payment transactions recognised during the period as part of employ-ee benefit expense were MUSD 0.68 (2016: 0.23).
Share-based incentive program (LTIP 2017)At the 2017 Annual General Meeting held on May 16, 2017, it was resolved to implement a share-based long-term incentive program for management and key personnel in the Vostok New Ventures group. The program runs from January 1, 2017 through March 31, 2020, and encompasses a maximum of 450,000 shares, corresponding to a dilu-tion of 0.53% of the total number of shares outstanding. Program par-ticipants purchase shares in the company, and for each purchased share is entitled to receive a number of additional shares, so-called perfor-mance shares, free of charge, subject to fulfilment of a performance condition set by the Board of Directors on the basis of the Company’s NAV. Pursuant to IFRS 2, the costs for the program will be reported over the profit and loss statement during the vesting period (May 16, 2017 through December 31, 2019).
The rights to receive shares automatically convert into ordinary shares (Swedish Depository Receipts) at the end of the program at an exercise price of nil. The participants do not receive any dividends and are not entitled to vote in relation to the rights to receive shares during the vesting period. If a participant ceases to be employed by the group within this period, the rights will be forfeited, except in limited circumstances that are approved by the board on a case-by-case basis.
The fair value of the rights at grant date was estimated by taking the market price of the company’s shares on that date which was SEK 72.50 (USD 8.25) per share without adjustment for any dividends that will not be received by the participants on their rights during the vesting period.
Total expenses, excluding social taxes, arising from share-based payment transactions recognised during the period as part of employ-ee benefit expense were MUSD 0.45 (2016: –).
Note 24 Related-party transactionsThe Group has identified the following related parties: Key Management and Board of Directors, including members of the Board and Management, and members of the Board of subsidiaries.
During the period, the Group has recognized the following related party transactions:
Operating expenses Current liabilities2017 2016 2017 2016
Key management and Board of Directors1 -2,950 -3,084 – –
1. Compensation paid or payable includes salary to the management and remuneration to the Board members.
Total variable compensation (excluding social taxes) paid to the man-agement in 2017 amounted to USD 0.67 mln (including USD 0.5 mln paid to the Managing Director).
The Managing Director purchased Vostok New Ventures Ltd senior secured bond 2016/2019 during the second quarter of 2016 for USD 0.60 mln (SEK 5 mln) and he owned USD 0.60 mln (SEK 5 mln) per August 17, 2017, after which it was fully redeemed.
The costs for new long term incentive programs (LTIP 2016 and LTIP 2017) for the management amounted to USD 1.13 mln, excluding social taxes. See details of the LTIP 2016 and LTIP 2017 in Note 23.
SubsidiariesThe parent company, Vostok New Ventures Ltd, has related-party transactions with its subsidiaries: the Cypriot subsidiary Vostok New Ventures (Cyprus) Limited; and a Swedish subsidiary, Vostok New Ventures AB. The parent company’s business is to act in the holding company of the Group and therefore own, manage and finance the holding in its wholly owned Cypriot subsidiary, Vostok New Ventures (Cyprus) Limited. The Swedish subsidiary provides information and support services to the parent company.
Parent CompanyDec 31, 2017 Dec 31, 2016
Loan receivables 206,303 165,236Interest income 11,605 5,880Current liabilities -1,165 -704Operating expenses -3,413 -4,886
Note 25 Events after the reporting periodAfter the end of the period, Vostok New Ventures has invested EUR 4 mln in short-term debt to Marley Spoon, the leading grocery e-com-merce company in Australia; USD 1 mln in el Basharsoft through a con-vertible note; USD 500k in Vezeeta through a convertible note, USD 1 mln in total in two ventures in Myanmar (USD 500k in the leading job vertical and USD 500k in the leading property vertical in the country) and USD 0.25 mln in Propertyfinder.
Also after the reporting period, in January 2018, Vostok New Ventures received USD 10.2 mln in dividends from Avito.
On February 14, 2018, Vostok announced that the Company has received authorization from the Board, valid until December 31, 2018, to repurchase additional SDRs, subject to remaining in compliance with the terms and conditions of the Company’s outstanding bond 2017/2020.
In March 2018, Vostok New Ventures has made two new invest-ments in student housing platform and book appointments market-place in the total amount of USD 10.1 mln.
Note 26 Adoption of annual reportThe annual report has been submitted by the Board of Directors on March 28, 2018, see page 83. The balance sheet and profit and loss accounts are to be adopted by the company’s shareholders at the annu-al general meeting on May 16, 2018.
Financial Information

��83����83��
Declaration
The Board of Directors and the Managing Director declare that the consolidated financial statements have been prepared in accordance with IFRS as adopted by the EU and give a true and fair view of the Group’s financial position and results of operations. The financial state-ments of the Parent Company have been prepared in accordance with IFRS and give a true and fair view of the Parent Company’s financial position and results of operations.
The Administration Report and the other parts of the Annual Report of the Group and the Parent Company
provide a fair review of the development of the Group’s and the Parent Company’s operations, financial position and results of operations and describe material risks and uncertainties facing the Parent Company and the com-panies included in the Group.
The Statutory Corporate Governance and the other parts of the Annual Report of the Group provides a fair review of the development of the Group’s operations, financial position and results of operations and describes material risks and uncertainties facing the companies included in the Group.
Hamilton, Bermuda, March 28, 2018
Lars O GrönstedtChairman
Josh BlachmanBoard member
Victoria GraceBoard member
Ylva LindquistBoard member
Keith RichmanBoard member
Per BriliothManaging Director and Board member
Financial Information

��84����84��
Independent Auditor’s ReportTo the annual general meeting of Vostok New Ventures Ltd.
Our opinion We have audited the consolidated financial statements and the parent company financial statements of Vostok New Ventures Ltd. for the year 2017. The consolidated financial statements and the parent company financial statements are included on pages 57–83 in this document.
In our opinion, Vostok New Ventures Ltd. consolidat-ed financial statements and parent company financial statements present fairly, in all material respects, the consolidated financial position of the Group and the par-ent company financial position as at December 31, 2017, and of its consolidated financial performance and par-ent company financial performance and its consolidated cash flows and parent company cash flows for the year then ended in accordance with International Financial Reporting Standards as adopted by the EU.
Basis for opinion We conducted our audit in accordance with Internation-al Standards on Auditing (ISAs). Our responsibilities under those standards are further described in the Audi-tor’s Responsibilities for the Audit of the Consolidated Financial Statements section of our report.
We are independent of the Company and the Group in accordance with the International Ethics Standards Board for Accountants’ Code of Ethics for Professional Accountants (IESBA Code) together with the ethical requirements that are relevant to our audit of the finan-cial statements in Sweden, and we have fulfilled our other ethical responsibilities in accordance with these requirements and the IESBA Code.
We believe that the audit evidence we have obtained is sufficient and appropriate to provide a basis for our opinion.
Our audit approachAudit scopeVostok New Ventures Ltd. is an investment company where the main part of the assets comprise investments in non-quoted private equity companies. The parent company is incorporated in Bermuda with subsidiaries incorporated in Cyprus and Sweden. Audit procedures related to the group and parent financial statements are
solely performed by the group audit team in Sweden. Specialists within the PwC-network are involved where appropriate.
We designed our audit by determining materiality and assessing the risks of material misstatement in the consolidated financial statements and the parent com-pany financial statements. In particular, we considered where management made subjective judgements; for example, in respect of significant accounting estimates that involved making assumptions and considering future events that are inherently uncertain. As in all of our audits, we also addressed the risk of management override of internal controls, including among other matters consideration of whether there was evidence of bias that represented a risk of material misstatement due to fraud.
We tailored the scope of our audit in order to perform sufficient work to enable us to provide an opinion on the consolidated financial statements and parent company financial statements as a whole, taking into account the structure of the Group, the accounting processes and controls, and the industry in which the group operates.
MaterialityThe scope of our audit was influenced by our application of materiality. An audit is designed to obtain reasonable assurance whether the financial statements are free from material misstatement. Misstatements may arise due to fraud or error. They are considered material if individu-ally or in aggregate, they could reasonably be expected to influence the economic decisions of users taken on the basis of the consolidated financial statements or the par-ent company financial statements.
Based on our professional judgement, we determined certain quantitative thresholds for materiality, including the overall group materiality for the consolidated finan-cial statements as a whole. These, together with qualita-tive considerations, helped us to determine the scope of our audit and the nature, timing and extent of our audit procedures and to evaluate the effect of misstatements, both individually and in aggregate on the financial state-mets as a whole.
Report on the audit of the consolidated financial statements and parent company financial statements
Financial Information

��85����85��
Key audit matters Key audit matters are those matters that, in our profes-sional judgment, were of most significance in our audit of the consolidated financial statements and the parent company financial statements of the current period.
These matters were addressed in the context of our audit of the consolidated financial statements as a whole, and in forming our opinion thereon, and we do not provide a separate opinion on these matters.
Other information Management is responsible for the other information. The other information comprises the pages 01–37 and 46–56, which we obtained prior to the date of this audi-tor’s report.
Our opinion on the consolidated financial statements and the parent company financial statements does not cover the other information and we do not and will not express any form of assurance conclusion thereon.
In connection with our audit of the consolidated financial statements and the parent company finan-cial statements, our responsibility is to read the other information identified above and, in doing so, consider whether the other information is materially inconsis-tent with the consolidated financial statements or the parent company financial statements or our knowledge obtained in the audit, or otherwise appears to be mate-rially misstated.
If, based on the work we have performed on the other information that we obtained prior to the date of this auditor’s report, we conclude that there is a material mis-statement of this other information, we are required to report that fact. We have nothing to report in this regard.
Responsibilities of management and those charged with governance for the consolidated financial state-ments and the parent company financial statementsManagement is responsible for the preparation and fair presentation of the consolidated financial statements and the parent company financial statements in accor-dance with International Financial Reporting Standards (IFRS), and for such internal control as management determines is necessary to enable the preparation of consolidated financial statements and parent company financial statements that are free from material mis-statement, whether due to fraud or error.
In preparing the consolidated financial statements and parent company financial statements, management is responsible for assessing the Group’s ability to contin-ue as a going concern, disclosing, as applicable, matters related to going concern and using the going concern basis of accounting unless management either intends to liquidate the Group or to cease operations, or has no realistic alternative but to do so.
Those charged with governance are responsible for overseeing the Group’s financial reporting process.
Key audit matterValuation of private equity investmentsThe valuation of private equity investments at fair value is significant for the Group’s financial statements as a major part of the Group’s Net Asset Value comprises non-quoted investments in private equity companies. At December 31, 2017, these investments had a carrying value of USD 891 mil-lion, representing 93% of total assets.
The fair value of non-quoted investments is determined by recent transactions made at prevailing market condi-tions or different valuation models depending on the char-acteristics of the company as well as the nature and risks of the investment. The choice of valuation technique for each non-quoted investment is based on management’s judge-ment at the closing date.
For transaction based valuations, each transaction has to be evaluated by management to determine if the transaction reflects the fair value on the closing date.
Investments valued by valuation models require signifi-cant input of non-observable data and management assump-tions. Due to the complexity in the valuations there is a risk of material misstatement for these investments.
The selected valuation methods and significant assump-tions used for each investment are presented in note 4 to the financial statements. The development of the Net Asset Value is also the basis for management compensation from the long-term share based incentive program described in note 23.
How our audit addressed the Key audit matter
Our audit procedures included assessing management’s valuation process for non-quoted investments and manage-ment’s selection of valuation method for each investment. Valuation specialists has been involved in the audit of the major investments.
Valuations based on recent transactions were evaluated by obtaining and analyzing supporting documents to assess if the transaction may be used as reasonable assessment of fair value by the closing date, including assessment of trans-action parties, size of the transactions and other relevant transaction terms.
We have also evaluated management’s assessment of events after the transaction date, including both company specific events and macro-economic events, to conclude if these are reflected in the valuations.
Valuations based on models have been evaluated by con-firming input data from external sources as well as evaluat-ing management’s assumptions in the valuation models and performing sensitivity analyzes of these.
Our audit also includes recalculations of the valuations and reconciliation of the final valuation to the financial statements, as well as auditing the overall presentation of the valuations in the notes to the financial statements.
Financial Information

��86����86��
Auditor’s responsibilities for the audit of the con-solidated financial statements and parent company financial statementsOur objectives are to obtain reasonable assurance about whether the consolidated financial statements and par-ent company financial statements as a whole are free from material misstatement, whether due to fraud or error, and to issue an auditor’s report that includes our opinion. Reasonable assurance is a high level of assur-ance, but is not a guarantee that an audit conducted in accordance with ISAs will always detect a material mis-statement when it exists. Misstatements can arise from fraud or error and are considered material if, individually or in the aggregate, they could reasonably be expected to influence the economic decisions of users taken on the basis of these consolidated financial statements and par-ent company financial statements.
As part of an audit in accordance with ISAs, we exercise professional judgment and maintain professional scepti-cism throughout the audit. We also:• Identify and assess the risks of material misstatement
of the consolidated financial statements and parent company financial statements, whether due to fraud or error, design and perform audit procedures responsive to those risks, and obtain audit evidence that is suffi-cient and appropriate to provide a basis for our opin-ion. The risk of not detecting a material misstatement resulting from fraud is higher than for one resulting from error, as fraud may involve collusion, forgery, intentional omissions, misrepresentations, or the override of internal control.
• Obtain an understanding of internal control relevant to the audit in order to design audit procedures that are appropriate in the circumstances, but not for the purpose of expressing an opinion on the effectiveness of the Group’s internal control.
• Evaluate the appropriateness of accounting policies used and the reasonableness of accounting estimates and related disclosures made by management.
• Conclude on the appropriateness of management’s use of the going concern basis of accounting and, based on the audit evidence obtained, whether a material uncer-tainty exists related to events or conditions that may cast significant doubt on the Group’s ability to continue as a going concern. If we conclude that a material uncer-
tainty exists, we are required to draw attention in our auditor’s report to the related disclosures in the consol-idated financial statements or parent company financial statements or, if such disclosures are inadequate, to modify our opinion. Our conclusions are based on the audit evidence obtained up to the date of our auditor’s report. However, future events or conditions may cause the Group to cease to continue as a going concern.
• Evaluate the overall presentation, structure and con-tent of the consolidated financial statements and parent company financial statements, including the disclosures, and whether the consolidated financial statements represent the underlying transactions and events in a manner that achieves fair presentation.
• Obtain sufficient appropriate audit evidence regarding the financial information of the entities or business activities within the Group to express an opinion on the consolidated financial statements. We are respon-sible for the direction, supervision and performance of the group audit. We remain solely responsible for our audit opinion.
We communicate with those charged with governance regarding, among other matters, the planned scope and timing of the audit and significant audit findings, includ-ing any significant deficiencies in internal control that we identify during our audit.
We also provide those charged with governance with a statement that we have complied with relevant ethical requirements regarding independence, and to communi-cate with them all relationships and other matters that may reasonably be thought to bear on our independence, and where applicable, related safeguards.
From the matters communicated with those charged with governance, we determine those matters that were of most significance in the audit of the consolidated financial statements and the parent company financial statements of the current period and are therefore the key audit matters. We describe these matters in our auditor’s report unless law or regulation precludes pub-lic disclosure about the matter or when, in extremely rare circumstances, we determine that a matter should not be communicated in our report because the adverse consequences of doing so would reasonably be expect-ed to outweigh the public interest benefits of such communication.
Stockholm, March 28, 2018
PricewaterhouseCoopers AB
Ulrika Ramsvik Bo Hjalmarsson Authorized public accountant Authorized public accountant Auditor in charge
Financial Information


Registered officeVostok New Ventures LtdClarendon House2 Church StreetHamilton HM 11Bermuda
Vostok New Ventures ABHovslagargatan 5SE-111 48 StockholmSwedenPhone +46 8 545 015 50Fax +46 8 545 015 54