appendix 6: economic development - city of …€¦ · appendix 6: economic development a-6.1...
TRANSCRIPT

City of Woodinville Comprehensive Plan Economic Development Appendix
APPENDIX 6: ECONOMIC DEVELOPMENT
A-6.1 Existing Conditions
A-6.1.1 Overview
The City of Woodinville is located in the northeastern portion of King County at the northern end of an intensely urbanized area locally referred to as the Eastside. The Eastside area has experienced rapid population and economic growth, especially during the past quarter of a century. It is a major economic and residential region within King County. The Eastside area includes the cities of Bellevue, Kirkland, Redmond, Issaquah, Bothell, Woodinville and several smaller cities and towns, including newly incorporated cities of Kenmore, Sammamish and Newcastle. The Eastside area accounts for roughly one-third of the county’s population and one fourth of its economic activity.
Woodinville has experienced the pressure for urbanization as a part of this trend of continued growth, though the suburbanization process occurred somewhat later than the rest of the Eastside. One Woodinville characteristic is a co-existence of remnants of an agricultural and resource based past with definite indicators of an urban future.
The historical industries that remain include industries and firms that produce agricultural products as well as heavy industrial manufacturing firms that have been operating in the area for several decades. More recent development occurred during the mid-1980s and early-1990s, when the prospect of cheap land near freeways and high quality residential areas attracted significant new development (light industrial in 1980s and retail in 1990s) to Woodinville.
The incorporated cities of Redmond, Kirkland, Bothell, and non-urban areas of Snohomish County surround the City of Woodinville. The State mandated and King County determined urban growth area boundary lies immediately east of the City, a small neighborhood called “Grace” to the north, and a small section (less than 20 acres) to the south of NE 171st Street. Unless the urban growth area is altered, future growth of the City will be limited to the current boundaries and a few small areas adjacent to the incorporated city limits. Economic growth for the city will depend on the limited vacant lands within the City and redevelopment of land that is currently being occupied by commercial and industrial activities. This situation increases the importance of efficient utilization of the City’s location, assets, utility and road infrastructure, and tax base. The City of Woodinville provides a combination of commercial space that affects both historic and current economic patterns. As growth pressure increases, these older land uses will be encouraged to redevelop to uses more typical of suburban areas consistent with freeway access and population growth. These newer uses include modern shopping centers and commercial real estate that primarily serve local residents. The area also attracts shoppers from the Puget Sound Region to specialty retailers such as the nurseries and wineries.
At the same time new businesses were attracted to the area, the relatively undeveloped rural areas around and within Woodinville attracted a wide range of residential development. Recent development has resulted in housing types ranging from diverse multifamily housing that responded to rapid growth in this region, to large-lot housing, which is driven by higher income households that represent a lifestyle that is part suburban and part rural.
In the following sections, the demographic and economic dimensions of the Woodinville community are described. The development pattern in the City of Woodinville is consistent with other Eastside cities, but there are also significant differences.
A-6.1.2 Community Population Growth A summary of the demographic characteristics of Woodinville can be found in Section 1.4. The detailed demographic information below serves as an introduction to the assumptions used in the economic development analysis.
December 2002 Appendix 6, page 1

City of Woodinville Comprehensive Plan Economic Development Appendix
Population
Table A6-1 compares the recent population growth of the State of Washington, King County, the Eastside, other communities and the City of Woodinville. The population estimate for 2000 is 9194 persons. The US Census of 2000 estimated that the City has grown slightly over seven percent (7.1%) in the last decade (from 8587 to 9194 persons). The population in the area surrounding Woodinville (a forecast analysis zone of several census tracts that includes the city) is estimated by the Puget Sound Regional Council as having increased by 16.7% from1990 to 2000.
Table A6-1 1990-2000 Population Growth Woodinville, Eastside, County and State
Area 1990 Population 2000 Population Percentage Increase
Washington State 4,866,663 5,894,121 21.1
King County 1,507,305 1,737,034 15.2
Snohomish County 465,628 606,024 30.2
Eastside Cities* 288,582 366,891 27.1
Bellevue 86,812 109,569 26.1
Bothell 12,345 30,150 144.2
Duvall 2,770 4,616 66.6
Issaquah 7,786 11,212 44.0
Kirkland 40,059 45,054 11.3
Redmond 35,800 45,256 26.4
Sammamish --- 34,104 10.7
Woodinville ---(8,587) est. 9,194 7.1
Beaux Arts 303 307 1.3
Carnation 1,243 1,893 53.4
Clyde Hill 2,957 2,890 -2.3
Hunt’s Point 514 443 -15.8
Medina 2,981 3,011 1.0
Mercer Island 20,816 22,036 5.9
Newcastle --- 7,737 -3.9
Snoqualmie 1,546 1,631 5.5
Yarrow Point 957 1,008 5.3
Source: U.S. Census; Washington State, Office of Financial Management: “Population Trends, 2000” Notes: * includes the cities in this table and using their incorporation population.
The City of Woodinville is among a number of new cities that was incorporated in King County during the 1990’s. Other newly incorporated cities on the Eastside include Kenmore with a population in 2000 of 18,679, Sammamish at 43,104, and Newcastle with 7,737 persons.
December 2002 Appendix 6, page 2

City of Woodinville Comprehensive Plan Economic Development Appendix
There is some concern that the 2000 census undercounted the estimate of the City’s 2000 population. The City’s first comprehensive plan population estimates were made from census block data available at the time of incorporation. Census block data is the smallest area for which population estimates are available. The 1990 population was estimated at 8,587 persons. At the time of incorporation, the Office of Financial Management of the State of Washington certified the City’s population at 8,882 persons. The US Census estimated that the year 2000 population was 9,194 persons living in Woodinville. However, the State’s estimate of the City’s population in 2000 was 10,280 persons. The City is exploring a resolution of this issue.
A-6.1.3 Demographic Characteristics
Table A6-2 summarizes data on the composition of the City’s population based on census data and a comparison to the demographic patterns of the County. At the time this update was completed, not all census data was available. Comparisons are difficult because of the ambiguity about 1990 boundaries and the lack of exact comparability between census data for 1990 and 2000. Some comparisons can be made, as can comparisons to King County and other Eastside cities with this limited data. Compared to the County as a whole, the City of Woodinville tends:
1. To have proportionally fewer small children (under the age of five years) than the County as a whole,
2. To have fewer persons over the age of 65 years than the County,
3. To have the same median age (of 37.5 years) as the County as a whole. This pattern may be explained by proportionally larger amounts of persons in the school years and middle age years in the City,
4. To have a less diverse population based on race or ethnicity, though its diversity has increased since the last census,
5. To remain the same between 1990 and 2000 in household size, i.e., persons per household,
6. To have larger households in Woodinville than King County in general for both households and families, i.e., related individuals living together,
7. To have proportionally more households with children and married couple households in Woodinville than the County,
8. To have more owner occupied housing units than in the County, and
9. To have fewer vacant and fewer housing units that were seasonally occupied.
December 2002 Appendix 6, page 3

City of Woodinville Comprehensive Plan Economic Development Appendix
Table A6-2 1990 and 2000 Summary of Population and Housing Census
1990 Woodinville Census Designated Place
2000 Woodinville
2000 Woodinville Percent
2000 King County
Population 8,587 9,194 1,737,034
Median Age 32.4years 35.7 years 35.7 years
Ave. Household Size 2.61 2.61 persons 2.39 persons
Ave. Family Size -- 3.15 persons 3.03 persons
Total Reporting Race 8,892 1,666,535
-Population under 5yrs 6.9% 326 3.5 6.1%
-Population 18 and over 68.5% 6,747 73.4 77.5
-Population 65 and over 5.7% 796 8.7 10.5%
White 93% 7,724 86.9 78.0%
Black/African Amer. .7% 84 .9 5.6
Native American 1.4 47 .5 1.0
Asian 4.3%* 674 7.6 11.3
Hawaiian/Pac. Islander 4.3%* 23 .3 .5
Other .9 340 3.8 2.7
Reporting Two Races 302 3.3 4.2
Hispanic/Latino 658 7.4 5.7
Households 3,512
Households with kids <18 -- 1,295 36.9 28.4%
Married Couple family -- 2,021 57.5 46.4%
Housing Units 3,592 742,237
-Occupied 3,512 97.8 95.8%
-Vacant 80 2.2 4.2%
-Seasonal 11 .3 .7%
Owner Occupied 2558 72.8 59.8%
Renter Occupied 954 27.2 40.2%
Source: 1990 and 2000 U.S. Censuses of Population and Housing
Using estimates from the State of Washington’s Office of Financial Management Table A6-3 below outlines trends that indicate greater multi-family units within the City of Woodinville than is typical within King County.
December 2002 Appendix 6, page 4

City of Woodinville Comprehensive Plan Economic Development Appendix
Table A6-3 Comparison of Housing Units: Year 2000
City of Woodinville
King County
Single Family Units 54.3% 58.7%
Multi-family Units 42.4%* 37.4%
Mobile Homes, Trailers 3.3% 3.9%
Total Units 3,888 100.0%
Note: Woodinville, see Table A 4-3; King County Census of Housing 2000; * includes townhouses
Table A6-4 compares the City of Woodinville demographics to other Eastside cities, nearby cities in the same part of Snohomish County, and the City of Seattle. On the whole, with some notable exceptions, the Eastside and Snohomish County cities are fairly homogeneous, but there are interesting differences. The City of Seattle also has some notable differences. Comparisons to other cities include the following:
a. Woodinville is comparable in size of population to Issaquah (11.212), Lake Forest Park (13,142), Mill Creek (11,525), Monroe (13,795) and Snohomish (8,494).
b. In land area, Woodinville (6.1 square miles) is comparable to Kenmore (6.1 square miles) and Monroe (5.332 square miles).
c. Issaquah (1.9 pop/acre) and Sammamish (2.5 pop/acre) have a similar population density to Woodinville (2.4 pop/acre) with Seattle (10.5 pop/acre) being the most densely populated along with Kirkland (6.8 pop/acre) and Lake Forest Park (6.0 pop/acre).
d. The age profile for Woodinville in 2000 is similar to most Eastside cities, whereas the more outlying cities of Sammamish (8.4 percent of population under the age of five) and Monroe (9.7 percent of population under the age of five) tend to have more children (less than five years).
e. Woodinville (20.1 percent of population between the ages of five and 18), Bothell (19.2 percent of population between the ages of five and 18), Kenmore (18.8 percent of population between the ages of five and 18), Lake Forest Park (17.7 percent of population between the ages of five and 18), Sammamish (25 percent of population between the ages of five and 18), Mill Creek (18.4 percent of population between the ages of five and 18), and Monroe (17.7 percent of population between the ages of five and 18)tend to be the communities with proportionally more school-aged children.
f. The cities of Seattle (12 percent of population at the age of 65 and up) and Lake Forest Park (13 percent of population at the age of 65 and up) tend to have higher proportions of persons in retirement ages.
g. On the whole, based on median age for the community, Lake Forest Park (42.1), Kirkland (36.1), Mill Creek (38.6) and Kenmore (37.5) tend to be older than the median age of 35.7 for Woodinville.
December 2002 Appendix 6, page 5

City of Woodinville Comprehensive Plan Economic Development Appendix
h. Racial census data indicates that the older economically active cities of Redmond (29.7 percent non-white) and Seattle (29.9 percent non-white) have more diverse populations. This report indicates that most of the cities on the Eastside, including Woodinville (15.1 percent non-white), are less diverse reporting 12-16% non-white race. Among the cities compared, Woodinville has the highest percentage (7.2%) reporting an Hispanic heritage.
i. Woodinville contains one of the higher proportions of households with children (under 18) present (38.7%), which range from a low of 19.6% in Seattle to a high of 54.5% in Sammamish.
j. The percentage of married couples with children in Woodinville is 30.9% among a range of 13.0% in Seattle to 49.2% in Sammamish.
k. The highest number of persons per occupied dwelling units is 3.06 in Sammamish to a low of 2.08 persons per household in Seattle with Woodinville at 2.61, which is the same level as reported in the data from the 1990 census.
l. Home ownership is a predominant pattern in Sammamish (90.1%), Lake Forest Park (79.8%), Woodinville (72.8%), and Kenmore (72.0%) with lows in Seattle (48.4%), Snohomish (54.4%), and Redmond (55.1%).
m. The census data on composition of the housing stock is not yet available, but based on the state estimates, several cities stand out with low percentages of multi-family units as a portion of the housing stock. Estimates show that Sammamish (6.7%), Lake Forest Park (16.5%), Kenmore (21.7%), and Monroe (22.9%), with Woodinville at 44.7% which is a moderately high percentage.
In summary, the pattern that emerges from the census data is that Woodinville is quite like many of its neighbors and communities that share its location at the edge of the urbanized area of King County. It tends to be diverse in its demographic make-up with few extreme characteristics when compared with these cities.
Table A6-4 Demographic Comparison for Eastside Cities
Woodinville Bothell Issaquah Kenmore Kirkland Lake Forest Park
Red -mond
Sammamish Seattle Mill Creek
Monroe
Population & Size
2000 Pop 9,194 30,150 11,212 18,678 45,054 13,142 45,256 43,104 563,374 11,525 13,795
Square Miles 6.117 12.252 9.317 6.100 10.596 3.678 16.644 21.181 83.782 3.594 5.332
Pop/acre 2.4 3.9 1.9 4.8 6.8 6.0 4.3 2.5 10.5 5.0 4.0
Age
Median Age 35.7 35.6 37.0 37.5 36.1 42.1 34.0 35.3 35.4 38.6 31.2
% Pop<5 yrs 6.5 6.0 6.1 5.7 5.5 4.7 6.4 8.4 4.7 5.9 9.7
% Pop 5-18 yrs
20.1 19.2 18.7 18.8 13.0 17.7 15.1 25.0 10.9 18.4 17.7
% Pop 18-64 yrs
64.7 65.3 67.2 65.2 71.3 64.6 69.2 62.6 72.4 64.0 64.6
December 2002 Appendix 6, page 6

City of Woodinville Comprehensive Plan Economic Development Appendix
% Pop 65 yrs & up
8.7 9.5 10.0 10.3 10.2 13.0 9.3 4.0 12.0 11.7 8.0
Race
% Non-white 15.1 12.7 11.9 13.3 15.7 14.7 29.7 12.2 29.9 18.5 13.9
% Reporting more than one
3.3 3.0 2.9 3.0 2.9 3.6 3.1 2.5 4.5 2.6 2.7
Hispanic 7.2 1.1 5.0 3.5 4.1 2.2 5.6 2.5 5.3 3.3 3.4
Households
With kids<18 38.7 35.6 30.6 35.2 24.6 33.7 29.8 54.5 19.6 33.7 48.0
Married Couple family
30.9 27.0 21.8 27.1 17.3 27.8 22.8 49.2 13.0 27.9 36.0
Household Size
2.61 2.51 2.27 2.54 2.13 2.55 2.33 3.06 2.08 2.48 2.83
Occupied Housing Units
3,512 11,923 4,840 7,307 20,736 5,029 19,102 11,131 258,499 4,631 4,173
% Owner occupied
72.8 60.2 58.5 72.0 57.0 79.8 55.1 90.1 48.4 67.0 61.7
% Multi-family
44.7 31.5 47.1 21.7 48.9 16.5 50.7 6.7 50.3 37.8 27.9
Sources: U.S. Census of Population and Housing; State of Washington, Office of Financial Management, “Population Trends: 2000; * Land area and percent of dwelling units multi-family from OFM estimates
Economic Well-Being
One method to measure the economic well-being of a community is to consider the median income of its households. The median household income is the midpoint level of income, which has half of the household incomes above and half of the household incomes below.
According to the 2000 Census, the median household income for Woodinville households is $68,114. The estimated median household income for other cities near Woodinville on the Eastside of King County include: Bellevue at $62,338, Bothell at $59,264, Issaquah at $57,892, Kenmore at $66,900, Kirkland at $60,332, Lake Forest Park at $69,900, Redmond at $66,735, and Sammamish at $93,000. For the entire county, the median household income is $52,679. The median household income for Snohomish County is $54,002 and $45,296 for Washington State. The median household income estimated for the City of Woodinville is 59% higher than that of King County and five percent higher than the average of the Eastside cities listed above. More detailed and current data on local incomes and economic well-being for the City and other areas will be published in the spring or summer of 2003 when more census population and housing information is made available. This more current data may reflect the population and economic gains of the more recent years for Eastside residents.
Another method utilized to measure economic well-being is the distribution of income among households in a community. In 1996, compared with King County, Woodinville had relatively fewer households earning less than $40,000 per year and a greater number of households in every category earning more than $40,000 per year.
A third measure of economic well-being is per capita income or income per resident. Woodinville per capita income in 1990 was $19,190. Per capita income in King County was
December 2002 Appendix 6, page 7

City of Woodinville Comprehensive Plan Economic Development Appendix
approximately $23,671 and was about $18,648 for Snohomish County. The State of Washington’s per capita income in 1990 was $18,738. In 2000, the per capita income for King County was $31,561 and was $24,046 for Snohomish County. The State of Washington’s per capita income per the 2000 Census was $23,879. The City of Woodinville’s per capita income in 2000 was $31,458.
In the Woodinville Planning Area, 3 % of households in 1990 were considered to be below the poverty level, compared with 8 % of households in King County. For a family of four, in 1990, an income below $12,764 per year is considered to be “below the poverty level”. The poverty level defined in Census data is based on U.S. Government definitions. Poverty thresholds are typically applied on a national basis by the Census Bureau and are not adjusted for regional, state, or local variations in the cost of living. Educational Attainment
Educational attainment is also closely related to income levels of households. In the City of Woodinville, 29.5 percent of residents over age 25 have completed a Bachelors degree and 13.2 percent a graduate degree. This is similar to other Eastside cities and slightly higher than King County (see Table A6-5).
Table A6-5 2000 Educational Attainment
Percent of population over Age 18 who have completed:
Jurisdiction
Associates degree
Bachelors degree
Graduate Professional degree
City of Woodinville 7.3% 29.5% 13.2%
Bothell 8.9% 29.3% 9.3%
Redmond 7.7% 35.9% 17.0%
Kirkland 7.3% 33.0% 14.4%
Issaquah 7.8% 34.0% 14.3%
Bellevue 6.9% 34.7% 19.4%
Mill Creek 9.6% 31.0% 16.7%
King County 7.5% 26.6% 13.3% Source: 2000 US Census
A-6.1.4 Economic Base
The local employment base defines the existing economic character of Woodinville. There are several ways to measure and describe the local economic base. The most common is to report the amount and composition of employment in local firms and agencies. Other measures are the amount of retail sales and value of the stock of real estate (i.e., value of real estate investment as measured by assessed value). More comprehensive economic measures are rarely available for small areas. The composition of the current stock of available zoned land and the amount and type of commercial and industrial buildings are indicators of the capacity to sustain economic activity now and in the future. The main economic development tool that a local community has is controlling the amount and kind of real estate that can be used to contain economic activity. The community controls this economic capacity by zoning adequate supplies of appropriately located and serviced land through appropriate building and site development regulations, and with reasonable processes for real estate investment. The existing stock of building space gives an indication of the
December 2002 Appendix 6, page 8

City of Woodinville Comprehensive Plan Economic Development Appendix
current and future types of businesses that the community can attract, those that will continue to grow there, and businesses that may find this place acceptable to start a business.
The following sections describe current economic and real estate activity as a basis to assess the potential to guide the economic development strategy and implementation actions of the city.
Economic Location within the Region
Examining the geographic pattern of regional growth trends indicates that Woodinville is strategically located to take advantage of these trends. The Central Puget Sound region continues to grow at a rate of 1.7% in comparison to the national rate of 1% annually. A significant path and portion of growth has and may continue to move in a northeasterly direction in King County and into Snohomish County. Regional population growth tends to follow transportation corridors (including the SR-522/SR-9 corridors) and be accommodated by vacant land that is not restricted by natural or political boundaries. The Sammamish River Valley, regionally significant environmentally sensitive areas in that valley, and the mandated urban growth boundaries of both Snohomish and King County will tend to encourage growth in a northeasterly direction from the main regional economic engines in more urban areas in King County/Seattle/Bellevue.
The City of Woodinville and surrounding areas are an attractive location for future residential population growth. The generally high quality of many Woodinville and surrounding residential areas will attract business decision-makers who will want their office or business near their home. The factors that improve the prospects for more residential and economic growth in and around Woodinville include:
a. The Growth Management Act encourages increases in density for both employment and residential development,
b. Increasing regional traffic congestion encourages commute alternatives (for example tele-work and shorter commute trips),
c. Existing transportation corridor capacity,
d. The desire to live close to work and significant employment growth in areas near Woodinville (Redmond, Bothell, Kirkland, Bellevue),
e. The “High Technology Corridor”, and
f. Businesses will want to locate near areas of economic and residential growth.
Unincorporated King County growth will generate economic strength for retail, services, and other businesses that are supported by population growth.
Woodinville’s residential and commercial-industrial areas can accommodate this policy-induced trend toward increased density.
Income
According to the 2000 Census, the median household income for Woodinville households is $68,114. The median household incomes for other cities near Woodinville on the Eastside include; Bellevue at $62,338, Bothell at $59,264, Issaquah at $57,892, Kirkland at $60,332, and Redmond at $66,735. For the entire county the median household income is $52,679. The median household income for the City of Woodinville is 29% higher than that of King County and one percent higher than the average of the Eastside cities listed above.
Employment Activity
The data available indicates that the City of Woodinville is a diverse economic community.
December 2002 Appendix 6, page 9

City of Woodinville Comprehensive Plan Economic Development Appendix
The City has attracted a variety of industries not often found in newly incorporated areas, especially smaller areas of a large region. Typically, residentially oriented suburbs within large regions specialize in businesses that serve the local population base. Many of the businesses that have located in the City of Woodinville either existed here before its recent population growth or have located here independent of its experience with population growth. The availability of several different types of commercial and industrial land is attractive to businesses serving a larger geographical area.
Tables A6-6 and A6-7 summarize currently available data on the employment base for the City of Woodinville. Local employment data is available from state employment agency sources for areas smaller than county areas. The tables compare the employment patterns of the City to those of the Eastside and King County. The amount of employment in the City covered by federal/state employment insurance programs, which is the source of this data, is estimated at over 10,323 employees in 1999. This amount of employment does not include self-employed, business proprietors and others in service industries that may not pay employment taxes.
Table A6-6 Woodinville, Eastside, & King County Employment*: 1999
Industry City of Woodinville Employment
Woodinville Percent of
Employment
Eastside** Percent of
Employment
King County*** Percent of
Employment
Construction/Resources 2,339 22.7 6.9 5.7
Finance, Insurance, Real Estate & Services
2,313 22.4 44.1 37.3
Retail 1,810 17.5 18.8 16.6
Manufacturing 2,278 22.1 11.5 13.9
Wholesale, Trans. Comm. & Utilities
1,154 11.1 12.5 13.7
Government/Education 429 4.2 6.3 12.5
Total 10,323 100.0% 100.0% 100.0% Note: King County Annual Growth Report: 2000: Puget Sound Regional Council; *Covered Employment, i.e., those workers covered by unemployment compensation programs, does not include self-employed some managerial and household employees; **Eastside includes: Bellevue, Bothell, Carnation, Clyde Hill, Duvall, Hunts Point, Issaquah, Kenmore, Kirkland, Medina, North Bend, Redmond, Sammamish, Skykomish, Snoqualmie, Woodinville, Yarrow Point; *** includes Seattle
The percentage composition of employment by industry is a way to compare the diversity of the local economic base. There is a near balance among four industry groups:
a. Construction/resource-based, b. Finance, insurance, and real estate services (typically found in office and/or retail
space), c. Retail, and d. Manufacturing industries
These industries account for nearly eighty-five percent of employment within Woodinville. When compared to other employment composition, it is apparent that Woodinville’s businesses
December 2002 Appendix 6, page 10

City of Woodinville Comprehensive Plan Economic Development Appendix
represent a balanced economic base. The Eastside’s employment base has rested on office (finance, insurance, real estate, and services) uses and retail, and less emphasis on industrial and business park industries (manufacturing, wholesale, communications and utilities). This pattern has changed in recent years. Many areas being used for office space initially began as light industrial uses.
This balance of industries (construction/resource-based, finance, insurance, real estate, services, retail, and manufacturing industries) within Woodinville provides both a basis to grow and an advantage against short-term cyclical fluctuations in local economic activity. The importance to the local economy of the resource, construction, and manufacturing industries represents Woodinville’s agricultural past and the local and Eastside real estate building growth. The retail, services, finance, insurance, and real estate industries tend to be associated with local population and business growth. Table A6-7 Woodinville Employment* as Share of Eastside and King County
Industry Woodinville as
Percent of Eastside**
Woodinville as percent of King County***
Eastside as Percent of King County
Construction/Resources 13.2 3.7 27.8
Finance, Insurance, Real Estate & Services
2.0 0.6 27.4
Retail 3.4 0.9 26.4
Manufacturing 8.3 1.6 19.2
Wholesale, Trans. Comm & Utilities
3.6 0.7 21.1
Government/Education 2.6 0.3 10.4
Education
Total 4.0 0.9 23.2
Note: King County Annual Growth Report: 2000: Puget Sound Regional Council; *Covered Employment, i.e., those workers covered by unemployment compensation programs, does not include self-employed some managerial and household employees; **Eastside includes: Bellevue, Bothell, Carnation, Clyde Hill, Duvall, Hunts Point, Issaquah, Kenmore, Kirkland, Medina, North Bend, Redmond, Sammamish, Skykomish, Snoqualmie, Woodinville, Yarrow Point; *** includes Seattle Table A6-8 draws a comparison to how important the employment base of Woodinville is as a component of the Eastside and King County. Woodinville’s population is 3-4% of that of the Eastside and approximately .5% (one-half of one percent) of that of King County. This indicates that Woodinville has comparable levels of finance, insurance, real estate service and retail employment to its population. Government and education are also within comparable ranges for the rest of King County. The diversity that is present and the potential to build on that diversity is a firm basis for a strong tax base to support a community’s needs for its residents and businesses. Woodinville has grown at a proportional rate to King County as follows:
Table A6-8: Employment Growth Woodinville & King County (1995-1999)
Percentage Increase 1995-1999 King County 17.3 City of Woodinville 18.2
Source: King County Annual Growth Report: 2000
December 2002 Appendix 6, page 11

City of Woodinville Comprehensive Plan Economic Development Appendix
Specific information available from state employment records shows that employment within the City grew just slightly less that the county from 1995-1999. The pace of growth during the last decade increased more rapidly than the Eastside, the county and region. The models that the PSRC uses to project future growth indicate a slowing of employment growth in the future. Table A6-9: Employment* Growth and Projections Region, Eastside, King County & Woodinville Area (1995-1999)
Area 1990-2000 2000-2020
Central Puget Sound** 2.12% per year 1.37% per year King County*** 1.46% 1.07% Eastside**** 4.10% 1.07% Woodinville Area***** 4.23% 0.50%
Notes: Source 1999 Working Projections for Population and Employment (2000), Puget Sound Regional Council (PSRC). * Total employment estimates and includes more than “Covered Employment” such as self-employed, managerial, service and household workers; ** King, Kitsap, Pierce, and Snohomish Counties; *** includes Seattle; ****Eastside includes: Bellevue, Bothell, Carnation, Clyde Hill, Duvall, Hunts Point, Issaquah, Kenmore, Kirkland, Medina, North Bend, Redmond, Sammamish, Skykomish, Snoqualmie, Woodinville, Yarrow Point; ***** includes the City of Woodinville plus an area surrounding Woodinville, designated as Forecast Analysis Zone (FAZ) by the PSRC who does not make forecasts for specific jurisdictions.
Future employment growth is projected to slow considerably. There are limitations for using the PSRC projections for Woodinville. The PSRC models are based on relationships between employment and population location with respect to the regional transportation network. The main use of these models is regional planning for transportation. The models do not directly consider real estate market factors including the potential for redevelopment of existing land.
Other Local Economic Indicators
Another way to compare the relative health of Woodinville’s economic condition is to relate the employment estimates to dwelling units. One of the indicators of a community’s degree of urban development is the “jobs/housing” balance ratio. The following “job/housing“ ratio is an indicator of the balance of economic and residential attractiveness of the city.
The “jobs/housing“ ratio for Woodinville compared to many other cities in the region indicates that Woodinville is a balanced, well-rounded community with a mix of housing and employment opportunities. It is and will have the potential to be an important economic location in the future. The “jobs/housing balance” ratio is also an indicator of a city’s ability to attract economic activity and the density of that activity. Higher value of this ratio represents another dimension of economic and residential diversity. Cities with higher ratios typically have an easier time financing services and facilities to the extent that employment is a proxy for tax base. The “jobs/housing” ratio is also used to be an indicator of desirable urban form and likelihood for reduced transportation system trips. This potential is often not realized, because people are not compelled to reside near their work except by residency cost factors.
Table A6-10 Comparison of “Jobs/Housing Ratios”
City “Jobs/Housing” Ratio
1999 Covered
Employment
1999 Dwelling
UnitsRedmond 3.31 64645 19073
Issaquah 2.67 12135 5281
Bellevue 2.43 114972 48351
Woodinville* 2.66 10323 3888
Renton 2.25 52124 23569
December 2002 Appendix 6, page 12

City of Woodinville Comprehensive Plan Economic Development Appendix
Kirkland 1.44 30246 21148
Bothell .87 10,221 11748
Mercer Island .71 6225 8795
Kenmore .66 4472 7072
Sammamish .38 4409 10042
Newcastle .17 608 3591
Tukwila 6.93 52,378 7560
SeaTac 2.87 29791 10478
Auburn 2.03 36272 16453
Seattle 1.83 493915 267493
Kent 1.82 58901 32151
Federal Way .91 29622 32369
Burien .82 11188 13652
Shoreline .62 13386 21268
Covington .58 2469 4240
Everett 2.08 79154 38055
Lynnwood 1.79 24556 13720
Monroe 1.51 6215 4120
Snohomish 1.17 3919 3350
Edmonds .61 10154 16646
Mill Creek .53 2607 4918
Fife 3.93 9720 2473
Puyallup 1.43 18027 12606
Tacoma 1.24 99776 80464
Sumner 1.20 4374 3645
Lakewood .77 20980 27247 Sources: Puget Sound Regional Council: Covered Employment by Jurisdiction: 1999; Office of Financial Management dwelling units. Estimate for Woodinville uses City’s estimate of housing units for 2000, using comparable data sources as for other cities would estimate jobs/housing balance at 2.41.
Table A6-11 illustrates the growth of the components of the tax base used to support public services in Woodinville. The growth in taxable sales in the retail services and other industries and growth of assessed value of properties (land, improvements and buildings) within the City are recorded in the table. Table A6-11 Tax Base Growth: 1993-2000 City of Woodinville
Indicator 1993 2000 Average Annual Rate of growth (per year) %
Taxable Retail Sales
Retail (thousands) $96,049.3 ($162.0/unit)
$217,789.1 ($220.7/unit)
12.4 (4.5)
December 2002 Appendix 6, page 13

City of Woodinville Comprehensive Plan Economic Development Appendix
Services (thousands) $16,584.7 ($25.9/unit)
$63,463.2 ($54.9/unit) 21.1 (11.4)
Total Taxable Sales (000’s) $180,495.3 ($52.4/unit)
$527,839.5 ($89.8/unit) 16.6 (8.05)
Assessed Value (thousands) $774,469.8* $1,411,204.4* 8.95
Seattle Consumer Price Index 142.9 179.2 3.3
City Population 8,880** est. 9,194 (10,280**) 0.5 (2.1**) Sources: Washington State Department of Revenue, Research and Statistics Division; City’s Finance Dept.; U.S. Census; Forecast Council and Office of Financial Management, State of Washington.
Note: * the rates of growth were calculated from 1994-2001; **This calculation uses the state and US Census estimates’.
It is important to compare these measures of economic activity and tax base to the rates of population growth in the City and the increases in the regional price levels. The growth in local economic activity of retail and service sales indicate that, in general, business and the local City budget are increasing at rates faster than the growth of population. On the whole, these components of the City’s tax base increased faster than the number of persons the City has to provide services for and the costs of providing these services. New construction in the City has averaged over $32.3 million per year since its incorporation, ranging from a high of $56.8 million in (1999) to a low of $12.7 million in 1995. The growth in the property tax base, which is a significant portion of the City’s tax base, increased at a rate of 9% per year. This rate of growth is in excess of the combined rates of growth for local population and price levels. Real Estate Inventory
Data presented in Tables A6-11 and A6-12 are indicators of the non-residential real estate niche that the City of Woodinville occupies. The data describes the office and industrial space that is available for rent in the City. The source is the “Office, Industrial and Retail Leasing Guide” that is published each year by the Puget Sound Business Journal used to market this type of space to the businesses that are seeking space to do their economic activities. It is useful as a proxy for what the real estate industry thinks of the location of the City relative to other options that would be available to firms. These firms are those who have selected this region, then made a choice within the region among locations; firms that are expanding in the region; and spaces available for “start-ups” and “spin-off” businesses. The businesses implicitly evaluate the real estate capacity of the sub-area and its relative attraction as a location within the region and sub-region, (i.e., Eastside), to do business.
Table A6-12: High-Tech/Industrial Space Eastside King County Market Area (1,000’s square feet)
Market Segment
SR 520 / Overlake
Bellevue Bothell Woodinville Kirkland / Totem Lake
I-90 Redmond / Willows
Total Percent
Industrial 287.2 581.5 590.9 3,319.7 1,113.1 1,114.9 1,433.3 8,440.1 44.0%
Percent (%) 3.4% 6.9% 7.0% 39.3% 13.1% 13.2% 17.0% 100.0%
High-Tech 810.2 952.4 2,714.1 132.3 1,174.1 879.9 4,064.3 10,726.8
56.0%
Percent (%) 7.6% 8.9% 25.3% 1.2% 10.9% 8.2% 37.9% 100.0%
December 2002 Appendix 6, page 14

City of Woodinville Comprehensive Plan Economic Development Appendix
Total 1,097.4 1,533.9 3,305.0 3,452.0 2,287.2 1,994.8 5,497.6 19,166.9
100.0%
Percent (%) 5.7% 8.0% 17.2% 18.0% 11.9% 10.4% 28.7% 100.0%
Source: “Industrial, Office, Retail Leasing Guide”, Puget Sound Business Journal, 2000; Note: industrial properties larger than 20,000 sq. ft multi-tenant buildings, not owner occupied or special purpose buildings, “high-tech” buildings typically have more than 25% build out.
Woodinville, among the cities and sub-regional real estate markets of the Eastside of King County, specializes in industrial space and industrial parks. The City has nearly forty percent (39.3%) of the sub-areas’ industrial space for rent/lease. The Redmond/Willows Road, Bothell (“High Technology Corridor”) and Kirkland/Totem Lake areas are the leaders for this type of business park space. The Redmond/Willows Road, I-90, and Kirkland/Totem Lake sub-areas are distant followers for attracting this type of space. Woodinville is not as strong nor as attractive for space that is of a higher quality, i.e., “hi-tech” business and industrial park space. The City of Woodinville has attracted only a small portion of this market segment (1.2%). Factors that may influence this are Woodinville’s agricultural past, the city’s recent (relatively) incorporation, and Woodinville’s distance (located at the outskirts of other eastside cities) from the Seattle market.
Regionally the industrial and “hi-tech” market segments are rated highly among U. S. industrial real estate markets. The South end market area in this region, i.e., South Seattle, Green River (Kent, Tukwila, Renton, SeaTac, Auburn) and Tacoma-Fife-Sumner areas of Pierce County have the large majority of this space within the region. Woodinville leads in the industrial type of space on the Eastside. This concentration of industrial space is well located for serving businesses and the residents of both the Eastside and southern Snohomish County. In the future, the growth in the industries that utilize this type of space, manufacturing, wholesale, transportation, communications and utilities are not expected to grow as fast as the office, business park and “hi-tech” industries in the region. However, this type of space in the South end and Seattle sub-markets has been redeveloped into space to accommodate these more valuable commercial and industrial spaces. The redevelopment of existing industrial land and building space may be easier for communities than finding areas within the community that may be rezoned or converted from residential uses.
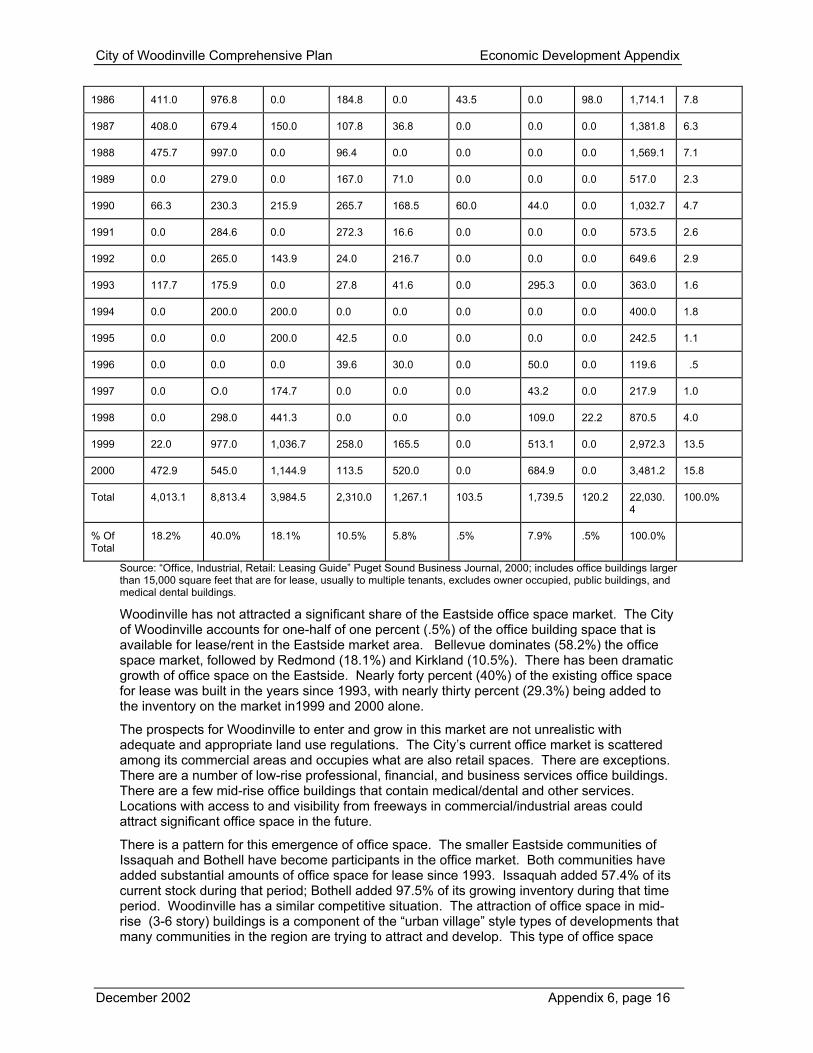
Table A6-12 summarizes similar real estate information about the office market segment of the Eastside real estate sub-area. The Seattle office market tends to dominate the region, but the Eastside market area is a significant and growing part of the regional real estate office market.
Table A6-13 Office Space for Lease for Selected Eastside Cities (1,000’ square feet)
Year Built
Renovated
Bellevue CBD
Bellevue
Other
Redmond Kirkland Issaquah Woodinville Bothell Mercer Island
Total % Of existing office space
>1980 457.4 789.2 0.0 184.4 0.0 0.0 0.0 0.0 1,431.0 6.5
1980 235.9 596.4 43.0 40.0 0.0 0.0 0.0 0.0 915.3 4.1
1981 277.5 169.2 145.9 0.0 0.0 0.0 0.0 0.0 592.6 2.7
1982 0.0 189.3 0.0 149.7 0.0 0.0 0.0 0.0 339.0 1.5
1983 1,059.7 200.8 0.0 290.5 0.0 0.0 0.0 9.9 1,551.0 7.0
1984 0.0 490.8 41.4 26.0 0.0 0.0 0.0 0.0 558.2 2.5
1985 0.0 469.7 46.8 20.0 0.0 0.0 0.0 0.0 536.5 2.4
December 2002 Appendix 6, page 15
City of Woodinville Comprehensive Plan Economic Development Appendix
1986 411.0 976.8 0.0 184.8 0.0 43.5 0.0 98.0 1,714.1 7.8
1987 408.0 679.4 150.0 107.8 36.8 0.0 0.0 0.0 1,381.8 6.3
1988 475.7 997.0 0.0 96.4 0.0 0.0 0.0 0.0 1,569.1 7.1
1989 0.0 279.0 0.0 167.0 71.0 0.0 0.0 0.0 517.0 2.3
1990 66.3 230.3 215.9 265.7 168.5 60.0 44.0 0.0 1,032.7 4.7
1991 0.0 284.6 0.0 272.3 16.6 0.0 0.0 0.0 573.5 2.6
1992 0.0 265.0 143.9 24.0 216.7 0.0 0.0 0.0 649.6 2.9
1993 117.7 175.9 0.0 27.8 41.6 0.0 295.3 0.0 363.0 1.6
1994 0.0 200.0 200.0 0.0 0.0 0.0 0.0 0.0 400.0 1.8
1995 0.0 0.0 200.0 42.5 0.0 0.0 0.0 0.0 242.5 1.1
1996 0.0 0.0 0.0 39.6 30.0 0.0 50.0 0.0 119.6 .5
1997 0.0 O.0 174.7 0.0 0.0 0.0 43.2 0.0 217.9 1.0
1998 0.0 298.0 441.3 0.0 0.0 0.0 109.0 22.2 870.5 4.0
1999 22.0 977.0 1,036.7 258.0 165.5 0.0 513.1 0.0 2,972.3 13.5
2000 472.9 545.0 1,144.9 113.5 520.0 0.0 684.9 0.0 3,481.2 15.8
Total 4,013.1 8,813.4 3,984.5 2,310.0 1,267.1 103.5 1,739.5 120.2 22,030.4
100.0%
% Of Total
18.2% 40.0% 18.1% 10.5% 5.8% .5% 7.9% .5% 100.0%
Source: “Office, Industrial, Retail: Leasing Guide” Puget Sound Business Journal, 2000; includes office buildings larger than 15,000 square feet that are for lease, usually to multiple tenants, excludes owner occupied, public buildings, and medical dental buildings.
Woodinville has not attracted a significant share of the Eastside office space market. The City of Woodinville accounts for one-half of one percent (.5%) of the office building space that is available for lease/rent in the Eastside market area. Bellevue dominates (58.2%) the office space market, followed by Redmond (18.1%) and Kirkland (10.5%). There has been dramatic growth of office space on the Eastside. Nearly forty percent (40%) of the existing office space for lease was built in the years since 1993, with nearly thirty percent (29.3%) being added to the inventory on the market in1999 and 2000 alone.
The prospects for Woodinville to enter and grow in this market are not unrealistic with adequate and appropriate land use regulations. The City’s current office market is scattered among its commercial areas and occupies what are also retail spaces. There are exceptions. There are a number of low-rise professional, financial, and business services office buildings. There are a few mid-rise office buildings that contain medical/dental and other services. Locations with access to and visibility from freeways in commercial/industrial areas could attract significant office space in the future.
There is a pattern for this emergence of office space. The smaller Eastside communities of Issaquah and Bothell have become participants in the office market. Both communities have added substantial amounts of office space for lease since 1993. Issaquah added 57.4% of its current stock during that period; Bothell added 97.5% of its growing inventory during that time period. Woodinville has a similar competitive situation. The attraction of office space in mid-rise (3-6 story) buildings is a component of the “urban village” style types of developments that many communities in the region are trying to attract and develop. This type of office space
December 2002 Appendix 6, page 16

City of Woodinville Comprehensive Plan Economic Development Appendix
development over retail space on ground floors or in combination with medium density residential space is appearing in suburban communities outside of the Seattle area. It is consistent with the “pedestrian friendly” types of developments that many communities covet.
Woodinville has the location and will experience market pressure that will be consistent with attracting more office space in mixed-use developments, as well as its industrial areas, especially areas visible from the freeway.
Another strength of the City of Woodinville rests on some of the businesses that have located here. The available data sources do not show the level of detail to quantify the importance of tourism and other traditional businesses that attract local and regional visitors to the City. Woodinville is known within the region and state for certain businesses that are associated with agriculture, nurseries, wineries, plus a new lodging facility that serves this market niche. Supporting the tourism is a diner railroad and entertainment train terminus that serves as an attraction. In addition, the Sammamish River Trail system links the City to other recreational assets of the northern part of King County and other parks and recreation destinations.
A-6.2 Trends and Projections
The use, occupation and redevelopment of the City’s land base is very important. The City is “landlocked”, i.e., surrounded by other incorporated cities and is adjacent to the state-mandated and King County determined urban growth area boundary. There is limited land for growth in the community and its tax base.
A-6.2.1 Population History: 1980 to 1990 From 1980 to 1990, the percent of population change per year in Woodinville outpaced that of King County and the State of Washington, as shown in Table A6-14. In fact, the population of Woodinville grew at a rate more than twice as fast as King County and the State of Washington over the decade. The Woodinville Planning Area grew by 45.3 percent from 1980 to 1990. This corresponds to an annual growth rate of approximately 3.80 percent per year.
In contrast, King County grew by 18.3 percent during the 1980s. This growth in King County's population accounted for about 240,000 additional people, or roughly one-third of the State's increase of 740,000 people over the decade. On an annual basis, King County averaged 1.70 percent growth in population per year, almost exactly mirroring the State of Washington's growth rate of 1.69 percent.
Table A6-14 Population History 1980 to 2000
Jurisdiction 1980 Population
1990 Population
2000 Population
Percentage Increase
1990-2000*
Long term (1980-2000)
Annual Percent Growth
Rate (%/year)*
Forecast 2000-2020
(% per year)
City of Woodinville
n/a
8,587est
9,194
(10.145)**
7.1 (0.0)**
0.7 (1.7)**
Bothell 7,943 12,345 30,470 146.8 6.9 Bellevue 73,903 86,874 109,827 26.4 2.0 Issaquah 5,536 7,786 11,212 44.0 3.6 Kirkland 18,779 40,052 45,054 12.5 4.5
Redmond 23,318 35,800 45,256 26.4 3.4
Woodinville FAZ***
n/a
14,805
17,125
15.7
1990-2000 1.5
1.8***
December 2002 Appendix 6, page 17

City of Woodinville Comprehensive Plan Economic Development Appendix
King County 1,269,749
1,502,428
1,737,034
15.6
1.6
0.8
State of Washington
4,132,156
4,866,692
5,894,121
21.1
1.8
1.2
Notes: * Includes population growth through annexations; ** 2000 census estimate (and 2000 City estimate in parentheses); *** FAZ = Forecast Analysis Zone use by Puget Sound Regional Council (PSRC) for forecasting future population, employment growth, composed of two census tracts, an area larger than current city boundaries, and reflects the experience of the area around and including the current City of Woodinville; Sources: Censuses of 1980, 1990, and 2000: PSRC “1999 Working Projections for Population and Employment” (2000) was the source for population growth rates to 2020; Population growth rate forecasts to 2020 for the County and State were obtained from the State’s Office of Financial Management that by the growth management law is tasked with providing forecasts of population for counties and the state. These forecasts were the intermediate range forecasts from OFM produced after the 2000 Census in January of 2002; and Economic Consulting Services: plus City of Woodinville.
A-6.2.2 Household History: 1980 to 1990
Data on changes in the number of households in Woodinville follows a pattern similar to population changes. As illustrated in Table A6-15, the number of households in Woodinville increased by 50.22 percent from 1980 to 1990, for an annual growth rate of 4.15 percent. Household growth rates in the Woodinville Planning Area were double the corresponding rates for King County and the State of Washington.
Table A6-15 Woodinville Household Statistics Compared to King County and the State of Washington 1980 Total
Households 1990 Total Households
% Change 2000 Total Households
Annual Rate of Change
City of Woodinville N/A 3,297 N/A 3,512 N/A
Woodinville Planning Area 9,452 14,199 50.22 4.15
King County 497,292 615,792 23.80 710,916 2.16
State of Washington 1,540,516 1,872,431 21.50 2,271,398 1.97 Source: Puget Sound Council of Governments, 1990 / 2000 Census Reports, and Economic Consulting Services.
A-6.2.3 Population and Household Projections
The regional planning agency, the Puget Sound Regional Council (PSRC), prepares a set of projections of population, dwelling units, and employment for the four county regions. It also prepares projections for small areas; forecast analysis (FAZ) zones. These FAZ’s contain several census tract areas, but do not reflect City boundaries. Table A6-16 displays the projections for the next twenty years. The patterns for the future are different than those of the past decade. The growth in the areas that surround and include the City of Woodinville are projected to continue population and housing unit growth at rates faster than the county. Growth in employment is projected to slow considerably to an annual rate half that of the county and one-eighth as fast as the recent past.
The models that the PSRC uses to project future growth indicate a slowing of employment growth in the future. There are limitations for using the PSRC projections for an area like Woodinville. The PSRC models are based on relationships between employment and population location with respect to the regional transportation network. The main use of these models is regional planning for transportation. The models do not directly consider real estate market factors, including the potential for redevelopment of existing land.
The projections were used to indicate an amount of land that will be needed for economic development purposes within the City. Table A6-19 contains the land needs projections for economic development purposes. The task before the City is to plan and use its land base to continue the balance of relatively strong economic activity and a viable tax base into the future. The potential need to redevelop existing real estate should be taken into account and the pace of economic activity should be monitored to continuously update these land need projections.
December 2002 Appendix 6, page 18

City of Woodinville Comprehensive Plan Economic Development Appendix
Table A6-16 Population and Employment projections for Woodinville Area*
1990
Estimated % Change per year 1990-2000
2000
Projected % change per year 2000-2020
2020
Population in Woodinville FAZ*
14,805 1.4% (2320)
17,125 1.8% (7437)
24,562
Rate of growth applied to City Population
10,145 1.8% 14,495
Population growth rate in King County
1.5% 1.0%
Population growth rate in Washington State****
1.2%
Woodinville FAZ Housing Units
4,779
1.9%
5,760
2.1%
8,776
Applied to City of Woodinville Housing Units
3,888
5,891
% Single family from FAZ
84%
82%
81%
Employment Woodinville FAZ 5,346 4.2%
(2,745) 8,091 .5%
(840) 8,931
King County
2.0% 1.1%
City of Woodinville Using rate of growth in FAZ
Estimated 1999
% Increase per year
Projected for 2020
Increase
Manufacturing 2278 .28 of 1% 2416 138 W.T.C.U.** 1154 .13 1186 32 Retail 1810 .18 1880 70 Service F.I.R.E.** 2313 .68 2667 354 Gov’t / Ed 429 2.14 495 66 Resource** 2339 .50 2819 480 Total Covered Employment
10,323 .50 11,463 1140
Notes: * This Woodinville FAZ Is a “Forecast Analysis Zone” which includes two census tracts and includes the area that is currently the incorporated City of Woodinville. These FAZ’s areas are used by the Puget Sound Regional Council to make projections that may be used for transportation planning on a uniform basis within the region. ** W.T.C.U. includes Wholesale, Transportation, Communications, Utilities; F.I.R.E. includes Finance, Insurance, & Real Estate; Resource includes: Agriculture, Fishing, Forestry, Mining, & Construction. ***Covered employment does not include some service workers, self-employed, some management employees. ****Based on intermediate range projections from OFM (January 25, 2002) Source: Population and Employment Projections, Puget Sound Regional Council, 1999: Office of Financial Management, State of Washington January 25, 2002
Table A6-17 Population Growth for Woodinville and Surrounding Communities
Population Growth Jurisdiction 1990 2000 % Of growth
per decade
City of Woodinville
8,587 9,194* 7%
Bothell 12,345 30,150 144%*
Redmond 35,800 45,256 26 %
Kirkland 40,052 45,054 12%
December 2002 Appendix 6, page 19

City of Woodinville Comprehensive Plan Economic Development Appendix
Issaquah 7,786 11,212 44%
Mill Creek 7,172 11,525 61%
Bellevue 86,874 109,827 26%
Seattle 516,259 563,374 9%
King County 1,502,428 1,737,034 16% Source: 2000 US Census data / 2001 King County Growth Report. *The City of Woodinville is currently working with the US Census and the Washington State to ensure accuracy of this number. *Due to a large annexation in the City of Bothell.
Table A6-18 Average Household Size for Woodinville and Surrounding Communities
Jurisdiction Household Size
City of Woodinville 2.61
Bothell 2.51
Redmond 2.33
Kirkland 2.13
Issaquah 2.27
Mill Creek 2.48 Bellevue 2.37
Seattle 2.08
King County 2.39 Source: 2000 US Census data.
A-6.2.4 Economic Trends The data in Table A6-16 is from forecasts by the Puget Sound Regional Council. The Puget Sound Regional Council provides forecasts of population, households, and employment for the four county regions: King, Kitsap, Pierce, and Snohomish. While these countywide forecasts have been reasonably accurate in the past, some small communities find the forecasts inaccurate at the municipal level. Since they are the only forecasts of long-term economic activity available for county and smaller areas, they are used in this report. The methodology is generally sound and updated frequently. Local governments in this region for planning purposes use the results.
Long-term availability of commercial and industrial areas for expansion is limited, and Woodinville must rely on currently identified infill land for new development and redevelopment.
Table A6-19 Land Needs Projections 2000-2020
Type of Space* Increase in
Employment Projected
Square Feet Per
Employee
Land Coverage
Estimated Acres
Needed Business Park 170 1,500 sq. ft. .25 -.45 23-13 acres
Retail 70 300 sq. ft. .35 -.50 7-5 Office 354 500 sq. ft. .20 - .25 4-3
Gov’t / Ed 66 4.21/acre** na 16 Total 660 50-37ac.
Notes; *does not include Agricultural, Fishing, Forestry, Mining, or Construction employment, some of this type of employment could be accommodated into business park or office space. Business park employment includes: Manufacturing, Wholesale, Transportation, Communication, Utilities. Office employment includes: Services, Finance, Insurance, Real Estate. **Obtained by comparing employment in these industrial categories to land use data for the City of Woodinville. Some of the increase in this type of employment could be accommodated within existing facilities or sites
December 2002 Appendix 6, page 20

City of Woodinville Comprehensive Plan Economic Development Appendix
A-6.3 Summary of Countywide Plans and Policies A-6.3.1 Washington State Growth Management Act (1990-1991)
Economic development in growth management planning provides a balance to land use and environmental regulation. It realistically considers the need to stimulate economic activity to provide the community’s strength to achieve their vision. The public sector can shape and influence the direction of economic development, but ultimately the decisions of private firms are what generate community growth.
Economic development is listed prominently among the goals of the 1990 Growth Management Act that set its intent:
(5.) Economic Development. Encourage economic development throughout the State that is consistent with adopted comprehensive plans, promote economic opportunity for all citizens of this State, especially for unemployed and for disadvantaged persons, and encourage growth in areas experiencing insufficient economic growth, all within the capacities of the State’s natural resources, public services and public facilities (Pt I Sec 2).
Cities and counties are encouraged to adopt economic development elements, as a part of comprehensive plans, but are not compelled to do so. Several large and small cities have chosen to do this. There is a direct intent in several sections of the Growth Management Act that economic or employment activities be balanced with other goals and objectives, and that state resources be used to assure that growth is spread around the state. Cities are asked to promote economic opportunity for all citizens of this state, especially for unemployed and for disadvantaged persons.
Implicitly, economic development and economic concepts are themes that run through the Growth Management Act legislation. For example, impact fees and concurrency are applications of well established pricing principles for financing public infrastructure–the main principle being that those who benefit should pay according to use. The Growth Management Act enables jurisdictions to plan and zone in ways that are consistent, to assure that capital facility capacities are financially consistent with plans, and to provide protection of sensitive environments.
A-6.3.2 Vision 2020 and Economic Development (1990) The Puget Sound Regional Council (PSRC) has adopted region-wide goals and objectives to guide multi-jurisdictional transportation and land use policies. Economic development is implicit in many of their goals and objectives. PSRC has adopted a five-part strategy for encouraging growth. One of these strategies directly relates to economic development and reads as follows:
Maintaining a Strong Regional Economy and Accommodate Growth
a. Accept responsibility to plan for the moderate growth forecast for the region by 2020,
b. Promote a distribution of new employment growth centers, such as Tacoma, Everett, and Bremerton, to relieve growth pressures on King County,
c. Provide enough urban land to allow private enterprise to effectively create the urban structures in which residents will live and work, and
d. Recognize the mobility needs of business and industry and provide for these needs within the intent of VISION 2020.
A-6.3.3 King County King County, through its growth management planning policies and process, is re-emphasizing the economic development implications of growth management. The proposed King County
December 2002 Appendix 6, page 21

City of Woodinville Comprehensive Plan Economic Development Appendix
Economic Development Policies intend to assist jurisdictions in the establishment of policies and implementation of procedures conducive to a healthy and diverse economic climate.
The King County comprehensive planning process has had a wide-ranging and broad-based discussion of the implications for fiscal and economic development of its planning policies.
The countywide planning policies are intended to provide vision and policy direction for King County jurisdictions. The countywide policies related to economic development direct the county to:
a. Strengthen, expand, and diversify the economy, b. Protect the environment, c. Enhance human resources for economically disadvantaged citizens and
neighborhoods through job training and education, d. Direct governmental actions to mobilize the land supply with infrastructure and
reasonable permitting, e. Foster private/public partnerships, and f. Establish implementation, monitoring and evaluation systems for economic
development goals.
A-6.3.4 Snohomish County To achieve sustainable economic vitality for all the communities of Snohomish County, jurisdictions are encouraged, where appropriate, to develop and incorporate an economic strategy as part of their comprehensive plans. Each local government in Snohomish County is directed to take the following actions as part of its comprehensive plan:
a. Assess the comparative advantages, which the community now offers or could create to support future economic diversification and vitality,
b. Enhance the economic health of the community by explicitly identifying areas where future economic activity and growth is desired and foster the efficient linkage of major commercial and manufacturing with an adequate supply of affordable housing,
c. Designate locations for commerce and industry in the land use element and in urban growth areas,
d. Include economic development policies consistent with existing or planned capital and utility facilities,
e. Coordinate economic plans with transportation, housing, and land use policies that support economic development and predictability for future growth, and
f. Recognize, where appropriate, the growth and development needs of businesses of local, regional, or statewide significance.
A-6.4 Economic Development Opportunities The future economic situation for the City of Woodinville is very positive overall. The City has the potential to grow from its already diverse economic base. Not only does the City have a diverse economy for a newer part of the metropolitan area, it retains some of the attributes that have traditionally provided it strength and association with traditional agricultural and resource industries. Further, it has the distinction of being a tourism destination, which is rare for a small city within a large metropolitan area. The City has the benefit of a good economic location and is surrounded by areas that have exhibited and are expected to exhibit continued economic and population growth.
December 2002 Appendix 6, page 22

City of Woodinville Comprehensive Plan Economic Development Appendix
That general list of positive geographical attributes also comes with some significant challenges to direct and encourage economic growth. Besides being a task that is important to private businesses and property owners in the City, the challenge to encourage and sustain economic growth is important to the residential community. The resources that are necessary to provide a level and quality of public services and facilities for all of its citizens come directly from a healthy and growing tax base.
Opportunities
The economic opportunities that will sustain the City of Woodinville for the future are related to its challenges. The City can build on the economic base that it has inherited and encouraged. The City has the potential to leverage its future from the current and potential economic base. Among the opportunities that will sustain and have the potential to leverage a positive future are:
1. Location on and near major freeways, Interstate-405, State Route (SR)-522, SR-202, and SR-9. Other major roadways include Woodinville-Snohomish and Woodinville-Duvall Roads,
2. Proximity to regional economic assets:
i. Large concentrations of employment in the Eastside area of King County, including high technology, scientific, regional and national or internationally related firms,
ii. A branch campus of the University of Washington, and
iii. A skilled employee pool.
3. Proximity to a “High Technology Corridor” that begins near Woodinville in Bothell and extends along I-405 culminating in a large concentration of Boeing employment in southwest Everett, this area has capacity to accommodate future business and employment growth,
4. Established niche, such as nurseries, wineries, visitor/tourist and recreational attractions,
5. Established real estate niche as an industrial location,
6. Image for quality residential areas,
7. Land for development and redevelopment, including industrial and resource areas and the downtown, and
8. Location with concentration of retail space.
Some of these attributes are well established while others may need to be nurtured and encouraged with initiation from the public sector.
Challenges
The challenges that face Woodinville include:
1. Find ways to provide adequate utility, roads and other infrastructure to all areas of the City, especially those occupied by and zoned for commercial and industrial uses,
2. Facilitate the efficient use of its limited land base and conversion of industrial and resource –oriented properties to those that respond to market trends,
December 2002 Appendix 6, page 23

City of Woodinville Comprehensive Plan Economic Development Appendix
December 2002 Appendix 6, page 24
3. Transform the image of the community based on development conditions along SR-522,
4. Form effective public-private partnerships with organizations that represent the business and property ownership community and developers of specific real estate projects,
5. Continue investment in tourism assets and to leverage tourism visits into economic development activity that benefits other local businesses,
6. Continue to attract businesses from regional markets as well as businesses that serve local resident’s needs,
7. Increase the share of office, business park and commercial uses as a competitive location in the Eastside market area,
8. Identify an appropriate area to be the focus for downtown improvement, then plan for and encourage private investment in horizontal and vertical mixed use development in a “pedestrian friendly” environment consistent with evolving trends elsewhere in the region,
9. Increase the level of amenities and infrastructure in industrial areas to compete with other areas on the Eastside while not losing its competitive edge for industrial space from such improvements,
10. Provide infrastructure to serve an increasingly urban area rather than a small town rural setting, especially linking areas with strength and growth potential,
11. Examine and initiate remedies for potential environmental problems caused by previous uses in industrial and resource areas, and
12. Retaining quality of life while implementing the City’s Vision.
In summary, the City of Woodinville has three established strengths:
1. Its industrial areas,
2. The tourism, and
3. Its expanding retail role.
In addition to its range and quality of residential areas, there are four directions for potential economic growth:
1. Encouraging mixed uses (commercial and residential) in the downtown,
2. Recognizing the potential growth of the small tourist/visitor assets and link them to other potential growth areas,
3. Redeveloping of industrial areas and parks for higher valued uses, and
4. Accommodating office buildings and parks.
In addition to the plans, strategies and implementation actions that may be taken by the City, there are state laws, plans and policy directives that will influence local economic development. Economic development is a goal with implementation strategies in state, regional and county growth management policies and plans. There are also other regional and county agencies that may be able to provide resources and assistance to the Woodinville community.