arcgis online instructions -...
TRANSCRIPT

©NatureMapping Program 2011
ArcGIS Online Instructions Create a Map
Make a Slide Presentation Upload Field Investigation Data
Overview ArcGIS Online has made creating maps very easy. You will learn how to watch a slide presentation online, create your own map and slide presentation, then
1. Watch 3 slide presentations online 2. Make a map and then a “slide presentation” that can be viewed by the public, or
selected groups such as schools, project funders, or parents using online GIS software 3. Upload data from the NatureMapping spreadsheets or NatureTracker data to view on
your map. Watch a Slide Presentation and Make Your Own
1. You need “Silverlight” on your computer. You can download this for free from Microsoft.
2. http://www.arcgis.com/home/ - Bookmark this page 3. Select “Start ArGIS Explorer Online 4. Select Map Gallery 5. In the upper corner “Find Maps and Groups” type in There are 2 maps created by 3rd
graders studying the migration of salmon and their life cycle. a. Nic and Kayden's Salmon Map b. Gannon, Riley, Joclyn Salmon Map
6. The following is Nic and Kayden’s map. Click on the Presentation button
©NatureMapping Program 2011
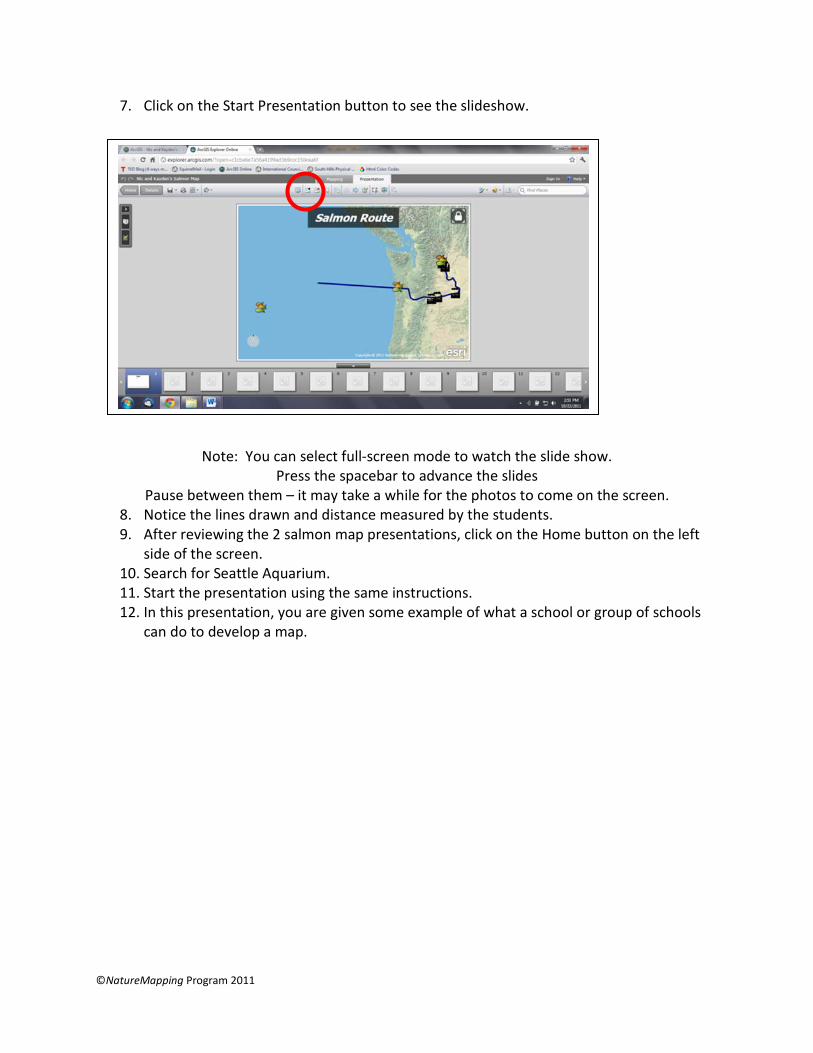
7. Click on the Start Presentation button to see the slideshow.
Note: You can select full-screen mode to watch the slide show. Press the spacebar to advance the slides
Pause between them – it may take a while for the photos to come on the screen. 8. Notice the lines drawn and distance measured by the students. 9. After reviewing the 2 salmon map presentations, click on the Home button on the left
side of the screen. 10. Search for Seattle Aquarium. 11. Start the presentation using the same instructions. 12. In this presentation, you are given some example of what a school or group of schools
can do to develop a map.
©NatureMapping Program 2011
Make Your Own Map and Slide Presentation
1. You must sign in and create a password. You can save the map as public (for the world to see) or just for a group.
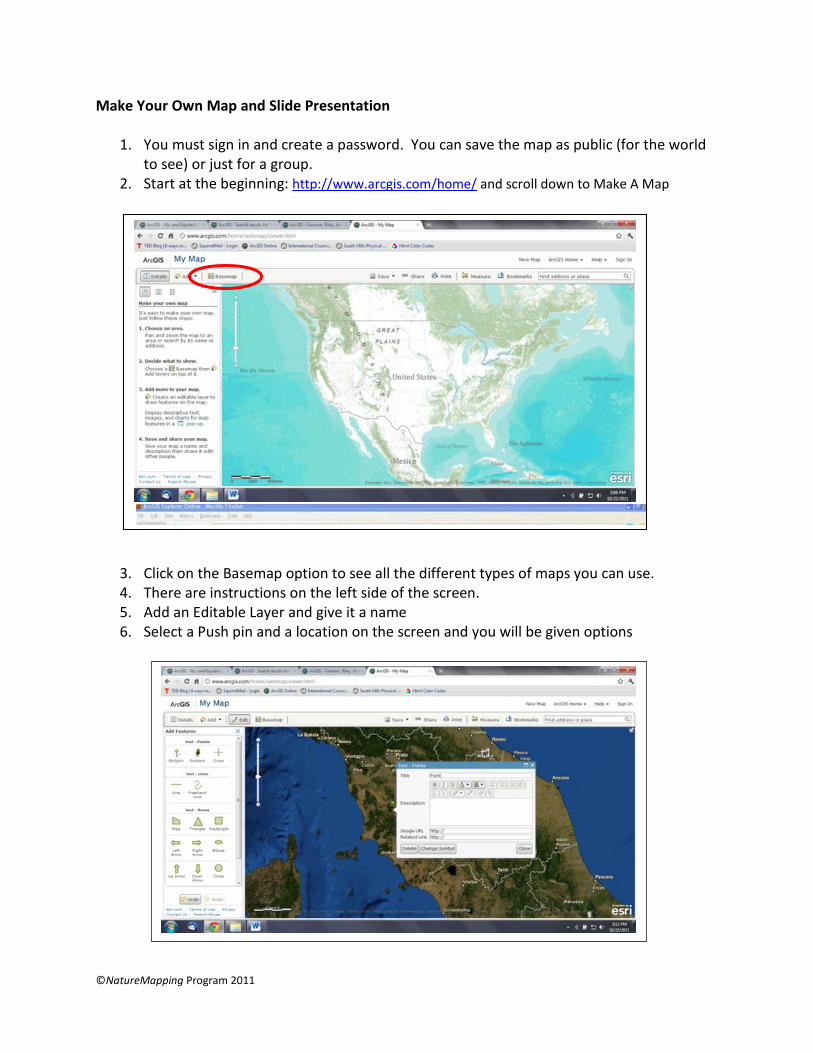
2. Start at the beginning: http://www.arcgis.com/home/ and scroll down to Make A Map
3. Click on the Basemap option to see all the different types of maps you can use. 4. There are instructions on the left side of the screen. 5. Add an Editable Layer and give it a name 6. Select a Push pin and a location on the screen and you will be given options
©NatureMapping Program 2011
7. You can put in the name of your school, type in the description, add a picture and a link to your school’s website.
8. Open another Internet window and go to your school’s website. 9. Copy the url and paste it into the pop-up box “link to url” line.
a. If you don’t have a school website, NatureMapping can help by creating a school page to link to and put pictures you want to display in the pop-up there too.
10. Select a picture from your school website (right click) and copy the picture location and paste in the pop-up window.
11. Add monitoring sites 12. Save your map.
Create a Slide Presentation
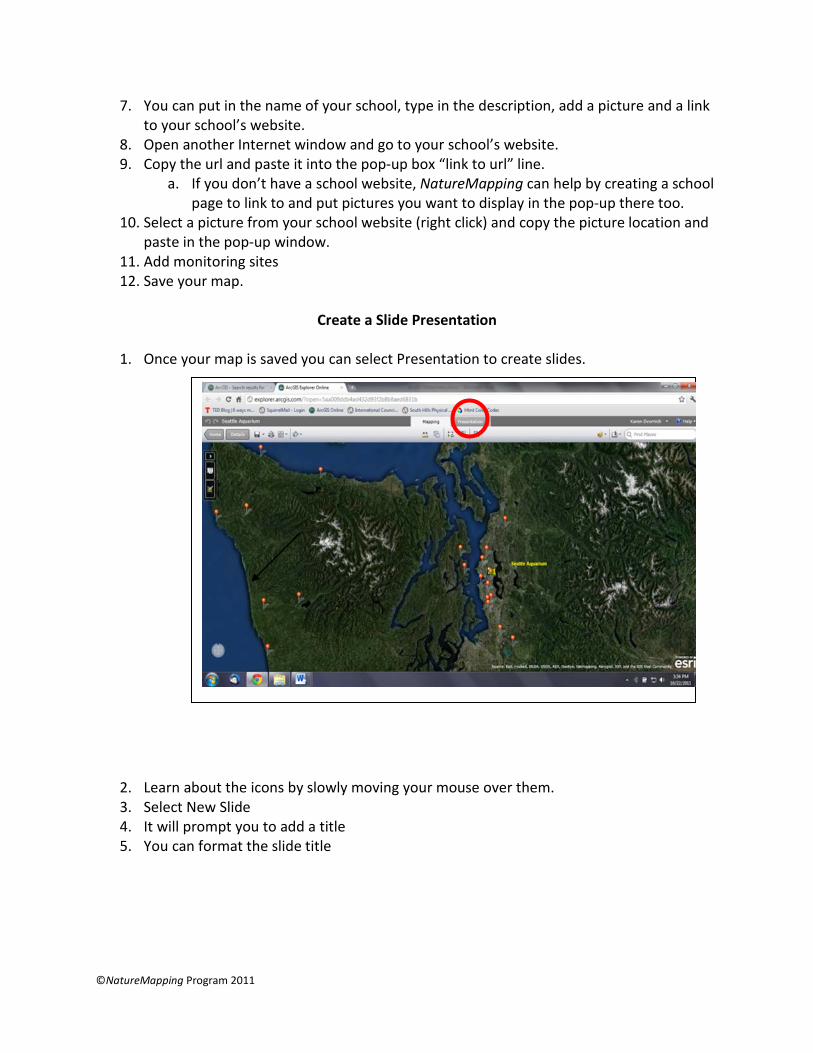
1. Once your map is saved you can select Presentation to create slides.
2. Learn about the icons by slowly moving your mouse over them. 3. Select New Slide 4. It will prompt you to add a title 5. You can format the slide title
©NatureMapping Program 2011
6. Remember to save your map.
Upload Field Investigation Data
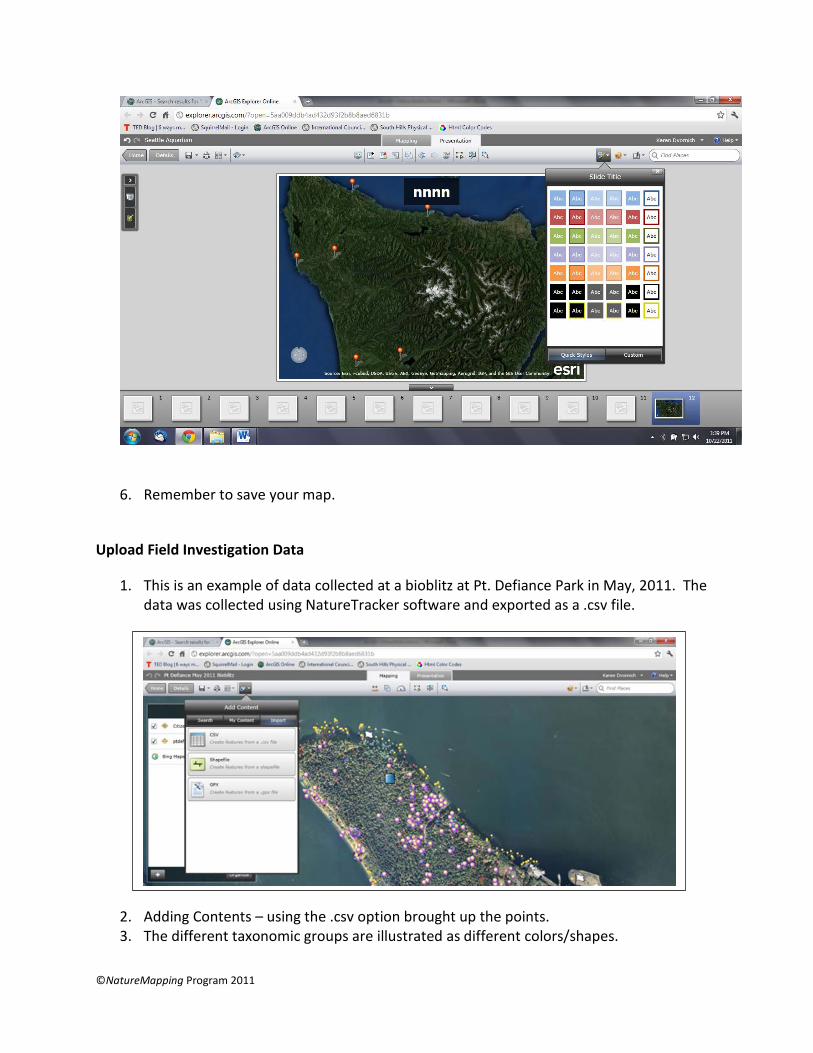
1. This is an example of data collected at a bioblitz at Pt. Defiance Park in May, 2011. The data was collected using NatureTracker software and exported as a .csv file.
2. Adding Contents – using the .csv option brought up the points. 3. The different taxonomic groups are illustrated as different colors/shapes.
©NatureMapping Program 2011
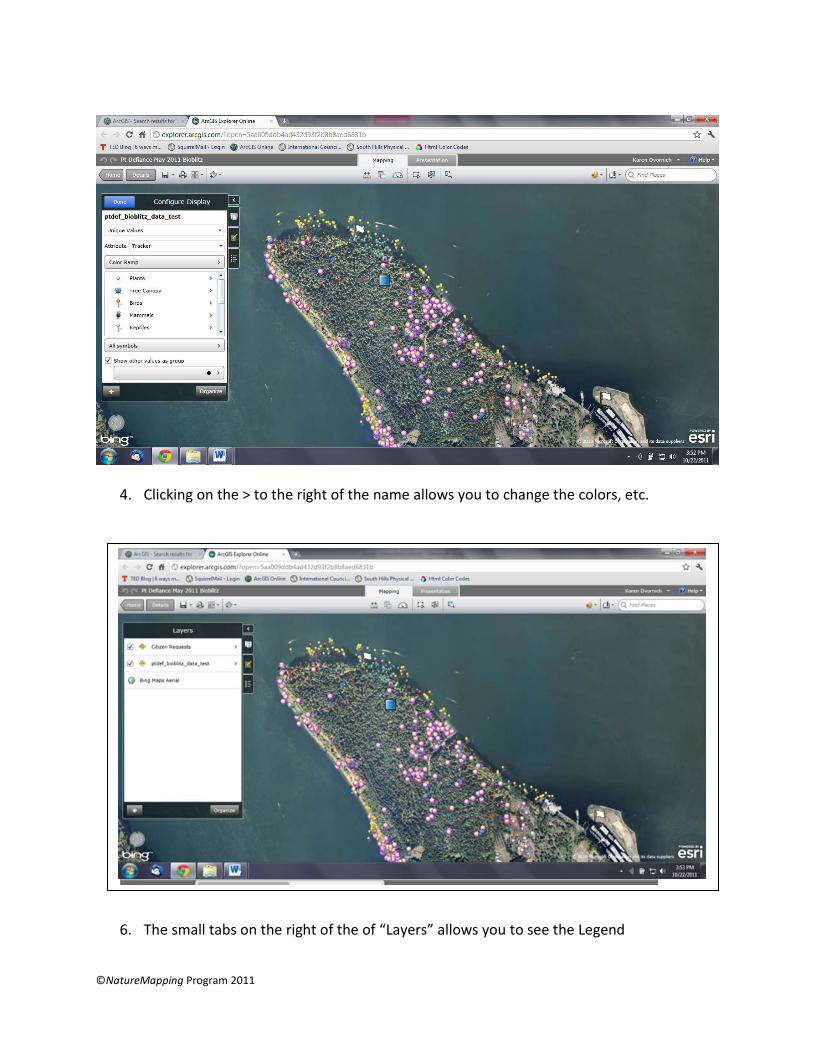
4. Clicking on the > to the right of the name allows you to change the colors, etc.
5. Save the file – do this frequently.
6. The small tabs on the right of the of “Layers” allows you to see the Legend
©NatureMapping Program 2011
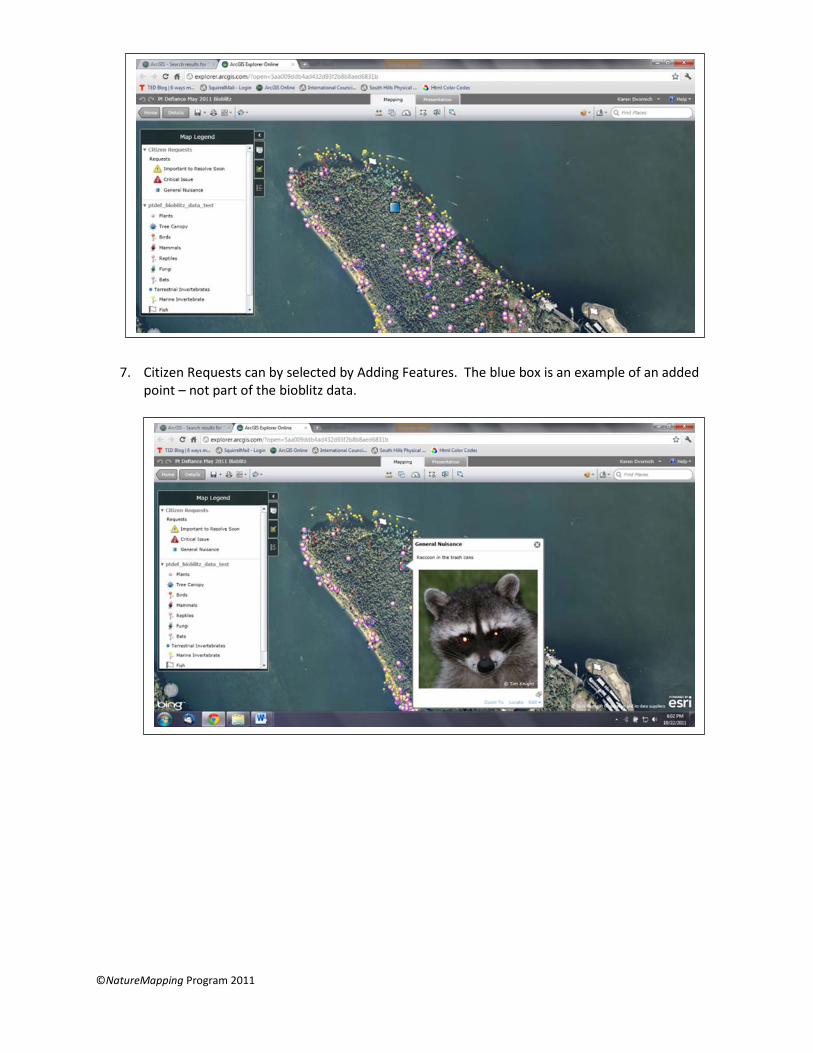
7. Citizen Requests can by selected by Adding Features. The blue box is an example of an added
point – not part of the bioblitz data.
©NatureMapping Program 2011
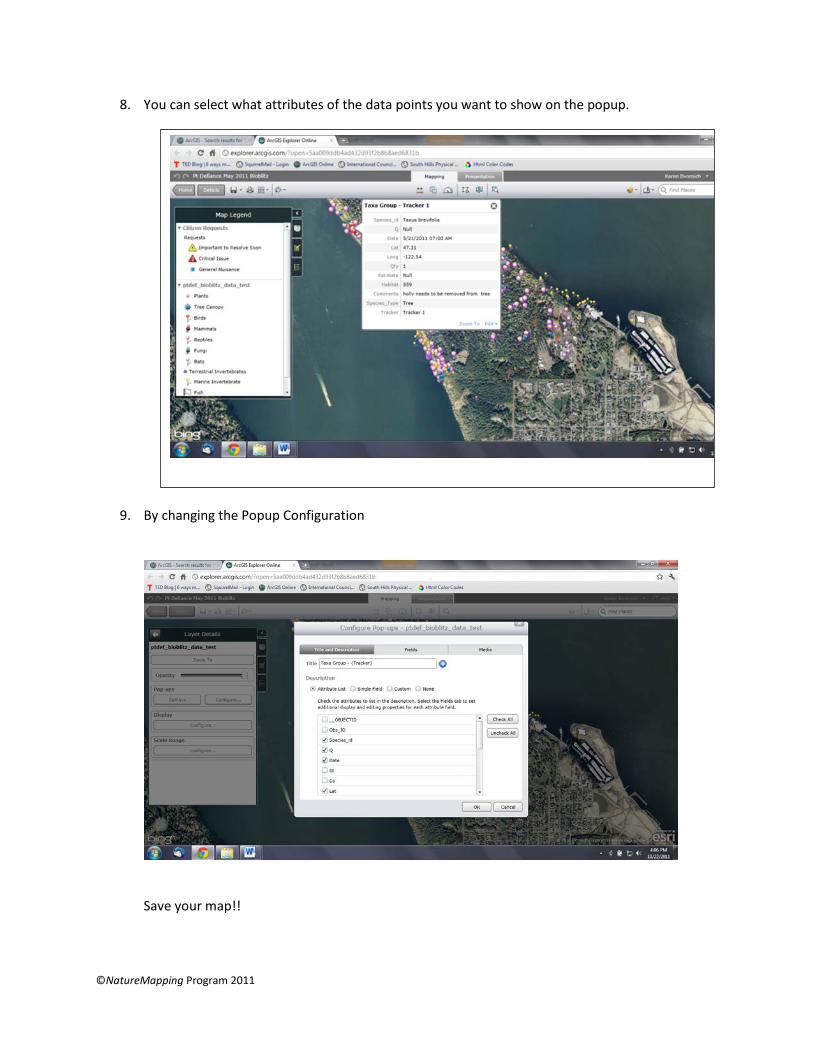
8. You can select what attributes of the data points you want to show on the popup.
9. By changing the Popup Configuration
Save your map!!