ashrae: integrated sustainable - iesve.com · of central florida isbd team. through collaboration...
TRANSCRIPT
Table of Contents
ASHRAE:
INTEGRATED SUSTAINABLE
BUILDING DESIGN
Authored by:Itza BeltranMathew CoalsonKarena EdministerToby MilesSamad SyedWoranart TimsuwanFaculty Advisor: Dr. Muthusamy V. SwamiTechnical Advisor: Nathaniel Boyd P.E.
ASHRAE:
INTEGRATED SUSTAINABLE
BUILDING DESIGN
MAY 2017
Authored By:Itza Beltran Site SustainabilityMathew Coalson Energy EfficiencyKarena Edminister Energy EfficiencyToby Miles ArchitectureSamad Syed Indoor Environmental QualityWoranart Timsuwan Water Efficiency
Faculty Advisor: Dr. Muthusamy V. SwamiTechnical Advisor: Nathanial Boyd P.E
Page 1 of 34
Table of Contents
1. Introduction 3 1.2 Design Provisions 32. Pre-Design Phase 4 2.1. Climate Analysis 4 2.2 Sustainability 6 2.3 Site selection 6 2.5 Mitigation of Heat Island Effect 7 2.6 Reduction of light pollution 7 2.6 Mitigation of Transportation Impact 73. Conceptual Phase 74. Design Phase 8 4.1 Floorplan Modifications 8 4.2 Building Envelope Design 11 4.3 Daylighting Analysis 15 4.4 Shading 16 4.5 Interior lighting 17 4.6 Exterior lighting 17 4.7 HVAC System 18 4.8 Plumbing System 24 4.9 Controls 28 4.10 Power Plants and Renewable Generation 295. Construction Phase 31 5.1 Pre-Construction 31 5.2 Construction & Building Impact 31 5.3 Post-Construction/Occupancy 316. LEED Certification 327. Life Cycle Cost Analysis 32 7.1 Building Envelope 33 7.2 HVAC Systems and Renewable Energy 34 7.3 Life Cycle Cost Summation 34References 36
Page 2 of 34
1. Introduction
The primary objective of the ASHRAE 2017 Integrated Sustainable Building Design (ISBD)project is to design a self-sustaining meteorological station to be located in the Diego Ramirez Islands ofChile. The facility must reflect the sustainable design principles as advocated by ASHRAE methodology.Design strategies applied by the team are optimized energy efficiency, health and safety, occupant comfort,functionality, longevity, flexibility, serviceability and minimizing maintenance costs.
The building project design proposed in this report represents the collective efforts of the Universityof Central Florida ISBD team. Through collaboration and application of the ISBD process, the design teamhas identified the building orientation, layout, envelope construction, mechanical systems and electricalsystems that meet the client's needs and provide the best life cycle over a 50-year period.
1.2 Design Provisions
1.2.1 Design Objectives: Project GoalsA local owner has decided to build a new facility located in the Diego Ramirez Islands of Chile.
The building design will be designed to align with ASHRAE Standard 189.1-2014 and the current versionof all Standards referenced within that document. The goal of the design is meet the energy goals of theowner by exceeding ASHRAE 189.1-2014 energy requirements. Design provisions will function to provideexceptional quality for indoor environmental conditions through optimizing thermal comfort, acousticalcontrol, air quality, daylighting, and control systems. Considerations for both cost and performance over a50-year lifespan will be the metrics detailed in a life cycle cost analysis (LCCA) that will serve to determineand justify all design selections. The LCCA was computed using standard ASTM E917-15. This standardprovides a formula and variables to consider for the calculation which will be discuss later in the report.The U.S. Green Building Council’s LEED rating system will verify the level of sustainability demonstratedby the final design.
1.2.2 Customer Project RequirementsThe Owner’s Project Requirements provided documentation of all the major design goals and
limitations the team needed to consider for the building. Some of the most significant requirements citedby the owner included:
● ASHRAE Standard 189.1 – 2014 (in reference with 90.1-2016, 55-2015, 15-2013, and 62.1-2016)● Maintain a budget of USD $200/sqft for entire building● Life of the building = 50 years● Provide owner with a return on investment of 7%● Specific indoor environmental conditions based on the type of space● Water use reduction by 30%
Page 3 of 34
Table 1 OPR Environmental Requirements
1.2.3 Standards and GuidesThe following standards provided the minimum requirements for the proposed building design; the designobjective for the ISBD team is to meet or exceed each of the following standards:
● ANSI/ASHRAE Standard 189.1- 2014, Design for High-Performance Green Buildings● ANSI/ASHRAE Standard 90.1- 2016, Commercial Building Energy Codes● ANSI/ASHRAE Standard 55- 2015, Thermal Environment Conditions for Human Occupancy● ANSI/ASHRAE Standard 62.1, 2016, Ventilation for Acceptable Indoor Air Quality● ANSI/ASHRAE Standard 15-2013, Safety Standard for Refrigeration Systems● ANSI/ASHRAE Standard 34-2013, Designation and Safety Classification of Refrigerants● ASHRAE Handbooks- i.e. Fundamentals for load calculations● USGBC Leadership in Energy and Environmental Design (LEED)Standards
2. Pre-Design Phase
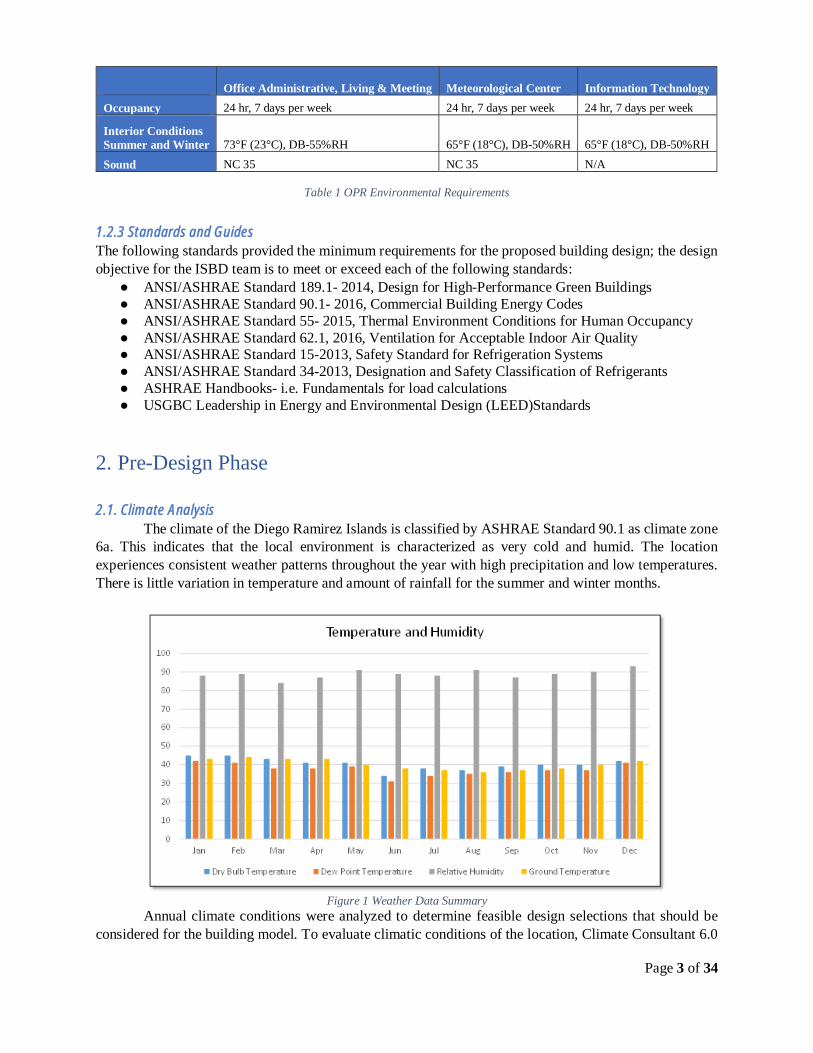
2.1. Climate AnalysisThe climate of the Diego Ramirez Islands is classified by ASHRAE Standard 90.1 as climate zone
6a. This indicates that the local environment is characterized as very cold and humid. The locationexperiences consistent weather patterns throughout the year with high precipitation and low temperatures.There is little variation in temperature and amount of rainfall for the summer and winter months.
Figure 1 Weather Data SummaryAnnual climate conditions were analyzed to determine feasible design selections that should be
considered for the building model. To evaluate climatic conditions of the location, Climate Consultant 6.0
Office Administrative, Living & Meeting Meteorological Center Information TechnologyOccupancy 24 hr, 7 days per week 24 hr, 7 days per week 24 hr, 7 days per week
Interior ConditionsSummer and Winter 73°F (23°C), DB-55%RH 65°F (18°C), DB-50%RH 65°F (18°C), DB-50%RH
Sound NC 35 NC 35 N/A
Page 4 of 34
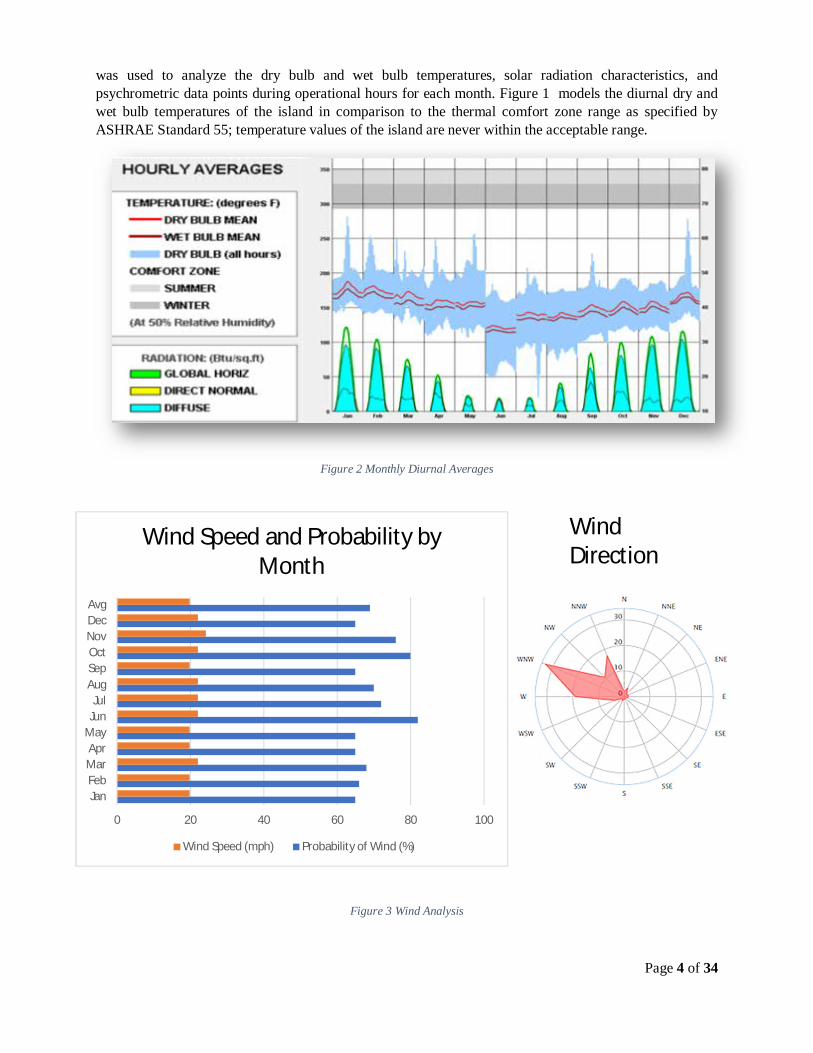
was used to analyze the dry bulb and wet bulb temperatures, solar radiation characteristics, andpsychrometric data points during operational hours for each month. Figure 1 models the diurnal dry andwet bulb temperatures of the island in comparison to the thermal comfort zone range as specified byASHRAE Standard 55; temperature values of the island are never within the acceptable range.
Figure 2 Monthly Diurnal Averages
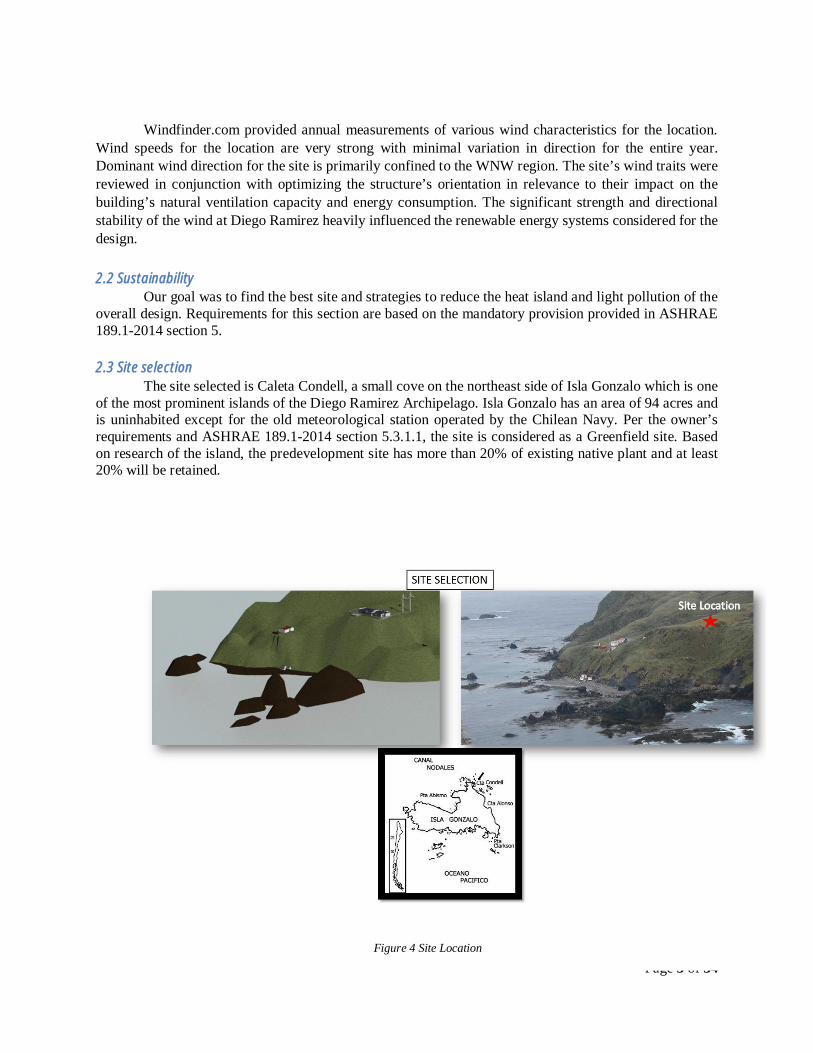
Figure 3 Wind Analysis
WindDirection
0 20 40 60 80 100
JanFebMarApr
MayJunJul
AugSepOctNovDecAvg
Wind Speed and Probability byMonth
Wind Speed (mph) Probability of Wind (%)
Page 5 of 34
Windfinder.com provided annual measurements of various wind characteristics for the location.Wind speeds for the location are very strong with minimal variation in direction for the entire year.Dominant wind direction for the site is primarily confined to the WNW region. The site’s wind traits werereviewed in conjunction with optimizing the structure’s orientation in relevance to their impact on thebuilding’s natural ventilation capacity and energy consumption. The significant strength and directionalstability of the wind at Diego Ramirez heavily influenced the renewable energy systems considered for thedesign.
2.2 SustainabilityOur goal was to find the best site and strategies to reduce the heat island and light pollution of the
overall design. Requirements for this section are based on the mandatory provision provided in ASHRAE189.1-2014 section 5.
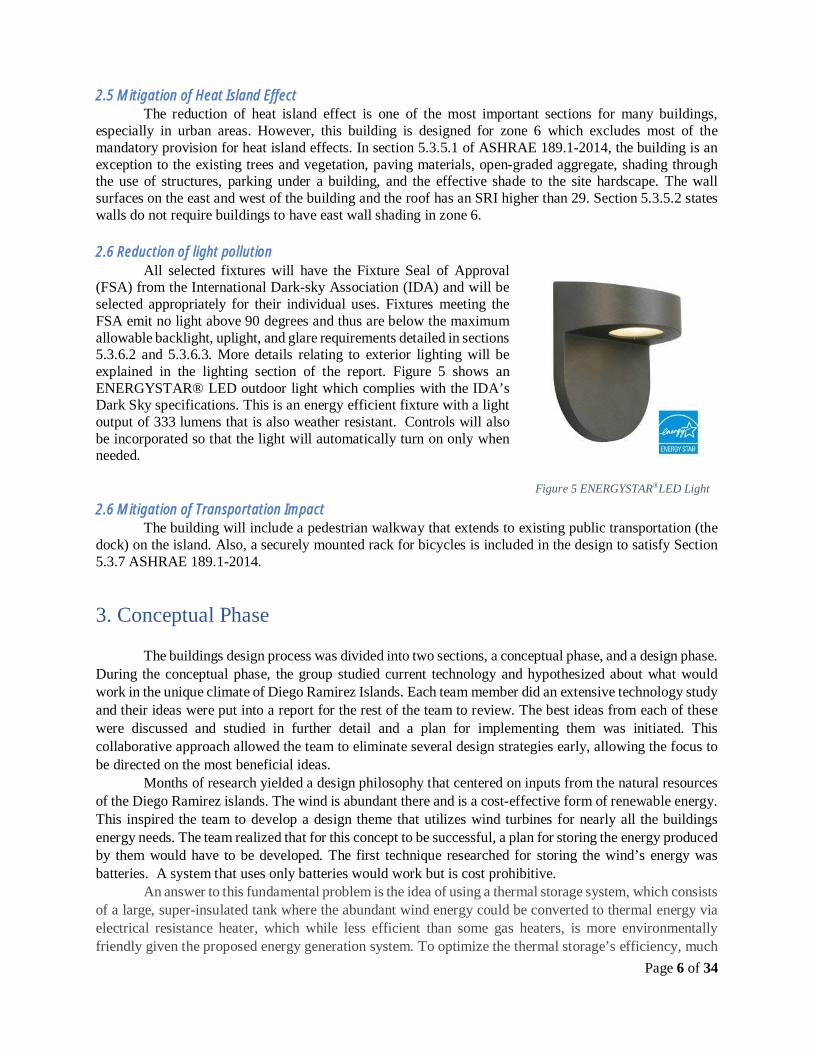
2.3 Site selectionThe site selected is Caleta Condell, a small cove on the northeast side of Isla Gonzalo which is one
of the most prominent islands of the Diego Ramirez Archipelago. Isla Gonzalo has an area of 94 acres andis uninhabited except for the old meteorological station operated by the Chilean Navy. Per the owner’srequirements and ASHRAE 189.1-2014 section 5.3.1.1, the site is considered as a Greenfield site. Basedon research of the island, the predevelopment site has more than 20% of existing native plant and at least20% will be retained.
Figure 4 Site Location
Page 6 of 34
2.5 Mitigation of Heat Island EffectThe reduction of heat island effect is one of the most important sections for many buildings,
especially in urban areas. However, this building is designed for zone 6 which excludes most of themandatory provision for heat island effects. In section 5.3.5.1 of ASHRAE 189.1-2014, the building is anexception to the existing trees and vegetation, paving materials, open-graded aggregate, shading throughthe use of structures, parking under a building, and the effective shade to the site hardscape. The wallsurfaces on the east and west of the building and the roof has an SRI higher than 29. Section 5.3.5.2 stateswalls do not require buildings to have east wall shading in zone 6.
2.6 Reduction of light pollutionAll selected fixtures will have the Fixture Seal of Approval
(FSA) from the International Dark-sky Association (IDA) and will beselected appropriately for their individual uses. Fixtures meeting theFSA emit no light above 90 degrees and thus are below the maximumallowable backlight, uplight, and glare requirements detailed in sections5.3.6.2 and 5.3.6.3. More details relating to exterior lighting will beexplained in the lighting section of the report. Figure 5 shows anENERGYSTAR® LED outdoor light which complies with the IDA’sDark Sky specifications. This is an energy efficient fixture with a lightoutput of 333 lumens that is also weather resistant. Controls will alsobe incorporated so that the light will automatically turn on only whenneeded.
2.6 Mitigation of Transportation ImpactThe building will include a pedestrian walkway that extends to existing public transportation (the
dock) on the island. Also, a securely mounted rack for bicycles is included in the design to satisfy Section5.3.7 ASHRAE 189.1-2014.
3. Conceptual Phase
The buildings design process was divided into two sections, a conceptual phase, and a design phase.During the conceptual phase, the group studied current technology and hypothesized about what wouldwork in the unique climate of Diego Ramirez Islands. Each team member did an extensive technology studyand their ideas were put into a report for the rest of the team to review. The best ideas from each of thesewere discussed and studied in further detail and a plan for implementing them was initiated. Thiscollaborative approach allowed the team to eliminate several design strategies early, allowing the focus tobe directed on the most beneficial ideas. Months of research yielded a design philosophy that centered on inputs from the natural resourcesof the Diego Ramirez islands. The wind is abundant there and is a cost-effective form of renewable energy.This inspired the team to develop a design theme that utilizes wind turbines for nearly all the buildingsenergy needs. The team realized that for this concept to be successful, a plan for storing the energy producedby them would have to be developed. The first technique researched for storing the wind’s energy wasbatteries. A system that uses only batteries would work but is cost prohibitive. An answer to this fundamental problem is the idea of using a thermal storage system, which consistsof a large, super-insulated tank where the abundant wind energy could be converted to thermal energy viaelectrical resistance heater, which while less efficient than some gas heaters, is more environmentallyfriendly given the proposed energy generation system. To optimize the thermal storage’s efficiency, much
Figure 5 ENERGYSTAR®LED Light
Page 7 of 34
research was done to decide on the modifications to the floor plan. The thermal storage tank and a room tohouse it was placed near the center of the common area. Because hot water would come from this location,an effort was made to place it close to the bathrooms and kitchen, reducing plumbing costs. Also, any heatenergy lost by the tank is transferred to the inside the building reducing the amount of energy needed toheat adjacent spaces. Another abundant natural resource that influenced the design concept was precipitation. Rainfallon the islands is plentiful and, with a large flat roof on the building, will be collected and stored. To do so,the team envisioned sloping the building’s roof and directing rainwater into a large cistern for storage. Fromthere, the water will be pumped through a series of filters to feed the buildings cold water supply. For hotwater, it will be run through a heat exchanger that transfer heat from the thermal storage tank to meetoccupants hot water demands.
4. Design Phase
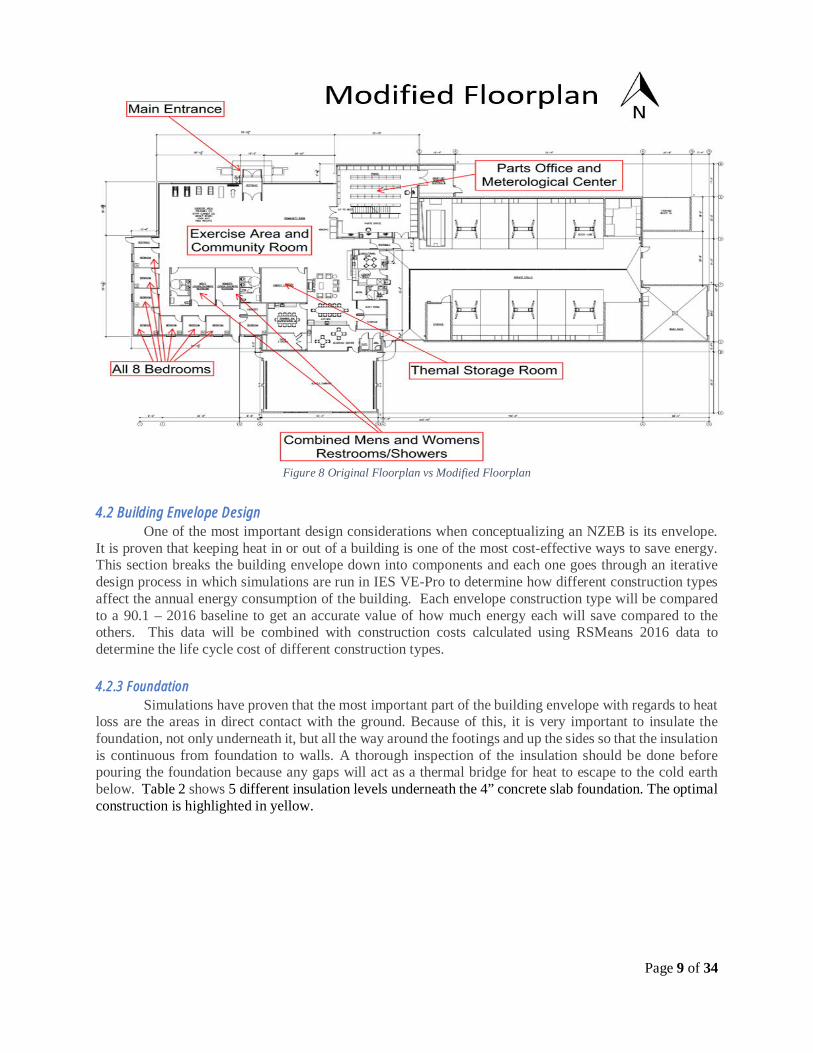
4.1 Floorplan ModificationsThe buildings floorplan was slightly modified in AutoCAD for a couple of important reasons. The
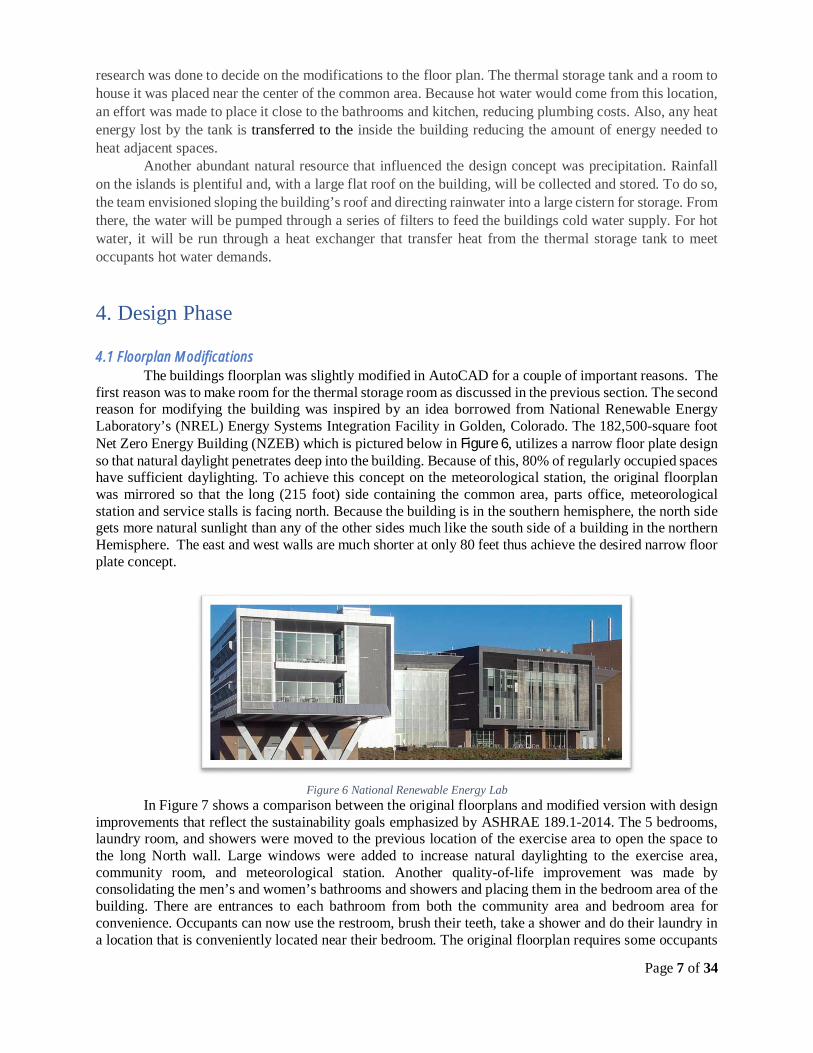
first reason was to make room for the thermal storage room as discussed in the previous section. The secondreason for modifying the building was inspired by an idea borrowed from National Renewable EnergyLaboratory’s (NREL) Energy Systems Integration Facility in Golden, Colorado. The 182,500-square footNet Zero Energy Building (NZEB) which is pictured below in Figure 6, utilizes a narrow floor plate designso that natural daylight penetrates deep into the building. Because of this, 80% of regularly occupied spaceshave sufficient daylighting. To achieve this concept on the meteorological station, the original floorplanwas mirrored so that the long (215 foot) side containing the common area, parts office, meteorologicalstation and service stalls is facing north. Because the building is in the southern hemisphere, the north sidegets more natural sunlight than any of the other sides much like the south side of a building in the northernHemisphere. The east and west walls are much shorter at only 80 feet thus achieve the desired narrow floorplate concept.
Figure 6 National Renewable Energy LabIn Figure 7 shows a comparison between the original floorplans and modified version with design
improvements that reflect the sustainability goals emphasized by ASHRAE 189.1-2014. The 5 bedrooms,laundry room, and showers were moved to the previous location of the exercise area to open the space tothe long North wall. Large windows were added to increase natural daylighting to the exercise area,community room, and meteorological station. Another quality-of-life improvement was made byconsolidating the men’s and women’s bathrooms and showers and placing them in the bedroom area of thebuilding. There are entrances to each bathroom from both the community area and bedroom area forconvenience. Occupants can now use the restroom, brush their teeth, take a shower and do their laundry ina location that is conveniently located near their bedroom. The original floorplan requires some occupants

Page 8 of 34
to walk back and forth across the common area to achieve these every-day tasks. Furthermore, windowswere added to the large spaces along the North wall and light coming from them can now travel deep intothese spaces. An additional bonus to the new layout is that the additional glazing used to achieve theimproved daylighting will provide a nice panoramic view of the Pacific Ocean. Figure 2 shows a renderingthat includes the proposed improvements.
Figure 7: Rendering of the proposed building in Autodesk Revit
Page 9 of 34
Figure 8 Original Floorplan vs Modified Floorplan
4.2 Building Envelope Design One of the most important design considerations when conceptualizing an NZEB is its envelope.It is proven that keeping heat in or out of a building is one of the most cost-effective ways to save energy.This section breaks the building envelope down into components and each one goes through an iterativedesign process in which simulations are run in IES VE-Pro to determine how different construction typesaffect the annual energy consumption of the building. Each envelope construction type will be comparedto a 90.1 – 2016 baseline to get an accurate value of how much energy each will save compared to theothers. This data will be combined with construction costs calculated using RSMeans 2016 data todetermine the life cycle cost of different construction types.
4.2.3 Foundation Simulations have proven that the most important part of the building envelope with regards to heatloss are the areas in direct contact with the ground. Because of this, it is very important to insulate thefoundation, not only underneath it, but all the way around the footings and up the sides so that the insulationis continuous from foundation to walls. A thorough inspection of the insulation should be done beforepouring the foundation because any gaps will act as a thermal bridge for heat to escape to the cold earthbelow. Table 2 shows 5 different insulation levels underneath the 4” concrete slab foundation. The optimalconstruction is highlighted in yellow.
Page 10 of 34
Table 2 Life cycle costs of building foundation considering different levels of insulation
The table shows that the 6 inches expanded polystyrene (EPS) insulation bring the life cycle cost of thebuilding down to just over $5,000,000. Even when considering the additional material costs of the thickerinsulation, $535,000 can be saved over the building’s lifecycle compared to the 90.1 – 2016 baseline.
4.2.2 Exterior Wall System For the exterior walls, the performance of 5 different construction types was tested. A baseline wasestablished by using CMU walls that were specified on the construction drawings. A good look at theprovided drawings shows a 3.5” wide furring wall inside the 8” concrete block structure. This isconveniently the width of a 2x4 and provides a good cavity for additional insulation. This construction typewas used for both the 90.1 – 2016 baseline and the 189.1 minimum design. The difference being that the90.1 construction has a smaller insulated cavity to achieve a 10 percent smaller assembly U-value than the189.1 construction.
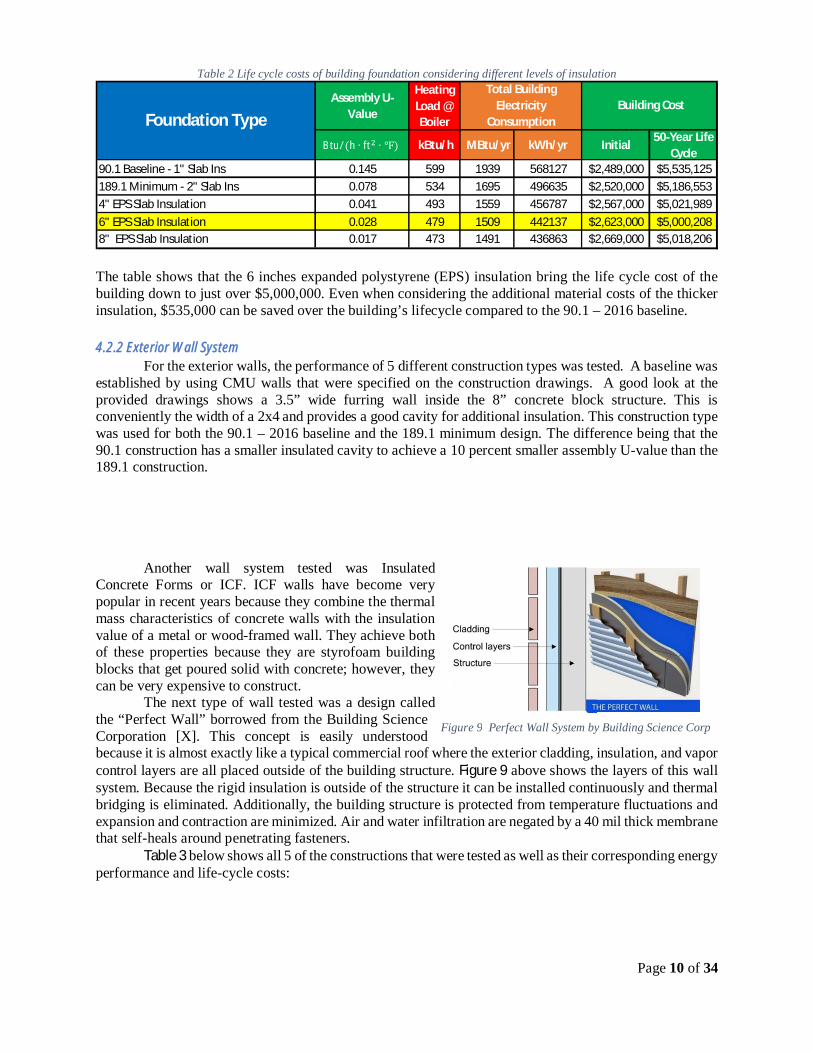
Another wall system tested was InsulatedConcrete Forms or ICF. ICF walls have become verypopular in recent years because they combine the thermalmass characteristics of concrete walls with the insulationvalue of a metal or wood-framed wall. They achieve bothof these properties because they are styrofoam buildingblocks that get poured solid with concrete; however, theycan be very expensive to construct. The next type of wall tested was a design calledthe “Perfect Wall” borrowed from the Building ScienceCorporation [X]. This concept is easily understoodbecause it is almost exactly like a typical commercial roof where the exterior cladding, insulation, and vaporcontrol layers are all placed outside of the building structure. Figure 9 above shows the layers of this wallsystem. Because the rigid insulation is outside of the structure it can be installed continuously and thermalbridging is eliminated. Additionally, the building structure is protected from temperature fluctuations andexpansion and contraction are minimized. Air and water infiltration are negated by a 40 mil thick membranethat self-heals around penetrating fasteners.
Table 3 below shows all 5 of the constructions that were tested as well as their corresponding energyperformance and life-cycle costs:
Assembly U-Value
HeatingLoad @Boiler
kBtu/h MBtu/yr kWh/yr Initial50-Year Life
Cycle90.1 Baseline - 1" Slab Ins 0.145 599 1939 568127 $2,489,000 $5,535,125189.1 Minimum - 2" Slab Ins 0.078 534 1695 496635 $2,520,000 $5,186,5534" EPS Slab Insulation 0.041 493 1559 456787 $2,567,000 $5,021,9896" EPS Slab Insulation 0.028 479 1509 442137 $2,623,000 $5,000,2088" EPS Slab Insulation 0.017 473 1491 436863 $2,669,000 $5,018,206
Foundation Type
Total BuildingElectricity
Consumption Building Cost
Btu/ሺh · ftଶ ·Ԭሻ
Figure 9 Perfect Wall System by Building Science Corp
Page 11 of 34
Table 3 Life cycle costs of different wall systems
Simulations proved that the Perfect Wall System was going to have the best life cycle cost of those tested,so an additional simulation was done to test the thermal performance comparing the empty cavity in-between the wood studs and when the cavity is filled with cellulose insulation. Surprisingly, even thoughthe U-value of the wall system with the added cavity insulation was lower than that of the hollow cavitywall, the heating load was only cut by 9 kBtu/hr, which was not enough to justify the extra expense.
Another design parameter considered for the exterior walls was solar reflective index (SRI).Section 5.3.5.2 of 189.1 2014 requires shade on at least 30% of the west wall; however, there is anexception that allows for an SRI of at least 29 on both the east and west walls instead. Because of this,corrugated aluminum siding with an SRI of 56 was selected to meet these requirements as well as those inthe OPR’s that call for the building to be designed to resist long term degradation from nature.
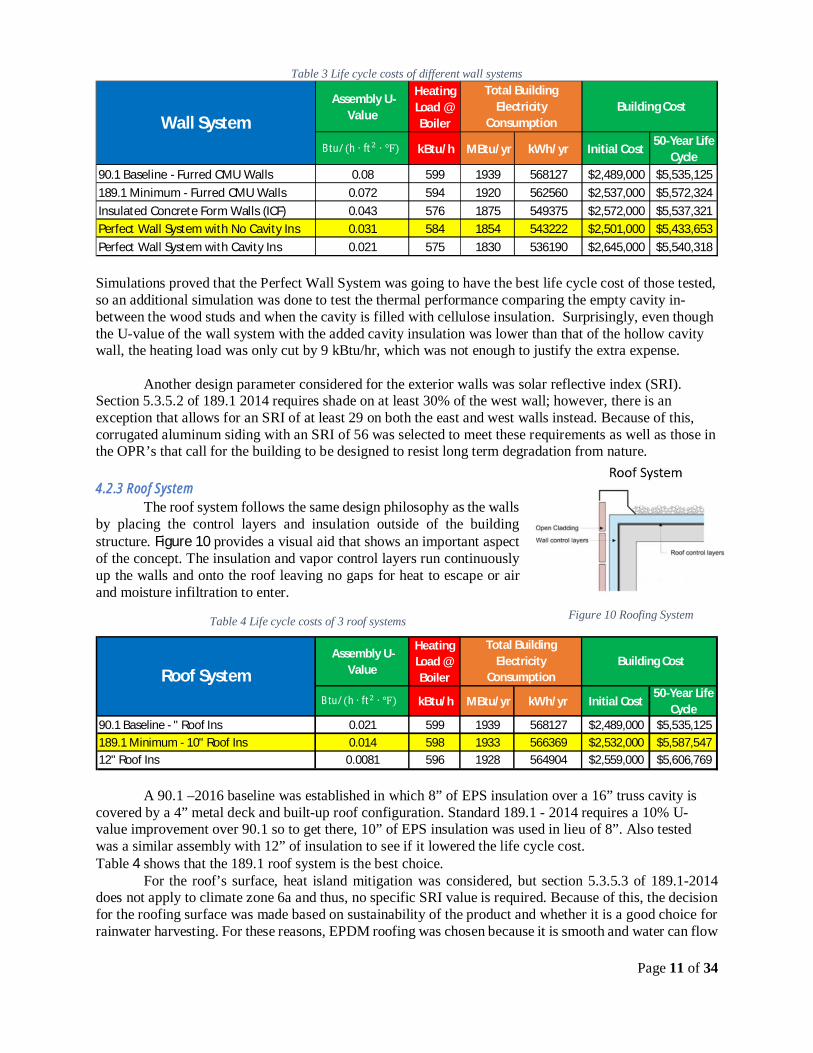
4.2.3 Roof System The roof system follows the same design philosophy as the wallsby placing the control layers and insulation outside of the buildingstructure. Figure 10 provides a visual aid that shows an important aspectof the concept. The insulation and vapor control layers run continuouslyup the walls and onto the roof leaving no gaps for heat to escape or airand moisture infiltration to enter.
Table 4 Life cycle costs of 3 roof systems
A 90.1 –2016 baseline was established in which 8” of EPS insulation over a 16” truss cavity iscovered by a 4” metal deck and built-up roof configuration. Standard 189.1 - 2014 requires a 10% U-value improvement over 90.1 so to get there, 10” of EPS insulation was used in lieu of 8”. Also testedwas a similar assembly with 12” of insulation to see if it lowered the life cycle cost.Table 4 shows that the 189.1 roof system is the best choice. For the roof’s surface, heat island mitigation was considered, but section 5.3.5.3 of 189.1-2014does not apply to climate zone 6a and thus, no specific SRI value is required. Because of this, the decisionfor the roofing surface was made based on sustainability of the product and whether it is a good choice forrainwater harvesting. For these reasons, EPDM roofing was chosen because it is smooth and water can flow
Assembly U-Value
HeatingLoad @Boiler
kBtu/h MBtu/yr kWh/yr Initial Cost50-Year Life
Cycle90.1 Baseline - Furred CMU Walls 0.08 599 1939 568127 $2,489,000 $5,535,125189.1 Minimum - Furred CMU Walls 0.072 594 1920 562560 $2,537,000 $5,572,324Insulated Concrete Form Walls (ICF) 0.043 576 1875 549375 $2,572,000 $5,537,321Perfect Wall System with No Cavity Ins 0.031 584 1854 543222 $2,501,000 $5,433,653Perfect Wall System with Cavity Ins 0.021 575 1830 536190 $2,645,000 $5,540,318
Wall System
Total BuildingElectricity
Consumption Building Cost
Btu/ሺh · ftଶ ·Ԭሻ
Assembly U-Value
HeatingLoad @Boiler
kBtu/h MBtu/yr kWh/yr Initial Cost50-Year Life
Cycle90.1 Baseline - " Roof Ins 0.021 599 1939 568127 $2,489,000 $5,535,125189.1 Minimum - 10" Roof Ins 0.014 598 1933 566369 $2,532,000 $5,587,54712" Roof Ins 0.0081 596 1928 564904 $2,559,000 $5,606,769
Roof System
Total BuildingElectricity
Consumption Building Cost
Btu/ሺh · ftଶ ·Ԭሻ
Figure 10 Roofing System
Page 12 of 34
well across it. It’s also one of the most sustainable types of roofing with low global warming impact, lowacid rain impact, and a 40-year life expectancy.
4.2.4 Fenestration The requirements of ASHRAE 189.1 – 2014 section 7.4.2 call for the orientation of verticalfenestration to satisfy Equation 1:
Equation 1:
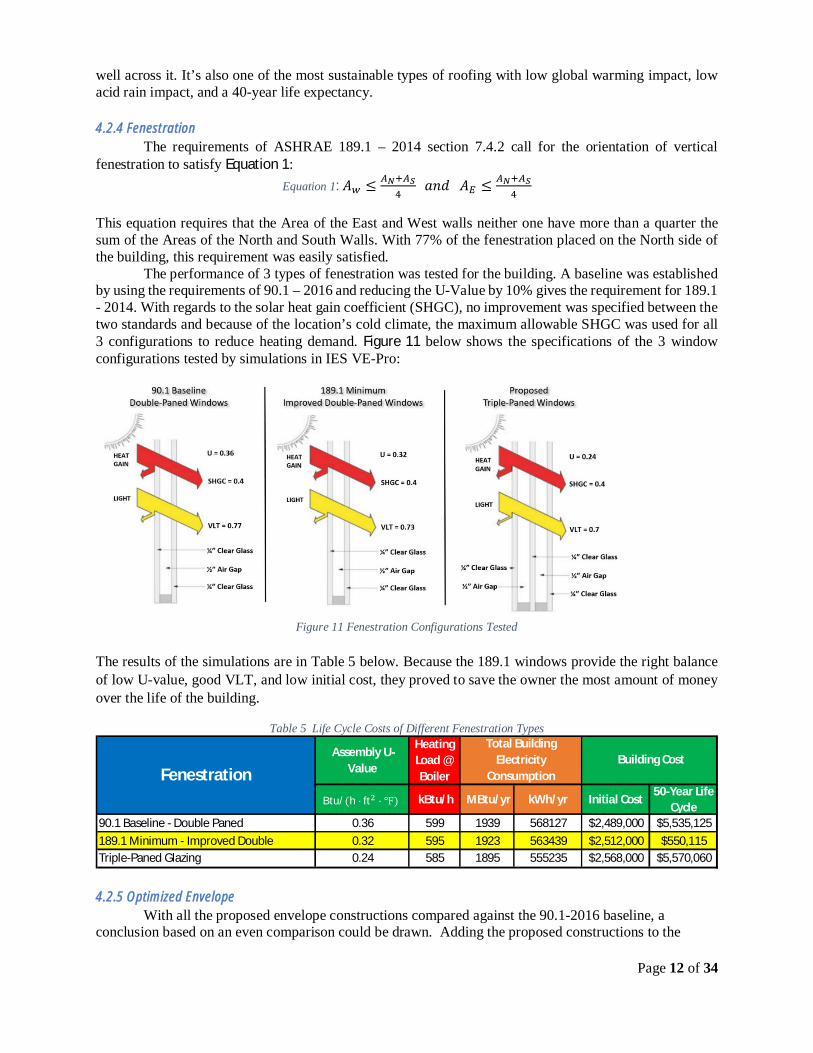
This equation requires that the Area of the East and West walls neither one have more than a quarter thesum of the Areas of the North and South Walls. With 77% of the fenestration placed on the North side ofthe building, this requirement was easily satisfied. The performance of 3 types of fenestration was tested for the building. A baseline was establishedby using the requirements of 90.1 – 2016 and reducing the U-Value by 10% gives the requirement for 189.1- 2014. With regards to the solar heat gain coefficient (SHGC), no improvement was specified between thetwo standards and because of the location’s cold climate, the maximum allowable SHGC was used for all3 configurations to reduce heating demand. Figure 11 below shows the specifications of the 3 windowconfigurations tested by simulations in IES VE-Pro:
The results of the simulations are in Table 5 below. Because the 189.1 windows provide the right balanceof low U-value, good VLT, and low initial cost, they proved to save the owner the most amount of moneyover the life of the building.
Table 5 Life Cycle Costs of Different Fenestration Types
4.2.5 Optimized EnvelopeWith all the proposed envelope constructions compared against the 90.1-2016 baseline, a
conclusion based on an even comparison could be drawn. Adding the proposed constructions to the
Assembly U-Value
HeatingLoad @Boiler
kBtu/h MBtu/yr kWh/yr Initial Cost50-Year Life
Cycle90.1 Baseline - Double Paned 0.36 599 1939 568127 $2,489,000 $5,535,125189.1 Minimum - Improved Double 0.32 595 1923 563439 $2,512,000 $550,115Triple-Paned Glazing 0.24 585 1895 555235 $2,568,000 $5,570,060
Fenestration
Total BuildingElectricity
Consumption Building Cost
Btu/ h · ft ·
Figure 11 Fenestration Configurations Tested
Page 13 of 34
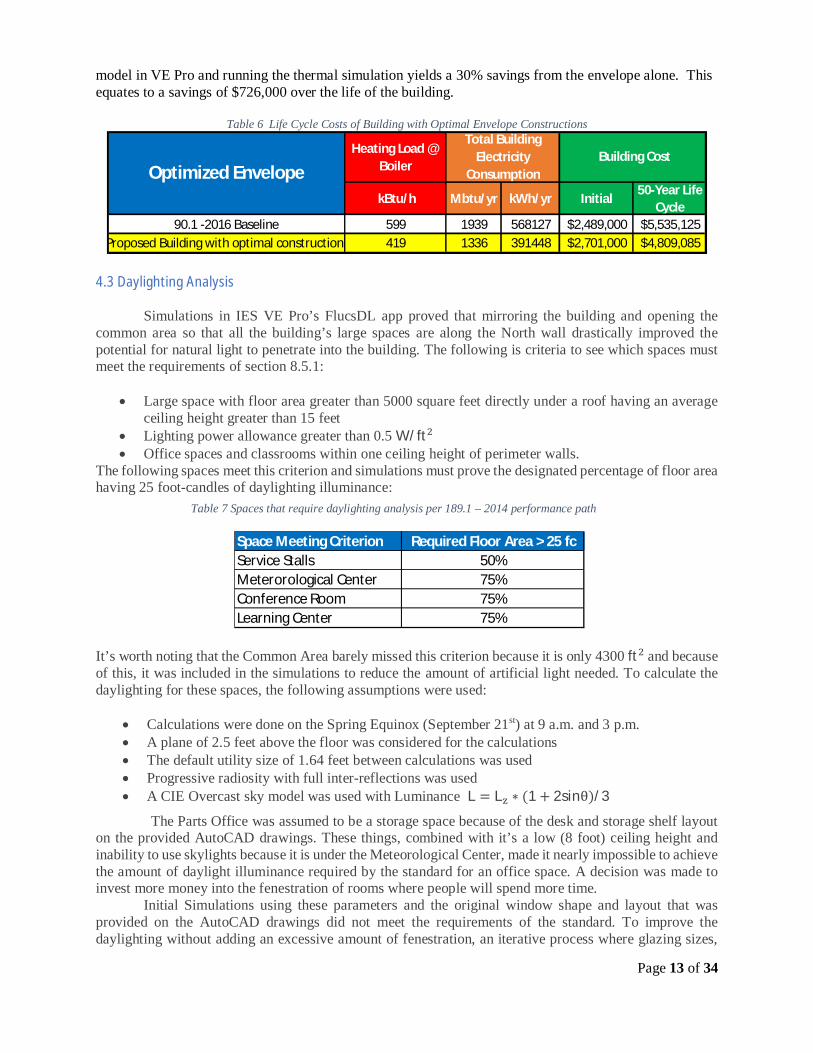
model in VE Pro and running the thermal simulation yields a 30% savings from the envelope alone. Thisequates to a savings of $726,000 over the life of the building.
Table 6 Life Cycle Costs of Building with Optimal Envelope Constructions
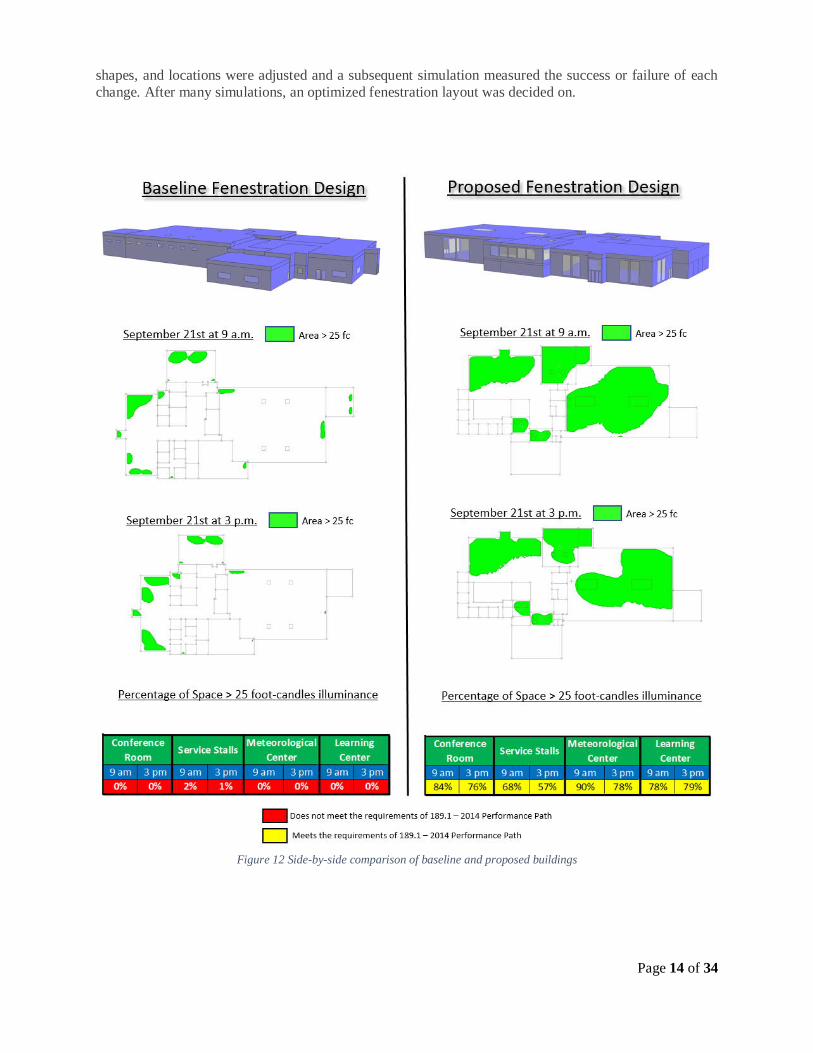
4.3 Daylighting Analysis
Simulations in IES VE Pro’s FlucsDL app proved that mirroring the building and opening thecommon area so that all the building’s large spaces are along the North wall drastically improved thepotential for natural light to penetrate into the building. The following is criteria to see which spaces mustmeet the requirements of section 8.5.1:
· Large space with floor area greater than 5000 square feet directly under a roof having an averageceiling height greater than 15 feet
· Lighting power allowance greater than 0.5 W/ft· Office spaces and classrooms within one ceiling height of perimeter walls.
The following spaces meet this criterion and simulations must prove the designated percentage of floor areahaving 25 foot-candles of daylighting illuminance:
It’s worth noting that the Common Area barely missed this criterion because it is only 4300 ft and becauseof this, it was included in the simulations to reduce the amount of artificial light needed. To calculate thedaylighting for these spaces, the following assumptions were used:
· Calculations were done on the Spring Equinox (September 21st) at 9 a.m. and 3 p.m.· A plane of 2.5 feet above the floor was considered for the calculations· The default utility size of 1.64 feet between calculations was used· Progressive radiosity with full inter-reflections was used· A CIE Overcast sky model was used with Luminance L L ∗ 1 2sinθ /3
The Parts Office was assumed to be a storage space because of the desk and storage shelf layouton the provided AutoCAD drawings. These things, combined with it’s a low (8 foot) ceiling height andinability to use skylights because it is under the Meteorological Center, made it nearly impossible to achievethe amount of daylight illuminance required by the standard for an office space. A decision was made toinvest more money into the fenestration of rooms where people will spend more time. Initial Simulations using these parameters and the original window shape and layout that wasprovided on the AutoCAD drawings did not meet the requirements of the standard. To improve thedaylighting without adding an excessive amount of fenestration, an iterative process where glazing sizes,
Heating Load @Boiler
kBtu/h Mbtu/yr kWh/yr Initial50-Year Life
Cycle90.1 -2016 Baseline 599 1939 568127 $2,489,000 $5,535,125
Proposed Building with optimal constructions 419 1336 391448 $2,701,000 $4,809,085
Optimized Envelope
Total BuildingElectricity
Consumption Building Cost
Table 7 Spaces that require daylighting analysis per 189.1 – 2014 performance path
Space Meeting Criterion Required Floor Area > 25 fcService Stalls 50%Meterorological Center 75%Conference Room 75%Learning Center 75%
Page 14 of 34
shapes, and locations were adjusted and a subsequent simulation measured the success or failure of eachchange. After many simulations, an optimized fenestration layout was decided on.
Figure 12 Side-by-side comparison of baseline and proposed buildings

Page 15 of 34
4.4 Shading
Exterior Shading is not required due to meeting the SRI requirements for the east and west walls;however, it was still considered as an architectural element of the building. The results from simulationsproved that the added aesthetics from louvered aluminum awnings were not worth the losses from themblocking daylight and solar heat gain. A better option for controlling the sunlight is inside the building.Because clear, high VLT glass was chosen to maximize the potential for naturaldaylighting, glare is a problem that was considered. The many computer screensin the meteorological station are placed on the side of the room opposite thewindows so that direct sun never hits them. Special skylights were chosen forthis area, as well as the conference room and the learning center where glarewould affect the comfort and productivity of occupants. These double-domedskylights diffuse incoming sunlight while still maintaining good VLT.Furthermore, a system for controlling glare that consists of motorized solarshades installed on all north and west fenestration will minimize its effect. Theseshades are made of a screen fabric that is available in varying openness levels.To maintain daylighting and visibility while reducing glare, shades with 14%openness are proposed. They will be integrated into the control system of the building and because theyare primarily for occupant comfort and quality of life, individual operation via a remote control will be anoption.
4.5 Interior lighting
The Building Area Method was used to determine the lighting power allowance for the building.From table 9.5.1 of ASHRAE 90.1-2016, the interior lighting power allowance is 11.5 kW. LED lights withwireless communications were selected for the interior rooms due to their energy efficiency and long life.Revit was used in the lighting analysis of the building. In the common areas and garages, Philips AranoLED suspended lights were used. Dormitories, offices, and learning spaces use Philips luxe space compacthigh efficacy lights. The Locker room and Parts office use Philips Smartform LED.
Figure 13 Example ofShading
Page 16 of 34
4.6 Exterior lighting
Lighting for the exterior of the building is controlled by occupancy and daylight sensors. Betweenmidnight and 6:00 a.m. all lighting in the building façade and landscape will be automatically shut off. Thesensors and control devices will be tested to ensure proper working condition. LED lights are used due totheir energy efficiency and durability. In the case of a power outage, all time switches will be capable ofretaining programming and time setting for a period of at least ten hours. The exterior lighting will meetthe calculated power allowance of 945 W in compliance with ASHRAE 90.1-2016 section 9.4.2. Allexterior lighting will be IDA certified to reduce light pollution.
4.7 HVAC System
All HVAC models were designed with IES VE-Pro-2016 in the ApacheHVAC module using thelibrary of performance rating method in accordance with ASHRAE 90.1-2010 Appendix G. IES VE-Prohas integrated all requirements and information from ASHRAE 90.1-2010 Appendix G such as meetingventilation requirements per ASHRAE 62.1 and thermal environmental conditions per ASHRAE 55.
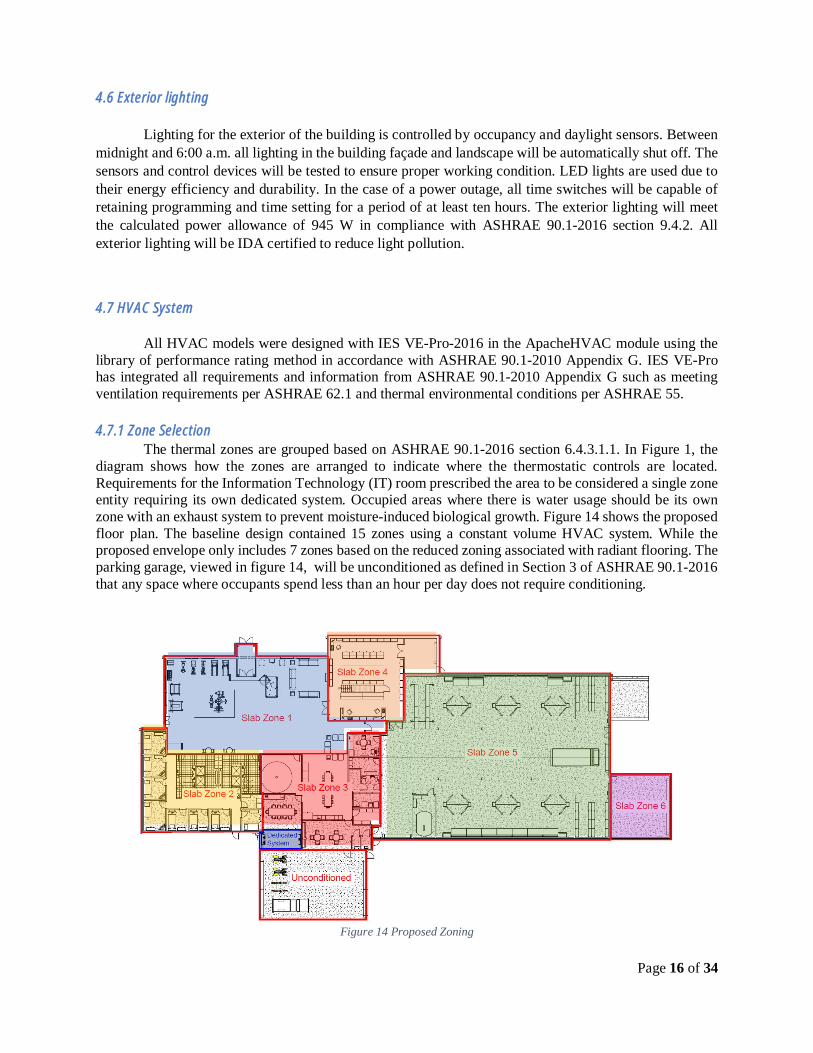
4.7.1 Zone SelectionThe thermal zones are grouped based on ASHRAE 90.1-2016 section 6.4.3.1.1. In Figure 1, the
diagram shows how the zones are arranged to indicate where the thermostatic controls are located.Requirements for the Information Technology (IT) room prescribed the area to be considered a single zoneentity requiring its own dedicated system. Occupied areas where there is water usage should be its ownzone with an exhaust system to prevent moisture-induced biological growth. Figure 14 shows the proposedfloor plan. The baseline design contained 15 zones using a constant volume HVAC system. While theproposed envelope only includes 7 zones based on the reduced zoning associated with radiant flooring. Theparking garage, viewed in figure 14, will be unconditioned as defined in Section 3 of ASHRAE 90.1-2016that any space where occupants spend less than an hour per day does not require conditioning.
Figure 14 Proposed Zoning
Page 17 of 34
4.7.2 Baseline System and AlternativeThe baseline building design system was determined using ASHRAE 189.1-2014 Appendix C1.1.5
which referenced ASHRAE 90.1-2016 Appendix G3.1.1. Based on the corresponding climate zone andpower source, the recommended system for our building type and size is built into IES VE-Pro. It is apackaged single zone heat pump (PSZ-HP). Specifications for this heat pump include DX cooling, air-to-air heat pump heating, and electric backup heating when required. A constant volume fan with relativehumidity control will only operate when outside air is required.
Section 8.3 of ASHRAE 189.1-2014 covers the mandatory provisions of air quality and ventilationbased on ASHRAE 62.1. The baseline ventilation analysis reported a low intake rate of the outside air of376 CFM. This value reflects the baseline system’s limited natural ventilation; the system mainly relies onthe recirculation of 7,915 CFM. For the proposed system, a Dedicated Outdoor Air System (DOAS) wasimplemented in the design and simulations revealed ventilation improvements and the Outside Air (OA)intake rate increased to 4,291 CFM.
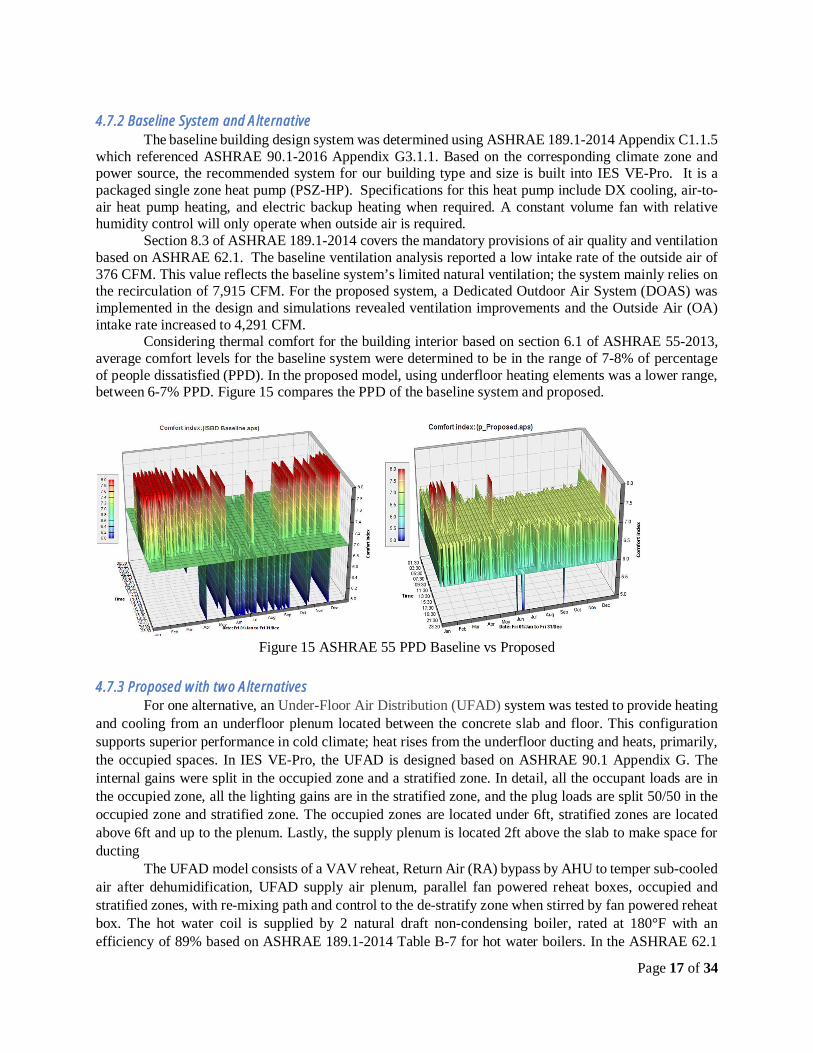
Considering thermal comfort for the building interior based on section 6.1 of ASHRAE 55-2013,average comfort levels for the baseline system were determined to be in the range of 7-8% of percentageof people dissatisfied (PPD). In the proposed model, using underfloor heating elements was a lower range,between 6-7% PPD. Figure 15 compares the PPD of the baseline system and proposed.
Figure 15 ASHRAE 55 PPD Baseline vs Proposed
4.7.3 Proposed with two AlternativesFor one alternative, an Under-Floor Air Distribution (UFAD) system was tested to provide heating
and cooling from an underfloor plenum located between the concrete slab and floor. This configurationsupports superior performance in cold climate; heat rises from the underfloor ducting and heats, primarily,the occupied spaces. In IES VE-Pro, the UFAD is designed based on ASHRAE 90.1 Appendix G. Theinternal gains were split in the occupied zone and a stratified zone. In detail, all the occupant loads are inthe occupied zone, all the lighting gains are in the stratified zone, and the plug loads are split 50/50 in theoccupied zone and stratified zone. The occupied zones are located under 6ft, stratified zones are locatedabove 6ft and up to the plenum. Lastly, the supply plenum is located 2ft above the slab to make space forducting The UFAD model consists of a VAV reheat, Return Air (RA) bypass by AHU to temper sub-cooledair after dehumidification, UFAD supply air plenum, parallel fan powered reheat boxes, occupied andstratified zones, with re-mixing path and control to the de-stratify zone when stirred by fan powered reheatbox. The hot water coil is supplied by 2 natural draft non-condensing boiler, rated at 180°F with anefficiency of 89% based on ASHRAE 189.1-2014 Table B-7 for hot water boilers. In the ASHRAE 62.1
Page 18 of 34
ventilation report the OA rate at intake is 5,852 CFM. Thus, the system resolved to bring in naturalventilation. Furthermore, ASHRAE 52.2-2017 table J-2 and 62.1-2016 section 6.2.1.2, was used todetermine a MERV 13 filter with a 10µm particle and 90% efficiency should be used to improve air quality.
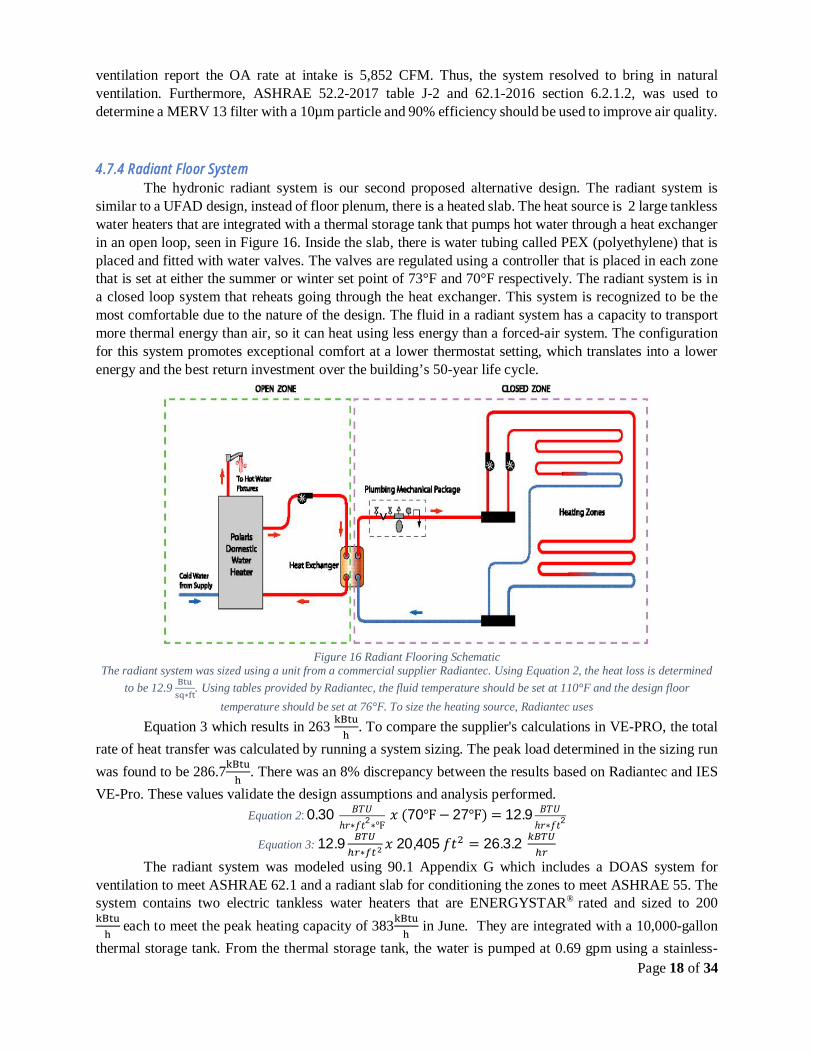
4.7.4 Radiant Floor SystemThe hydronic radiant system is our second proposed alternative design. The radiant system is
similar to a UFAD design, instead of floor plenum, there is a heated slab. The heat source is 2 large tanklesswater heaters that are integrated with a thermal storage tank that pumps hot water through a heat exchangerin an open loop, seen in Figure 16. Inside the slab, there is water tubing called PEX (polyethylene) that isplaced and fitted with water valves. The valves are regulated using a controller that is placed in each zonethat is set at either the summer or winter set point of 73°F and 70°F respectively. The radiant system is ina closed loop system that reheats going through the heat exchanger. This system is recognized to be themost comfortable due to the nature of the design. The fluid in a radiant system has a capacity to transportmore thermal energy than air, so it can heat using less energy than a forced-air system. The configurationfor this system promotes exceptional comfort at a lower thermostat setting, which translates into a lowerenergy and the best return investment over the building’s 50-year life cycle.
Figure 16 Radiant Flooring SchematicThe radiant system was sized using a unit from a commercial supplier Radiantec. Using Equation 2, the heat loss is determined
to be 12.9∗
. Using tables provided by Radiantec, the fluid temperature should be set at 110°F and the design floortemperature should be set at 76°F. To size the heating source, Radiantec uses
Equation 3 which results in 263 . To compare the supplier's calculations in VE-PRO, the totalrate of heat transfer was calculated by running a system sizing. The peak load determined in the sizing runwas found to be 286.7 . There was an 8% discrepancy between the results based on Radiantec and IESVE-Pro. These values validate the design assumptions and analysis performed.
Equation 2: 0.30∗ 2∗
70 27 12.9∗ 2
Equation 3: 12.9∗
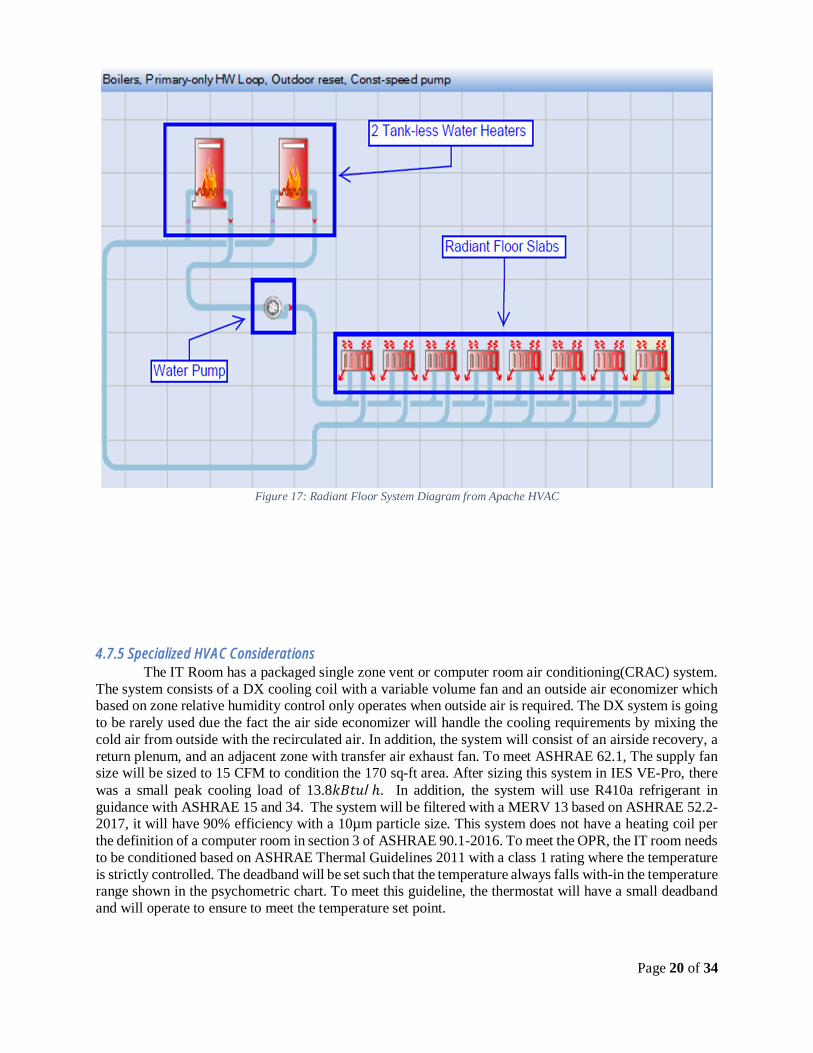
20,405 26.3.2The radiant system was modeled using 90.1 Appendix G which includes a DOAS system for
ventilation to meet ASHRAE 62.1 and a radiant slab for conditioning the zones to meet ASHRAE 55. Thesystem contains two electric tankless water heaters that are ENERGYSTAR® rated and sized to 200
each to meet the peak heating capacity of 383 in June. They are integrated with a 10,000-gallonthermal storage tank. From the thermal storage tank, the water is pumped at 0.69 gpm using a stainless-
Page 19 of 34
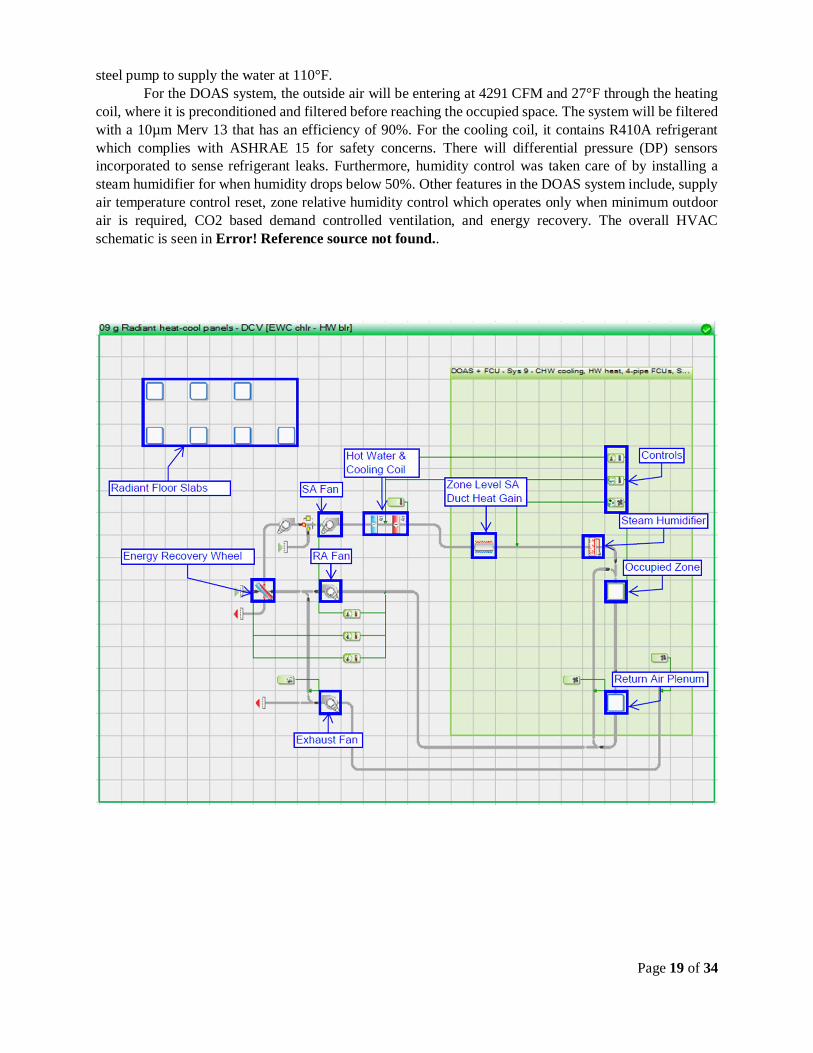
steel pump to supply the water at 110°F.For the DOAS system, the outside air will be entering at 4291 CFM and 27°F through the heating
coil, where it is preconditioned and filtered before reaching the occupied space. The system will be filteredwith a 10µm Merv 13 that has an efficiency of 90%. For the cooling coil, it contains R410A refrigerantwhich complies with ASHRAE 15 for safety concerns. There will differential pressure (DP) sensorsincorporated to sense refrigerant leaks. Furthermore, humidity control was taken care of by installing asteam humidifier for when humidity drops below 50%. Other features in the DOAS system include, supplyair temperature control reset, zone relative humidity control which operates only when minimum outdoorair is required, CO2 based demand controlled ventilation, and energy recovery. The overall HVACschematic is seen in Error! Reference source not found..
Page 20 of 34
Figure 17: Radiant Floor System Diagram from Apache HVAC
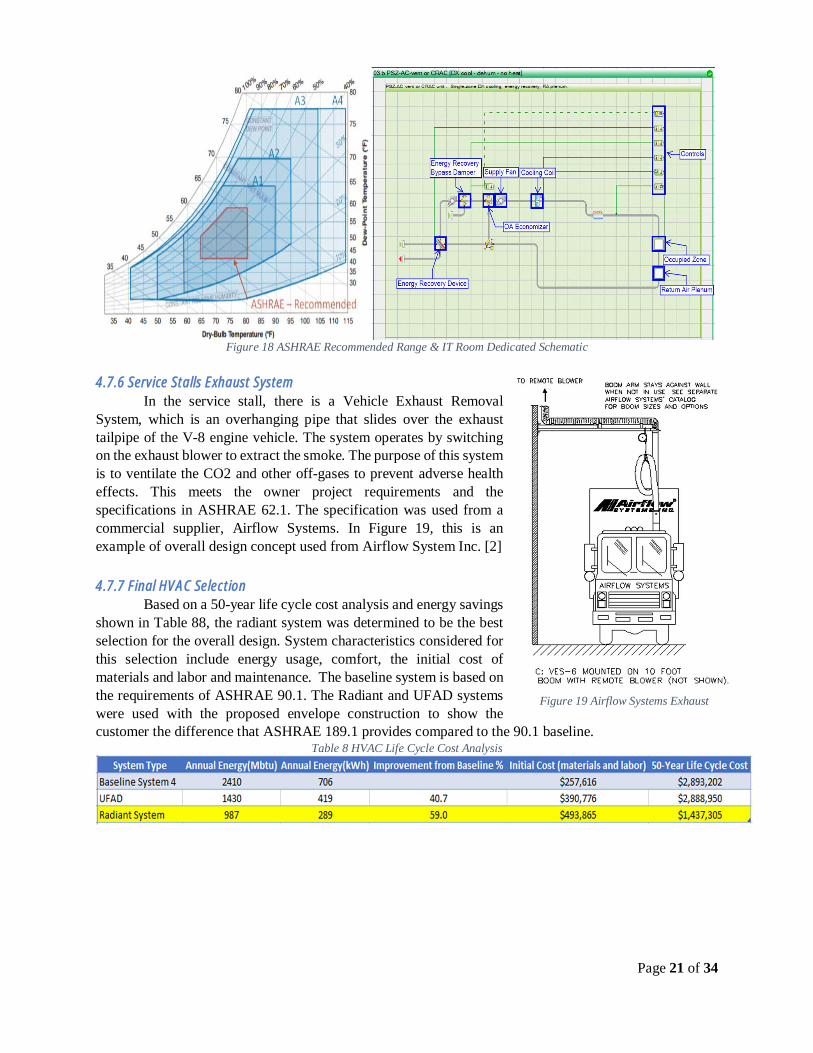
4.7.5 Specialized HVAC ConsiderationsThe IT Room has a packaged single zone vent or computer room air conditioning(CRAC) system.
The system consists of a DX cooling coil with a variable volume fan and an outside air economizer whichbased on zone relative humidity control only operates when outside air is required. The DX system is goingto be rarely used due the fact the air side economizer will handle the cooling requirements by mixing thecold air from outside with the recirculated air. In addition, the system will consist of an airside recovery, areturn plenum, and an adjacent zone with transfer air exhaust fan. To meet ASHRAE 62.1, The supply fansize will be sized to 15 CFM to condition the 170 sq-ft area. After sizing this system in IES VE-Pro, therewas a small peak cooling load of 13.8 / . In addition, the system will use R410a refrigerant inguidance with ASHRAE 15 and 34. The system will be filtered with a MERV 13 based on ASHRAE 52.2-2017, it will have 90% efficiency with a 10µm particle size. This system does not have a heating coil perthe definition of a computer room in section 3 of ASHRAE 90.1-2016. To meet the OPR, the IT room needsto be conditioned based on ASHRAE Thermal Guidelines 2011 with a class 1 rating where the temperatureis strictly controlled. The deadband will be set such that the temperature always falls with-in the temperaturerange shown in the psychometric chart. To meet this guideline, the thermostat will have a small deadbandand will operate to ensure to meet the temperature set point.
Page 21 of 34
Figure 18 ASHRAE Recommended Range & IT Room Dedicated Schematic
4.7.6 Service Stalls Exhaust SystemIn the service stall, there is a Vehicle Exhaust Removal
System, which is an overhanging pipe that slides over the exhausttailpipe of the V-8 engine vehicle. The system operates by switchingon the exhaust blower to extract the smoke. The purpose of this systemis to ventilate the CO2 and other off-gases to prevent adverse healtheffects. This meets the owner project requirements and thespecifications in ASHRAE 62.1. The specification was used from acommercial supplier, Airflow Systems. In Figure 19, this is anexample of overall design concept used from Airflow System Inc. [2]
4.7.7 Final HVAC SelectionBased on a 50-year life cycle cost analysis and energy savings
shown in Table 88, the radiant system was determined to be the bestselection for the overall design. System characteristics considered forthis selection include energy usage, comfort, the initial cost ofmaterials and labor and maintenance. The baseline system is based onthe requirements of ASHRAE 90.1. The Radiant and UFAD systemswere used with the proposed envelope construction to show thecustomer the difference that ASHRAE 189.1 provides compared to the 90.1 baseline.
Table 8 HVAC Life Cycle Cost Analysis
Figure 19 Airflow Systems Exhaust
Page 22 of 34
4.8 Plumbing System
4.8.1 Water use Efficiency
4.8.1.1 Customer RequirementsThe baseline water consumption will be compared with the proposed system to gauge how effective
the design is. Per the customer requirement, the water consumption must be reduced by 30% from thebaseline per the Energy Policy Act of 1992. This act mandated the Low Flush Toilets Clause which prohibitsthe use of toilets that use more than 1.6 gallons of water per flush. Additional plumbing fixtures, such asurinals, faucets, and shower heads will be changed out accordingly to save even more water.ENERGYSTAR® appliances and water sense plumbing products will be used to further decrease water useand to meet ASHRAE 189.1-2014 section 6.3.2 (Water use reduction).
Per ASHRAE 189.1-2014 section 6.3.3, a dedicated water consumption management device suchas a JLR water meter will be installed to track positive pressure water flow in the building. This device willallow potable and reclaimed water to be monitored. It also has wireless communication capability for datacollection purposes. This device will provide a water usage report discernible to the day, notifyingoperations if water usage complies with the Water User Efficiency Plan for Operation in ASHRAE 189.1-2014 section 10.3.2.1.2.
4.8.1.2 Baseline Plumbing Fixtures Consumption The baseline water consumption will be approximated using the following table as provided byASHRAE 189.1-2014.
Figure 20 Plumbing Fixtures and Fittings Requirements per ASHRAE 189.1-2014
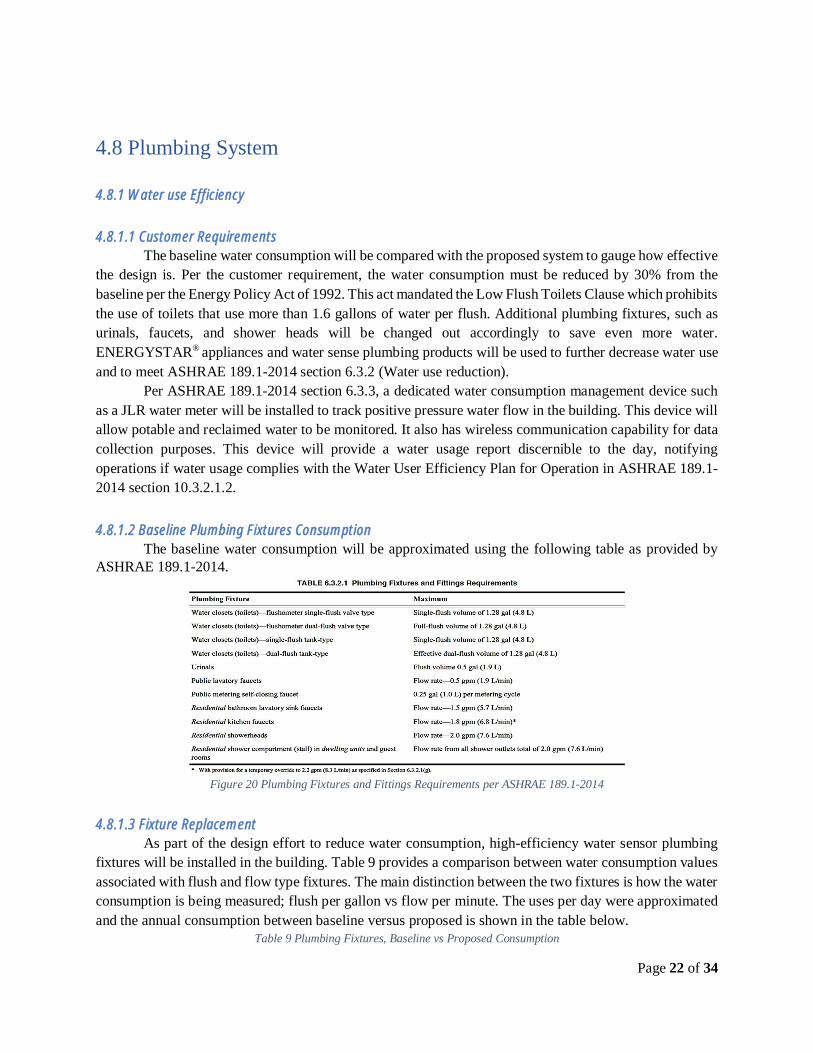
4.8.1.3 Fixture ReplacementAs part of the design effort to reduce water consumption, high-efficiency water sensor plumbing
fixtures will be installed in the building. Table 9 provides a comparison between water consumption valuesassociated with flush and flow type fixtures. The main distinction between the two fixtures is how the waterconsumption is being measured; flush per gallon vs flow per minute. The uses per day were approximatedand the annual consumption between baseline versus proposed is shown in the table below.
Table 9 Plumbing Fixtures, Baseline vs Proposed Consumption
Page 23 of 34
Once all the baseline fixtures are replaced with the proposed fixtures, the total amount of saving can beseen in Table 10 which summarizes the annual flushing, flow and annual consumption. The total plumbingfixtures water reduction is calculated to be 56.8%.
Table 10 Total Consumption Comparison
4.8.2 Service hot water systems
4.8.2.1 Customer RequirementThe OPR stated that the building shall be analyzed to see if solar hot water is an economic benefit
to the owner. The baseline solar hot water systems were designed in accordance to ASHRAE 90.1-2016and 189.1-2014. IES VE pro was used to run the simulation for the solar water heater. The solar watersystem was ineffective due to the lack of sun solar radiance in the climate. Furthermore, the life cycleanalysis of the system shows that this would be a bad investment due to the extra heating equipment that isneeded to increase the water’s temperature to a suitable temperature.
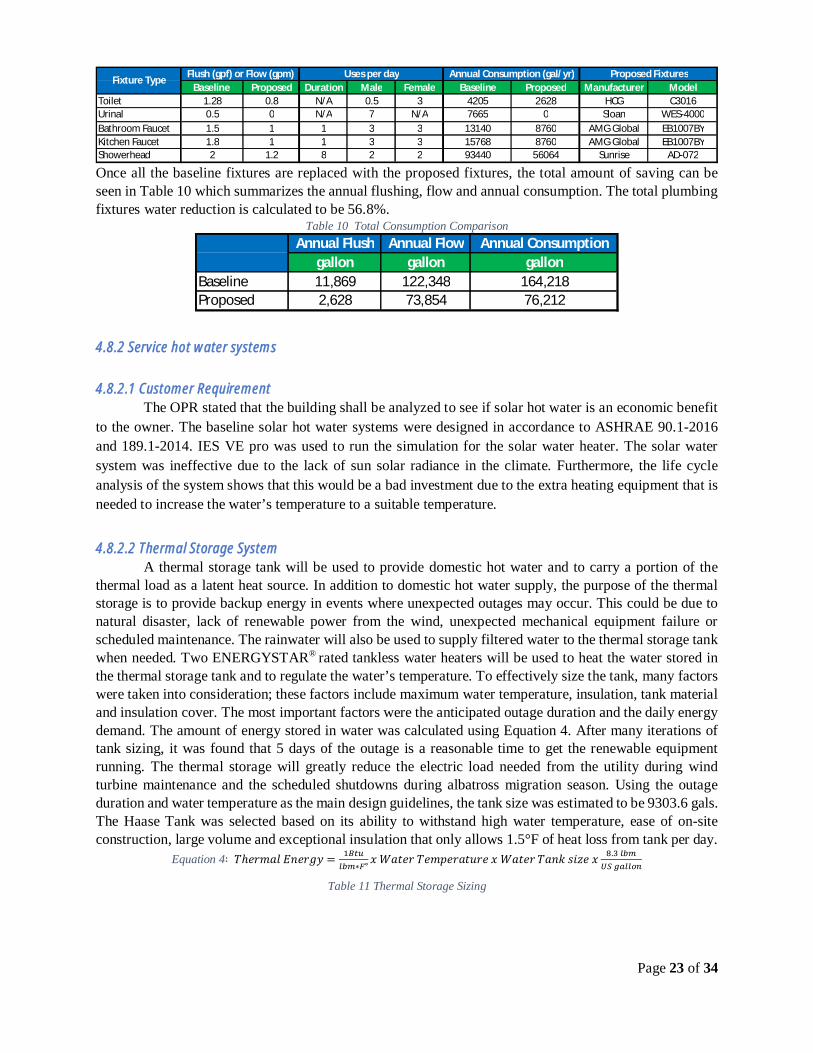
4.8.2.2 Thermal Storage System A thermal storage tank will be used to provide domestic hot water and to carry a portion of thethermal load as a latent heat source. In addition to domestic hot water supply, the purpose of the thermalstorage is to provide backup energy in events where unexpected outages may occur. This could be due tonatural disaster, lack of renewable power from the wind, unexpected mechanical equipment failure orscheduled maintenance. The rainwater will also be used to supply filtered water to the thermal storage tankwhen needed. Two ENERGYSTAR® rated tankless water heaters will be used to heat the water stored inthe thermal storage tank and to regulate the water’s temperature. To effectively size the tank, many factorswere taken into consideration; these factors include maximum water temperature, insulation, tank materialand insulation cover. The most important factors were the anticipated outage duration and the daily energydemand. The amount of energy stored in water was calculated using Equation 4. After many iterations oftank sizing, it was found that 5 days of the outage is a reasonable time to get the renewable equipmentrunning. The thermal storage will greatly reduce the electric load needed from the utility during windturbine maintenance and the scheduled shutdowns during albatross migration season. Using the outageduration and water temperature as the main design guidelines, the tank size was estimated to be 9303.6 gals.The Haase Tank was selected based on its ability to withstand high water temperature, ease of on-siteconstruction, large volume and exceptional insulation that only allows 1.5°F of heat loss from tank per day.
Equation 4∶∗ °
.
Table 11 Thermal Storage Sizing
Baseline Proposed Duration Male Female Baseline Proposed Manufacturer ModelToilet 1.28 0.8 N/A 0.5 3 4205 2628 HCG C3016Urinal 0.5 0 N/A 7 N/A 7665 0 Sloan WES-4000Bathroom Faucet 1.5 1 1 3 3 13140 8760 AMG Global EB1007BYKitchen Faucet 1.8 1 1 3 3 15768 8760 AMG Global EB1007BYShowerhead 2 1.2 8 2 2 93440 56064 Sunrise AD-072
Flush (gpf) or Flow (gpm)Fixture Type Uses per day Annual Consumption (gal/yr) Proposed Fixtures
Annual Flush Annual Flow Annual Consumptiongallon gallon gallon
Baseline 11,869 122,348 164,218Proposed 2,628 73,854 76,212
Page 24 of 34
4.8.3 Fire SuppressionUpon reviewing the Internal Code Council (ICC) fire-flow requirement, withdrawing water from
the utility service was determined to be the best option for fire suppression. The ICC identified themeteorological station as a type IA building with a requirement of 1,500 GPM of water for 2 hours toeffectively extinguish a fire. It is impractical to store 180,000 gallons of water. Therefore, the best solutionfor fire suppression system is to pull the water from the utility service available on the island in case of anyemergency.
4.8.4 Rainwater Harvesting
4.8.4.1 Rainwater ApproximationTo further reduce the amount of water usage in the facility, a rainwater harvest system will be
implemented to reap the benefits of the monthly rainfall The additional rainwater harvest will satisfyASHRAE 189.1-2014 section 6.5, performance option.
The average precipitation for the is 4.49 in/yr and the area under the roof is 21,682 square feet.[3] The amount of collected rainfall can be calculated with Equation 5, assuming the efficiency of rainwaterharvesting is 75%. Using the data of rainfall in 2016, it was approximated that the daily probability ofprecipitation is 76%. Thus, the actual daily volume is approximately 1147 gallons per day.
Equation 5: .62∗
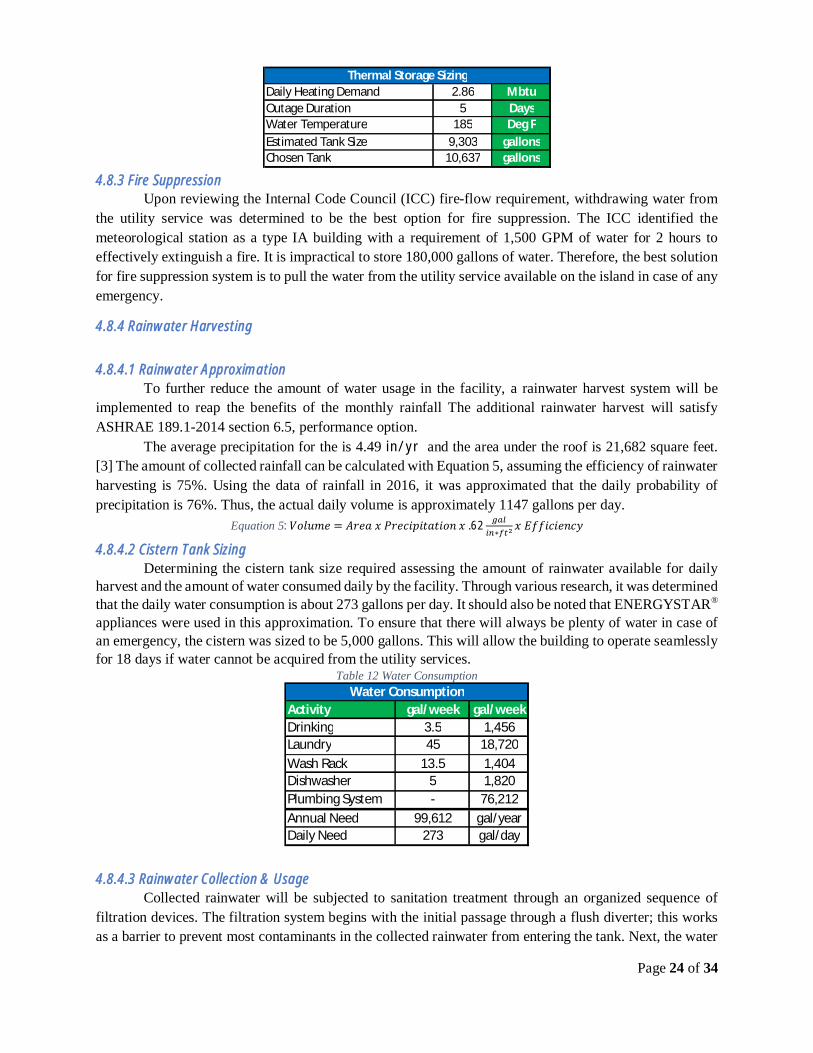
4.8.4.2 Cistern Tank Sizing Determining the cistern tank size required assessing the amount of rainwater available for dailyharvest and the amount of water consumed daily by the facility. Through various research, it was determinedthat the daily water consumption is about 273 gallons per day. It should also be noted that ENERGYSTAR®
appliances were used in this approximation. To ensure that there will always be plenty of water in case ofan emergency, the cistern was sized to be 5,000 gallons. This will allow the building to operate seamlesslyfor 18 days if water cannot be acquired from the utility services.
Table 12 Water Consumption
4.8.4.3 Rainwater Collection & UsageCollected rainwater will be subjected to sanitation treatment through an organized sequence of
filtration devices. The filtration system begins with the initial passage through a flush diverter; this worksas a barrier to prevent most contaminants in the collected rainwater from entering the tank. Next, the water
Daily Heating Demand 2.86 MbtuOutage Duration 5 DaysWater Temperature 185 Deg FEstimated Tank Size 9,303 gallonsChosen Tank 10,637 gallons
Thermal Storage Sizing
Activity gal/week gal/weekDrinking 3.5 1,456Laundry 45 18,720Wash Rack 13.5 1,404Dishwasher 5 1,820Plumbing System - 76,212Annual Need 99,612 gal/yearDaily Need 273 gal/day
Water Consumption
Page 25 of 34
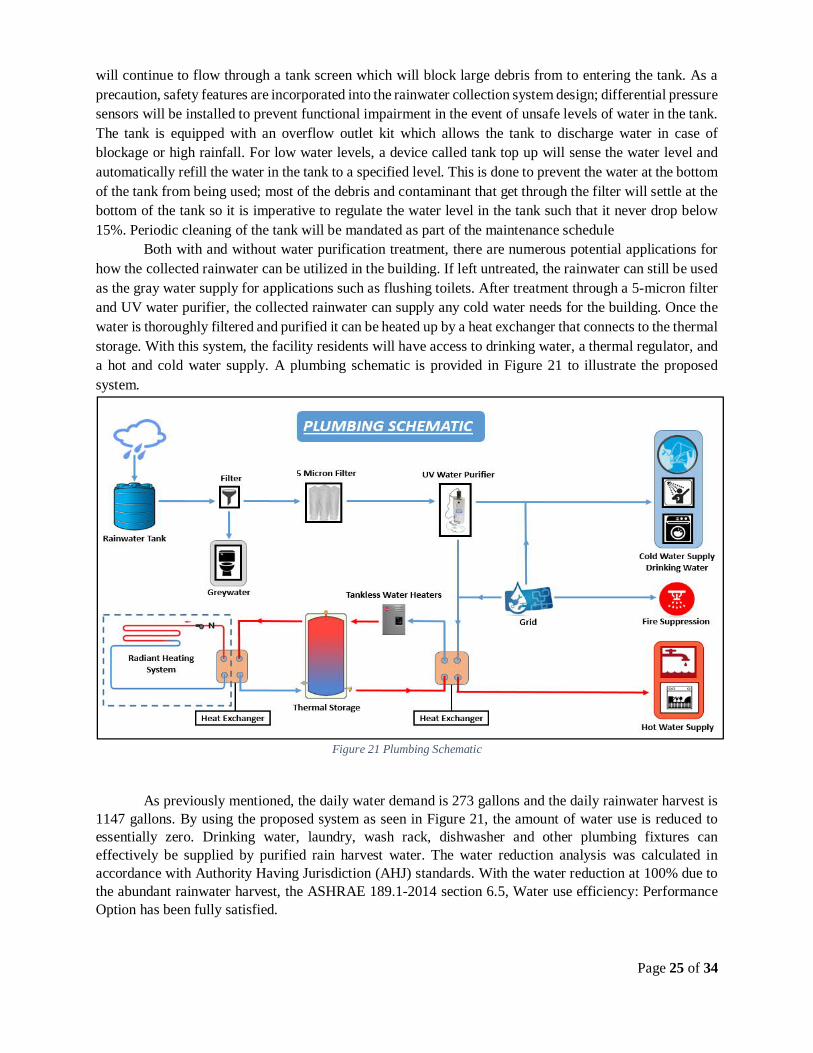
will continue to flow through a tank screen which will block large debris from to entering the tank. As aprecaution, safety features are incorporated into the rainwater collection system design; differential pressuresensors will be installed to prevent functional impairment in the event of unsafe levels of water in the tank.The tank is equipped with an overflow outlet kit which allows the tank to discharge water in case ofblockage or high rainfall. For low water levels, a device called tank top up will sense the water level andautomatically refill the water in the tank to a specified level. This is done to prevent the water at the bottomof the tank from being used; most of the debris and contaminant that get through the filter will settle at thebottom of the tank so it is imperative to regulate the water level in the tank such that it never drop below15%. Periodic cleaning of the tank will be mandated as part of the maintenance schedule Both with and without water purification treatment, there are numerous potential applications forhow the collected rainwater can be utilized in the building. If left untreated, the rainwater can still be usedas the gray water supply for applications such as flushing toilets. After treatment through a 5-micron filterand UV water purifier, the collected rainwater can supply any cold water needs for the building. Once thewater is thoroughly filtered and purified it can be heated up by a heat exchanger that connects to the thermalstorage. With this system, the facility residents will have access to drinking water, a thermal regulator, anda hot and cold water supply. A plumbing schematic is provided in Figure 21 to illustrate the proposedsystem.
Figure 21 Plumbing Schematic
As previously mentioned, the daily water demand is 273 gallons and the daily rainwater harvest is1147 gallons. By using the proposed system as seen in Figure 21, the amount of water use is reduced toessentially zero. Drinking water, laundry, wash rack, dishwasher and other plumbing fixtures caneffectively be supplied by purified rain harvest water. The water reduction analysis was calculated inaccordance with Authority Having Jurisdiction (AHJ) standards. With the water reduction at 100% due tothe abundant rainwater harvest, the ASHRAE 189.1-2014 section 6.5, Water use efficiency: PerformanceOption has been fully satisfied.
Page 26 of 34
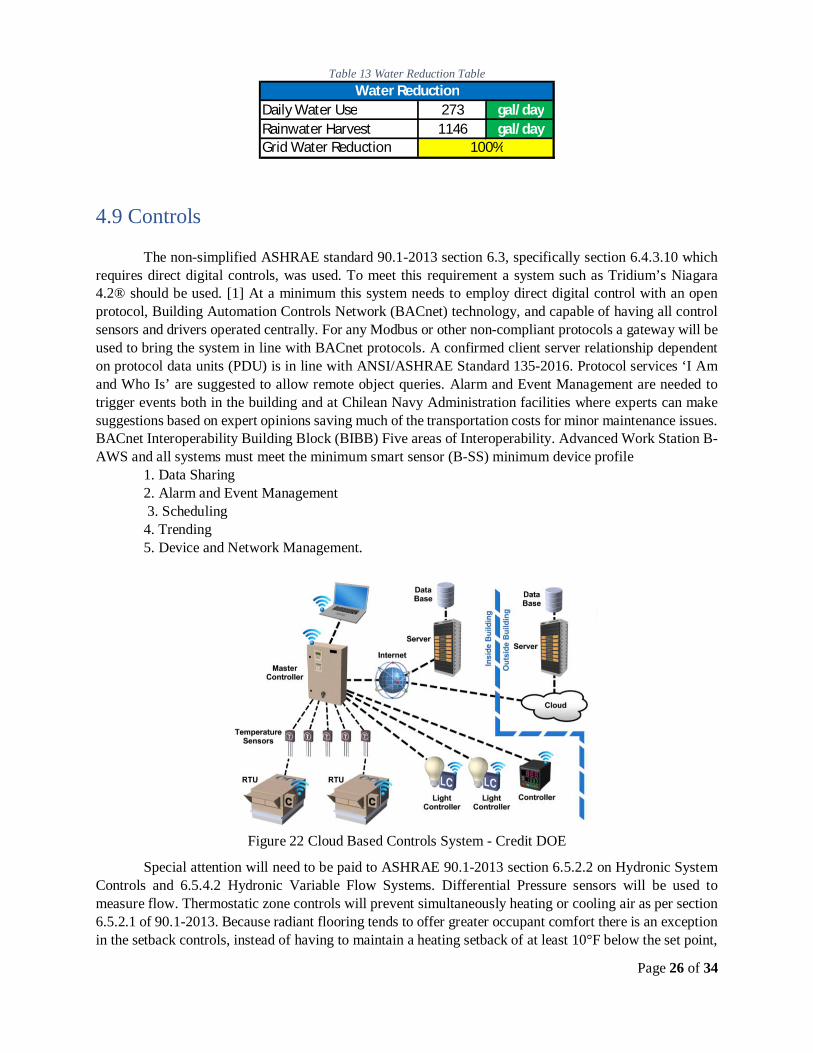
Table 13 Water Reduction Table
4.9 Controls
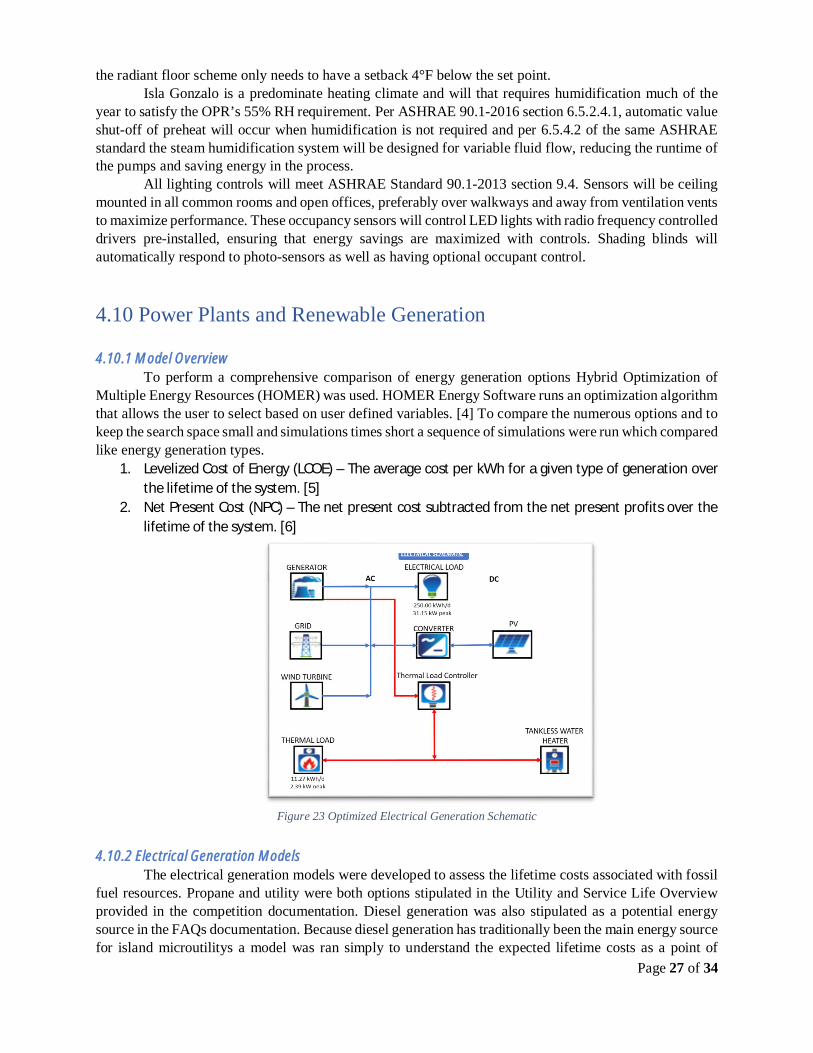
The non-simplified ASHRAE standard 90.1-2013 section 6.3, specifically section 6.4.3.10 whichrequires direct digital controls, was used. To meet this requirement a system such as Tridium’s Niagara4.2® should be used. [1] At a minimum this system needs to employ direct digital control with an openprotocol, Building Automation Controls Network (BACnet) technology, and capable of having all controlsensors and drivers operated centrally. For any Modbus or other non-compliant protocols a gateway will beused to bring the system in line with BACnet protocols. A confirmed client server relationship dependenton protocol data units (PDU) is in line with ANSI/ASHRAE Standard 135-2016. Protocol services ‘I Amand Who Is’ are suggested to allow remote object queries. Alarm and Event Management are needed totrigger events both in the building and at Chilean Navy Administration facilities where experts can makesuggestions based on expert opinions saving much of the transportation costs for minor maintenance issues.BACnet Interoperability Building Block (BIBB) Five areas of Interoperability. Advanced Work Station B-AWS and all systems must meet the minimum smart sensor (B-SS) minimum device profile
1. Data Sharing2. Alarm and Event Management 3. Scheduling4. Trending5. Device and Network Management.
Figure 22 Cloud Based Controls System - Credit DOE
Special attention will need to be paid to ASHRAE 90.1-2013 section 6.5.2.2 on Hydronic SystemControls and 6.5.4.2 Hydronic Variable Flow Systems. Differential Pressure sensors will be used tomeasure flow. Thermostatic zone controls will prevent simultaneously heating or cooling air as per section6.5.2.1 of 90.1-2013. Because radiant flooring tends to offer greater occupant comfort there is an exceptionin the setback controls, instead of having to maintain a heating setback of at least 10°F below the set point,
Daily Water Use 273 gal/dayRainwater Harvest 1146 gal/dayGrid Water Reduction
Water Reduction
100%
Page 27 of 34
the radiant floor scheme only needs to have a setback 4°F below the set point. Isla Gonzalo is a predominate heating climate and will that requires humidification much of theyear to satisfy the OPR’s 55% RH requirement. Per ASHRAE 90.1-2016 section 6.5.2.4.1, automatic valueshut-off of preheat will occur when humidification is not required and per 6.5.4.2 of the same ASHRAEstandard the steam humidification system will be designed for variable fluid flow, reducing the runtime ofthe pumps and saving energy in the process. All lighting controls will meet ASHRAE Standard 90.1-2013 section 9.4. Sensors will be ceilingmounted in all common rooms and open offices, preferably over walkways and away from ventilation ventsto maximize performance. These occupancy sensors will control LED lights with radio frequency controlleddrivers pre-installed, ensuring that energy savings are maximized with controls. Shading blinds willautomatically respond to photo-sensors as well as having optional occupant control.
4.10 Power Plants and Renewable Generation
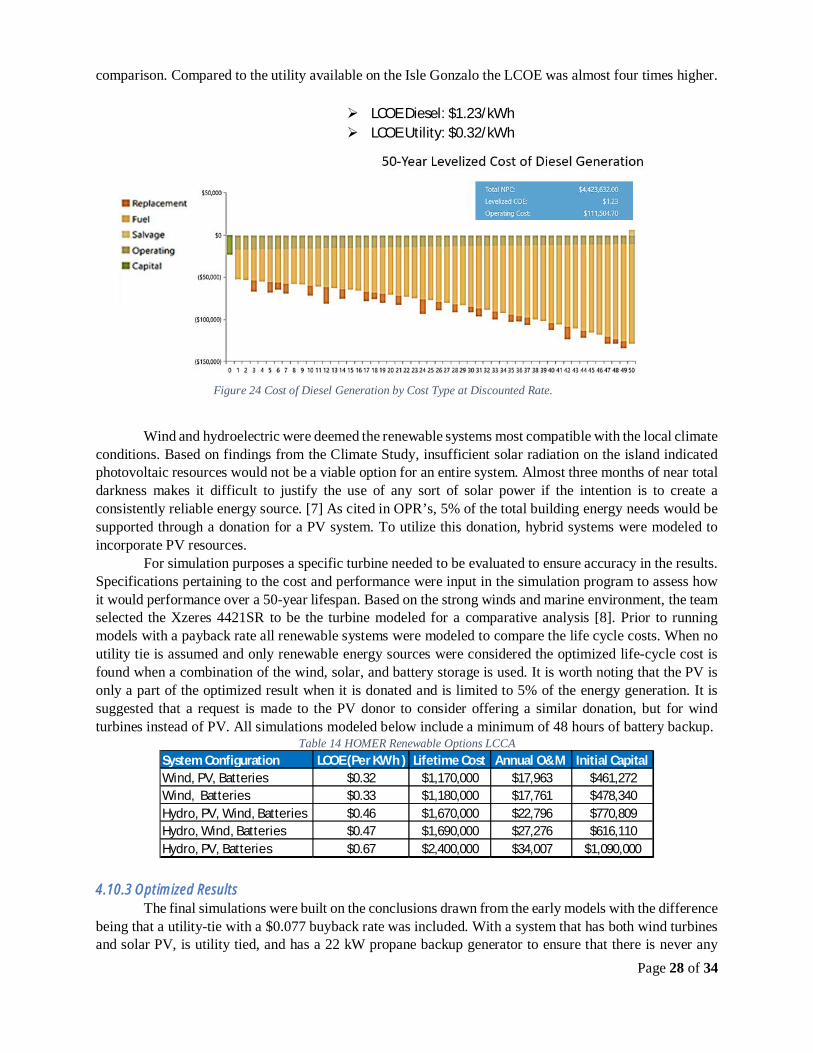
4.10.1 Model OverviewTo perform a comprehensive comparison of energy generation options Hybrid Optimization of
Multiple Energy Resources (HOMER) was used. HOMER Energy Software runs an optimization algorithmthat allows the user to select based on user defined variables. [4] To compare the numerous options and tokeep the search space small and simulations times short a sequence of simulations were run which comparedlike energy generation types.
1. Levelized Cost of Energy (LCOE) – The average cost per kWh for a given type of generation overthe lifetime of the system. [5]
2. Net Present Cost (NPC) – The net present cost subtracted from the net present profits over thelifetime of the system. [6]
Figure 23 Optimized Electrical Generation Schematic
4.10.2 Electrical Generation Models The electrical generation models were developed to assess the lifetime costs associated with fossilfuel resources. Propane and utility were both options stipulated in the Utility and Service Life Overviewprovided in the competition documentation. Diesel generation was also stipulated as a potential energysource in the FAQs documentation. Because diesel generation has traditionally been the main energy sourcefor island microutilitys a model was ran simply to understand the expected lifetime costs as a point of
Page 28 of 34
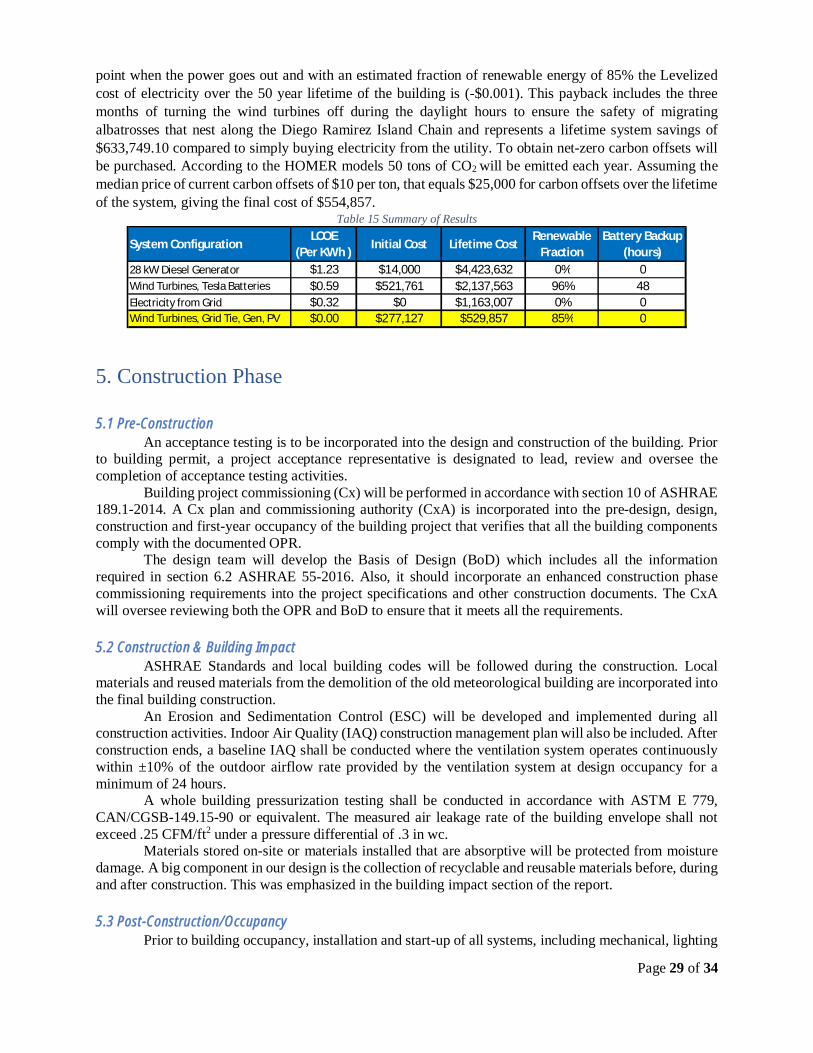
comparison. Compared to the utility available on the Isle Gonzalo the LCOE was almost four times higher.
Ø LCOE Diesel: $1.23/kWhØ LCOE Utility: $0.32/kWh
Wind and hydroelectric were deemed the renewable systems most compatible with the local climateconditions. Based on findings from the Climate Study, insufficient solar radiation on the island indicatedphotovoltaic resources would not be a viable option for an entire system. Almost three months of near totaldarkness makes it difficult to justify the use of any sort of solar power if the intention is to create aconsistently reliable energy source. [7] As cited in OPR’s, 5% of the total building energy needs would besupported through a donation for a PV system. To utilize this donation, hybrid systems were modeled toincorporate PV resources.
For simulation purposes a specific turbine needed to be evaluated to ensure accuracy in the results.Specifications pertaining to the cost and performance were input in the simulation program to assess howit would performance over a 50-year lifespan. Based on the strong winds and marine environment, the teamselected the Xzeres 4421SR to be the turbine modeled for a comparative analysis [8]. Prior to runningmodels with a payback rate all renewable systems were modeled to compare the life cycle costs. When noutility tie is assumed and only renewable energy sources were considered the optimized life-cycle cost isfound when a combination of the wind, solar, and battery storage is used. It is worth noting that the PV isonly a part of the optimized result when it is donated and is limited to 5% of the energy generation. It issuggested that a request is made to the PV donor to consider offering a similar donation, but for windturbines instead of PV. All simulations modeled below include a minimum of 48 hours of battery backup.
Table 14 HOMER Renewable Options LCCA
4.10.3 Optimized Results The final simulations were built on the conclusions drawn from the early models with the differencebeing that a utility-tie with a $0.077 buyback rate was included. With a system that has both wind turbinesand solar PV, is utility tied, and has a 22 kW propane backup generator to ensure that there is never any
System Configuration LCOE (Per KWh ) Lifetime Cost Annual O&M Initial CapitalWind, PV, Batteries $0.32 $1,170,000 $17,963 $461,272Wind, Batteries $0.33 $1,180,000 $17,761 $478,340Hydro, PV, Wind, Batteries $0.46 $1,670,000 $22,796 $770,809Hydro, Wind, Batteries $0.47 $1,690,000 $27,276 $616,110Hydro, PV, Batteries $0.67 $2,400,000 $34,007 $1,090,000
Figure 24 Cost of Diesel Generation by Cost Type at Discounted Rate.
Page 29 of 34
point when the power goes out and with an estimated fraction of renewable energy of 85% the Levelizedcost of electricity over the 50 year lifetime of the building is (-$0.001). This payback includes the threemonths of turning the wind turbines off during the daylight hours to ensure the safety of migratingalbatrosses that nest along the Diego Ramirez Island Chain and represents a lifetime system savings of$633,749.10 compared to simply buying electricity from the utility. To obtain net-zero carbon offsets willbe purchased. According to the HOMER models 50 tons of CO2 will be emitted each year. Assuming themedian price of current carbon offsets of $10 per ton, that equals $25,000 for carbon offsets over the lifetimeof the system, giving the final cost of $554,857.
Table 15 Summary of Results
5. Construction Phase
5.1 Pre-ConstructionAn acceptance testing is to be incorporated into the design and construction of the building. Prior
to building permit, a project acceptance representative is designated to lead, review and oversee thecompletion of acceptance testing activities.
Building project commissioning (Cx) will be performed in accordance with section 10 of ASHRAE189.1-2014. A Cx plan and commissioning authority (CxA) is incorporated into the pre-design, design,construction and first-year occupancy of the building project that verifies that all the building componentscomply with the documented OPR.
The design team will develop the Basis of Design (BoD) which includes all the informationrequired in section 6.2 ASHRAE 55-2016. Also, it should incorporate an enhanced construction phasecommissioning requirements into the project specifications and other construction documents. The CxAwill oversee reviewing both the OPR and BoD to ensure that it meets all the requirements.
5.2 Construction & Building ImpactASHRAE Standards and local building codes will be followed during the construction. Local
materials and reused materials from the demolition of the old meteorological building are incorporated intothe final building construction.
An Erosion and Sedimentation Control (ESC) will be developed and implemented during allconstruction activities. Indoor Air Quality (IAQ) construction management plan will also be included. Afterconstruction ends, a baseline IAQ shall be conducted where the ventilation system operates continuouslywithin ±10% of the outdoor airflow rate provided by the ventilation system at design occupancy for aminimum of 24 hours. A whole building pressurization testing shall be conducted in accordance with ASTM E 779,CAN/CGSB-149.15-90 or equivalent. The measured air leakage rate of the building envelope shall notexceed .25 CFM/ft2 under a pressure differential of .3 in wc. Materials stored on-site or materials installed that are absorptive will be protected from moisturedamage. A big component in our design is the collection of recyclable and reusable materials before, duringand after construction. This was emphasized in the building impact section of the report.
5.3 Post-Construction/OccupancyPrior to building occupancy, installation and start-up of all systems, including mechanical, lighting
System ConfigurationLCOE
(Per KWh )Initial Cost Lifetime Cost
RenewableFraction
Battery Backup(hours)
28 kW Diesel Generator $1.23 $14,000 $4,423,632 0% 0Wind Turbines, Tesla Batteries $0.59 $521,761 $2,137,563 96% 48Electricity from Grid $0.32 $0 $1,163,007 0% 0Wind Turbines, Grid Tie, Gen, PV $0.00 $277,127 $529,857 85% 0
Page 30 of 34
and renewable, are properly verified. All necessary manuals and performance acceptance test arecompleted. This documentation provides the information required to understand optimally operate buildingsystems.
After occupancy, any commissioning activities and a preliminary Cx report will be complete. Theowner requirements for building occupants shall be completed. A system manual shall be prepared thatincludes operation and maintenance documentation and full warranty information as stated in section10.3.1.2 ASHRAE 189.1-2014. Plans for operation including site sustainability, water use efficiency,energy consumption and efficiency, indoor and outdoor air, maintenance, transportation, and service lineplan will be provided with the building following section 10.3.2 ASHRAE 189.1-2014.
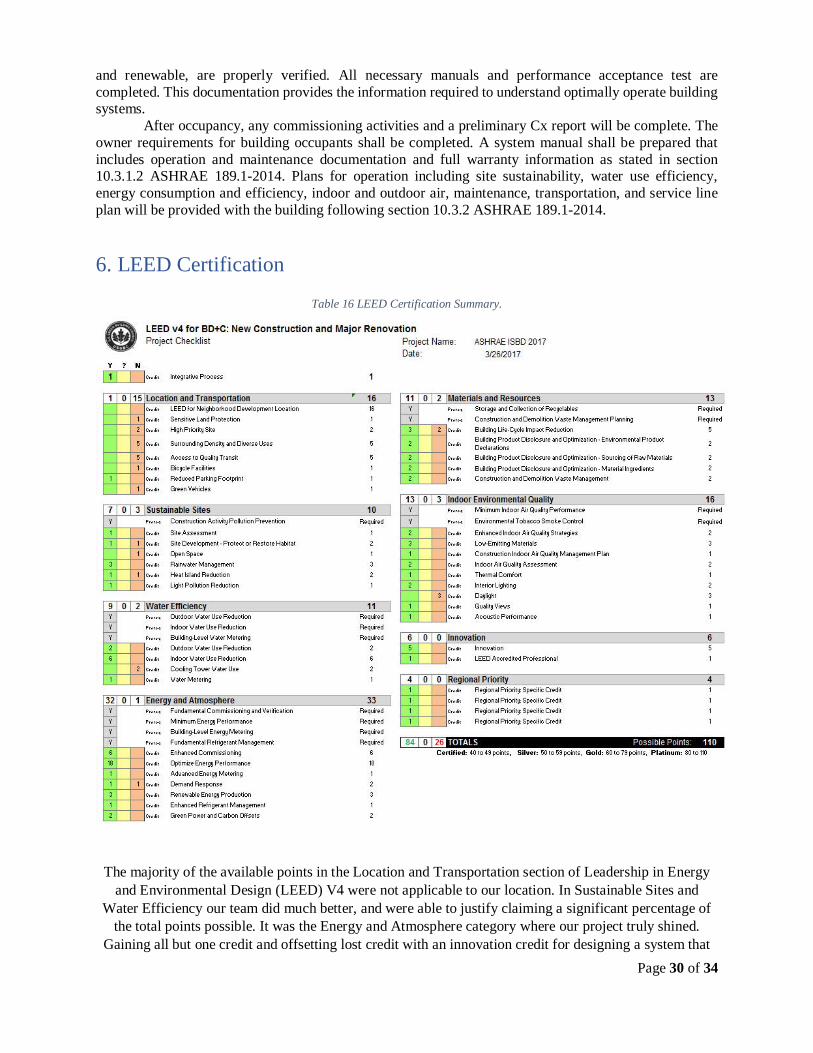
6. LEED Certification
Table 16 LEED Certification Summary.
The majority of the available points in the Location and Transportation section of Leadership in Energyand Environmental Design (LEED) V4 were not applicable to our location. In Sustainable Sites and
Water Efficiency our team did much better, and were able to justify claiming a significant percentage ofthe total points possible. It was the Energy and Atmosphere category where our project truly shined.
Gaining all but one credit and offsetting lost credit with an innovation credit for designing a system that
Page 31 of 34
uses more than 55% renewable energy.
7. Life Cycle Cost (1)
Life cycle cost (LCC) is an economic methodology for selecting the most cost-effective designalternative over a particular time frame, taking into consideration its construction, operation, maintenance,replacement, rehabilitation costs and residual value. The ultimate goal of this project is to provide the ownerwith the best NZEB that provides the best return on investment over a 50-year period. A life cycle studywas performed for all the components of the building which played an important role in the developmentof the final design.
The LCCA was computed using standard ASTM E917-15. This standard defines the process usinga formula of present value terms expressed as
Equation 6:ܥܥܮ ൌ ൌ0ߑ ܥ
ሺ1ሻݐ
Where C is the sum of all costs in that year, N is the number of years and ὶ is the discount rate (Per “BuildingService Life”). The analysis was calculated using an excel spreadsheet that includes initial cost, labor cost,operation and maintenance cost, energy cost including any escalation rates, residual value, discount rate,and yearly cost adjusted to present value.
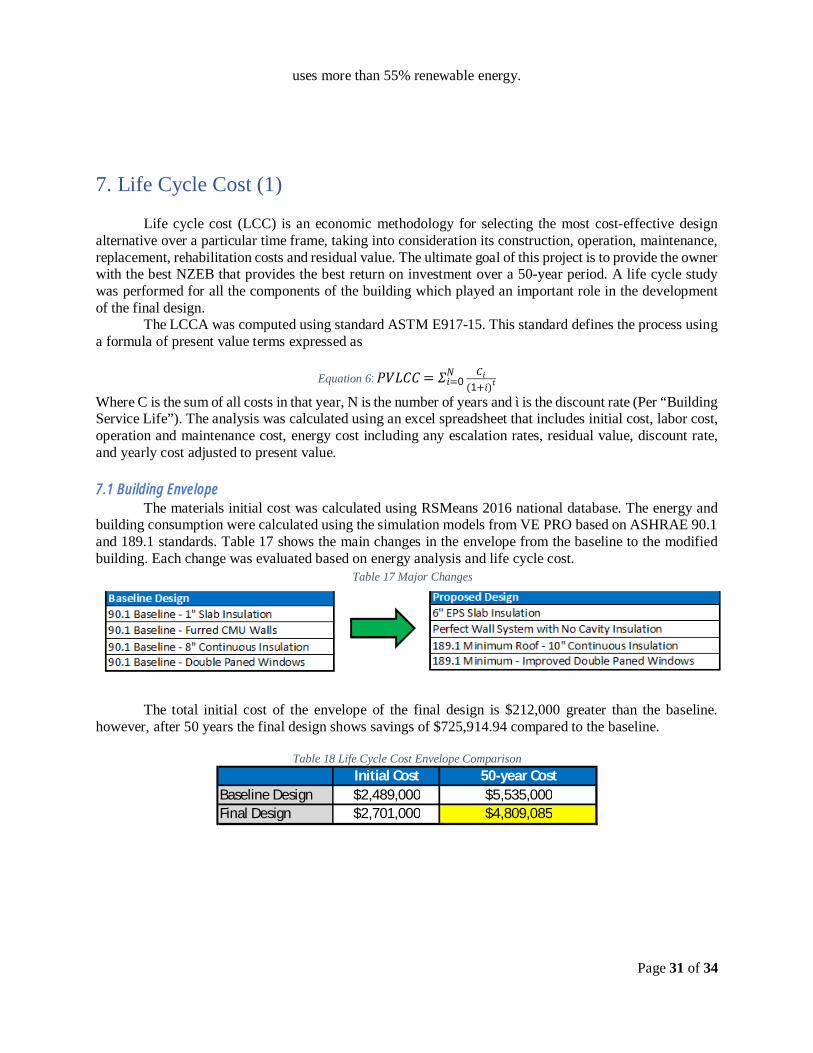
7.1 Building EnvelopeThe materials initial cost was calculated using RSMeans 2016 national database. The energy and
building consumption were calculated using the simulation models from VE PRO based on ASHRAE 90.1and 189.1 standards. Table 17 shows the main changes in the envelope from the baseline to the modifiedbuilding. Each change was evaluated based on energy analysis and life cycle cost.
The total initial cost of the envelope of the final design is $212,000 greater than the baseline.however, after 50 years the final design shows savings of $725,914.94 compared to the baseline.
Table 18 Life Cycle Cost Envelope ComparisonInitial Cost 50-year Cost
Baseline Design $2,489,000 $5,535,000Final Design $2,701,000 $4,809,085
Table 17 Major Changes
Page 32 of 34
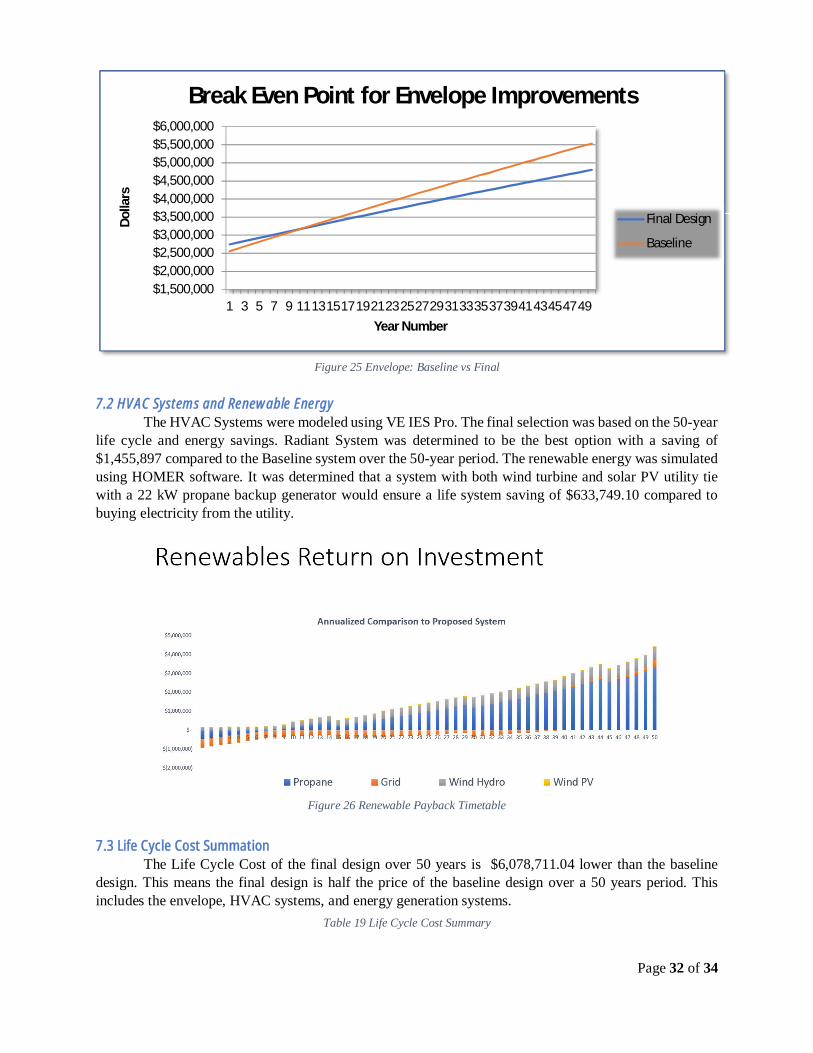
Figure 25 Envelope: Baseline vs Final
7.2 HVAC Systems and Renewable EnergyThe HVAC Systems were modeled using VE IES Pro. The final selection was based on the 50-year
life cycle and energy savings. Radiant System was determined to be the best option with a saving of$1,455,897 compared to the Baseline system over the 50-year period. The renewable energy was simulatedusing HOMER software. It was determined that a system with both wind turbine and solar PV utility tiewith a 22 kW propane backup generator would ensure a life system saving of $633,749.10 compared tobuying electricity from the utility.
Figure 26 Renewable Payback Timetable
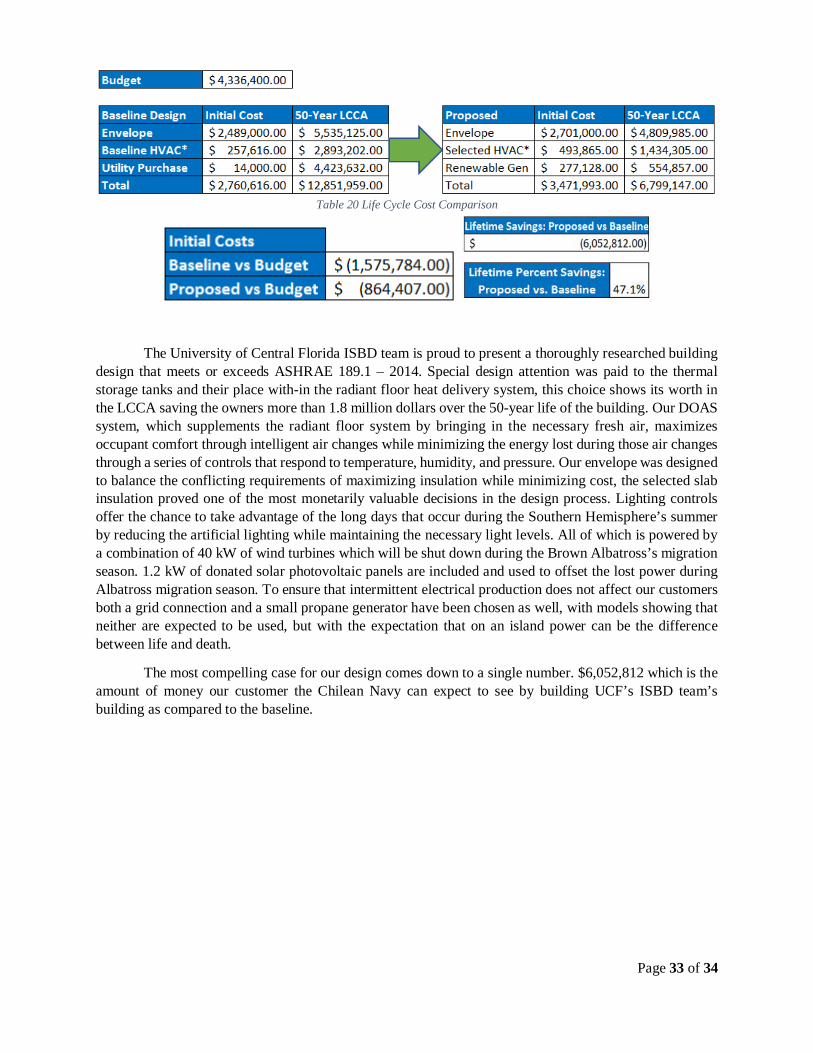
7.3 Life Cycle Cost SummationThe Life Cycle Cost of the final design over 50 years is $6,078,711.04 lower than the baseline
design. This means the final design is half the price of the baseline design over a 50 years period. Thisincludes the envelope, HVAC systems, and energy generation systems.
$1,500,000$2,000,000$2,500,000$3,000,000$3,500,000$4,000,000$4,500,000$5,000,000$5,500,000$6,000,000
1 3 5 7 9 1113151719212325272931333537394143454749
Dolla
rs
Year Number
Break Even Point for Envelope Improvements
Final Design
Baseline
Table 19 Life Cycle Cost Summary
Page 33 of 34
Table 20 Life Cycle Cost Comparison
The University of Central Florida ISBD team is proud to present a thoroughly researched buildingdesign that meets or exceeds ASHRAE 189.1 – 2014. Special design attention was paid to the thermalstorage tanks and their place with-in the radiant floor heat delivery system, this choice shows its worth inthe LCCA saving the owners more than 1.8 million dollars over the 50-year life of the building. Our DOASsystem, which supplements the radiant floor system by bringing in the necessary fresh air, maximizesoccupant comfort through intelligent air changes while minimizing the energy lost during those air changesthrough a series of controls that respond to temperature, humidity, and pressure. Our envelope was designedto balance the conflicting requirements of maximizing insulation while minimizing cost, the selected slabinsulation proved one of the most monetarily valuable decisions in the design process. Lighting controlsoffer the chance to take advantage of the long days that occur during the Southern Hemisphere’s summerby reducing the artificial lighting while maintaining the necessary light levels. All of which is powered bya combination of 40 kW of wind turbines which will be shut down during the Brown Albatross’s migrationseason. 1.2 kW of donated solar photovoltaic panels are included and used to offset the lost power duringAlbatross migration season. To ensure that intermittent electrical production does not affect our customersboth a grid connection and a small propane generator have been chosen as well, with models showing thatneither are expected to be used, but with the expectation that on an island power can be the differencebetween life and death.
The most compelling case for our design comes down to a single number. $6,052,812 which is theamount of money our customer the Chilean Navy can expect to see by building UCF’s ISBD team’sbuilding as compared to the baseline.
Page 34 of 34
References
[1] J. Lstiburek, "Building Science Corporation," 15 July 2010. [Online]. Available:https://buildingscience.com/documents/insights/bsi-001-the-perfect-wall. [Accessed 3 March 2017].
[2] Airflow Systems Inc, "Vehicle Exhaust Removal Systems," Airflow Systems Inc, [Online].Available: http://www.airflowsystems.com/vehicle-exhaust-systems.php. [Accessed 14 April 2017].
[3] Windfinder, "Isla Diego Ramirez Island," 2017. [Online]. Available:https://www.windfinder.com/windstatistics/cape_horn_isla_diego_ramirez.
[4] HOMER Energy, "HOMER Energy," HOMER Energy, 2017. [Online]. Available:http://www.homerenergy.com/. [Accessed April 2017].
[5] P. Heptonstall, "A Review of Electricity Unit Cost Estimates," UKERC, London, 2007.
[6] Investopedia, "Net Present Value - NPV," Investopedia, 2017. [Online]. Available:http://www.investopedia.com/terms/p/pooled-internal-rate-of-return.asp. [Accessed April 2017].
[7] P. Quilty, "Origin and Evolution of the Sub-Antarctic Islands: The Foundation," Royal Society ofTasmania, 2007.
[8] "xzeres 442sr small wind turbine," Xzeres, [Online]. Available: http://www.xzeres.com/wind-turbine-products/xzeres-442sr-small-wind-turbine/. [Accessed 2 January 2017].
[9] M. Emslie, "Petrography and Trace-Element Geochemistry of Metabasalts on Diego Ramirez Islands,southern Chile," The Ohio State University, Columbus, 1988.
[10] D. Cromer, "Florida Solar Atlas," Florida Solar Energy Center, Cocoa, 2011.
[11] J. Paredes, "Energy Innovation Center," Energy Innovation Center, 2012. [Online]. Available:http://services.iadb.org/wmsfiles/products/Publications/37427958.pdf. [Accessed 30 March 2017].