asia’s fashion jewellery & accessories fair september 2016 website revamp/fair... · asia’s...
TRANSCRIPT
1
Asia’s Fashion Jewellery &
Accessories Fair –
September 2016
Exhibitor Survey Report
2
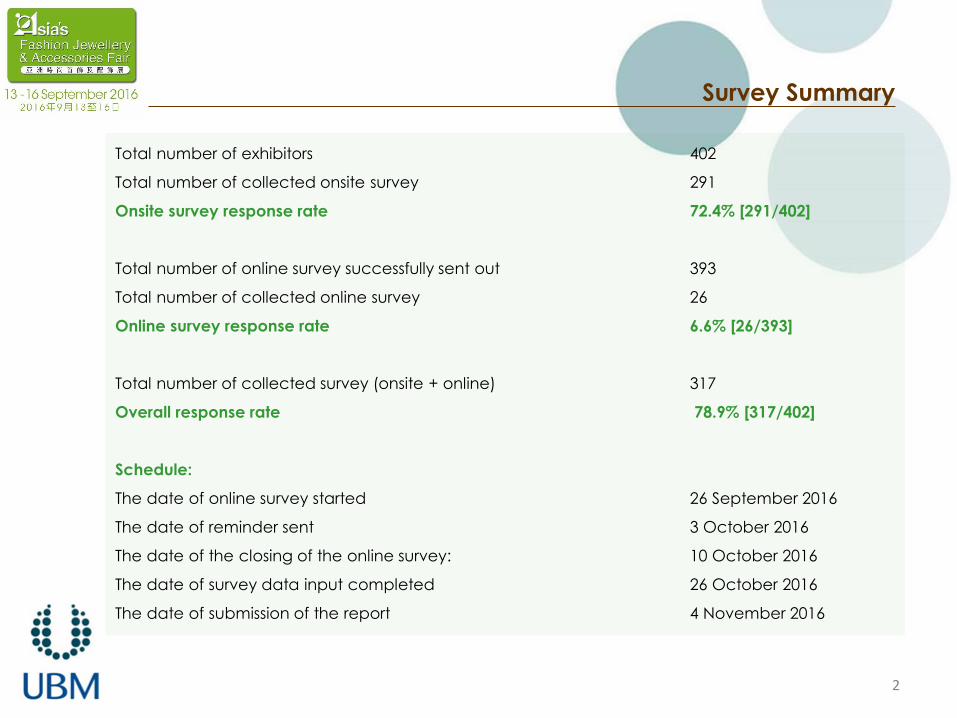
Survey Summary
Total number of exhibitors 402
Total number of collected onsite survey 291
Onsite survey response rate 72.4% [291/402]
Total number of online survey successfully sent out 393
Total number of collected online survey 26
Online survey response rate 6.6% [26/393]
Total number of collected survey (onsite + online) 317
Overall response rate 78.9% [317/402]
Schedule:
The date of online survey started 26 September 2016
The date of reminder sent 3 October 2016
The date of the closing of the online survey: 10 October 2016
The date of survey data input completed 26 October 2016
The date of submission of the report 4 November 2016

3
Exhibitors in Theme Pavilions or Group Pavilions
2016 Number of Respondents: 204
46.6%
18.1%
15.2%
13.2%
3.9%
2.9%
0% 5% 10% 15% 20% 25% 30% 35% 40% 45% 50%
China Pavilion
Stainless Steel Jewellery Pavilion
Korea Pavilion
India Pavilion
Taiwan Pavilion
Philippines Pavilion

4
Nature of Business(es)
87.5%
39.1%
16.3%
10.3%
3.2%
1.6%
1.0%
0.3%
0.3%
0.0%
0.0%
84.3%
49.8%
18.4%
12.0%
3.2%
3.7%
1.4%
0.5%
0.5%
0.9%
0.5%
0% 10% 20% 30% 40% 50% 60% 70% 80% 90% 100%
Manufacturer/Supplier
Exporter
Wholesaler
Fashion Jewellery / Accessories Designer
Importer
Retailer
Buying Agent
Department / Chain Store
Related Institute / Association
Mail Order-House / E-Tailer
Publication
2016
2015
2016 Number of Respondents: 312 Number of Respondents: 2172015

5
Q1. Is your company a first-time participant in this exhibition?
2016 Number of Respondents: 279 Number of Respondents: 215 2015
11.5%
[32]
88.5% [247]
2016
Yes
No
8.8% [19]
91.2% [196]
2015
Yes
No
Percentage of first-time exhibitors has increased, indicating more new exhibitors.

6
Q2. Overall, how would you rate your satisfaction with your
experience at Asia’s Fashion Jewellery & Accessories Fair –
September?(0 = Extremely dissatisfied, 10 = Extremely satisfied)
2016 Number of Respondents: 315Number of Skipped: 2
Number of Respondents: 219Number of Skipped: 1
2015
1.9%
3.5%
3.8%
6.3%
9.8%
16.2%
18.7%
15.9%
14.0%
4.8% 5.1%
2.7%
2.3%
5.5%
13.7%
8.2%
18.3%
12.8%
16.9%
11.4%
3.2%
5.0%
0%
2%
4%
6%
8%
10%
12%
14%
16%
18%
20%
0 1 2 3 4 5 6 7 8 9 10
2016
2015
Average Rating
2016
5.79Average Rating
2015
5.44
CSAT has increased compared to last year. Around 60% of exhibitors gave a rating 6 or above.

7
Q3. How likely would you be to attend Asia’s Fashion Jewellery &
Accessories Fair – September again in the future?(0 = Not at all likely, 10 = Extremely likely)
2016 Number of Respondents: 315Number of Skipped: 2
Number of Respondents: 219Number of Skipped: 1
2015
0.6%1.3%
2.2%
3.5%
4.8%
17.5%
12.1% 13.3%
17.5%
8.9%
18.4%
1.4%
3.2%3.7%
5.9%
5.5%
18.7%
7.8%
13.2%
16.4%
4.6%
19.6%
0%
5%
10%
15%
20%
25%
0 1 2 3 4 5 6 7 8 9 10
2016
2015
Average Rating
2016
6.92Average Rating
2015
6.52
The Loyalty score has increased in general compared to 2015.

8
Q4. How likely are you to recommend Asia’s Fashion Jewellery &
Accessories Fair – September to a friend or colleague?(0 = Not at all likely, 10 = Extremely likely)
2016 Number of Respondents: 312Number of Skipped: 5
Number of Respondents: 217Number of Skipped: 3
2015
3.2%
2.9%
2.6%
5.4%
4.5%
22.4%
11.5% 13.8%
18.9%
5.4%
9.3%
5.1%
2.3%
4.1%
9.7%
4.6%
20.3%
9.2%
15.2%15.7%
3.7%
10.1%
0%
5%
10%
15%
20%
25%
0 1 2 3 4 5 6 7 8 9 10
2016
2015
Average rating
2016
6.13Average rating
2015
5.81

9
Q4.1. How likely are you to recommend Asia’s Fashion Jewellery
& Accessories Fair – September to a friend or colleague?(0 = Not at all likely, 10 = Extremely likely)
2016 Number of Respondents: 312Number of Skipped: 5
Scale# of
respondents
Ratings
Breakdown %
0 10 3.2%
1 9 2.9%
2 8 2.6%
3 17 5.4%
4 14 4.5%
5 70 22.4%
6 36 11.5%
7 43 13.8%
8 59 18.9%
9 17 5.4%
10 29 9.3%
Detractors 52.5%
Passives 32.7%
Promoters 14.7%
NPS -38
NPS recorded -38 in 2016 and -42 in 2015. More people are likely to recommend 9FJ by WOM.

10
Q5a. How did you learn about this exhibition?
2016 Number of Respondents: 288Number of Skipped: 29
Number of Respondents: 199 Number of Skipped: 21
2015
The top three channels are “Word of mouth/Referral from industry friend”, “Organiser’s email”, and “Advertisement”. We had sent out more emails (fair enews and AsiaFJA enews) prior the Fair therefore there is a drastic increase of “Organiser’s email”.“Other exhibitions” included FAME CEBU, EPCH India, HKTDC, and other UBM jewellery fairs.In “Others”, respondents specified that they are regular exhibitors and learnt about 9FJ from our agent.“Search engine” and “Social media” are new questions in 2016.
34.7%
32.3%
19.4%
14.9%
11.1%
10.4%
5.6%
3.5%
3.5%
33.7%
22.1%
17.6%
15.6%
11.6%
13.1%
0.0%
0.0%
6.0%
0% 5% 10% 15% 20% 25% 30% 35% 40%
Word of mouth / Referral from industry friend
Organiser’s email
Advertisement
Organiser’s website
Others
Organiser’s printed mail
Search engine
Social media
Other exhibitions
2016
2015
11
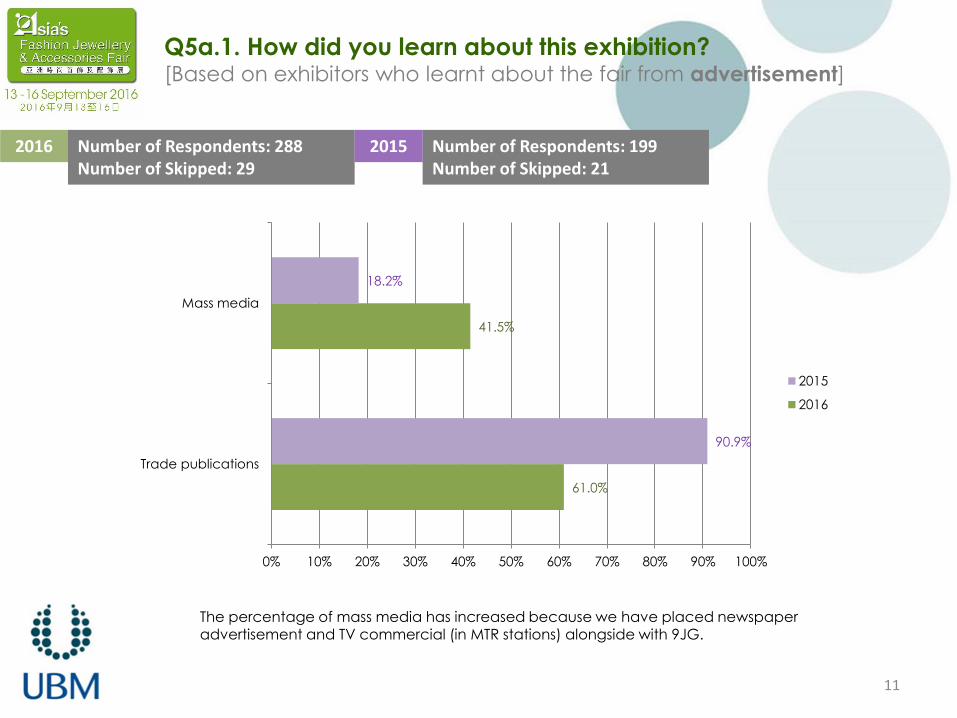
2016 Number of Respondents: 288Number of Skipped: 29
Number of Respondents: 199 Number of Skipped: 21
2015
Q5a.1. How did you learn about this exhibition?[Based on exhibitors who learnt about the fair from advertisement]
61.0%
41.5%
90.9%
18.2%
0% 10% 20% 30% 40% 50% 60% 70% 80% 90% 100%
Trade publications
Mass media
2015
2016
The percentage of mass media has increased because we have placed newspaper advertisement and TV commercial (in MTR stations) alongside with 9JG.
12
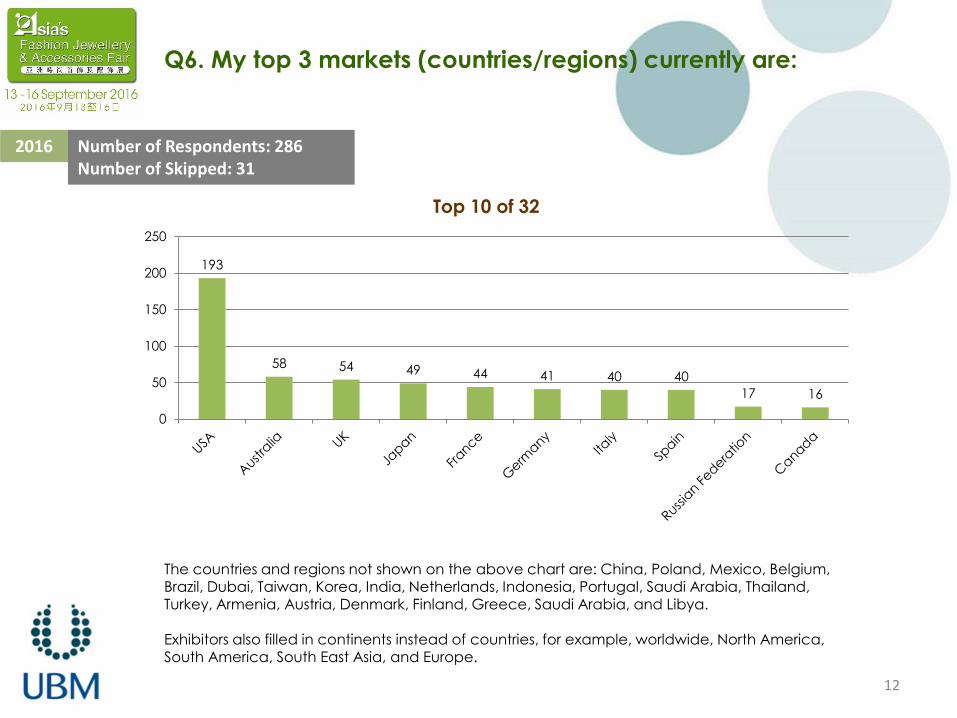
Q6. My top 3 markets (countries/regions) currently are:
2016 Number of Respondents: 286Number of Skipped: 31
Top 10 of 32
193
58 54 49 44 41 40 40
17 16
0
50
100
150
200
250
The countries and regions not shown on the above chart are: China, Poland, Mexico, Belgium, Brazil, Dubai, Taiwan, Korea, India, Netherlands, Indonesia, Portugal, Saudi Arabia, Thailand, Turkey, Armenia, Austria, Denmark, Finland, Greece, Saudi Arabia, and Libya.
Exhibitors also filled in continents instead of countries, for example, worldwide, North America, South America, South East Asia, and Europe.

13
Q7. My target 3 markets (countries/regions) currently are:
2016 Number of Respondents: 264Number of Skipped: 53
Top 10 of 30
117
29 2721 17 15 14 13 13
0
20
40
60
80
100
120
140
USA Australia UK Germany France Japan Spain Italy Russian
Federation
The countries and regions not shown on the above chart are: Canada, China, Brazil, Switzerland, Korea, Dubai, India, Mexico, Norway, South Africa, Iran, Denmark, Austria, Belgium, Greece, Hong Kong, Indonesia, Israel, New Zealand, Portugal, Sweden
Exhibitors also filled in continents instead of countries, for example, worldwide, North America, South America, South East Asia, and Europe.

14
Q8. To what extent have your objectives for exhibiting in this
exhibition been achieved?(N/A ; 1 = Did not achieve at all; 5 = Fully achieved)
2016 Number of Respondents: 292Number of Skipped: 25
12.0%
14.7%
13.5%
7.6%
10.9%
9.9%
9.3%
25.7%
16.0%
26.2%
19.2%
20.6%
18.6%
16.0%
38.0%
21.0%
35.0%
36.8%
32.8%
36.8%
34.6%
14.8%
9.7%
13.8%
19.6%
16.6%
22.3%
24.5%
6.0%
2.9%
4.6%
9.2%
6.5%
5.4%
10.5%
3.5%
35.7%
6.9%
7.6%
12.6%
7.0%
5.1%
0% 20% 40% 60% 80% 100%
Find new buyers
Find franchisers partners / agents
Explore new markets
Launch new products
Brand-building
Collect market information
Consolidate contacts with buyers/ business partners
1 2 3 4 5 N/A
The top three objectives for exhibiting in 9FJ are “Consolidate contacts” (35%), “Launch new products” (28.8%), and followed by “Collect market information”(27.7%).

15
Q8.1. To what extent have your objectives for exhibiting in this
exhibition been achieved?(N/A ; 1 = Did not achieve at all; 5 = Fully achieved)
2016 Number of Respondents: 292Number of Skipped: 25
Number of Respondents: 215Number of Skipped: 5
2015
Comparison of combining responses of “Rating 4” and “Rating 5”
20.8%
12.6%
18.4%
28.8%
23.1%
27.7%
35.0%
17.7%
5.6%
13.5%
18.1%
14.4%
17.2%
23.4%
0% 5% 10% 15% 20% 25% 30% 35% 40%
Find new buyers
Find franchisers partners / agents
Explore new markets
Launch new products
Brand-building
Collect market information
Consolidate contacts with buyers/ business partners
2015
2016
All objectives are performing better this year. After combing Rating 4 and Rating 5, the top three objectives are “Consolidate contacts”(35%), “Launch new products”(28.8%), and “Collect market information”(27.7%).

16
Q9. To what extent are you satisfied with the exhibition in the
following aspects?(N/A ; 1 = Not satisfied at all ; 5 = Extremely satisfied)
2016 Number of Respondents: 285Number of Skipped: 32
10.4%
16.3%
9.0%
6.8%
5.7%
7.2%
5.4%
4.1%
6.3%
26.9%
27.4%
18.4%
14.0%
10.3%
15.5%
14.0%
11.4%
12.2%
39.6%
35.9%
35.6%
37.4%
36.6%
34.3%
34.9%
31.8%
32.9%
19.4%
15.6%
27.3%
27.5%
29.0%
30.6%
29.8%
28.2%
33.3%
3.0%
2.6%
8.2%
12.8%
16.8%
10.9%
10.5%
9.4%
12.5%
0.7%
2.2%
1.5%
1.5%
1.5%
1.5%
5.4%
15.1%
2.7%
0% 10% 20% 30% 40% 50% 60% 70% 80% 90% 100%
Business opportunities
Visitor traffic
Visitor quality
Pre-show service of organiser
Onsite service of organiser
Facilities and services of the exhibition
centre
Official stand contractor(s)
Official forwarding agent(s)
Move-in and move-out arrangement
1 2 3 4 5 N/A
The top three aspects are “Onsite service of organiser” (45.8%), “Move-in and move-out arrangement” (45.8%), and “Facilities and services of the exhibition centre” (41.5%)The exhibitors are satisfied with our service provided in general.

17
Q9.1. To what extent are you satisfied with the exhibition in the
following aspects?(N/A ; 1 = Not satisfied at all ; 5 = Extremely satisfied)
2016 Number of Respondents: 285Number of Skipped: 32
Number of Respondents: 219Number of Skipped: 1
2015
22.4%
18.2%
35.5%
40.3%
45.8%
41.5%
40.3%
37.6%
45.8%
19.1%
20.0%
30.3%
43.3%
43.3%
41.2%
37.2%
30.2%
40.5%
0% 10% 20% 30% 40% 50%
Business opportunities
Visitor traffic
Visitor quality
Pre-show service of organiser
Onsite service of organiser
Facilities and services of the exhibition centre
Official stand contractor(s)
Official forwarding agent(s)
Move-in and move-out arrangement
2015
2016
Comparison of combining responses of “Rating 4” and “Rating 5”
The satisfaction rate has increased in all aspects except for “Visitor traffic” and “pre-show service of organiser”.

18
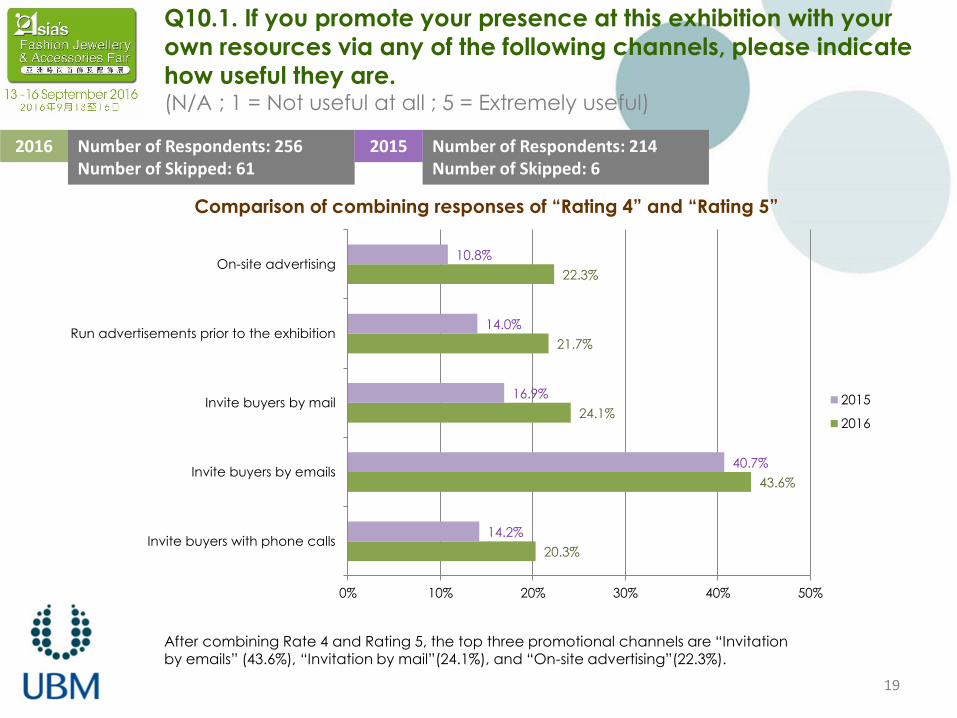
Q10. If you promote your presence at this exhibition with your own
resources via any of the following channels, please indicate how
useful they are.(N/A ; 1 = Not useful at all ; 5 = Extremely useful)
2016 Number of Respondents: 256Number of Skipped: 61
9.4%
4.6%
10.0%
11.3%
9.9%
17.9%
16.2%
12.8%
18.2%
15.8%
27.4%
31.1%
27.0%
22.2%
23.3%
14.2%
27.4%
15.6%
16.3%
17.3%
6.1%
16.2%
8.5%
5.4%
5.0%
25.0%
4.6%
26.1%
26.6%
28.7%
0% 20% 40% 60% 80% 100%
Invite buyers with phone calls
Invite buyers by emails
Invite buyers by mail
Run advertisements prior to the
exhibition
On-site advertising
1 2 3 4 5 N/A
The top three effective promotional channels are “Invitation by emails”(43.6%), then “Invitation by mail”(24.1%), and “Onsite advertising”(22.3%).
19
2016 Number of Respondents: 256Number of Skipped: 61
Number of Respondents: 214Number of Skipped: 6
2015
20.3%
43.6%
24.1%
21.7%
22.3%
14.2%
40.7%
16.9%
14.0%
10.8%
0% 10% 20% 30% 40% 50%
Invite buyers with phone calls
Invite buyers by emails
Invite buyers by mail
Run advertisements prior to the exhibition
On-site advertising
2015
2016
Comparison of combining responses of “Rating 4” and “Rating 5”
Q10.1. If you promote your presence at this exhibition with your
own resources via any of the following channels, please indicate
how useful they are.(N/A ; 1 = Not useful at all ; 5 = Extremely useful)
After combining Rate 4 and Rating 5, the top three promotional channels are “Invitation by emails” (43.6%), “Invitation by mail”(24.1%), and “On-site advertising”(22.3%).
20
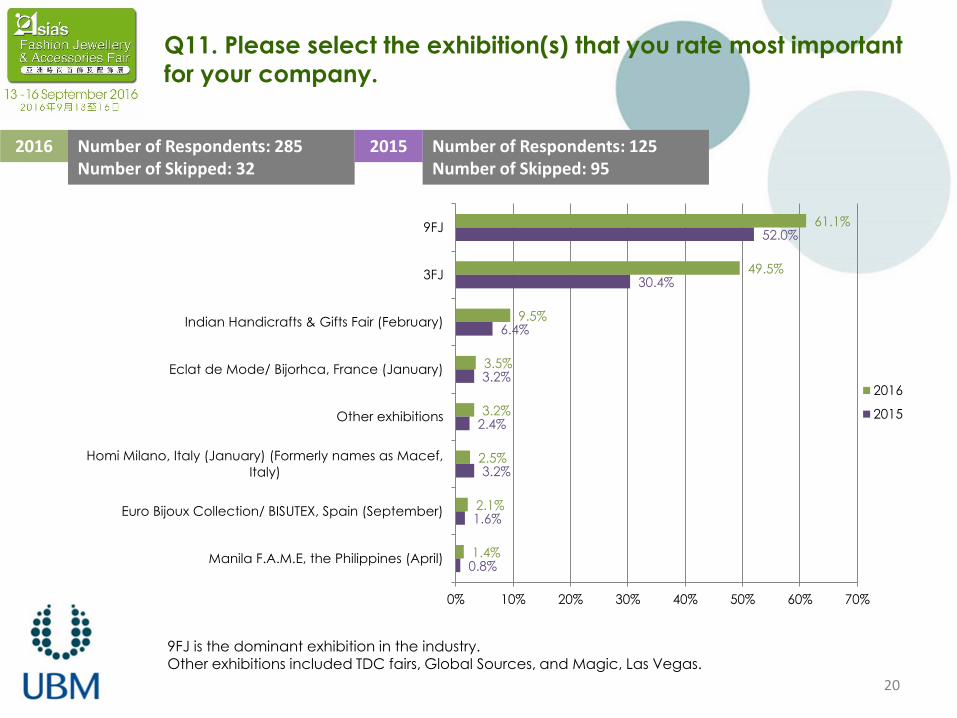
Q11. Please select the exhibition(s) that you rate most important
for your company.
2016 Number of Respondents: 285Number of Skipped: 32
Number of Respondents: 125Number of Skipped: 95
2015
61.1%
49.5%
9.5%
3.5%
3.2%
2.5%
2.1%
1.4%
52.0%
30.4%
6.4%
3.2%
2.4%
3.2%
1.6%
0.8%
0% 10% 20% 30% 40% 50% 60% 70%
9FJ
3FJ
Indian Handicrafts & Gifts Fair (February)
Eclat de Mode/ Bijorhca, France (January)
Other exhibitions
Homi Milano, Italy (January) (Formerly names as Macef,
Italy)
Euro Bijoux Collection/ BISUTEX, Spain (September)
Manila F.A.M.E, the Philippines (April)
2016
2015
9FJ is the dominant exhibition in the industry.Other exhibitions included TDC fairs, Global Sources, and Magic, Las Vegas.

21
Q12. What are your plans for participating in this exhibition next
year?
2016 Number of Respondents: 278 Number of Respondents: 2022015
75.5%
74.3%
23.4%
22.8%
1.1%
3.0%
0% 20% 40% 60% 80% 100%
2016
2015
Will participate
May participate
Wll not participate
Preferences between booth sizes
[Based on exhibitors who will participate the next edition]
25.5%
66.2%
6.9%
22.2%
69.4%
8.3%
0%
10%
20%
30%
40%
50%
60%
70%
80%
Larger booth size Same booth size Smaller booth size
2016
2015
The exhibitors’ plan for participating in 9FJ17 are roughly the same as last year. More exhibitors said they will participate but at the same time more exhibitors are unsure about next year’s plan.
For those who planned to exhibit again in 9FJ17, around 25% of them would want a larger booth. Roughly 66% exhibitors want a same-sized both and 7% of exhibitors want a smaller booth.