big data from the built environment data from the built environment azam khan1,2 autodesk research1...
TRANSCRIPT
Big Data from the Built Environment Azam Khan1,2
Autodesk Research1 210 King Street East,
Toronto, ON Canada M5A 1J7 [email protected]
Kasper Hornbæk2 Department of Computer Science,
University of Copenhagen2
Njalsgade 128, DK-2300 Copenhagen S, Denmark [email protected]
ABSTRACT As sensor networks in buildings continue to grow in number and heterogeneity, occupants can become empowered to better control their environment for comfort maximization and energy minimization. Since buildings are the primary consumers of energy and are the dominant cause of greenhouse gases, apps that help occupants to understand and control their interactions with a building could be extremely beneficial to society. However, the massive raw data sets that could be collected must be aggregated and visualized to be usable which presents significant data handling, information visualization, and interaction challenges. In the context of Project Dasher, a prototype building site for exploring these issues, we discuss lessons learned and challenges ahead to develop ubiquitous computing support for sustainability.
Author Keywords massive data sets; building information model; data aggregation; sustainability; app; augmented reality.
ACM Classification Keywords J.5 [Arts and Humanities]: Architecture. H.4.2 [Information Systems Applications]: Types of Systems – Decision Support. H.5.2 [Information Interfaces and Presentation]: User Interfaces.
General Terms Design, Human Factors, Measurement, Performance
INTRODUCTION The modern built environment has always had some level of instrumentation as part of its normal function. For example, pumps and motors in elevators or water systems have monitored safety limits to prevent damage to themselves and to their users. Beyond functionality, the residential electrical, water, gas, or oil meters monitor consumption to ensure fair billing to the homeowner. Now, beyond basic functionality and monitoring, new sensor networks are being added to building structures, and to infrastructure services, to improve system-level efficiency.
In the field of architecture, when the design of a building is finished, the architects typically hand over drawings to the engineering team who will create zones with different thermal needs. For example, a simple layout for one floor would be a central zone together with one edge zone for each of the four sides of the building. These zones will have
different thermal needs because of the different exposures to sun and wind over the course of a day. As input to a building control system, each zone will have a thermostat with a temperature and humidity sensor together with a desired temperature setting control. The output from the building control system in a specific zone is typically the damper position, between open or closed, of a Variable Air Volume (VAV) terminal unit which may also have an air pressure sensor. So, there may be 3 or 4 sensors per zone supplying heating and/or air conditioning for two dozen people. A typical office building (see Figure 1) may have 250 sensors going into the building control system.
Unfortunately, the simplicity of this approach results in very large zones where it becomes impossible to provide comfortable working temperatures for all of the occupants. Also, there is no explicit sensing or response to the presence of occupants so heating and cooling equipment is controlled by a simple schedule of when, and to what degree, the building manager has predicted that the building will be occupied.
While these problems may not seem to be too damaging, over-cooling, over-heating, and over-lighting in buildings has resulted in buildings being the primary cause (48%) of all anthropogenic greenhouse gases (GHG) production [1]. Essentially half of all air pollution comes from producing the power needed to run buildings.
NET-ZERO SMART BUILDINGS The sustainability community, in the fields of architecture and engineering, has been working for decades to address this problem and technologies have been developed, both in research and industry, to significantly reduce the energy consumption of residential and commercial buildings [2]. As an extreme response to an extreme problem, this community has set their ultimate goal as the net-zero building that produces as much energy as it uses.
Generally, a net-zero building strategy starts with dramatic efficiency gains of 75% through design and technology, with the remaining 25% of power demand being generated locally with sources such as solar or wind power. Within the technological efficiency gains is the digitization of the building control system and its device and sensor network. This so-called “smart building” paradigm shift in building systems could form the basis of a reliable platform for ubiquitous computing for sustainability.
Copyright is held by the author/owner(s). UbiComp’11, September 17–21, 2011, Beijing, China. ACM 978-1-60558-843-8/10/09.
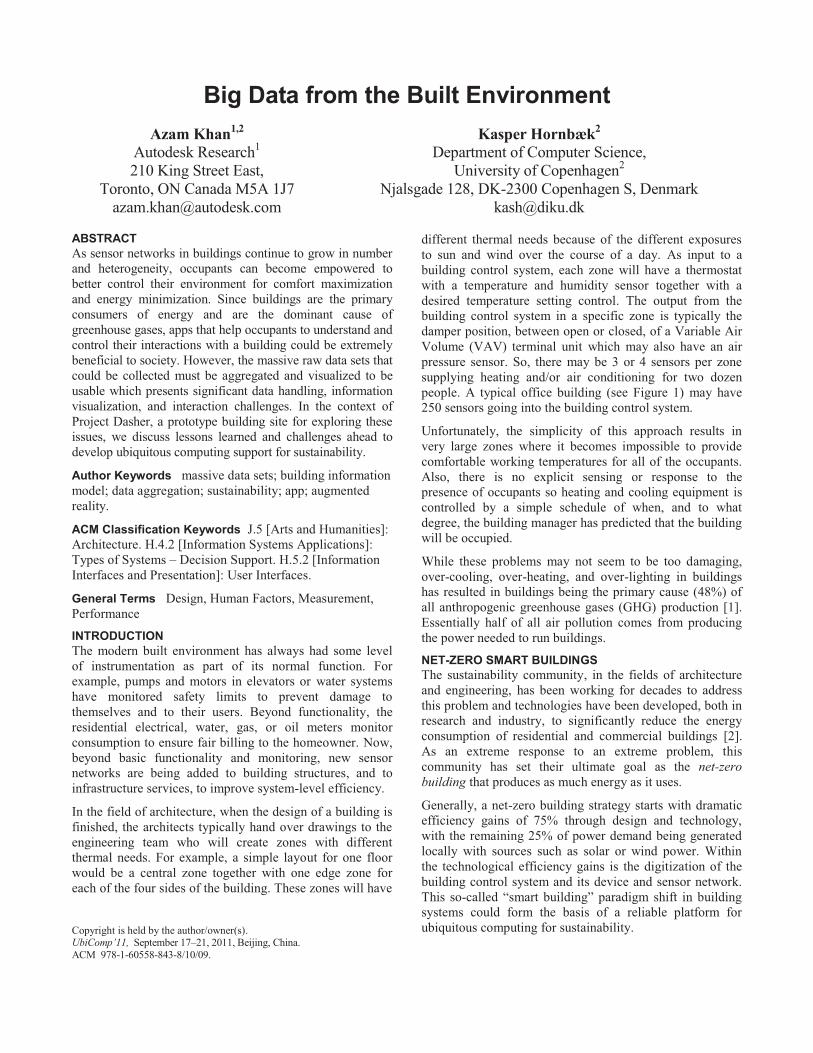
Occupant-centric Design Underlying the net-zero building strategy is a “high resolution” demand-response approach. That is, going beyond large thermal zones, building systems should primarily heat or cool areas that are occupied [4]. To better determine whether people are present in specific spaces, a large number of motion, light, power usage and CO2 sensors have been integrated into lighting fixtures and office furniture. Project Dasher [5] visualizes the sensor values on a 3D building information model (see Figure 1).
Figure 1. Real-time visualization of an office building with a
high density sensor network (sensor icons in green and yellow overlaid on 3D model).
Motion-detection and the presence of increased CO2 levels can help indicate the degree of occupancy of a space. To maintain fresh air requirements, ventilation is normally designed to meet peak occupant demand, independent of the actual occupancy. During partial occupancy, energy is wasted to heat, cool, humidify and/or dehumidify more outside air than is required. Since occupants exhale CO2 at predictable levels, the carbon dioxide level is a useful indicator of a room's ventilation needs based on the number of people in the room, especially in closed rooms such as meeting rooms in an office building.
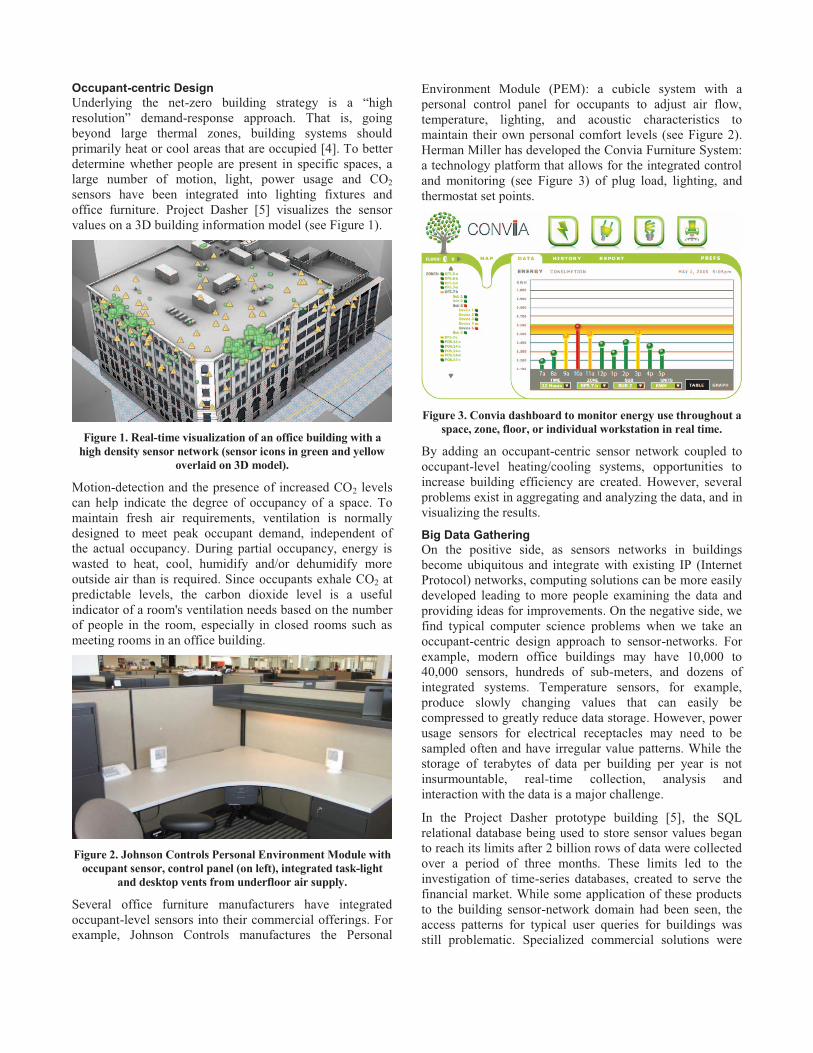
Figure 2. Johnson Controls Personal Environment Module with
occupant sensor, control panel (on left), integrated task-light and desktop vents from underfloor air supply.
Several office furniture manufacturers have integrated occupant-level sensors into their commercial offerings. For example, Johnson Controls manufactures the Personal
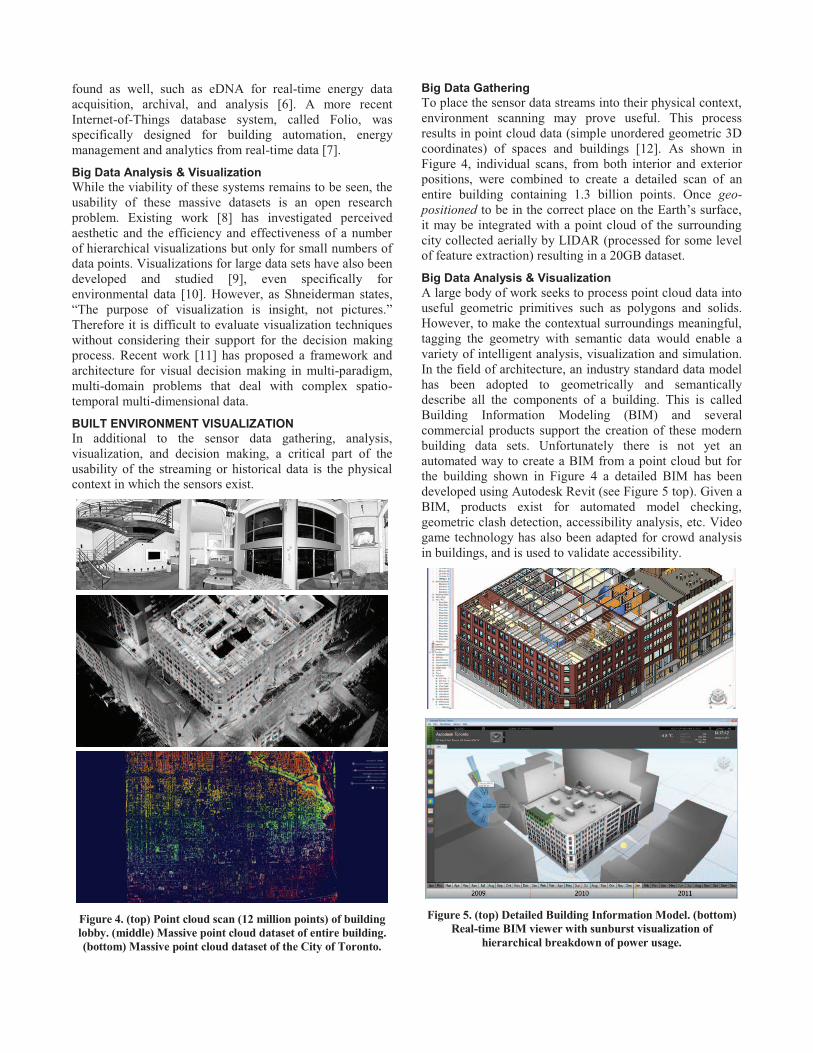
Environment Module (PEM): a cubicle system with a personal control panel for occupants to adjust air flow, temperature, lighting, and acoustic characteristics to maintain their own personal comfort levels (see Figure 2). Herman Miller has developed the Convia Furniture System: a technology platform that allows for the integrated control and monitoring (see Figure 3) of plug load, lighting, and thermostat set points.
Figure 3. Convia dashboard to monitor energy use throughout a
space, zone, floor, or individual workstation in real time.
By adding an occupant-centric sensor network coupled to occupant-level heating/cooling systems, opportunities to increase building efficiency are created. However, several problems exist in aggregating and analyzing the data, and in visualizing the results.
Big Data Gathering On the positive side, as sensors networks in buildings become ubiquitous and integrate with existing IP (Internet Protocol) networks, computing solutions can be more easily developed leading to more people examining the data and providing ideas for improvements. On the negative side, we find typical computer science problems when we take an occupant-centric design approach to sensor-networks. For example, modern office buildings may have 10,000 to 40,000 sensors, hundreds of sub-meters, and dozens of integrated systems. Temperature sensors, for example, produce slowly changing values that can easily be compressed to greatly reduce data storage. However, power usage sensors for electrical receptacles may need to be sampled often and have irregular value patterns. While the storage of terabytes of data per building per year is not insurmountable, real-time collection, analysis and interaction with the data is a major challenge.
In the Project Dasher prototype building [5], the SQL relational database being used to store sensor values began to reach its limits after 2 billion rows of data were collected over a period of three months. These limits led to the investigation of time-series databases, created to serve the financial market. While some application of these products to the building sensor-network domain had been seen, the access patterns for typical user queries for buildings was still problematic. Specialized commercial solutions were
found as well, such as eDNA for real-time energy data acquisition, archival, and analysis [6]. A more recent Internet-of-Things database system, called Folio, was specifically designed for building automation, energy management and analytics from real-time data [7].
Big Data Analysis & Visualization While the viability of these systems remains to be seen, the usability of these massive datasets is an open research problem. Existing work [8] has investigated perceived aesthetic and the efficiency and effectiveness of a number of hierarchical visualizations but only for small numbers of data points. Visualizations for large data sets have also been developed and studied [9], even specifically for environmental data [10]. However, as Shneiderman states, “The purpose of visualization is insight, not pictures.” Therefore it is difficult to evaluate visualization techniques without considering their support for the decision making process. Recent work [11] has proposed a framework and architecture for visual decision making in multi-paradigm, multi-domain problems that deal with complex spatio-temporal multi-dimensional data.
BUILT ENVIRONMENT VISUALIZATION In additional to the sensor data gathering, analysis, visualization, and decision making, a critical part of the usability of the streaming or historical data is the physical context in which the sensors exist.
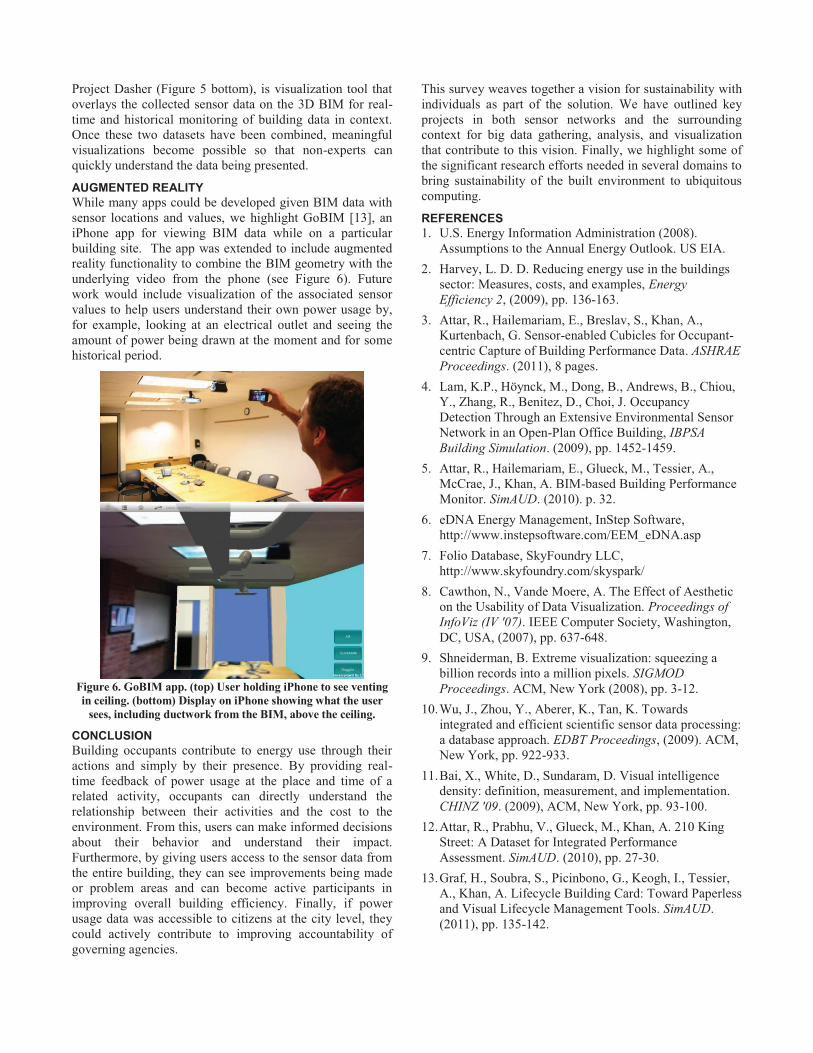
Figure 4. (top) Point cloud scan (12 million points) of building lobby. (middle) Massive point cloud dataset of entire building. (bottom) Massive point cloud dataset of the City of Toronto.
Big Data Gathering To place the sensor data streams into their physical context, environment scanning may prove useful. This process results in point cloud data (simple unordered geometric 3D coordinates) of spaces and buildings [12]. As shown in Figure 4, individual scans, from both interior and exterior positions, were combined to create a detailed scan of an entire building containing 1.3 billion points. Once geo-positioned to be in the correct place on the Earth’s surface, it may be integrated with a point cloud of the surrounding city collected aerially by LIDAR (processed for some level of feature extraction) resulting in a 20GB dataset.
Big Data Analysis & Visualization A large body of work seeks to process point cloud data into useful geometric primitives such as polygons and solids. However, to make the contextual surroundings meaningful, tagging the geometry with semantic data would enable a variety of intelligent analysis, visualization and simulation. In the field of architecture, an industry standard data model has been adopted to geometrically and semantically describe all the components of a building. This is called Building Information Modeling (BIM) and several commercial products support the creation of these modern building data sets. Unfortunately there is not yet an automated way to create a BIM from a point cloud but for the building shown in Figure 4 a detailed BIM has been developed using Autodesk Revit (see Figure 5 top). Given a BIM, products exist for automated model checking, geometric clash detection, accessibility analysis, etc. Video game technology has also been adapted for crowd analysis in buildings, and is used to validate accessibility.
Figure 5. (top) Detailed Building Information Model. (bottom)
Real-time BIM viewer with sunburst visualization of hierarchical breakdown of power usage.
Project Dasher (Figure 5 bottom), is visualization tool that overlays the collected sensor data on the 3D BIM for real-time and historical monitoring of building data in context. Once these two datasets have been combined, meaningful visualizations become possible so that non-experts can quickly understand the data being presented.
AUGMENTED REALITY While many apps could be developed given BIM data with sensor locations and values, we highlight GoBIM [13], an iPhone app for viewing BIM data while on a particular building site. The app was extended to include augmented reality functionality to combine the BIM geometry with the underlying video from the phone (see Figure 6). Future work would include visualization of the associated sensor values to help users understand their own power usage by, for example, looking at an electrical outlet and seeing the amount of power being drawn at the moment and for some historical period.
Figure 6. GoBIM app. (top) User holding iPhone to see venting in ceiling. (bottom) Display on iPhone showing what the user
sees, including ductwork from the BIM, above the ceiling.
CONCLUSION Building occupants contribute to energy use through their actions and simply by their presence. By providing real-time feedback of power usage at the place and time of a related activity, occupants can directly understand the relationship between their activities and the cost to the environment. From this, users can make informed decisions about their behavior and understand their impact. Furthermore, by giving users access to the sensor data from the entire building, they can see improvements being made or problem areas and can become active participants in improving overall building efficiency. Finally, if power usage data was accessible to citizens at the city level, they could actively contribute to improving accountability of governing agencies.
This survey weaves together a vision for sustainability with individuals as part of the solution. We have outlined key projects in both sensor networks and the surrounding context for big data gathering, analysis, and visualization that contribute to this vision. Finally, we highlight some of the significant research efforts needed in several domains to bring sustainability of the built environment to ubiquitous computing.
REFERENCES 1. U.S. Energy Information Administration (2008).
Assumptions to the Annual Energy Outlook. US EIA. 2. Harvey, L. D. D. Reducing energy use in the buildings
sector: Measures, costs, and examples, Energy Efficiency 2, (2009), pp. 136-163.
3. Attar, R., Hailemariam, E., Breslav, S., Khan, A., Kurtenbach, G. Sensor-enabled Cubicles for Occupant-centric Capture of Building Performance Data. ASHRAE Proceedings. (2011), 8 pages.
4. Lam, K.P., Höynck, M., Dong, B., Andrews, B., Chiou, Y., Zhang, R., Benitez, D., Choi, J. Occupancy Detection Through an Extensive Environmental Sensor Network in an Open-Plan Office Building, IBPSA Building Simulation. (2009), pp. 1452-1459.
5. Attar, R., Hailemariam, E., Glueck, M., Tessier, A., McCrae, J., Khan, A. BIM-based Building Performance Monitor. SimAUD. (2010). p. 32.
6. eDNA Energy Management, InStep Software, http://www.instepsoftware.com/EEM_eDNA.asp
7. Folio Database, SkyFoundry LLC, http://www.skyfoundry.com/skyspark/
8. Cawthon, N., Vande Moere, A. The Effect of Aesthetic on the Usability of Data Visualization. Proceedings of InfoViz (IV '07). IEEE Computer Society, Washington, DC, USA, (2007), pp. 637-648.
9. Shneiderman, B. Extreme visualization: squeezing a billion records into a million pixels. SIGMOD Proceedings. ACM, New York (2008), pp. 3-12.
10. Wu, J., Zhou, Y., Aberer, K., Tan, K. Towards integrated and efficient scientific sensor data processing: a database approach. EDBT Proceedings, (2009). ACM, New York, pp. 922-933.
11. Bai, X., White, D., Sundaram, D. Visual intelligence density: definition, measurement, and implementation. CHINZ '09. (2009), ACM, New York, pp. 93-100.
12. Attar, R., Prabhu, V., Glueck, M., Khan, A. 210 King Street: A Dataset for Integrated Performance Assessment. SimAUD. (2010), pp. 27-30.
13. Graf, H., Soubra, S., Picinbono, G., Keogh, I., Tessier, A., Khan, A. Lifecycle Building Card: Toward Paperless and Visual Lifecycle Management Tools. SimAUD. (2011), pp. 135-142.