binghamton university financial report · each may, the university ... of research, grants and...
TRANSCRIPT

BINGHAMTON UNIVERSITY
FINANCIAL REPORT 2011-17
REPORT FROM THE PRESIDENT AND PROVOST, FALL 2017

1. Income, Expenses, and Enrollment . . . . . . .2
2. Observations and Future Directions . . . . . 12
3. University Budgeting Procedures . . . . . . . 12
BINGHAMTON UNIVERSITY
FINANCIAL REPORT 2011-17
REPORT FROM THE PRESIDENT AND PROVOST, FALL 2017

R E P O R T F R O M T H E P R E S I D E N T A N D P R O V O S T, FA L L 2 0 1 7 | 1
To Binghamton University Colleagues:
The following document describes the various sources of revenue received by Binghamton University and how these funds have been spent over the past six years. It is our intention to use this format to produce an annual financial statement that will be submitted to the Faculty Senate and Professional
Staff Senate, and posted publicly on our website at binghamton.edu/financeandbudgeting.
In past years this information was provided in a document titled Disbursement Report, from which much of the data for this document was derived. The main differences between this document and past Disbursement Reports is the presentation of multi-year data, a preface that describes the various sources of revenue received by the University, and a parallel reporting of enrollment by school and college.
The second part of this document describes the process used at Binghamton to allocate funds to divisions, schools and colleges.
We hope this information is presented in a way that allows any of our stakeholders to understand how our financial status has evolved over the past several years.
If you have questions or comments on this report and the information contained within, please contact us.
Thank you for opening and reviewing this important document describing the financial health of our University.
Sincerely,
Harvey StengerPresident
Don NiemanProvost and Executive Vice President for Academic Affairs
2 | B I N G H A M T O N U N I V E R S I T Y F I N A N C I A L R E P O R T 2 0 1 1 - 2 0 1 7
INCOMEThere are six types of income received by the University: State Purpose, State University Tuition Reimbursement Account, Income Fund Reimbursement, Dormitory Income Fund Reimbursement, Research Foundation Income and Binghamton University Foundation Income.
1. State Purpose Income:
State Purpose income comes from three sources: tuition payments by students; legislative appropriations; and legislative appropriations to SUNY that are then disbursed to campuses (called University Wide funds). More than 90 percent of State Purpose dollars pay faculty and staff salaries.
Legislative appropriations are approved annually by the governor and state legislature and, as was required by the NYSUNY 2020 legislation of 2011, have been approximately constant for the last five years. However, the legislation has expired and the promise of no reduction is a year-to-year decision. Tuition payments are the largest source of State Purpose income. This income is technically state revenue. Typically, it is returned to SUNY and allocated to the University. However, the state is not required to return tuition to the University, and in the past it has kept a portion to help resolve state budget shortfalls. A significant benefit of this model is that tuition revenue is returned to the University as State Purpose income and carries with it fringe benefits. As a result, it can be used to pay faculty and staff without incurring additional charges for fringe benefits, which are approximately 61.5 percent of an employee’s salary. This represents a significant investment by the state in SUNY campuses that may go unrecognized when viewing the University’s budget.
Most University Wide funds also come with fringe benefits and are used for specific programs such as Academic Equipment Replacement (AER), Child Care Centers, Empire Innovation Program (EIP), Empire State Scholarships, Educational Opportunity Program (EOP), Faculty Diversity Program, Graduate Diversity Fellowships, High Needs Program, Library Conservation & Preservation, Small Business Development Center (SBDC), Student Loans, Student Support Services and State University Scholarships (SUSTA). This is approximately 5 percent of the State Purpose income provided by the legislature.
1. INCOME, EXPENSES, AND ENROLLMENT
Each May, the University submits an estimate of the tuition that our students will pay over the course of the upcoming academic year. This includes estimates of tuition from all sources, including direct payments by students and their parents; collection of financial aid from state, federal and private sources; and tuition paid by internal University sources for graduate, teaching and research assistants. Our estimates must also take into account the mix of students we plan to enroll — in-state, out-of-state, graduate and undergraduate. An accurate estimate is important because it helps us predict the State Purpose tuition funds we will have available during the upcoming academic year. If we overestimate tuition revenue, we must return funds to the state; if we underestimate, we forego revenue that can be used to support our academic mission. These State Purpose funds must be spent within the fiscal year (July 1 to June 30) they are received.
2. State University Tuition Reimbursement Account (SUTRA):
SUTRA income is derived from tuition revenue collected from summer session, contract courses, overseas academic programs and over-target tuition revenue from the academic year. While a portion of this income remains with SUNY, the remainder is returned to the campus as fringe-bearing funds.
3. Income Fund Reimbursement (IFR):
IFR income is received from various sources, the largest of which is student fees. The definition of each student fee is provided here: binghamton.edu/student-accounts/mandatory-fees-2016-17.pdf.
The amount of each of these fees for 2016–17 is found in this document: binghamton.edu/student-accounts/Tuition%20and%20Fee%20Rates%202016-2017.pdf.
The process for establishing and setting student fees is governed by policies set by the SUNY Board of Trustees and is shown here: binghamton.edu/operations/policies/business-affairs/policies-student-fees.html.
Other sources of IFR income include payments by outside contractors and customers such as our food service contractor and our bookstore contractor, ticket sales for athletic events

R E P O R T F R O M T H E P R E S I D E N T A N D P R O V O S T, FA L L 2 0 1 7 | 3
and performances, and other smaller income sources such as vending machines and parking fees. These income sources are treated differently from academic year tuition and our legislative appropriation in that they do not carry employee fringe benefits. Therefore, if an employee is paid using IFR income, the actual cost of the employee is approximately 1.587 times the salary of the employee.
4. Dormitory Income Fund Reimbursement (DIFR):
This income is predominantly room rent paid by students living on campus. This income goes to pay residence hall staff, reimburse the campus for utilities and services such as cleaning and repairs, and to pay the cost of debt borrowed to construct residence halls. Debt service is the majority of the costs allocated to the DIFR income.
5. Research Foundation Income (RF):
The majority of RF income is received through grants and contracts awarded to faculty and staff and is used to conduct research projects that incur direct and indirect costs to the campus. These grants and contracts are technically between an external agency (NIH, NSF, DOE, etc.) and the SUNY Research Foundation (SUNY RF), not the University. SUNY RF was created to allow SUNY campuses to conduct funded research projects without following the cumbersome policies and procedures that sometimes govern state expenditures. RF income is also received through royalty payments made to SUNY RF for the right to license intellectual property (patents). Patents held by faculty members are technically owned by the Research Foundation but are assigned to Binghamton University.
Research grant and contract income is divided into direct costs and indirect costs. The direct costs are those billed directly to the grant or contract such as salary, employee fringe benefits, tuition, equipment, supplies, travel, etc. To defray the indirect costs of research, grants and contracts are charged an indirect cost assessment that is used to pay for research infrastructure that would be difficult to allocate precisely to each project cost item. These include the cost of space, utilities, administration and libraries.
6. Binghamton University Foundation Income (BUF):
Gifts to the University from alumni, foundations and friends are technically given to the Binghamton University Foundation, a separate not-for-profit 501(c)(3) corporation that was established by Binghamton University to allow it to receive gifts on behalf of Binghamton University, and to manage and expend funds in a manner consistent with the intentions of donors and the University’s mission. Like SUNY RF, the Binghamton University Foundation has greater flexibility in investing and expending funds than does the University. As a 501 (c)(3), gifts to the Foundation are tax deductible.
The Foundation allows the University to use the gifts it receives to strengthen programs and support students and faculty. Gifts to the University come as either restricted or unrestricted funds. Examples of restricted income include gifts that donors specify to fund a student scholarship, an endowed faculty position or an academic program. The Foundation Board of Directors has the responsibility to assure that these restricted gifts are for appropriate purposes, and that they are allocated following the specifications of the donor. Unrestricted income, which is a small portion of gifts received, is allocated by the Foundation Board of Directors.
4 | B I N G H A M T O N U N I V E R S I T Y F I N A N C I A L R E P O R T 2 0 1 1 - 2 0 1 7
EXPENSES
For the most part, the University spends the income received in each of the six categories listed above during the year the income is received. State Purpose funds (legislative appropriation, tuition and University Wide funds) must be spent within the year they are received and must follow state expenditure rules and procedures. IFR and DIFR income are also state funds and therefore must follow state expenditure rules and procedures; however, they do not have to be completely spent in the year they are received. RF funds are slightly more flexible than state funds; however, they must follow the rules and procedures of the funding agency, which can be the federal government, state government, private foundations or corporations. BUF funds are more flexible than RF funds; however, they must follow the restrictions of donors, IRS guidelines and Foundation policies.
IFR, DIFR, RF and BUF funds do not have to be spent in the year they are received and can be carried forward from one year to the next. However, IFR and DIFR balances are observable by SUNY and the state Budget Office and can be considered reserves that should be spent first, before asking for more state allocations. The current fund balances of IFR and DIFR accounts is approximately $60 million; or about 20 percent of our annual All-Funds Budget.
University Expenditures
Reporting of expenses is provided annually in the University’s publicly issued Disbursement Report. Other than State Purpose funds which must be spent in the year they are received as income, expenses do not necessarily equal income, due to the ability to carry balances in IFR, DIFR, RF and BUF accounts; however, they are closely related, since divisions and units typically carry forward balances — on the order of 10 to 20 percent of one year’s expenditures.
University expenditures for the past six years, as well as a forecast for 2017–18, are shown in Table 1A and Figure 1. Between 2011–12 and 2016–17, total expenses for Binghamton University, have grown by $84 million (28.6 percent). The revenue for these expenditures came from growth in tuition ($45.3 million), IFR ($21.9 million) and DIFR ($4.0 million). Figure 1 and Table 1B show the change in enrollment during this period, when our average annual full-time equivalent enrollment (AAFTE) increased by 2,259 (16.9 percent).
The first level of expense assignments is to University divisions. As of the 2014–15 academic year, the University is comprised of eight divisions: academic affairs; advancement; student affairs; research; operations; athletics; the Binghamton University Foundation; and the Division of Diversity, Equity and Inclusion.
REORGANIZATIONS IMPACTING EXPENDITURE REPORTING: Between 2010–11 and 2015–16, five separate reorganizations have moved units between divisions and created new divisions.
1. In 2012–13, Communications and Marketing was moved from the Division of External Affairs to the Division of Academic Affairs, and the Division of External Affairs was renamed the Division of Advancement. Simultaneously, the Foundation was separated from external affairs and was made a division.
2. In 2012–13, Parking Services and Auxiliary Services, which includes our dining services contract, were moved to the Division of Student Affairs from the Division of Administration.
3. In 2012–13, the Office of Diversity, Equity and Inclusion was created and in 2014–15, it was renamed the Division of Diversity, Equity and Inclusion.
4. In 2013–14, Student Accounts, Purchasing, Accounting, Business Services, Educational Communications, and International Student and Scholars Services were moved to the Division of Academic Affairs. The resulting Division of Administration was renamed the Division of Operations.
5. In 2014–15, the Athletics Department was moved from the Division of Administration and was established as a division.
The impact of these reorganizations on expenditures by division can be seen in the tables and charts in this report.

R E P O R T F R O M T H E P R E S I D E N T A N D P R O V O S T, FA L L 2 0 1 7 | 5
0
2,000
4,000
6,000
8,000
10,000
12,000
14,000
16,000
18,000
$0
$20,000
$40,000
$60,000
$80,000
$100,000
$120,000
$140,000
$160,000
2011-12 2012-13 2013-14 2014-15 2015-16 2016-17 2017-18
Enr
ollm
ent
tota
l AA
FT
E
Exp
end
itur
es (
$1,
00
0)
Figure 1: Expenditures/Enrollment by fund type
Tuition IFR Legislat. Approp. RF DIFR Foundation Enrollment AAFTE
*Estimated prior to year-end closeout **Forecasted prior to full allocation
FIGURE 1: Expenditures/Enrollment by fund typeexpenditures in thousands of dollars/enrollment total AAFTE
TABLE 1A: Binghamton University expenditures by fund type in thousands of dollars
2011-12 2012-13 2013-14 2014-15 2015-16 2016-17* 2017-18**
State Purpose
Legislative Appropriation $48,011 $48,333 $48,333 $48,800 $48,630 $48,333 $48,799
Tuition $103,069 $107,825 $116,658 $124,889 $140,575 $148,327 $151,040
Total $151,080 $156,158 $164,991 $173,689 $189,205 $196,660 $199,839
Income Fund Reimbusement $64,448 $58,236 $68,872 $75,322 $80,736 $86,414 $90,755
Dormitory Income Fund Reimbursement $27,746 $29,093 $31,594 $32,778 $31,779 $31,728 $32,680
Research Foundation
Direct Costs $32,251 $27,901 $25,625 $29,471 $30,107 $32,617 $34,285
Indirect Costs $5,725 $6,570 $6,317 $6,695 $8,935 $7,830 $8,060
Total $37,976 $34,471 $31,942 $36,166 $39,042 $40,447 $42,345
Binghamton University Foundation
Unrestricted $4,340 $6,222 $3,071 $3,364 $4,535 $4,294 $4,630
Restricted $8,238 $11,978 $11,038 $12,026 $14,581 $18,318 $22,600
Total $12,578 $18,200 $14,109 $15,390 $19,115 $22,612 $27,230
Grand Total $293,828 $296,158 $311,508 $333,345 $359,877 $377,861 $392,849
*Estimated prior to year-end closeout **Forecasted prior to full allocation
TABLE 1B: Binghamton University enrollment
2011-12 2012-13 2013-14 2014-15 2015-16 2016-17
Total Undergraduate AAFTE 11,418 11,836 12,474 12,833 12,984 13,108
Undergraduate AAFTE, In-state 9,154 9,423 10,069 10,560 10,945 11,238
Undergraduate AAFTE, Out-of-state 2,264 2,413 2,405 2,273 2,039 1,870
Total Graduate AAFTE 1,933 2,019 2,150 2,298 2,400 2,502
Graduate AAFTE, In-state 1,214 1,247 1,203 1,179 1,173 1,247
Graduate AAFTE, Out-of-state 719 772 947 1,119 1,227 1,255
Total AAFTE 13,351 13,855 14,624 15,131 15,384 15,610
Total Headcount 14,746 15,308 16,077 16,695 16,913 17,292
l Tuition l IFR l Legislat . Approp . l RF l DIFR l Foundation ▲ Enrollment AAFTE
2011–12 2012–13 2013–14 2014–15 2015–16 2016–17* 2017–18**

6 | B I N G H A M T O N U N I V E R S I T Y F I N A N C I A L R E P O R T 2 0 1 1 - 2 0 1 7
STATE PURPOSE EXPENDITURES BY DIVISION: Table 2 and Figure 2 show University expenditures of State Purpose funds for each division for five years (2011–12 to 2015–16), an estimate for 2016–17, and a forecast for 2017–18. These show that University State Purpose expenditures have grown by $45.5 million (30.1 percent) between 2011–12 and 2016–17, and that the majority of the increase has occurred in the Division of Academic Affairs ($39.7 million). Some increases in academic affairs are due to the reassignment of functions from external affairs/advancement in 2013–14 ($1.7 million) and from administration/operations in 2014–15 ($3.7 million) to academic affairs. These reorganizations represent a total financial impact of $5.4 million or 4 percent of the expenditures of the Division of Academic Affairs.
In 2011–12, the Division of Academic Affairs spent 71.7 percent of the University’s State Purpose income, and in 2016–17 it spent 75.3 percent of the University’s State Purpose income. The percentage change between 2011–12 and 2016–17 results mainly from the reorganizations described above.
INCOME FUND REIMBURSEMENT EXPENDITURES: Table 3 and Figure 3 show University expenditures of IFR income for each division for the past five years, an estimate for 2016–17, and a forecast for 2017–18. IFR expenditures, shown in Table 1, have grown by $21.9 million (34.1 percent) between 2011–12 and 2016–17, as a result of increasing student fee income from increased enrollment and annual increases in fee rates. The large shift of IFR expenditures from the divisions of Administration to Student Affairs in 2013–14, shown in Table 3 and Figure 3, is a result of moving the management of the University’s dining services contract from the Division of Administration to the Division of Student Affairs.

R E P O R T F R O M T H E P R E S I D E N T A N D P R O V O S T, FA L L 2 0 1 7 | 7
FIGURE 2: State Purpose expenditures in thousands of dollars FIGURE 3: IFR expenditures in thousands of dollars
*Estimated prior to year-end closeout **Forecasted prior to full allocation *Estimated prior to year-end closeout **Forecasted prior to full allocation
TABLE 2: State Purpose expenditures in thousands of dollars
2011-12 2012-13 2013-14 2014-15 2015-16 2016-17* 2017-18**
Academic Affairs $108,329 $112,384 $120,883 $128,707 $141,003 $148,104 $150,498
Administration/Operations1 $31,482 $31,994 $33,507 $29,838 $31,413 $31,450 $31,537
Research $2,477 $2,507 $2,304 $2,425 $2,716 $2,740 $2,748
Student Affairs $4,379 $4,787 $5,226 $5,181 $5,568 $5,634 $5,649
External Affairs/Advancement2 $3,494 $3,428 $1,728 $1,479 $1,768 $1,912 $1,918
President $919 $1,058 $1,343 $1,628 $1,880 $1,918 $1,923
Athletics3 $3,529 $3,893 $3,812 $3,822
BU Foundation3 $410 $414 $371 $372
DDEI4 $492 $551 $719 $721
Total $151,080 $156,158 $164,991 $173,689 $189,206 $196,660 $199,188
Academic Affairs (%) 71 .7% 72 .0% 73 .3% 74 .1% 74 .5% 75 .3% 75 .6%
1 . Administration Division renamed Operations in 2013–14 *Estimated prior to year-end closeout **Forecasted prior to full allocation2 . External Affairs renamed Advancement in 2012–13 3 . Athletics and Foundation separated from Administration in 2014–15 4 . DDEI created from Administration and Road Map
TABLE 3: Income Fund Reimbursement expenditures in thousands of dollars
2011-12 2012-13 2013-14 2014-15 2015-16 2016-17 * 2017-18**
Academic Affairs $5,177 $7,040 $9,292 $13,910 $14,697 $15,730 $16,521
Administration/Operations1 $47,129 $38,138 $16,521 $12,556 $13,460 $14,406 $15,130
Research $2,257 $1,666 $2,053 $1,159 $2,204 $2,359 $2,477
Student Affairs $9,373 $10,687 $40,700 $37,502 $39,448 $42,223 $44,344
ExternalAffairs/Advancement2 $27 $0 $0 $34 $36 $39 $41
President $485 $705 $306 $314 $337 $360 $378
Athletics3 $9,847 $10,555 $11,297 $11,865
Total $64,448 $58,236 $68,872 $75,322 $80,736 $86,414 $90,755
1 . Administration Division renamed Operations in 2013–14 *Estimated prior to year-end closeout **Forecasted prior to full allocation 2 . External Affairs renamed Advancement in 2012–13 3 . Athletics separated from Administration in 2014–15
$0
$20,000
$40,000
$60,000
$80,000
$100,000
$120,000
$140,000
$160,000
2011-12 2012-13 2013-14 2014-15 2015-16 2016-17 2017-18**
Figure 2: State Purpose expenditures in thousands of dollars
Academic Affairs Admin/Operations Research
Student Affairs External/Advancement President
Athletics
$0
$5,000
$10,000
$15,000
$20,000
$25,000
$30,000
$35,000
$40,000
$45,000
$50,000
2011-12 2012-13 2013-14 2014-15 2015-16 2016-17 2017-18**
Figure 3: IFR Expenditures
Academic Affairs Admin/Operations Research
Student Affairs External/Advancement President
Athletics
l Academic Affairs l Administration/Operations l Research l Student Affairs l External Affairs/Advancement l President l Athletics
l Academic Affairs l Administration/Operations l Research l Student Affairs l External Affairs/Advancement l President l Athletics
2011–12 2012–13 2013–14 2014–15 2015–16 2016–17* 2017–18** 2011–12 2012–13 2013–14 2014–15 2015–16 2016–17* 2017–18**

8 | B I N G H A M T O N U N I V E R S I T Y F I N A N C I A L R E P O R T 2 0 1 1 - 2 0 1 7
FIGURE 4: Academic Affairs: General AdministrationState Purpose expenditures and enrollment
*Estimated prior to year-end closeout **Forecasted prior to full allocation
FIGURE 5: Academic Affairs: Libraries and GraduateSchool State Purpose expenditures and enrollment
*Estimated prior to year-end closeout
Expenses: Academic Affairs Breakdown
The scale and complexity of the Division of Academic Affairs, which in 2016–17 accounted for 75.3 percent of the University’s State Purpose expenditures ($148.1 million), warrants that it be analyzed with respect to the distribution of expenses by schools/colleges/units of the division. These units include: General Administration (admissions, financial aid, international affairs, vice provost of administration, communications and marketing, business office, planning and budgeting), Graduate School, Libraries, Harpur College of Arts and Sciences, Thomas J. Watson School of Engineering and Applied Science, School of Management, Decker School of Nursing, Graduate School of Education, College of Community and Public Affairs and the School of Pharmacy and Pharmaceutical Sciences.
GENERAL ADMINISTRATION: Table 4 and Figure 4 show the changes in State Purpose funds used to support the General Administration activities of the Academic Affairs Division from 2011–12 to 2016–17. This data is shown together with the
total AAFTE (average annual full-time equivalent) enrollment taken from Table 1B, to gain an appreciation for the efficiencies achieved during our recent period of growth.
A low growth rate in General Administration expenses compared to enrollment growth is consistent with efficient growth, and is illustrated in Figure 4 when comparing the blue (enrollment) and green (expenditures) lines. Also shown in Figure 4, by the dark green line, is the effect of subtracting the expenditure impact of the two reorganizations that occurred in academic affairs in 2013–14 and 2014–15. This shows that the General Administration expenditures of the Division of Academic Affairs (dark green line) grew significantly slower than enrollment.
LIBRARIES: The data in Table 5 and Figure 5 show expenditure data and graphs of the Libraries for the past six years. These expenditures show that the Libraries’ budget lagged enrollment growth until 2014–15, when it was a focus of both Road Map and Provost Office increases.
TABLE 4: Academic Affairs: General Administration State Purpose expenses versus enrollment (AAFTE)
2011-12 2012-13 2013-14 2014-15 2015-16 2016-17* 2017-18**
State Purpose Expenses ($K) $10,590 $12,364 $17,764 $19,852 $22,488 $24,832 $25,577
State Purpose Expenses ($K) w/o Reorg . $10,590 $12,364 $14,504 $13,362 $15,741 $17,382 $17,904
Total AAFTE Enrollment 13,351 13,855 14,624 15,131 15,384 15,610
Starting in 2013-14, Communications and Marketing is included in State Purpose expenses *Estimated prior to year-end closeout **Forecasted prior to full allocation
12,500
13,000
13,500
14,000
14,500
15,000
15,500
16,000
$0
$5,000
$10,000
$15,000
$20,000
$25,000
$30,000
2011-12 2012-13 2013-14 2014-15 2015-16 2016-17 2017-18
Tota
l AA
FT
E e
nro
llmen
t
Exp
ense
s ($
1,0
00
's)
Figure 4: Academic Affairs: General Administration State Purpose expenditures and enrollment
Gen. Admin. Acad. Aff. Gen. Admin. Acad. Aff. w/o Reorg. Enrollment
12,500
13,000
13,500
14,000
14,500
15,000
15,500
16,000
$0
$2,000
$4,000
$6,000
$8,000
$10,000
$12,000
$14,000
$16,000
2011-12 2012-13 2013-14 2014-15 2015-16 2016-17
Tota
l AA
FT
E E
nro
llmen
t
Exp
end
itur
es (
$1,
00
0's
)
Figure 5: Academic Affairs: Libraries and Graduate School State Purpose expenditures and enrollment
Libraries Graduate School Enrollmentl Gen . Admin . / Academic Affairs l Gen . Admin . / Academic Affairs without reorg . ▲ Enrollment l Libraries l Graduate School ▲ Enrollment
2011–12 2012–13 2013–14 2014–15 2015–16 2016–17* 2017–18** 2011–12 2012–13 2013–14 2014–15 2015–16 2016–17*

R E P O R T F R O M T H E P R E S I D E N T A N D P R O V O S T, FA L L 2 0 1 7 | 9
TABLE 5: State Purpose Expenditures for Academic Affairs units: Values for figures 6 to 11 in thousands of dollars
2011—12 2012—13 2013—14 2014—15 2015—16 2016—17*
COLLEGE OF COMMUNITY AND PUBLIC AFFAIRSFaculty $2,317 $2,398 $2,592 $2,892 $3,339 $3,667
Staff 1,026 1,049 1,139 1,350 1,603 1,806
OTPS 57 — 72 189 319 272
Total 3,400 3,447 3,803 4,431 5,261 5,745
DECKER SCHOOL OF NURSINGFaculty $4,219 $4,435 $4,599 $4,881 $5,064 $4,991
Staff 1,127 1,045 1,035 1,067 1,026 1,232
OTPS 1 — — — — 38
Total 5,347 5,480 5,634 5,948 6,090 6,260
GRADUATE SCHOOL OF EDUCATIONFaculty $1,985 $1,857 $1,883 $2,110 $2,225 $2,013
Staff 459 452 517 512 378 336
OTPS 19 — 21 55 115 60
Total 2,463 2,309 2,421 2,677 2,718 2,408
HARPUR COLLEGE OF ARTS AND SCIENCESFaculty $46,835 $48,008 $47,731 $50,237 $52,984 $55,494
Staff 7,587 7,878 8,050 8,516 8,825 8,829
OTPS 142 — 67 242 559 335
Total 54,564 55,886 55,848 58,995 62,368 64,657
SCHOOL OF MANAGEMENTFaculty $5,802 $6,496 $6,247 $6,343 $6,984 $7,031
Staff 1,173 1,240 1,320 1,356 1,168 1,237
OTPS 589 153 532 416 352 615
Total 7,564 7,889 8,099 8,115 8,504 8,883
THOMAS J. WATSON SCHOOL OF ENGINEERING AND APPLIED SCIENCEFaculty $9,894 $10,433 $10,814 $11,848 $14,057 $14,336
Staff 3,151 3,162 3,163 3,195 3,592 3,861
OTPS 25 50 721 601 1,070 1,148
Total 13,070 13,645 14,698 15,644 18,719 19,345
SCHOOL OF PHARMACY AND PHARMACEUTICAL SCIENCESFaculty — — — — $325 $1,280
Staff — — — 52 648 1,076
OTPS — — — 75 319 188
Total — — — 127 1,292 2,545
LIBRARIESFaculty/Staff $4,384 $4,544 $4,526 $4,588 $4,379 $4,843
OTPS 5,540 5,509 5,683 6,661 7,432 7,415
Total 9,924 10,053 10,209 11,249 11,811 12,257
GRADUATE SCHOOLFaculty/Staff $1,407 $1,293 $2,397 $1,669 $1,750 $1,172
OTPS — 18 10 — 2 —
Total 1,407 1,311 2,407 1,669 1,752 1,172
TOTAL $97,739 $100,020 $103,119 $108,855 $118,515 $123,272
*Estimated prior to year-end closeout

1 0 | B I N G H A M T O N U N I V E R S I T Y F I N A N C I A L R E P O R T 2 0 1 1 - 2 0 1 7
6,124
432
6,371
445
6,773
422
7,192
373
7,423
359
7,649
370
1,456
322
1,542
323
1,594
305
1,492
326
1,359
344
1,284
353
$0
$10
$20
$30
$40
$50
$60
$70
0
1,000
2,000
3,000
4,000
5,000
6,000
7,000
8,000
9,000
10,000
UG Grad UG Grad UG Grad UG Grad UG Grad UG Grad
2011-2012 2012-2013 2013-2014 2014-2015 2015-2016 2016-2017
Exp
end
itur
e (i
n m
illio
ns)
Enr
ollm
ent
Figure 6: Expenditures and Enrollment for Harpur College of Arts and Sciences
Resident AAFTE Non-Resident AAFTE State Expenditure
Faculty Expenditure Staff Expenditure OTPS Expenditure
1,446
162
1,492
152
1,533
175
1,535
188
1,586
178
1,576
172
296
269
305
295
290
422
287
558
261
647
223
665
$0
$2
$4
$6
$8
$10
$12
$14
$16
$18
$20
0
200
400
600
800
1,000
1,200
1,400
1,600
1,800
2,000
UG Grad UG Grad UG Grad UG Grad UG Grad UG Grad
2011-2012 2012-2013 2013-2014 2014-2015 2015-2016 2016-2017
Exp
end
itur
e (i
n m
illio
ns)
Enr
ollm
ent
Figure 7: Expenditures and Enrollment for the Watson School of Engineering
Resident AAFTE Non-Resident AAFTE State Expenditure
Faculty Expenditure Staff Expenditure OTPS Expenditure
882
180
867
212
1,030
160
1,113
183
1,198
179
1,220
198
431
81
486
107
445
165
419
181
339
184
290
178
$0
$1
$2
$3
$4
$5
$6
$7
$8
$9
0
200
400
600
800
1,000
1,200
1,400
1,600
1,800
UG Grad UG Grad UG Grad UG Grad UG Grad UG Grad
2011-2012 0 2012-2013
0 2013-2014
0 2014-2015
0 2015-2016
0 2016-2017
0
Exp
end
itur
e (i
n m
illio
ns)
Enr
ollm
ent
Figure 8: Expenditures and Enrollment for the School of Management
Resident AAFTE Non-Resident AAFTE State Expenditure
Faculty Expenditure Staff Expenditure OTPS Expenditure
289
119
308
139
322
139
353
122
339
109
373
127
38
13
35
20
23
26
25
22
29
14
28
18
$0
$1
$2
$3
$4
$5
$6
0
50
100
150
200
250
300
350
400
450
UG Grad UG Grad UG Grad UG Grad UG Grad UG Grad
2011-2012 2012-2013 2013-2014 2014-2015 2015-2016 2016-2017
Exp
end
itur
e (i
n m
illio
ns)
Enr
ollm
ent
Figure 9: Expenditures and Enrollment for the Decker School of Nursing
Resident AAFTE Non-Resident AAFTE State Expenditure
Faculty Expenditure Staff Expenditure OTPS Expenditure
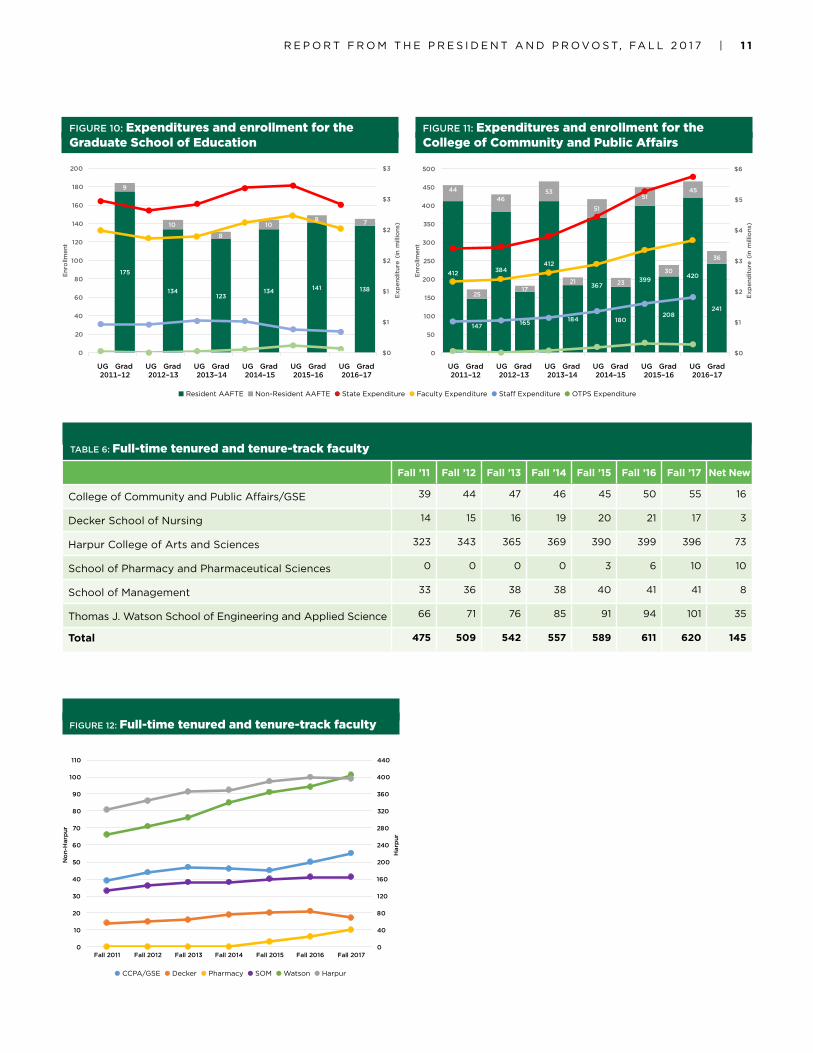
COLLEGES AND SCHOOLS: Table 5 and Figures 6 to 11 are values and graphs of State Purpose expenditures of each school and college and their corresponding enrollment of students. The student enrollment data for each school/college are the actual students taught by that school/college (AAFTE) and are divided into out-of-state, in-state, undergraduates and graduate students. The expenses are broken into three components: faculty salaries, staff salaries and OTPS (other than personnel services).
In general, the trends for all the schools and colleges show increasing enrollments and increasing expenditures, with a majority of these increases supporting faculty hiring (yellow lines in Figures 6 to 11).
An emphasis of our faculty hiring plan in the past five years has been to focus on hiring full-time tenured or tenure-track faculty (FTTTF). Nearly all of our new revenues used for faculty hires have been targeted toward FTTTF positions. Table 6 and Figure
12 show the changes in full-time tenure-track faculty over the past seven years by school/college.
The trends in expenditures make sense, as increasing enrollments drive increases in faculty hiring, which together with discretionary, across-the-board and promotional salary increases result in increases in faculty expenditures. However, it is difficult to judge if the proportionality of growth of expenditures and enrollment is similar for each school/college for a variety of reasons, including:
• Differential in tuition between in-state and out-of-state students.
• Differential in tuition rates between graduate and undergraduate programs.
• Time lags between enrollment changes and faculty hiring decisions.
• Salary differentials among ranks and disciplines.
FIGURE 6: Expenditures and enrollment for Harpur College of Arts and Sciences
FIGURE 7: Expenditures and enrollment for the Watson School of Engineering and Applied Science
FIGURE 8: Expenditures and enrollment for the School of Management
FIGURE 9: Expenditures and enrollment for the Decker School of Nursing
6,058
576
6,117
537
6,363
554
6,764
535
7,182
497
7,413
495
1,330
390
1,451
392
1,536
392
1,589
372
1,486
398
1,352
422
$0
$5
$10
$15
$20
$25
$30
$35
$40
$45
$50
$55
$60
$65
0
1,000
2,000
3,000
4,000
5,000
6,000
7,000
8,000
9,000
10,000
UG Grad UG Grad UG Grad UG Grad UG Grad UG Grad
2010-2011 2011-2012 2012-2013 2013-2014 2014-2015 2015-2016
Expe
nditu
re(inm
ilion
s)
Enrollm
ent
Figure 6:Expenditures andEnrollment forHarpurCollege ofArtsand Sciences
Resident AAFTE Non-Resident AAFTE StateExpenditure FacultyExpenditure StaffExpenditure OTPSExpenditure
UG Grad UG Grad UG Grad UG Grad UG Grad UG Grad 2011–12 2012–13 2013–14 2014–15 2015–16 2016–17
■ Resident AAFTE ■ Non-Resident AAFTE l State Expenditure l Faculty Expenditure l Staff Expenditure l OTPS Expenditure
UG Grad UG Grad UG Grad UG Grad UG Grad UG Grad 2011–12 2012–13 2013–14 2014–15 2015–16 2016–17
UG Grad UG Grad UG Grad UG Grad UG Grad UG Grad 2011–12 2012–13 2013–14 2014–15 2015–16 2016–17
UG Grad UG Grad UG Grad UG Grad UG Grad UG Grad 2011–12 2012–13 2013–14 2014–15 2015–16 2016–17
R E P O R T F R O M T H E P R E S I D E N T A N D P R O V O S T, FA L L 2 0 1 7 | 1 1
175
134123
134 141
0
138
9
10
8
108
0
7
$0
$1
$1
$2
$2
$3
$3
0
20
40
60
80
100
120
140
160
180
200
UG Grad UG Grad UG Grad UG Grad UG Grad UG Grad
2011-2012 2012-2013 2013-2014 2014-2015 2015-2016 2016-2017
Exp
end
itur
e (i
n m
illio
ns)
Enr
ollm
ent
Figure 10: Expenditures and Enrollment for the Graduate School of Education
Resident AAFTE Non-Resident AAFTE State Expenditure
Faculty Expenditure Staff Expenditure OTPS Expenditure
412
147
384
165
412
184
367
180
399
208
420
241
44
25
46
17
53
21
51
23
51
30
45
36
$0
$1
$2
$3
$4
$5
$6
0
50
100
150
200
250
300
350
400
450
500
UG Grad UG Grad UG Grad UG Grad UG Grad UG Grad
2011-2012 2012-2013 2013-2014 2014-2015 2015-2016 2016-2017
Exp
end
itur
e (i
n m
illio
ns)
Enr
ollm
ent
Figure 11: Expenditures and Enrollment for the College of Community and Public Affairs
Resident AAFTE Non-Resident AAFTE State Expenditure
Faculty Expenditure Staff Expenditure OTPS Expenditure
0
40
80
120
160
200
240
280
320
360
400
440
480
0
10
20
30
40
50
60
70
80
90
100
110
120
Fall 2011 Fall 2012 Fall 2013 Fall 2014 Fall 2015 Fall 2016 Fall 2017
Har
pur
No
n-H
arp
ur
Figure 12: Full-time tenured and tenure-track faculty
CCPA/GSE DSON PHARMACY SOM WATSON HARPUR
FIGURE 12: Full-time tenured and tenure-track faculty
FIGURE 10: Expenditures and enrollment for the Graduate School of Education
FIGURE 11: Expenditures and enrollment for the College of Community and Public Affairs
TABLE 6: Full-time tenured and tenure-track faculty
Fall ’11 Fall ’12 Fall ’13 Fall ’14 Fall ’15 Fall ’16 Fall ’17 Net New
College of Community and Public Affairs/GSE 39 44 47 46 45 50 55 16
Decker School of Nursing 14 15 16 19 20 21 17 3
Harpur College of Arts and Sciences 323 343 365 369 390 399 396 73
School of Pharmacy and Pharmaceutical Sciences 0 0 0 0 3 6 10 10
School of Management 33 36 38 38 40 41 41 8
Thomas J . Watson School of Engineering and Applied Science 66 71 76 85 91 94 101 35
Total 475 509 542 557 589 611 620 145
■ Resident AAFTE ■ Non-Resident AAFTE l State Expenditure l Faculty Expenditure l Staff Expenditure l OTPS Expenditure
l CCPA/GSE l Decker l Pharmacy l SOM l Watson l Harpur
UG Grad UG Grad UG Grad UG Grad UG Grad UG Grad 2011–12 2012–13 2013–14 2014–15 2015–16 2016–17
UG Grad UG Grad UG Grad UG Grad UG Grad UG Grad 2011–12 2012–13 2013–14 2014–15 2015–16 2016–17

1 2 | B I N G H A M T O N U N I V E R S I T Y F I N A N C I A L R E P O R T 2 0 1 1 - 2 0 1 7
The intent of this document is to help provide guidance to faculty, staff and students on the financial planning and operations of the University. When questions arise around these procedures or the information reported in our Financial Information report, we strongly encourage you to contact one of us directly at [email protected] or [email protected].
STATE TO SUNY: Several levels of budget-building procedures impact Binghamton’s operations. The first is the allocation of
State Purpose funds, which include legislative appropriations and student tuition, from the governor and the legislature to SUNY.
The second is the allocation of these State Purpose funds from SUNY to its campuses and its central operations.
While new, small, one-time funds have been allocated to SUNY through the state budget process, the majority of SUNY funding for both capital and operations has remained essentially constant since 2010-11.
3. UNIVERSITY BUDGETING PROCEDURES
During the past six years, Binghamton University has effectively used the provisions of the NYSUNY 2020 legislation to grow financial resources and has used these new resources to increase faculty and academic support-staff hiring.
It is important to note that as the schools and colleges grew and added new faculty members, the non-academic expenditures of State Purpose funds (tuition and state appropriation) were held nearly constant. Utilizing student fee IFR income that is assigned to specific activities, including residential life, athletics, dining services, technology, health, recreation and dedicated student services, the divisions of Operations, Student Affairs and Athletics grew at a rate comparable to our enrollment growth.
In the areas of research expenditures and philanthropy we lag behind our peers; however, due to the steady growth in faculty, especially tenure-track faculty, research expenditures have begun to increase in the past few years at a steady and consistent rate (Table 1A), a trend that is expected to continue. See the Division of Research annual report at binghamton.edu/research/vp/ fundingstatsannualrep.html. An increased emphasis on alumni rela- tions as well as an increase in staff and stronger strategic planning in our Division of Advancement has also resulted in a steady growth in cash gifts and new philanthropic commitments in the past three years (from $7.1 million in 2013-14 to $14.7 million in 2016-17).
Balanced growth across all divisions of the University, coupled with an increased focus on diversity and inclusion by all divisions, a commitment to the academic mission of all divisions and strong support from New York state for our capital construction needs (Center of Excellence, Smart Energy building, Pharmacy building, Johnson City Health Campus, and numerous renovation and repurposing projects) has steadily contributed to our continuous improvement of all aspects of our University.
2. OBSERVATIONS AND FUTURE DIRECTIONS
Certainly, the past five years have been a time of opportunities, and we have seized these opportunities by using our resources strategically to strengthen an already outstanding University.
However, the coming years hold uncertainty and we must plan accordingly. The state legislature, while maintaining our budget for 2017–18 at the 2016–17 level, has not reauthorized NYSUNY 2020, so future-year legislative appropriations are uncertain. With raises that may not be funded by the state anticipated for faculty and staff when union contracts are finalized, and only a modest $100-per-semester tuition increase for in-state undergraduates in 2017–18 approved by the legislature, our ability to appropriately grow our faculty will be limited.
We personally believe that a lesser quality university may look at this uncertainty as a signal to slow growth, reduce investment in projects aimed at improving their educational and research missions, and even prepare for a period of austerity. That is not our intent.
As we commit to continue our growth, it is important for us to find more sustainable sources of funding than increased undergraduate enrollment and state support. These additional sources include externally sponsored research; clinical research and development programs; philanthropy from alumni, friends and foundations; growth in graduate student enrollment; and increased capitalization of intellectual property.
In the upcoming fiscal year, we will focus on growing these sources of income, and each division, school and college will be asked to pursue plans and strategies that enhance these sources to allow us to grow in size and quality. If done properly and expeditiously, we will continue to make progress toward our ambitious yet achievable goals of 20,000 students by 2020 and to be recognized as the premier public university of the 21st century!
R E P O R T F R O M T H E P R E S I D E N T A N D P R O V O S T, FA L L 2 0 1 7 | 1 3
SUNY TO CAMPUSES: Each spring the campus submits its enrollment plan for the coming academic year. This plan is highly detailed, showing anticipated FTE enrollment by program and student demographics – in-state, out-of-state, undergraduate and graduate. A review by the financial office at SUNY is conducted to make sure the campus plan is achievable, and if so, funds are transferred from SUNY to the campus.
Once funds are allocated to Binghamton, two procedures have been developed and implemented during the past five years to permit campus-wide input on building our annual budgets: the faculty hiring process and the Road Map proposal process.
At Binghamton: Campus to Divisions and Units
FACULTY HIRING PROCESSES: Each spring the Provost’s Office issues a call to schools, colleges and departments to submit requests for new faculty positions. The deadline for these requests is approximately July 1. The form for 2018-19 requests can be found here: binghamton.edu/academics/provost/faculty-hire-form-2017-18.html.
Requests are then evaluated by the provost, president and deans to determine how well the position fits the needs of the University with respect to teaching, research and service. Decisions are made and new positions are announced after the 15th day of the fall semester to assure that our enrollment is adequate to support the positions allocated. The decision includes the rank, salary, department and Transdisciplinary Area of Excellence (TAE) if appropriate.
A second faculty hiring request is for core TAE positions. The form for 2018-19 can be found here: binghamton.edu/academics/provost/tae-hire-form.html.
The process for these positions is identical to that of all other faculty hires, except that the criteria is weighted more heavily toward the hire’s impact on the TAE-targeted area. Deans and the TAE steering committees are fully consulted in this process.
The third faculty hiring process: Schools and colleges may use their own resources — including those made available through retirements and resignations — to hire faculty and staff. Authorizations for these positions are subject to the approval of the provost and president.
ROAD MAP PROPOSAL PROCEDURE: The Road Map budget procedure has evolved since the Road Map was developed in Fall 2012. The guiding principles, however, remain the same: to allocate funds to projects that will best help the University achieve the goals of its strategic plan and engage the campus community in initiating those projects.
In Fall 2012, members of the nine teams that helped develop the Road Map advanced over 170 projects that were considered by the
Road Map Steering Committee for funding. Projects selected were funded for implementation in 2013-14 and 2014-15. Beginning in Fall 2013 and continuing through Fall 2015, the provost and president issued a call to the campus community requesting proposals that would make a significant impact on the University’s ability to advance its strategic plan. Final decisions on these proposals were made in the following summer using a process that included the Road Map Steering Committee in consultation with the Faculty Senate Budget Review Committee, the Professional Staff Senate and student leaders. Selected proposals were announced in July and funds allocated were made available the following July 1. Descriptions of the Road Map proposals funded during the past four years can be found here: binghamton.edu/president/road-map under the Funded Projects tab.
In order to build on the University’s previous successes and respond to changes in the higher education environment, the campus launched our Road Map Renewal. Renewal teams produced proposals that were presented to the Road Map Steering Committee in June 2017. With input from the Faculty Senate, Professional Staff Senate and student representatives, the Steering committee identified four proposals to be undertaken as “University Initiatives,” as well as ten “Divisional Initiatives” that would be advanced using divisional resources. The University Initiatives will:
• Develop a College of Nursing and Health Sciences• Establish a Health Sciences Core Facility• Advance a Data Science Initiative• Establish Presidential Diversity Post-Doctoral Fellowships
Faculty leaders have been chosen to implement each initiative, and are working to establish a vision and identify goals, metrics, targets costs and resources necessary for success. The Divisional Initiatives will be implemented by the appropriate vice presidents, and focus on projects where the University has opportunities for growth, significant need, or can increase the University’s impact.
INTERNAL DIVISIONAL BUDGET PROCEDURES: In addition to these University-level budget request and allocation procedures, each division, through its internal procedures, has freedom to reallocate its resources in ways it believes will enhance the ability of that division and the University to meet our strategic priorities.
Unit-Level Spending DecisionsSchools, colleges, departments and other units generate revenue through a variety of means: Summer and Winter Session courses, contract courses, research grants and contracts, philanthropy, incentives for exceeding graduate enrollment targets, etc. Units are free to allocate these resources in ways that advance their mission, subject to University regulations.

Office of the PresidentBinghamton University
PO Box 6000
Binghamton, NY 13902
binghamton .edu/president
17-648