broaden your horizons - bernstein€¦ · that you have an adequate allocation to developed...
TRANSCRIPT

OCTOBER 2017
BROADEN YOUR HORIZONS
2
While it’s been very rewarding to own US equities in recent years, now is the time to ensure that you have an adequate allocation to developed international and emerging markets stocks.
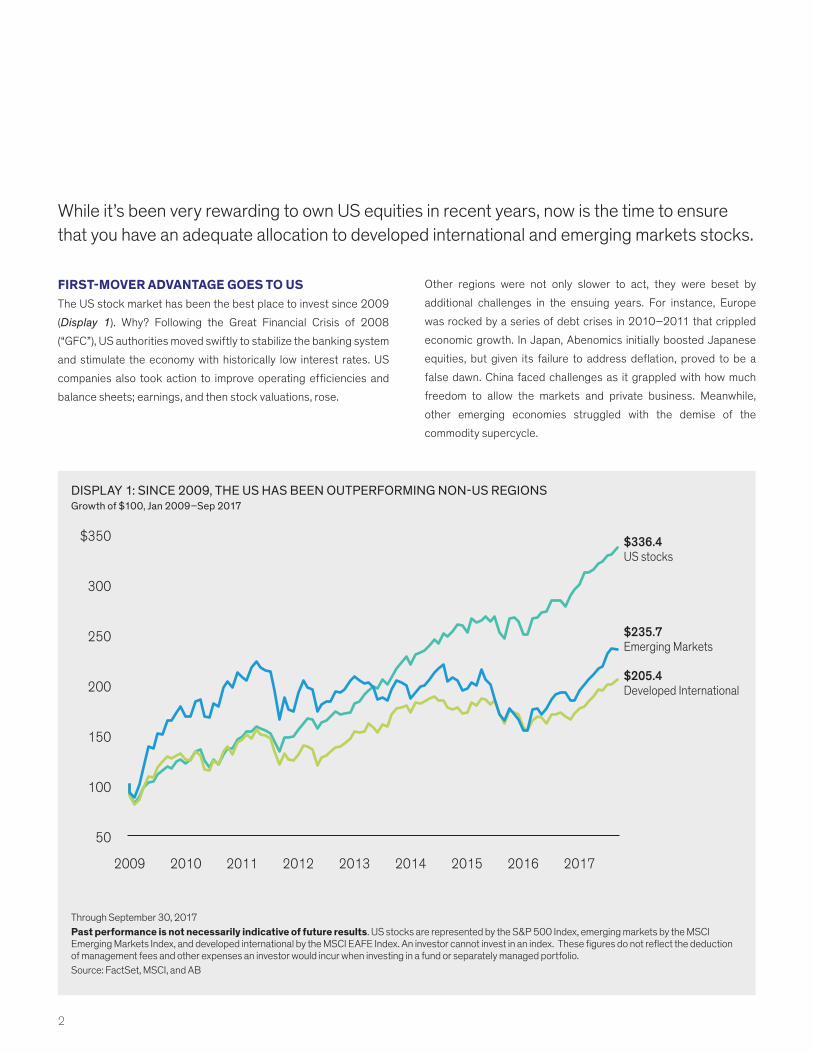
FIRST-MOVER ADVANTAGE GOES TO USThe US stock market has been the best place to invest since 2009
(Display 1). Why? Following the Great Financial Crisis of 2008
(“GFC”), US authorities moved swiftly to stabilize the banking system
and stimulate the economy with historically low interest rates. US
companies also took action to improve operating efficiencies and
balance sheets; earnings, and then stock valuations, rose.
Other regions were not only slower to act, they were beset by
additional challenges in the ensuing years. For instance, Europe
was rocked by a series of debt crises in 2010–2011 that crippled
economic growth. In Japan, Abenomics initially boosted Japanese
equities, but given its failure to address deflation, proved to be a
false dawn. China faced challenges as it grappled with how much
freedom to allow the markets and private business. Meanwhile,
other emerging economies struggled with the demise of the
commodity supercycle.
DISPLAY 1: SINCE 2009, THE US HAS BEEN OUTPERFORMING NON-US REGIONSGrowth of $100, Jan 2009–Sep 2017
$336.4US stocks
$205.4Developed International
$235.7Emerging Markets
50
100
150
200
250
300
$350
2009 2010 2011 2012 2013 2014 2015 2016 2017
Through September 30, 2017Past performance is not necessarily indicative of future results. US stocks are represented by the S&P 500 Index, emerging markets by the MSCI Emerging Markets Index, and developed international by the MSCI EAFE Index. An investor cannot invest in an index. These figures do not reflect the deduction of management fees and other expenses an investor would incur when investing in a fund or separately managed portfolio.Source: FactSet, MSCI, and AB
Broaden Your Horizons 3
By 2016, the dominance of the US stock market had become partic-
ularly pronounced. The S&P 500 rose 12% for the year versus a
mere 1% for developed markets stocks (as represented by the MSCI
EAFE index), principally due to a burst of enthusiasm surrounding
President Trump’s election. In particular, investors bid up US stocks
poised to benefit from potential pro-growth policy changes aimed at
tax reform and deregulation.
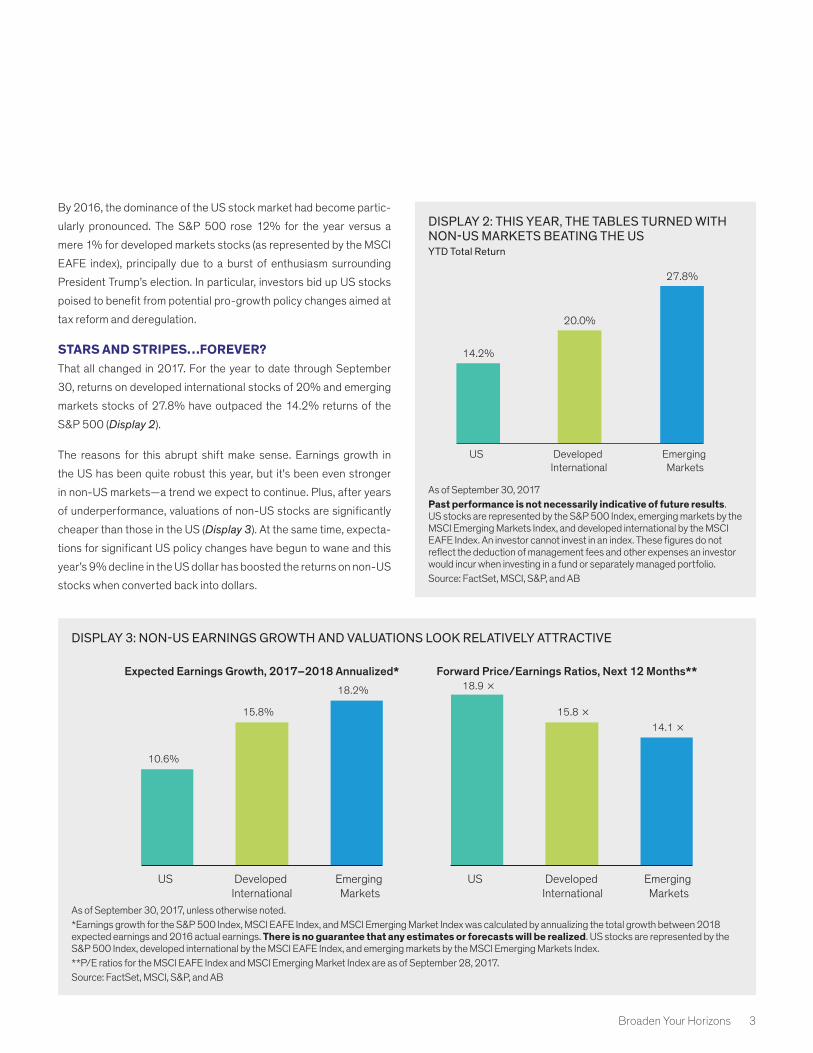
STARS AND STRIPES…FOREVER?That all changed in 2017. For the year to date through September
30, returns on developed international stocks of 20% and emerging
markets stocks of 27.8% have outpaced the 14.2% returns of the
S&P 500 (Display 2).
The reasons for this abrupt shift make sense. Earnings growth in
the US has been quite robust this year, but it's been even stronger
in non-US markets—a trend we expect to continue. Plus, after years
of underperformance, valuations of non-US stocks are significantly
cheaper than those in the US (Display 3). At the same time, expecta-
tions for significant US policy changes have begun to wane and this
year’s 9% decline in the US dollar has boosted the returns on non-US
stocks when converted back into dollars.
DISPLAY 2: THIS YEAR, THE TABLES TURNED WITH NON-US MARKETS BEATING THE USYTD Total Return
US Developed International
Emerging Markets
14.2%
20.0%
27.8%
As of September 30, 2017Past performance is not necessarily indicative of future results. US stocks are represented by the S&P 500 Index, emerging markets by the MSCI Emerging Markets Index, and developed international by the MSCI EAFE Index. An investor cannot invest in an index. These figures do not reflect the deduction of management fees and other expenses an investor would incur when investing in a fund or separately managed portfolio. Source: FactSet, MSCI, S&P, and AB
DISPLAY 3: NON-US EARNINGS GROWTH AND VALUATIONS LOOK RELATIVELY ATTRACTIVE
Expected Earnings Growth, 2017–2018 Annualized* Forward Price/Earnings Ratios, Next 12 Months**
US Developed International
Emerging Markets
US Developed International
Emerging Markets
10.6%
15.8%
18.2% 18.9 ×
15.8 ×14.1 ×
As of September 30, 2017, unless otherwise noted.*Earnings growth for the S&P 500 Index, MSCI EAFE Index, and MSCI Emerging Market Index was calculated by annualizing the total growth between 2018 expected earnings and 2016 actual earnings. There is no guarantee that any estimates or forecasts will be realized. US stocks are represented by the S&P 500 Index, developed international by the MSCI EAFE Index, and emerging markets by the MSCI Emerging Markets Index. **P/E ratios for the MSCI EAFE Index and MSCI Emerging Market Index are as of September 28, 2017.Source: FactSet, MSCI, S&P, and AB
4
THE LONG-TERM CASEClearly, returns this year show that investors recognize the current
appeal of non-US stocks. But our recommendation for increased
non-US exposure hinges upon a longer-term rationale.
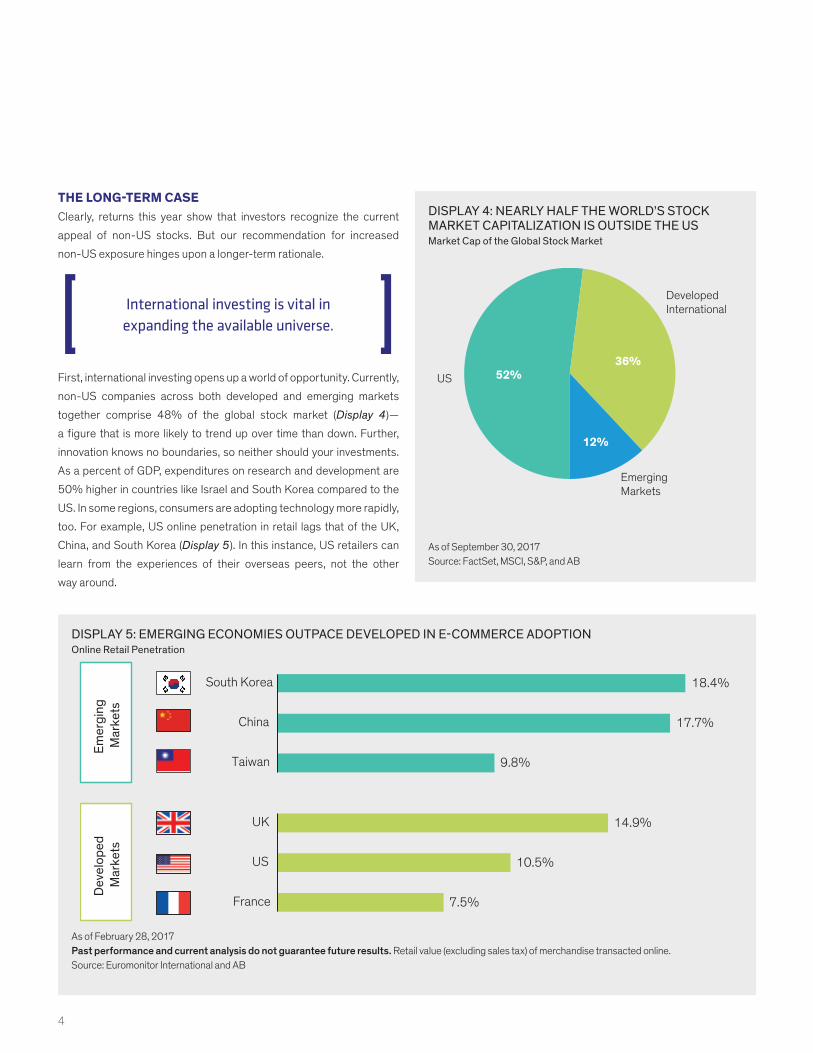
First, international investing opens up a world of opportunity. Currently,
non-US companies across both developed and emerging markets
together comprise 48% of the global stock market (Display 4)—
a figure that is more likely to trend up over time than down. Further,
innovation knows no boundaries, so neither should your investments.
As a percent of GDP, expenditures on research and development are
50% higher in countries like Israel and South Korea compared to the
US. In some regions, consumers are adopting technology more rapidly,
too. For example, US online penetration in retail lags that of the UK,
China, and South Korea (Display 5). In this instance, US retailers can
learn from the experiences of their overseas peers, not the other
way around.
International investing is vital in expanding the available universe.
DISPLAY 4: NEARLY HALF THE WORLD’S STOCK MARKET CAPITALIZATION IS OUTSIDE THE USMarket Cap of the Global Stock Market
52%36%
12%
US
Developed International
Emerging Markets
As of September 30, 2017Source: FactSet, MSCI, S&P, and AB
DISPLAY 5: EMERGING ECONOMIES OUTPACE DEVELOPED IN E-COMMERCE ADOPTIONOnline Retail Penetration
Emer
ging
M
arke
tsD
evel
oped
M
arke
ts
7.5%
10.5%
14.9%
France
US
UK
9.8%
17.7%
18.4%
Taiwan
China
South Korea
As of February 28, 2017Past performance and current analysis do not guarantee future results. Retail value (excluding sales tax) of merchandise transacted online.Source: Euromonitor International and AB
Broaden Your Horizons 5
Investing in non-US stocks may also offer greater opportunity
for stock selection. Why? Although far more efficient than in the
past, non-US markets (especially emerging markets) are still less
efficient than the US. Developed international and emerging markets
combined host many more companies than the US, but there are far
fewer earnings estimates available for the average company. This
creates the potential for investors with on-the-ground expertise to
benefit from an information advantage.
Finally, investing in non-US stocks provides diversification benefits.
Not surprisingly, performance patterns vary across geographies,
often reflecting different economic conditions and industry trends
as well as the impact of interest rate movements and currency fluctu-
ations. And, while foreign currency adds to volatility for non-US
equities, geographic diversification has resulted in more stable
returns over time (see sidebar, page 8).
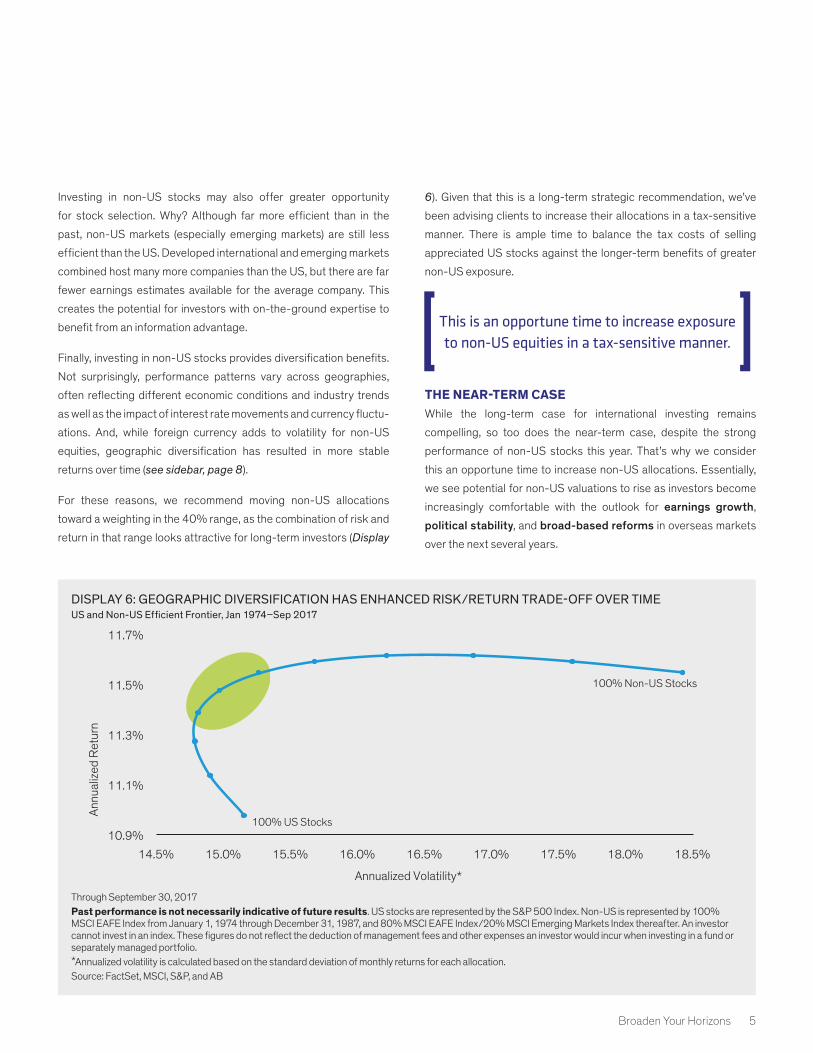
For these reasons, we recommend moving non-US allocations
toward a weighting in the 40% range, as the combination of risk and
return in that range looks attractive for long-term investors (Display
6). Given that this is a long-term strategic recommendation, we’ve
been advising clients to increase their allocations in a tax-sensitive
manner. There is ample time to balance the tax costs of selling
appreciated US stocks against the longer-term benefits of greater
non-US exposure.
THE NEAR-TERM CASEWhile the long-term case for international investing remains
compelling, so too does the near-term case, despite the strong
performance of non-US stocks this year. That’s why we consider
this an opportune time to increase non-US allocations. Essentially,
we see potential for non-US valuations to rise as investors become
increasingly comfortable with the outlook for earnings growth,
political stability, and broad-based reforms in overseas markets
over the next several years.
This is an opportune time to increase exposure to non-US equities in a tax-sensitive manner.
DISPLAY 6: GEOGRAPHIC DIVERSIFICATION HAS ENHANCED RISK/RETURN TRADE-OFF OVER TIMEUS and Non-US Efficient Frontier, Jan 1974–Sep 2017
100% Non-US Stocks
100% US Stocks10.9%
11.1%
11.3%
11.5%
11.7%
14.5% 15.0% 15.5% 16.0% 16.5% 17.0% 17.5% 18.0% 18.5%
Annu
aliz
ed R
etur
n
Annualized Volatility*
Through September 30, 2017Past performance is not necessarily indicative of future results. US stocks are represented by the S&P 500 Index. Non-US is represented by 100% MSCI EAFE Index from January 1, 1974 through December 31, 1987, and 80% MSCI EAFE Index/20% MSCI Emerging Markets Index thereafter. An investor cannot invest in an index. These figures do not reflect the deduction of management fees and other expenses an investor would incur when investing in a fund or separately managed portfolio.*Annualized volatility is calculated based on the standard deviation of monthly returns for each allocation.Source: FactSet, MSCI, S&P, and AB
6
For more on these three themes, we reached out to the senior
investment officers of our core non-US strategies: Stuart Rae and
Sammy Suzuki, who co-head our International Strategic Equities
Portfolio, and Nelson Yu, who heads our Tax-Managed International
Portfolio. A summary of their insights follows:
�� Earnings growth
We expect above-trend earnings growth in non-US markets
to be supported by an improving macroeconomic backdrop.
For instance, we expect Chinese GDP growth of about 6% in
2018—down a bit from recent years, but still impressive. And
GDP in Japan and Europe are slowly recovering off a very low
base. In fact, economic sentiment in the Eurozone just reached
a 10-year high.1 Inflation in most regions is generally stable to
modestly rising. This results in higher nominal growth, which
is a more important indicator than real growth for company
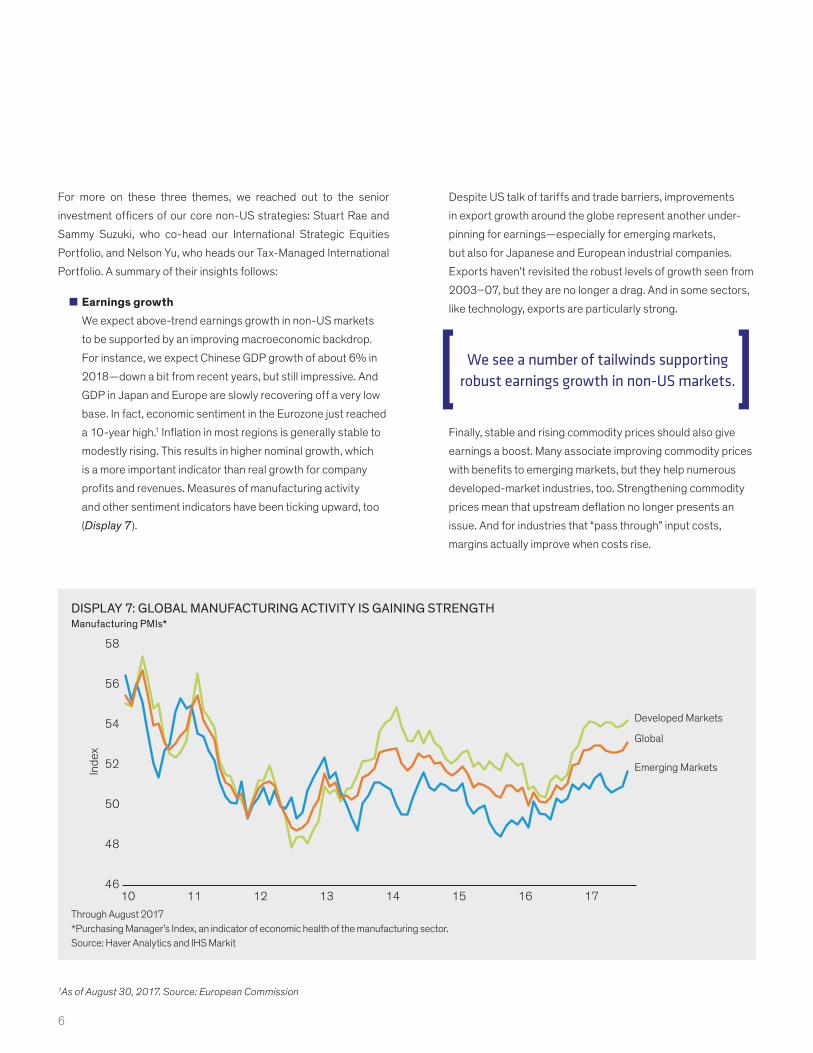
profits and revenues. Measures of manufacturing activity
and other sentiment indicators have been ticking upward, too
(Display 7).
Despite US talk of tariffs and trade barriers, improvements
in export growth around the globe represent another under-
pinning for earnings—especially for emerging markets,
but also for Japanese and European industrial companies.
Exports haven’t revisited the robust levels of growth seen from
2003–07, but they are no longer a drag. And in some sectors,
like technology, exports are particularly strong.
Finally, stable and rising commodity prices should also give
earnings a boost. Many associate improving commodity prices
with benefits to emerging markets, but they help numerous
developed-market industries, too. Strengthening commodity
prices mean that upstream deflation no longer presents an
issue. And for industries that “pass through” input costs,
margins actually improve when costs rise.
1As of August 30, 2017. Source: European Commission
DISPLAY 7: GLOBAL MANUFACTURING ACTIVITY IS GAINING STRENGTHManufacturing PMIs*
46
48
50
52
54
56
58
10 11 12 13 14 15 16 17
Inde
x
Emerging Markets
Developed Markets
Global
Through August 2017*Purchasing Manager’s Index, an indicator of economic health of the manufacturing sector.Source: Haver Analytics and IHS Markit
We see a number of tailwinds supporting robust earnings growth in non-US markets.
Broaden Your Horizons 7
�� Political stability Americans face daily evidence of political disunity in
Washington. US stocks have done well nonetheless, because
solid economic growth, still-low interest rates, and benign
inflation have supported strong earnings growth. But
corporate managers are dealing with more policy uncertainty
than they have in years.
In contrast, valuations of stocks in many overseas regions
stand to benefit from dwindling political uncertainty. Consider
the Eurozone. In France, markets welcomed centrist newcomer
Emmanuel Macron. In Germany, although the anti-immigration
party recently gained more votes than expected, Chancellor
Angela Merkel is working to develop an effective centrist
coalition government. Even peripherals like Greece and Italy
have been marked by less turmoil, and talk of a Eurozone
“break-up” seems like a bygone concern. And, while Brexit still
looms on the horizon, as far as risks go it’s fairly well known.
In general, Asia also appears to be enjoying a period of relative
political tranquility. Abe, the longest serving Japanese prime
minister since Koizumi, has had a chance to implement his
agenda over a number of years. Chinese leadership is also
firmly in charge with President Xi about to head into his second
five-year term. North Korea represents a notable exception, as
tensions have continued to escalate on the Korean peninsula.
�� Broad-based reformsReform measures are another encouraging development that
should bolster non-US valuations. Take China, for example,
where controls on capital expenditures and restructuring
of state-owned enterprises (SOEs) are boosting margins in
key industries such as materials, energy, and infrastructure.
Government-led initiatives are also shaking up the economic
landscape in India as investors welcome demonetization, the
introduction of a Goods and Services Tax (GST), and other
policies introduced by Prime Minister Narendra Modi.
Developed markets are embracing change, too. In Japan,
structural reform has made steady, if quiet, inroads over the
past several years. For instance, a gradual improvement
in corporate governance, which has made corporate
management more focused on shareholders’ interests, has
contributed to a marked increase in shareholder returns
in the form of stock buybacks and dividends. Then there’s
Europe, where Macron’s ambitious reform agenda for France
is designed to ease notoriously strict labor rules. While it’s too
early to forecast the chances of success—or how long such
changes might take to unfold—the proposal provides concrete
evidence of fresh thinking on the Continent.
Taken together, all these trends provide supportive conditions for
international valuations, reinforcing our decision to increase non-US
exposure now.
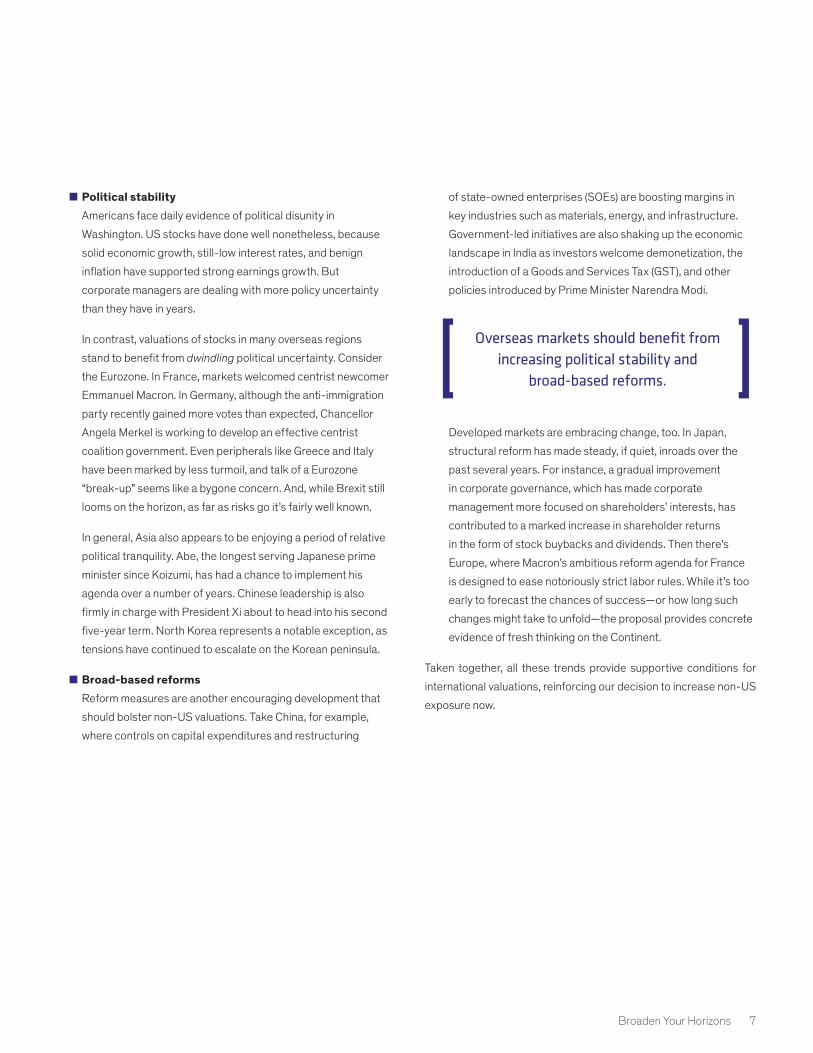
Overseas markets should benefit from increasing political stability and
broad-based reforms.
8
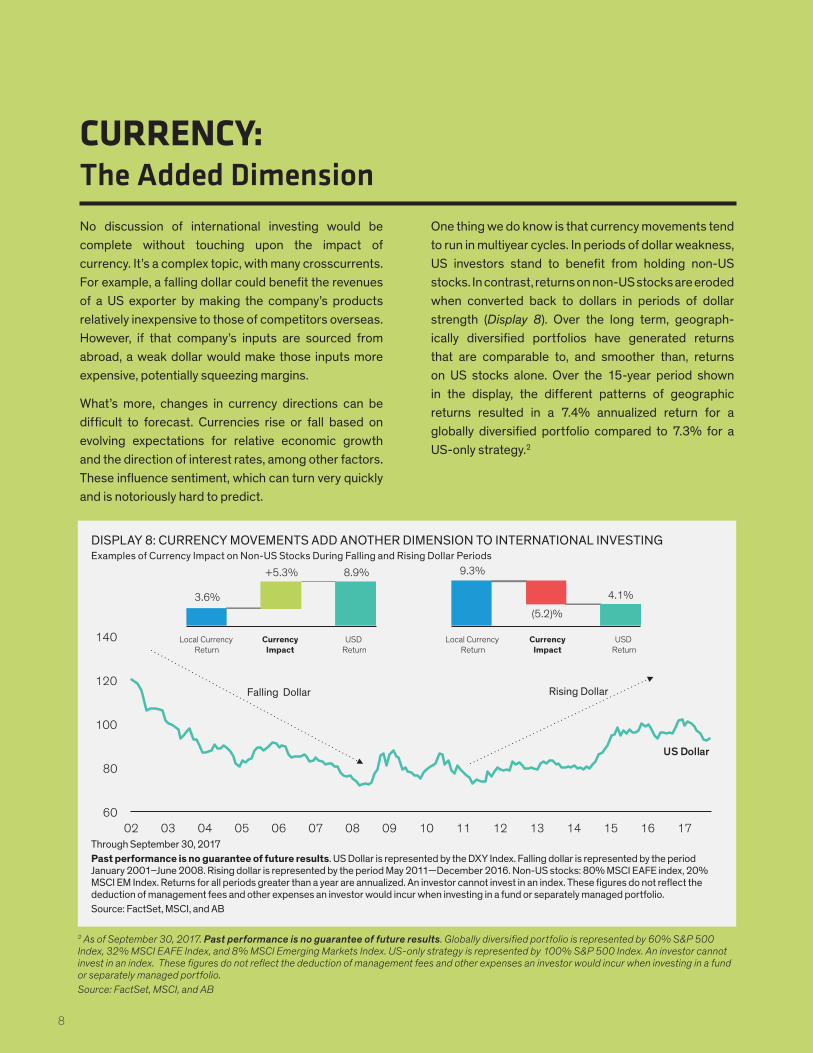
CURRENCY: The Added Dimension No discussion of international investing would be complete without touching upon the impact of currency. It’s a complex topic, with many crosscurrents. For example, a falling dollar could benefit the revenues of a US exporter by making the company’s products relatively inexpensive to those of competitors overseas. However, if that company’s inputs are sourced from abroad, a weak dollar would make those inputs more expensive, potentially squeezing margins.
What’s more, changes in currency directions can be difficult to forecast. Currencies rise or fall based on evolving expectations for relative economic growth and the direction of interest rates, among other factors. These influence sentiment, which can turn very quickly and is notoriously hard to predict.
One thing we do know is that currency movements tend to run in multiyear cycles. In periods of dollar weakness, US investors stand to benefit from holding non-US stocks. In contrast, returns on non-US stocks are eroded when converted back to dollars in periods of dollar strength (Display 8). Over the long term, geograph-ically diversified portfolios have generated returns that are comparable to, and smoother than, returns on US stocks alone. Over the 15-year period shown in the display, the different patterns of geographic returns resulted in a 7.4% annualized return for a globally diversified portfolio compared to 7.3% for a US-only strategy.2
2 As of September 30, 2017. Past performance is no guarantee of future results. Globally diversified portfolio is represented by 60% S&P 500 Index, 32% MSCI EAFE Index, and 8% MSCI Emerging Markets Index. US-only strategy is represented by 100% S&P 500 Index. An investor cannot invest in an index. These figures do not reflect the deduction of management fees and other expenses an investor would incur when investing in a fund or separately managed portfolio.Source: FactSet, MSCI, and AB
DISPLAY 8: CURRENCY MOVEMENTS ADD ANOTHER DIMENSION TO INTERNATIONAL INVESTINGExamples of Currency Impact on Non-US Stocks During Falling and Rising Dollar Periods
US Dollar
Falling Dollar Rising Dollar
60
80
100
120
140
02 03 04 05 06 07 08 09 10 11 12 13 14 15 16 17
3.6%
+5.3% 8.9% 9.3%
(5.2)%
4.1%
Local Currency Return
CurrencyImpact
USD Return
Local Currency Return
CurrencyImpact
USD Return
Through September 30, 2017Past performance is no guarantee of future results. US Dollar is represented by the DXY Index. Falling dollar is represented by the period January 2001–June 2008. Rising dollar is represented by the period May 2011—December 2016. Non-US stocks: 80% MSCI EAFE index, 20% MSCI EM Index. Returns for all periods greater than a year are annualized. An investor cannot invest in an index. These figures do not reflect the deduction of management fees and other expenses an investor would incur when investing in a fund or separately managed portfolio.Source: FactSet, MSCI, and AB
Broaden Your Horizons 9
CAPITALIZING ON TODAY’S OPPORTUNITIES We have been saying for some time that our outlook for equity
returns for the next few years is muted, and that clients should
expect more volatility as well. Of note—though not a guarantee—our
8% five-year forecast for non-US equity index returns exceeds the
6% index returns we expect for US markets. However, while interna-
tional investing offers long-term benefits, it requires in-depth, local
expertise to uncover the strongest companies and sectors that will
drive outperformance.
With our on-the-ground research effort, we’ve identified a diverse
array of appealing investment opportunities across styles, industries,
and geographies. The examples highlighted here illustrate our prior
assertion that innovators are plentiful overseas. Consider ASML.
This leader in advanced manufacturing techniques for photolithog-
raphy systems conducts the vast majority of its R&D and assembly in
the Netherlands. Though it’s located a world away from Silicon Valley,
the company is instrumental in ensuring that silicon chips will double
in speed, for the same or lower cost, roughly every two years.
Then there is Panasonic. Few realize this well-known Japanese
manufacturer of electronic products is poised for strong earnings
growth as the auto industry transforms. Why? Today it focuses on
auto infotainment systems and car batteries and is the sole supplier
to Tesla’s GIGA factory.
Australia’s Cochlear, a world leader in hearing implant technology,
or so-called “bionic ears,” represents another quintessential
innovator. Cochlear’s latest processors can interact directly with
smartphones—a key to their transition from a medical device
company to more of a consumer-focused firm. We see overlooked
growth potential for Cochlear in new markets (such as China and
India) as well as in more lifestyle-oriented products in mature
markets.
Finally, what many consider to be the most prominent Chinese
stock, Alibaba. While many US investors recognize the name, fewer
are likely to grasp the company’s size and scope. As the dominant
Chinese e-commerce company, Alibaba boasts nearly 500 million
active users. The company has been exploring a number of new
fronts, including electronic payments and financial services, cloud
computing infrastructure, and various services mining its core
e-commerce customer base. Expanding into new markets is also on
the horizon, leading us to believe that the company’s optionality and
growth potential may be underappreciated.
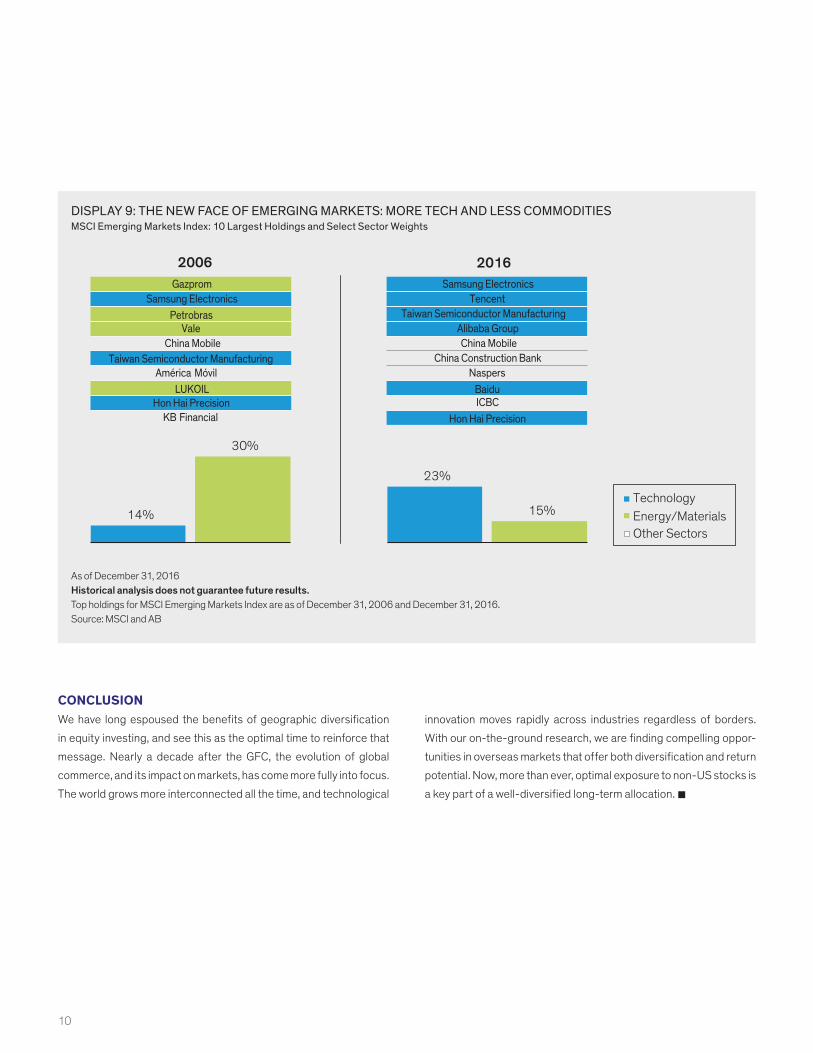
Innovation is also taking hold more broadly in emerging markets
as technology overtakes commodities as the engine for profits.
Roughly a decade ago, four of the 10 largest companies by market
capitalization in emerging markets (as represented by the MSCI
Emerging Markets Index) were in the energy/materials sector
(Display 9). Cumulatively, the sector represented nearly a third of
the entire index—compared to just 14% for technology companies.
Fast forward to today and those figures have reversed. Six of the
10 largest companies are in the technology sector, which now
represents nearly one quarter of the index by market cap. Energy
and materials make up just 15%.
10
CONCLUSIONWe have long espoused the benefits of geographic diversification
in equity investing, and see this as the optimal time to reinforce that
message. Nearly a decade after the GFC, the evolution of global
commerce, and its impact on markets, has come more fully into focus.
The world grows more interconnected all the time, and technological
innovation moves rapidly across industries regardless of borders.
With our on-the-ground research, we are finding compelling oppor-
tunities in overseas markets that offer both diversification and return
potential. Now, more than ever, optimal exposure to non-US stocks is
a key part of a well-diversified long-term allocation. �
DISPLAY 9: THE NEW FACE OF EMERGING MARKETS: MORE TECH AND LESS COMMODITIESMSCI Emerging Markets Index: 10 Largest Holdings and Select Sector Weights
14%
23%
30%
15%TechnologyEnergy/MaterialsOther Sectors
GazpromSamsung Electronics
PetrobrasVale
China MobileTaiwan Semiconductor Manufacturing
América MóvilLUKOIL
Hon Hai PrecisionKB Financial
Samsung ElectronicsTencent
Taiwan Semiconductor ManufacturingAlibaba GroupChina Mobile
China Construction BankNaspers
BaiduICBC
Hon Hai Precision
2006 2016
As of December 31, 2016Historical analysis does not guarantee future results.Top holdings for MSCI Emerging Markets Index are as of December 31, 2006 and December 31, 2016.Source: MSCI and AB

BER-1283-0917bernstein.comBER-1283-1017
The [A/B] logo is a registered service mark of AllianceBernstein, and AllianceBernstein® is a registered service mark, used by permission of the owner, AllianceBernstein L.P.
© 2017 AllianceBernstein L.P.
AMSTERDAM
COPENHAGEN
FRANKFURT
GENEVA
LONDON
LUXEMBOURG
MANAMA
MILAN
MUNICH
PARIS
STOCKHOLM
TEL AVIV
ZURICH
BUENOS AIRES
MEXICO CITY
SAN ANTONIO
SÃO PAULO
TORONTO
HONG KONG
MELBOURNE
SEOUL
SINGAPORE CITY
SYDNEY
TAIPEI
TOKYO
ATLANTA 404.279.4900
BOSTON 617.788.3700
CHICAGO 312.696.7800
CLEVELAND 216.263.8090
DALLAS 214.860.5200
DENVER 303.292.7400
HOUSTON 832.366.2000
LOS ANGELES 310.286.6000
MIAMI 305.530.6200
MINNEAPOLIS 612.758.5000
NEW YORK 212.486.5800
PHILADELPHIA 215.430.5600
SAN DIEGO 858.812.2200
SAN FRANCISCO 415.217.8000
SEATTLE 206.342.1300
TAMPA 813.314.3300
TEL AVIV +972 73 2844514
WASHINGTON, DC 202.261.6700
WEST PALM BEACH 561.820.2100
AB OFFICES WORLDWIDE
BERNSTEIN OFFICES
EMEA OTHER AMERICASASIA-PACIFIC
INFORMATION ABOUT MORGAN STANLEY CAPITAL INTERNATIONAL (MSCI)MSCI makes no express or implied warranties or representations and shall have no liability whatsoever with respect to any MSCI data contained herein. The MSCI data may not be further redistributed or used as a basis for other indexes or any securities or financial products. This paper has not been approved, reviewed, or produced by MSCI.
NOTE TO ALL READERSThe information contained herein reflects the views of AllianceBernstein L.P. or its affiliates and sources it believes are reliable as of the date of this publication. AllianceBernstein L.P. makes no representations or warranties concerning the accuracy of any data. There is no guarantee that any projection, forecast, or opinion in this material will be realized. Past performance does not guarantee future results. The views expressed herein may change at any time after the date of this publication. This document is for informational purposes only and does not constitute investment advice. It does not take an investor’s personal investment objectives or financial situation into account; investors should discuss their individual circumstances with appropriate professionals before making any decisions. AllianceBernstein L.P. does not provide tax, legal, or accounting advice. This information should not be construed as sales or marketing material or an offer or solicitation for the purchase or sale of any financial instrument, product, or service sponsored by AllianceBernstein or its affiliates.