budgeting for social welfare - womensnetwork.org · wwc women’s wellness centre. 3 ... it...
TRANSCRIPT

Deutsche Gesellschaftfür Internationale Zusammenarbeit (GIZ) GmbH
A Gender+ Analysis to Inform Gender Responsive Budgeting in the
Ministry of Labour and Social Welfare in Kosovo for 2016-2018
Budgeting for Social Welfare
Kosovo Women’s NetworkServing, Protecting and Promoting the Rights of Women and Girls


Budgeting for Social Welfare
A Gender+ Analysis to Inform Gender Responsive Budgeting in the
Ministry of Labour and Social Welfare in Kosovo for 2016-2018
By Donjeta Morina and Nicole Farnsworth for the Kosovo Women’s Network
Prishtina, Kosovo 2015
© Kosovo Women’s Network, 2015 Authors: Donjeta Morina and Nicole Farnsworth ISBN 978-9951-8852-8-7 Printed by Night Design in Prishtina www.womensnetwork.org
1
Contents
Acknowledgements ............................................................................................................................ 2
Acronyms............................................................................................................................................ 2
Executive Summary ............................................................................................................................ 3 Key Conclusions ............................................................................................................................. 3 Recommendations ......................................................................................................................... 4
Introduction ........................................................................................................................................ 7
Key Demographic Data to Inform Gender Analysis ......................................................................... 8
The Ministry of Labour and Social Welfare’s Responsibilities.......................................................... 9
Division for Human Resources ........................................................................................................ 10
The Pension System in Kosovo ....................................................................................................... 11 Basic Pension ................................................................................................................................ 11 Contributory Pension .................................................................................................................. 13 Disability Pension ......................................................................................................................... 14 Early Compensation for Workers of Trepca .............................................................................. 16 Division for Heritage Issues of the Kosovo Protection Corps .................................................. 17 Pensions for Members of the Kosovo Security Force ................................................................ 17 Blind Persons Pension .................................................................................................................. 18
Department of Labour and Employment ........................................................................................ 19 Persons Registered with Employment Offices ............................................................................ 19 Persons Employed through Employment Offices ....................................................................... 21 Beneficiaries of Active Labour Market Programmes .................................................................. 23 Vocational Training Division ........................................................................................................ 24 Maternity Leave ............................................................................................................................ 24 Unemployment and Care Work ................................................................................................. 25
Department for Social Policies and Families ................................................................................... 25 Division for Social Assistance ...................................................................................................... 26 Social Services Division ................................................................................................................ 30 Assistance for Families of Children with Disabilities ................................................................... 31 Foster Care for Abandoned Children ......................................................................................... 32 Shelters for Protection against Domestic Violence .................................................................... 33 Disabled and Elderly People Division .......................................................................................... 36
Department of Martyrs’ Families and War Invalids ........................................................................ 37 Martyrs’ Families .......................................................................................................................... 38 Civil Victims .................................................................................................................................. 39 KLA Invalids .................................................................................................................................. 39 Civilian Invalids ............................................................................................................................. 40 Missing Persons from KLA ........................................................................................................... 41 Civilian Missing People ................................................................................................................. 42 Families of Dead War Invalids ..................................................................................................... 42 Families of Dead Civilian Invalids ................................................................................................. 43 Caretakers of Civil Invalids .......................................................................................................... 43 Caretakers of War Invalids .......................................................................................................... 44
Bibliography ...................................................................................................................................... 45
2
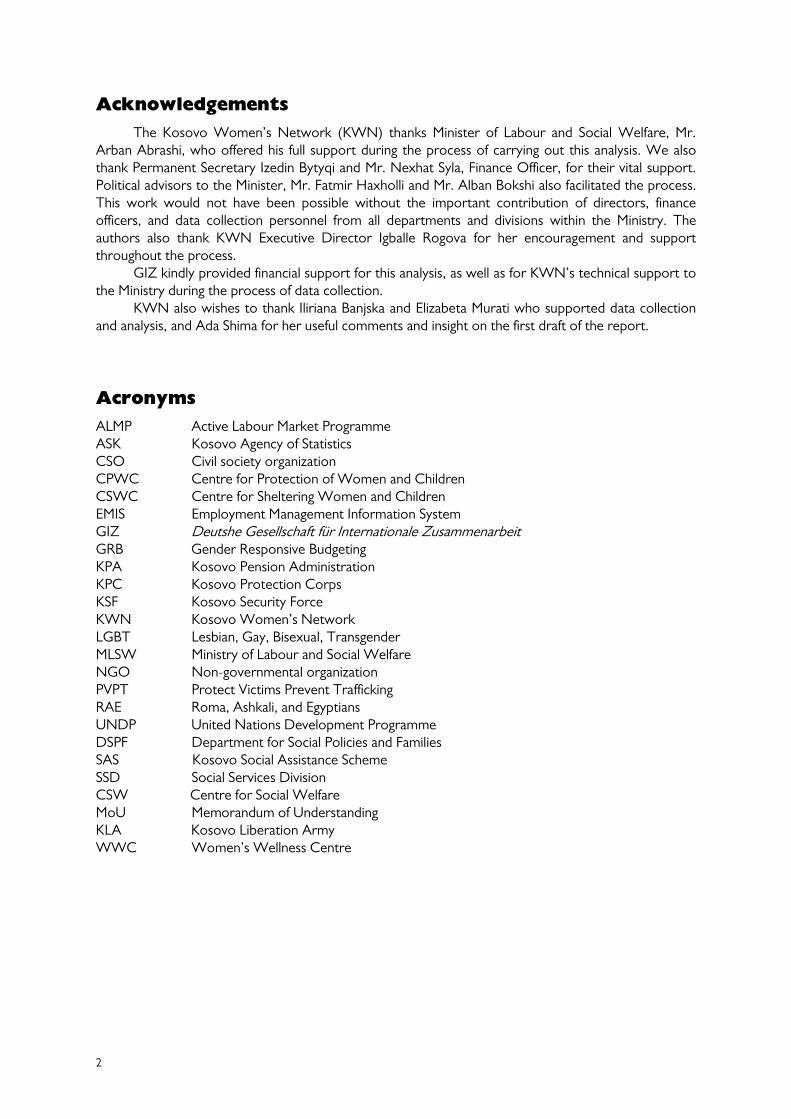
Acknowledgements
The Kosovo Women’s Network (KWN) thanks Minister of Labour and Social Welfare, Mr. Arban Abrashi, who offered his full support during the process of carrying out this analysis. We also thank Permanent Secretary Izedin Bytyqi and Mr. Nexhat Syla, Finance Officer, for their vital support. Political advisors to the Minister, Mr. Fatmir Haxholli and Mr. Alban Bokshi also facilitated the process. This work would not have been possible without the important contribution of directors, finance officers, and data collection personnel from all departments and divisions within the Ministry. The authors also thank KWN Executive Director Igballe Rogova for her encouragement and support throughout the process.
GIZ kindly provided financial support for this analysis, as well as for KWN’s technical support to the Ministry during the process of data collection.
KWN also wishes to thank Iliriana Banjska and Elizabeta Murati who supported data collection and analysis, and Ada Shima for her useful comments and insight on the first draft of the report.
Acronyms
ALMP Active Labour Market Programme ASK Kosovo Agency of Statistics CSO Civil society organization CPWC Centre for Protection of Women and Children CSWC Centre for Sheltering Women and Children EMIS Employment Management Information System GIZ Deutshe Gesellschaft für Internationale Zusammenarbeit GRB Gender Responsive Budgeting KPA Kosovo Pension Administration KPC Kosovo Protection Corps KSF Kosovo Security Force KWN Kosovo Women’s Network LGBT Lesbian, Gay, Bisexual, Transgender MLSW Ministry of Labour and Social Welfare NGO Non-governmental organization PVPT Protect Victims Prevent Trafficking RAE Roma, Ashkali, and Egyptians UNDP United Nations Development Programme DSPF Department for Social Policies and Families SAS Kosovo Social Assistance Scheme SSD Social Services Division CSW Centre for Social Welfare MoU Memorandum of Understanding KLA Kosovo Liberation Army WWC Women’s Wellness Centre
3
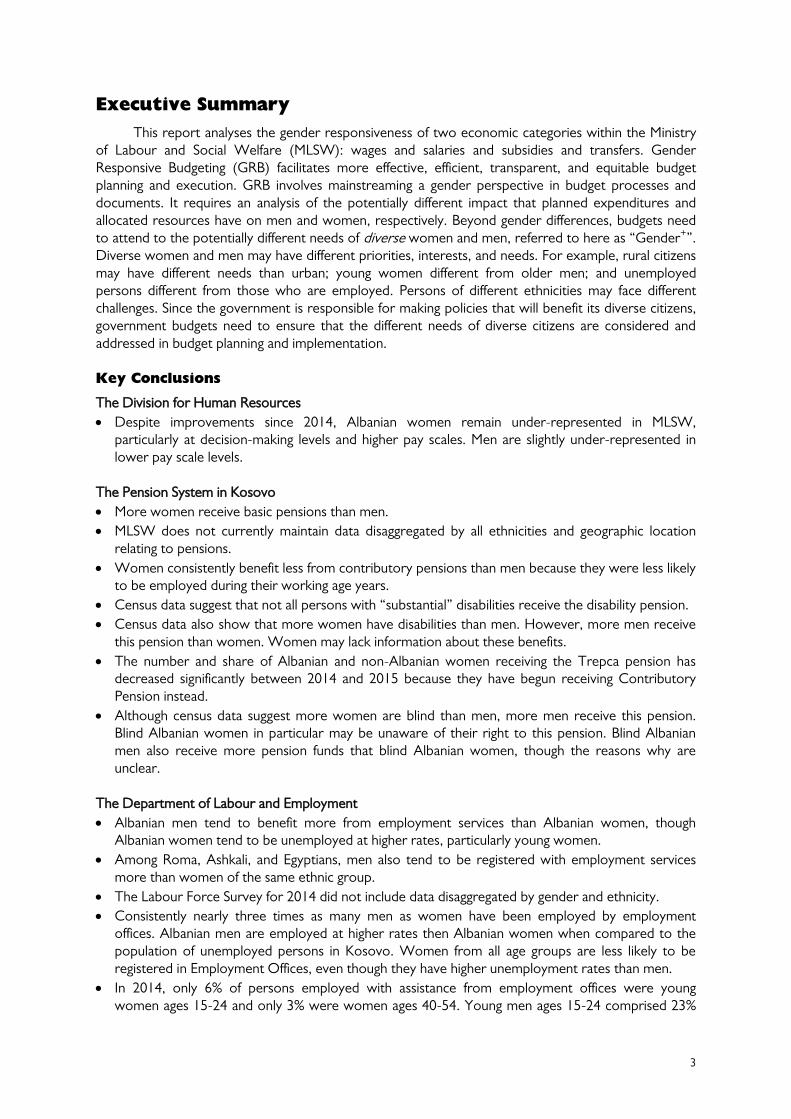
Executive Summary
This report analyses the gender responsiveness of two economic categories within the Ministry of Labour and Social Welfare (MLSW): wages and salaries and subsidies and transfers. Gender Responsive Budgeting (GRB) facilitates more effective, efficient, transparent, and equitable budget planning and execution. GRB involves mainstreaming a gender perspective in budget processes and documents. It requires an analysis of the potentially different impact that planned expenditures and allocated resources have on men and women, respectively. Beyond gender differences, budgets need to attend to the potentially different needs of diverse women and men, referred to here as “Gender+”. Diverse women and men may have different priorities, interests, and needs. For example, rural citizens may have different needs than urban; young women different from older men; and unemployed persons different from those who are employed. Persons of different ethnicities may face different challenges. Since the government is responsible for making policies that will benefit its diverse citizens, government budgets need to ensure that the different needs of diverse citizens are considered and addressed in budget planning and implementation. Key Conclusions
The Division for Human Resources
Despite improvements since 2014, Albanian women remain under-represented in MLSW, particularly at decision-making levels and higher pay scales. Men are slightly under-represented in lower pay scale levels.
The Pension System in Kosovo
More women receive basic pensions than men.
MLSW does not currently maintain data disaggregated by all ethnicities and geographic location relating to pensions.
Women consistently benefit less from contributory pensions than men because they were less likely to be employed during their working age years.
Census data suggest that not all persons with “substantial” disabilities receive the disability pension.
Census data also show that more women have disabilities than men. However, more men receive this pension than women. Women may lack information about these benefits.
The number and share of Albanian and non-Albanian women receiving the Trepca pension has decreased significantly between 2014 and 2015 because they have begun receiving Contributory Pension instead.
Although census data suggest more women are blind than men, more men receive this pension. Blind Albanian women in particular may be unaware of their right to this pension. Blind Albanian men also receive more pension funds that blind Albanian women, though the reasons why are unclear.
The Department of Labour and Employment
Albanian men tend to benefit more from employment services than Albanian women, though Albanian women tend to be unemployed at higher rates, particularly young women.
Among Roma, Ashkali, and Egyptians, men also tend to be registered with employment services more than women of the same ethnic group.
The Labour Force Survey for 2014 did not include data disaggregated by gender and ethnicity.
Consistently nearly three times as many men as women have been employed by employment offices. Albanian men are employed at higher rates then Albanian women when compared to the population of unemployed persons in Kosovo. Women from all age groups are less likely to be registered in Employment Offices, even though they have higher unemployment rates than men.
In 2014, only 6% of persons employed with assistance from employment offices were young women ages 15-24 and only 3% were women ages 40-54. Young men ages 15-24 comprised 23%

4
of persons employed. Men ages 25-39 were significantly over-represented among persons employed.
Data has not been collected with regard to the number and percentage of rural and urban women and men registered and employed by employment offices.
While women and men have benefitted rather equally from the Active Labour Market Programme (ALMP) in 2015, men have received a slightly higher percentage of the funding distributed. Men also have tended to benefit slightly more from the wage subsidy and self-employment programs than women.
More men have benefitted from vocational training centres than women, though progress has been made towards increasing the percentage of women beneficiaries in 2015.
Addressing women’s high unemployment rate and low labour market force participation requires attention to care work and identifying alternative care possibilities.
The Department for Social Policies and Families
For both categories it can be observed that while men are more likely to collect social assistance for their families, women are more likely to be among the household members dependent on it.
Total recipients of SAS Category 1 have increased from 2013 to 2014, but the share of men and women collecting SAS 1 has remained similar. As in prior years, most family members in households receiving SAS 1 are women (56% in 2014).
While men still collect most of the budget for SAS 1 (55% in 2014), the percentage of women receiving it has increased by two percent since 2013 (from 43% to 45%).
Men have consistently comprised the majority of direct recipients of SAS Category 2 (91% in 2012 and 2013 and 85% in 2014). However, the percentage of women who are direct recipients has increased by 7% from 2013 to 2014 (from 8% to 15%).
More families with boys with disabilities receive monthly support than do families with girls with disabilities. Thus more of this budget goes to boys’ families (58%) than to girls’ families (42%).
From 2011 to 2015 all shelters but one received an equal amount of annual funding from MLSW, regardless of the number of persons housed. Starting in 2015, MLSW pays shelters €208.33 monthly per person housed. Shelters have only had women and children beneficiaries. Currently no shelters house men and boys over the age of 12. Also, no shelters meet the specific needs of LGBT persons. In terms of geographic coverage, no shelter exists in northern Kosovo, which contributes to a lack of access to shelter for Serbian persons experiencing violence in particular.
Very few elderly and disability homes exist compared to the size of the potential target group. The criteria for use of such homes are stringent and may place elderly persons at risk of being forced to remain in difficult home situations.
The Department of Martyrs’ Families and War Invalids
Most benefits from this Department go to rural, Albanian women, though others also receive these benefits.
Albanian women, primarily from rural areas, comprise the majority of caretakers of persons with disabilities resulting from war. The pension for caretakers of war invalids is 4.5 times the pension for caretakers of civilian invalids. Yet, the responsibilities and work performed by the caretaker is similar. Considering principles of equal pay for equal work, this seems discriminatory against caretakers of civilians, who tend to be women.
Recommendations
For the Division for Human Resources
Continue to increase the percentage of women employed at higher pay scale levels annually until the legal requirement of women’s 50% employment at all levels of pay is achieved. This can be achieved when job openings exist through affirmative actions in hiring procedures, as foreseen by the Law on Gender Equality.

5
Analyse gender disaggregated data of MLSW employees by rank and level of salary every year.
For the Pension System in Kosovo
Maintain data disaggregated by gender for all ethnic groups.
Cross-checking the number and percentage of recipients by ethnicity with census and demographic data may facilitate the “cleaning” of pension lists. This could provide sufficient funds for an increase to Basic Pensions without necessitating any increase in expenditures, via more efficient spending.
Consider providing an increase in Basic Pensions and not only in Contributory Pensions, towards improving the living conditions of elderly persons who depend on this pension, particularly women.
Work with CSOs assisting persons with disabilities and media to ensure that all are aware of their right to disability pension, targeting women in particular with information.
Consider putting forth a policy for parliamentary review that would enable persons with disabilities to continue to receive the disability pension when over age 65.
Collaborate with blind associations, particularly women-led blind associations to inform people of their rights to this pension, targeting Albanian women in particular with information.
For the Department of Labour and Employment
Undertake active outreach efforts in collaboration with women’s organizations and media that seek to increase the number of Albanian, Roma, Ashkali, and Egyptian women registered with employment offices, thereby increasing the percentage of beneficiaries who are women.
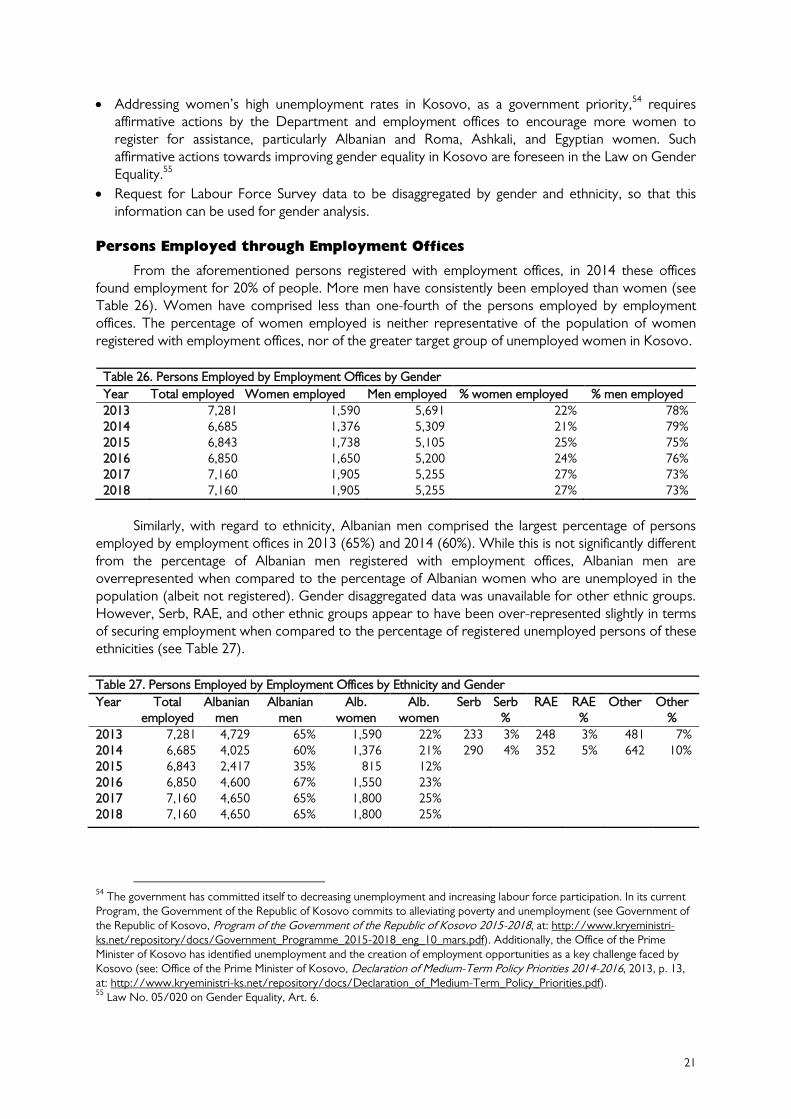
Addressing women’s high unemployment rates in Kosovo, as a government priority, requires affirmative actions by the Department and employment offices to encourage more women to register for assistance, particularly Albanian, Roma, Ashkali, and Egyptian women. Such affirmative actions towards improving gender equality in Kosovo are foreseen in the Law on Gender Equality.
Request for Labour Force Survey data to be disaggregated by gender and ethnicity, so that this information can be used for gender analysis.
Employment office staff need to be trained in and then encouraged to use affirmative actions to increase the percentage of women for whom they secure employment, particularly young women, in accordance with the Law on Gender Equality. This can be achieved by setting a quota for the percentage of jobs that officers must find for women and men of different ages. The target gender ratio of persons employed at each age group could improve incrementally each year until equality is reached.
Considering the high unemployment rate among young women (71.7%) and young men (56.2%), employment offices should install affirmative actions that will encourage more youth to register with unemployment offices as well as prioritize identifying employment opportunities for persons of these age groups.
Cooperate with CSOs, particularly women-led CSOs, to encourage more women to register with employment offices. Registration efforts should target young women (15-24) in particular.
Towards decreasing unemployment in Kosovo as a government priority, considering women’s unequal participation in the labour market and women’s greater need as a target group, ALMP supporters and implementers can create additional affirmative actions to ensure that more women benefit from these programs than men. Such affirmative actions should remain in place until women’s and men’s labour market participation reaches an equal level, as foreseen by the Law on Gender Equality.
Begin collecting data with regard to the number and percentage of rural and urban women and men registered and employed by employment offices.
Continue implementing affirmative actions to ensure that women enrol in and complete vocational training in at least equal percentages as men.
Invest in affordable care facilities (private, public, or private-public partnerships) as an affirmative action foreseen by the Law on Gender Equality, which will create jobs for women and men, as well as enable more women to work by providing care services.

6
For the Department for Social Policies and Families
Conduct a study on why substantially more men receive SAS than women, as well as how social assistance is distributed within the family to ensure that family members not collecting social assistance benefit equally. If discrimination in distribution practices is found to exist, identify ways to ensure that social assistance reaches all family members.
Ensure all persons receiving SAS, including family members, have information as to how they can report misuse or change the recipient of the assistance, ensuring people are aware of their rights. This could include, for example, an outreach campaign targeting women in particular.
Establish specific indicators and activities towards increasing the proportion of women recipients of SAS transfers.
Collaborate with CSOs working with persons with disabilities, particularly women’s organizations, as well as media to ensure that families with girls with disabilities are aware of the rights their children have related to these benefits.
Increase by one percent annually the percentage of families with girls that receive this benefit until it reaches 50%.
Collect and present data on the gender of children in foster care and in other NGOs that provide social services, such as SOS Kinderdorf. Ensure sufficient funding for SOS Kinderdorf.
Budget for at least one shelter that houses men and boys over the age of 12, one shelter for LGBT persons, and a shelter in northern Kosovo. This could involve contracting these services.
Continue funding shelters according to the number of persons housed. Make accurate estimates of the cost of shelter per person by carefully monitoring trends in the actual costs of providing shelter over time. This can help MLSW better budget for meeting its legal obligations to protect, rehabilitate, and reintegrate persons who have suffered violence in the future.
Investing in care centres, at least for daytime care, with less stringent criteria could contribute to improved living conditions and independence for elderly persons, create jobs, and enable persons presently caring for persons with disabilities or the elderly to enter into the labour force.
For the Department of Martyrs’ Families and War Invalids
Demographic information regarding the recipients of these pensions can be useful in ensuring that they have easy access to services related to these pensions, considering their specific needs.
Consider amending Law Nr. 04/L-054 on the status and rights of martyrs and war invalids to ensure equal pay for equal work performed by all caretakers of persons who have sustained injuries during the war.

7
Introduction
Men and women have different priorities, interests, and needs. Beyond gender differences, the needs and priorities of diverse women and men may differ. For example, rural citizens may have different needs than urban; young women different from older men; unemployed persons different from those who are employed; and persons of different ethnicities may encounter diverse issues. Since the government exists to make policies that will benefit its diverse citizens, government budgets need to ensure that the different needs of diverse citizens are considered and addressed in budget planning and implementation.
Gender Responsive Budgeting (GRB) can make planning and executing government budgets more effective, efficient, transparent, and equitable. GRB involves mainstreaming a gender perspective in budget processes and documents. It requires an analysis of the differential impact that planned expenditures and allocated resources have on men and women. Beyond gender analysis alone, budgets should attend to potentially differing needs of diverse women and men. In this report, this is referred to as “Gender+”. It involves analysing the extent to which government services and benefits meet the needs of diverse women and men, of different ages, ethnicities, and other relevant demographic differences.
As of 2015, a robust legal framework in Kosovo obliges budget organizations to carry out GRB. The new Law on Gender Equality Law defines GRB as:
[T]he implementation of Gender Mainstreaming in the budgetary process. This means the valorisation of budgets from the viewpoint of gender, in which case the gender question is taken into account at all levels of the budgetary process, and restructuring incomes and expenditures with the aim of promoting the equality of women and men.1
Further, Article 5.1.5, obliges all institutions of the Republic of Kosovo to include “gender budgeting in all areas, as a necessary tool to guarantee that the principle of gender equality is respected in collecting, distribution and allocation of resources”.2 Additionally, the Budget Circular 2016/02, released by the Ministry of Finance and used to inform budget organizations on the structure of expenditures for the next year, defined GRB and provided templates of tables for all ministries3 and municipalities to complete.4 Thus, a fairly strong legal framework now exists for institutionalizing GRB in Kosovo. Further, many officials have been exposed to GRB both as a concept and a practical tool via training and coaching.
Among ministries in Kosovo, the Ministry of Labour and Social Welfare (MLSW) has the longest experience with GRB. In 2014, the Kosovo Women’s Network (KWN), Deutsche Gesellschaft für Internationale Zusammenarbeit (GIZ) and MLSW collaborated in analysing MLSW data from a GRB perspective and using that data for budget planning. In 2015, the partners built on this positive cooperation, expanding the analysis to Gender+, which involved examining budget allocations to women and men of diverse ages, ethnicities, and geographic areas. This analysis sought to support better informed and more targeted programming and spending that meets the potentially differing needs of Kosovo’s diverse citizens. A deeper examination of other demographic categories can point to potential areas of social exclusion and marginalization. This report assesses who has benefitted from MLSW services and programs in the past, compares actual beneficiaries with target groups and those most in need of such services, and uses this information to make recommendations regarding future planned expenditures.
1 Assembly of the Republic of Kosovo, Law Nr. 05/L-020 on Gender Equality, 2015, at:
http://www.kuvendikosoves.org/common/docs/ligjet/05-L-020%20a.pdf, Art. 3.1.17. 2 Law on Gender Equality, Art. 5.1.5.
3 Ministry of Finance of the Republic of Kosovo, Budget Circular 2015/02 for Ministries, 2015, at: https://mf.rks-gov.net/en-
us/Reports/Reports-and-Publications/Budget-Circular. 4 Ministry of Finance of the Republic of Kosovo, Budget Circular 2015/02 for Municipalities, 2015, at: https://mf.rks-
gov.net/en-us/Reports/Reports-and-Publications/Budget-Circular.
8
The report begins with an overview of demographics in Kosovo, necessary for identifying needs. It then conducts a Gender+ analysis of various MLSW departments and divisions, their budgets, and beneficiaries. The focus is on how MLSW services, subsidies, and transfers benefitted target groups. This report only examines two expense categories (wages and salaries; subsidies and transfers) because these are arguably the most important in terms of beneficiaries and target groups. Further, sufficient gender-disaggregated data presently is unavailable for a detailed analysis of other expense categories. All data were provided by the respective MLSW departments and divisions unless otherwise noted. Thus, all projections for future years made within tables were made by the respective departments and divisions within the Ministry.
Evidence-based recommendations are presented for each department and division towards more effective and efficient spending that furthers gender equality, in accordance with the Law on Gender Equality. This includes identifying specific objectives, indicators and activities where they exist towards furthering gender equality and more targeted spending on diverse demographic groups within each department and division.
Key Demographic Data to Inform Gender Analysis
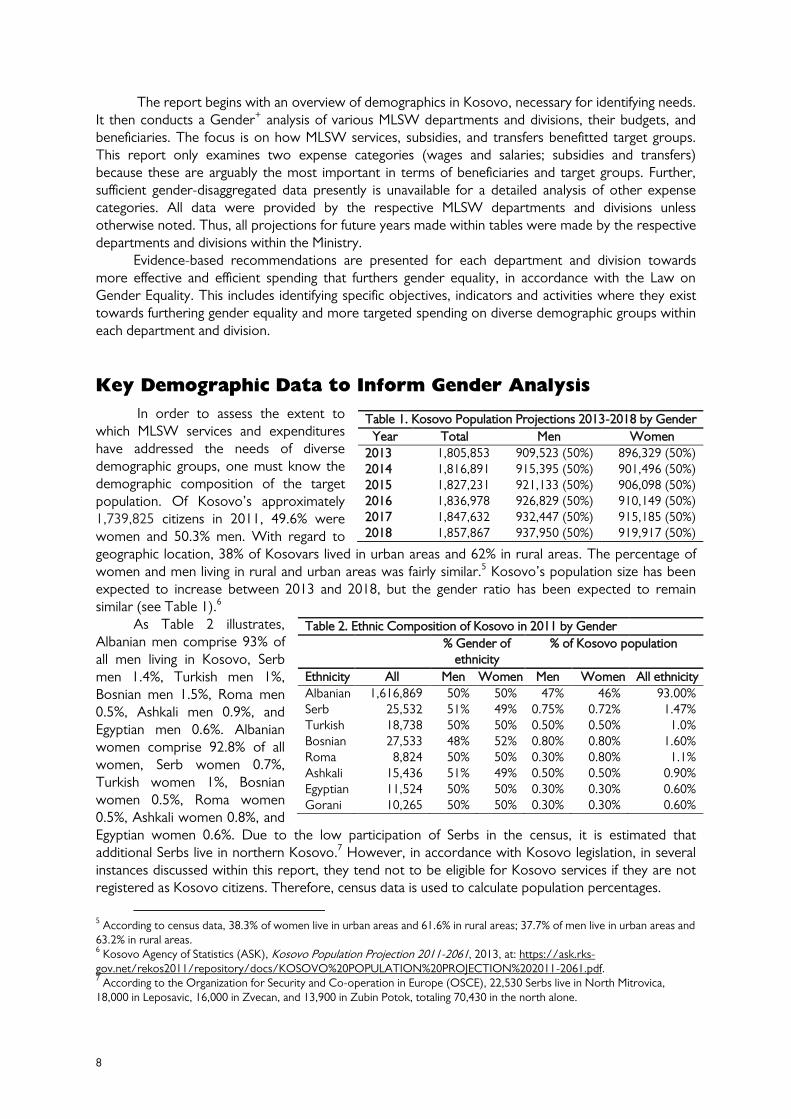
In order to assess the extent to which MLSW services and expenditures have addressed the needs of diverse demographic groups, one must know the demographic composition of the target population. Of Kosovo’s approximately 1,739,825 citizens in 2011, 49.6% were women and 50.3% men. With regard to geographic location, 38% of Kosovars lived in urban areas and 62% in rural areas. The percentage of women and men living in rural and urban areas was fairly similar.5 Kosovo’s population size has been expected to increase between 2013 and 2018, but the gender ratio has been expected to remain similar (see Table 1).6
As Table 2 illustrates, Albanian men comprise 93% of all men living in Kosovo, Serb men 1.4%, Turkish men 1%, Bosnian men 1.5%, Roma men 0.5%, Ashkali men 0.9%, and Egyptian men 0.6%. Albanian women comprise 92.8% of all women, Serb women 0.7%, Turkish women 1%, Bosnian women 0.5%, Roma women 0.5%, Ashkali women 0.8%, and Egyptian women 0.6%. Due to the low participation of Serbs in the census, it is estimated that additional Serbs live in northern Kosovo.7 However, in accordance with Kosovo legislation, in several instances discussed within this report, they tend not to be eligible for Kosovo services if they are not registered as Kosovo citizens. Therefore, census data is used to calculate population percentages.
5 According to census data, 38.3% of women live in urban areas and 61.6% in rural areas; 37.7% of men live in urban areas and
63.2% in rural areas. 6 Kosovo Agency of Statistics (ASK), Kosovo Population Projection 2011-2061, 2013, at: https://ask.rks-
gov.net/rekos2011/repository/docs/KOSOVO%20POPULATION%20PROJECTION%202011-2061.pdf. 7 According to the Organization for Security and Co-operation in Europe (OSCE), 22,530 Serbs live in North Mitrovica,
18,000 in Leposavic, 16,000 in Zvecan, and 13,900 in Zubin Potok, totaling 70,430 in the north alone.
Table 1. Kosovo Population Projections 2013-2018 by Gender
Year Total Men Women
2013 1,805,853 909,523 (50%) 896,329 (50%) 2014 1,816,891 915,395 (50%) 901,496 (50%) 2015 1,827,231 921,133 (50%) 906,098 (50%) 2016 1,836,978 926,829 (50%) 910,149 (50%) 2017 1,847,632 932,447 (50%) 915,185 (50%) 2018 1,857,867 937,950 (50%) 919,917 (50%)
Table 2. Ethnic Composition of Kosovo in 2011 by Gender
% Gender of ethnicity
% of Kosovo population
Ethnicity All Men Women Men Women All ethnicity
Albanian 1,616,869 50% 50% 47% 46% 93.00% Serb 25,532 51% 49% 0.75% 0.72% 1.47% Turkish 18,738 50% 50% 0.50% 0.50% 1.0% Bosnian 27,533 48% 52% 0.80% 0.80% 1.60% Roma 8,824 50% 50% 0.30% 0.80% 1.1% Ashkali 15,436 51% 49% 0.50% 0.50% 0.90% Egyptian 11,524 50% 50% 0.30% 0.30% 0.60% Gorani 10,265 50% 50% 0.30% 0.30% 0.60%
9
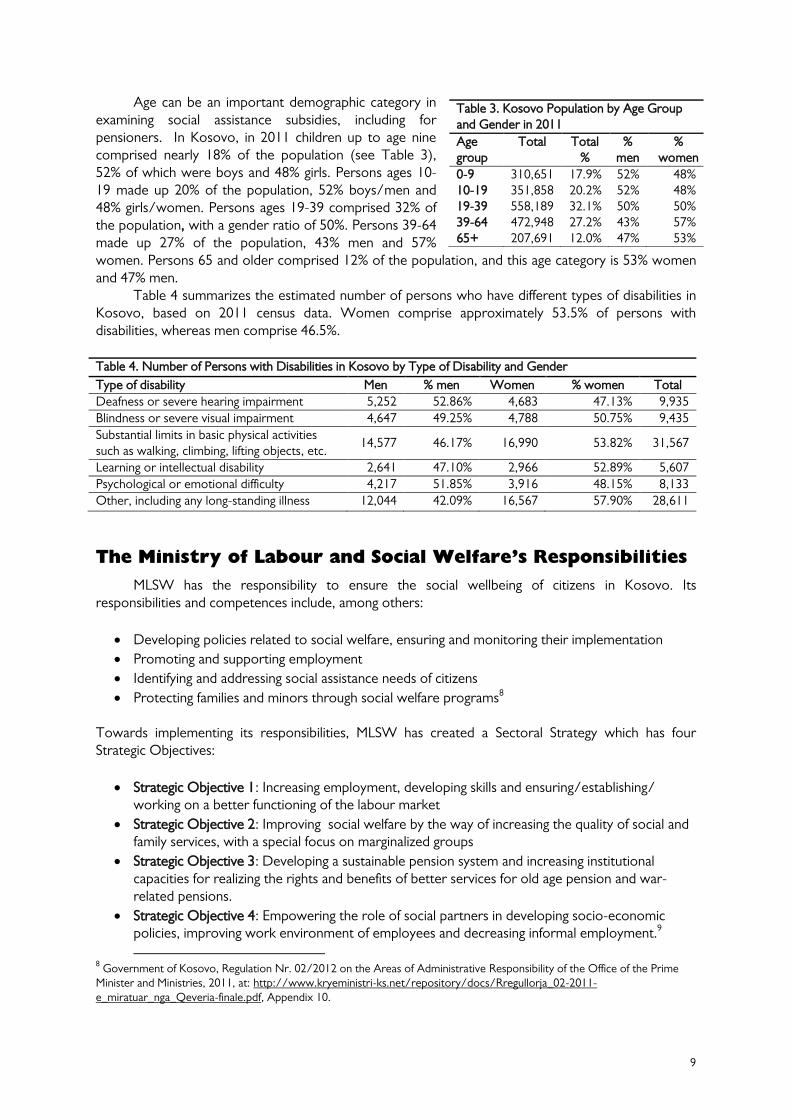
Age can be an important demographic category in examining social assistance subsidies, including for pensioners. In Kosovo, in 2011 children up to age nine comprised nearly 18% of the population (see Table 3), 52% of which were boys and 48% girls. Persons ages 10-19 made up 20% of the population, 52% boys/men and 48% girls/women. Persons ages 19-39 comprised 32% of the population, with a gender ratio of 50%. Persons 39-64 made up 27% of the population, 43% men and 57% women. Persons 65 and older comprised 12% of the population, and this age category is 53% women and 47% men.
Table 4 summarizes the estimated number of persons who have different types of disabilities in Kosovo, based on 2011 census data. Women comprise approximately 53.5% of persons with disabilities, whereas men comprise 46.5%.
Table 4. Number of Persons with Disabilities in Kosovo by Type of Disability and Gender
Type of disability Men % men Women % women Total
Deafness or severe hearing impairment 5,252 52.86% 4,683 47.13% 9,935
Blindness or severe visual impairment 4,647 49.25% 4,788 50.75% 9,435
Substantial limits in basic physical activities such as walking, climbing, lifting objects, etc.
14,577 46.17% 16,990 53.82% 31,567
Learning or intellectual disability 2,641 47.10% 2,966 52.89% 5,607
Psychological or emotional difficulty 4,217 51.85% 3,916 48.15% 8,133
Other, including any long-standing illness 12,044 42.09% 16,567 57.90% 28,611
The Ministry of Labour and Social Welfare’s Responsibilities
MLSW has the responsibility to ensure the social wellbeing of citizens in Kosovo. Its responsibilities and competences include, among others:
Developing policies related to social welfare, ensuring and monitoring their implementation
Promoting and supporting employment
Identifying and addressing social assistance needs of citizens
Protecting families and minors through social welfare programs8
Towards implementing its responsibilities, MLSW has created a Sectoral Strategy which has four Strategic Objectives:
Strategic Objective 1: Increasing employment, developing skills and ensuring/establishing/ working on a better functioning of the labour market
Strategic Objective 2: Improving social welfare by the way of increasing the quality of social and family services, with a special focus on marginalized groups
Strategic Objective 3: Developing a sustainable pension system and increasing institutional capacities for realizing the rights and benefits of better services for old age pension and war-related pensions.
Strategic Objective 4: Empowering the role of social partners in developing socio-economic policies, improving work environment of employees and decreasing informal employment.9
8 Government of Kosovo, Regulation Nr. 02/2012 on the Areas of Administrative Responsibility of the Office of the Prime
Minister and Ministries, 2011, at: http://www.kryeministri-ks.net/repository/docs/Rregullorja_02-2011-e_miratuar_nga_Qeveria-finale.pdf, Appendix 10.
Table 3. Kosovo Population by Age Group and Gender in 2011
Age group
Total Total %
% men
% women
0-9 310,651 17.9% 52% 48% 10-19 351,858 20.2% 52% 48% 19-39 558,189 32.1% 50% 50% 39-64 472,948 27.2% 43% 57% 65+ 207,691 12.0% 47% 53%

10
In order to achieve these objectives, an analysis of the needs of these different target groups is important. Such an analysis must include gender-disaggregated data in accordance with the Law on Gender Equality’s requirements for gender-disaggregated data and GRB.
Division for Human Resources
The Human Resources Division administers staff recruitment; improves skills and training of staff; and coordinates human resources planning, among other responsibilities.10 Data from the Human Resources Division is useful for informing GRB related to the salaries and wages expense category of the budget.
Table 5 shows that while women comprise a slight majority of persons employed by MLSW at lower pay scale levels, men are employed at significantly higher rates at higher salary levels.11 A slight improvement can be noted compared to 2014 when no women were employed at the €600+ salary level.12 However, men still receive the vast majority of expenditures from this expense category, and the percentage of women in decision-making positions (19%) is not in line with the requirements of the new Law on Gender Equality (50%).
Table 6 shows that most employees at MLSW have been Albanian men (48% in 2013-2014). This percentage increased to 55% in 2015. Albanian women comprised 42% to 46% of employees from 2013 to 2015. In 2013 and 2014, Albanian women were slightly underrepresented as they comprise 46% of the total population of Kosovo. Minority ethnic groups seem to be adequately represented within MLSW as per their percentage of Kosovo’s population. This can contribute to ensuring that the interests of diverse women and men in Kosovo are considered in policies and programs of MLSW.
Table 6. Number and Percentage of MLSW Employees by Gender and Ethnicity in 2015
Year Total Alb. m.
Alb. m. %
Alb. w.
Alb. w. %
Serb m.
Serb m. %
Serb w.
Serb w. %
Roma m.
Roma m. %
Other men
Other m. %
Other w.
Other w. %
2013 1,013 483 48% 426 42% 48 5% 35 3% 1 0.1% 3 0.3% 17 2% 2014 978 471 48% 411 42% 34 3% 40 4% 5 0.5% 2 0.2% 15 2% 2015 794 436 55% 358 45% 32 4% 38 5% 5 0.6% 2 0.3% 15 2%
Key Conclusions
Despite improvements since 2014, Albanian women remain under-represented in MLSW, particularly at decision-making levels and higher pay scales. Men are slightly under-represented in lower pay scale levels.
Recommendations
Continue to increase the percentage of women employed at higher pay scale levels annually until the legal requirement of women’s 50% employment at all levels of pay is achieved. This can be achieved when job openings exist through affirmative actions in hiring procedures, as foreseen by the Law on Gender Equality.
9 Translated and adapted from MLSW, Sectorial Strategy of the Ministry of Labour and Social Welfare 2014-2020, Prishtina:
2014. 10
Government of Kosovo, MLSW website, at: https://mpms.rks-gov.net/en-us/departments/departmentoffinanceandgeneralservices/humanresourcesdivision.aspx. 11
Unfortunately the Division did not provide data with regard to actual amounts received by women and men, though this data exists. 12
KWN, Budgeting for Social Welfare, Prishtina: 2014, at: http://www.womensnetwork.org/documents/20140702111942678.pdf.
Table 5. MLSW Pay Scale Levels by Gender, 2015
Level of pay Men Women Total % men % women
€201-400 186 218 404 46% 54% €401-600 266 190 456 58% 42% €600+ 21 5 26 81% 19%

11
Analyse gender disaggregated data of MLSW employees by rank and level of salary every year.
The Pension System in Kosovo
Designed in 2003, the current pension system of the Republic of Kosovo has three pillars: I) old age “basic pension” and disability pension; II) mandatory contributory pension; and III) other voluntary schemes.13 This analysis focuses on the first two pillars, for which the Government of Kosovo has a budgetary responsibility.14 Basic Pension
Law No. 04/L-101 on Pension Funds of Kosovo defines “Basic Pension” as “a Pension paid by the Pension Administration to permanent residents of Kosovo and who have reached Pension Age.”15 Thus all citizens of the Republic (women and men) who are over age 65 are eligible for this pension. This pension is not tied to previous contributions into the pension system. The Kosovo Pensions Administration (KPA) is responsible for administering this pension through monthly money transfers.
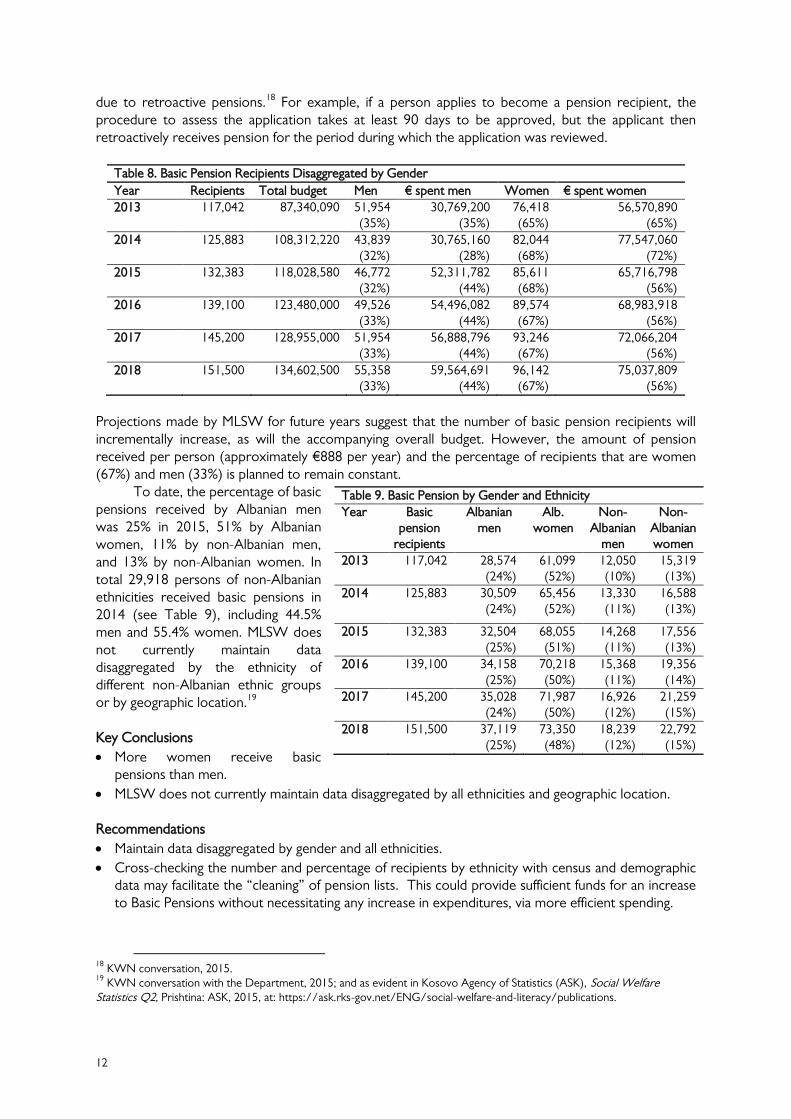
The amount of basic pension distributed per person should be set annually, aligned with the amount necessary for minimum consumption as per the monthly food basket.16 Any amount less than this would place pensioners at risk of poverty. Table 7 shows how the monthly basic pension has changed from 2011 to 2015, including government projections for 2016-2018. It shows that the pension distributed per person per month in 2011-2013 was not aligned with the minimum basket of goods (€63 in 2012). However, in 2014 pensions were increased to €75 per month. While this is more than the minimum basket of goods, it would be very difficult for a person to live independently and have shelter for this amount of money. Thus, elderly persons receiving this pension likely still depend on other family members in order to survive.
In 2014,17 the total budget for basic pensions was €108,312,220. From this, women received €77,547,060 (71.6%), while men received €30,765,160 (28.4%). Further, Table 8 shows that continuously more women than men have benefited from basic pensions. Approximately 65% of basic pension subsidies have been distributed to women and 35% to men. Data from the 2011 census show that there are more women over age 65 than men. Even so, the amount of basic pensions spent on women (65%) amounts to more than their percentage of the population (53%). The difference in benefits perhaps can be attributed to the fact that historically fewer women than men have worked in Kosovo. Therefore more men qualify for the Contributory Pension (see below) than women. As a result, more women receive the basic pension than men.
Table 8 also illustrates that there is a difference in the percentage of recipients by gender compared to the percentage of expenditures on persons of that gender. For example, in 2015, men comprise 32% of recipients, but received 44% of expenditures. According to MLSW, this difference is
13
Group for Legal and Political Studies, Pension System in Kosovo: Review of current state, main challenges and gaps, Prishtina: 2012, at: http://legalpoliticalstudies.org/download/Policy%20Report%2006%202012%20eng.pdf. 14
The third pillar includes voluntary private pension schemes which are subject to licensing by the Kosovo Central Bank. 15
Assembly of the Republic of Kosovo, Law No. 04/L-101, 2012, at: http://www.kuvendikosoves.org/common/docs/ligjet/Law%20on%20Pension%20Funds%20of%20Kosovo.pdf. 16
World Bank, The Kosovo Pension Reform: Achievements and Lessons, 2007, at: http://siteresources.worldbank.org/SOCIALPROTECTION/Resources/SP-Discussion-papers/Pensions-DP/0707.pdf and Group for Legal and Political Studies, Pension System in Kosovo, p. 7. 17
This is the most recent year with complete data available. While data exists for 2015, it includes only the first six months of the year.
Table 7. Monthly Basic Pensions 2011-2018
Year Monthly pension
Annual budget allocated for basic pensions
2011 €45 n/a
2012 €50 n/a
2013 €60 €87,340,090
2014 €75 €108,312,220
2015 €74 €119,083,714
2016 €74 €123,480,000 2017 €74 €134,602,500
2018 €74 €128,955,000
12
due to retroactive pensions.18 For example, if a person applies to become a pension recipient, the procedure to assess the application takes at least 90 days to be approved, but the applicant then retroactively receives pension for the period during which the application was reviewed.
Table 8. Basic Pension Recipients Disaggregated by Gender
Year Recipients Total budget Men € spent men Women € spent women
2013 117,042 87,340,090 51,954 (35%)
30,769,200 (35%)
76,418 (65%)
56,570,890 (65%)
2014 125,883 108,312,220 43,839 (32%)
30,765,160 (28%)
82,044 (68%)
77,547,060 (72%)
2015 132,383 118,028,580 46,772 (32%)
52,311,782 (44%)
85,611 (68%)
65,716,798 (56%)
2016 139,100 123,480,000 49,526 (33%)
54,496,082 (44%)
89,574 (67%)
68,983,918 (56%)
2017 145,200 128,955,000 51,954 (33%)
56,888,796 (44%)
93,246 (67%)
72,066,204 (56%)
2018 151,500 134,602,500 55,358 (33%)
59,564,691 (44%)
96,142 (67%)
75,037,809 (56%)
Projections made by MLSW for future years suggest that the number of basic pension recipients will incrementally increase, as will the accompanying overall budget. However, the amount of pension received per person (approximately €888 per year) and the percentage of recipients that are women (67%) and men (33%) is planned to remain constant.
To date, the percentage of basic pensions received by Albanian men was 25% in 2015, 51% by Albanian women, 11% by non-Albanian men, and 13% by non-Albanian women. In total 29,918 persons of non-Albanian ethnicities received basic pensions in 2014 (see Table 9), including 44.5% men and 55.4% women. MLSW does not currently maintain data disaggregated by the ethnicity of different non-Albanian ethnic groups or by geographic location.19 Key Conclusions
More women receive basic pensions than men.
MLSW does not currently maintain data disaggregated by all ethnicities and geographic location.
Recommendations
Maintain data disaggregated by gender and all ethnicities.
Cross-checking the number and percentage of recipients by ethnicity with census and demographic data may facilitate the “cleaning” of pension lists. This could provide sufficient funds for an increase to Basic Pensions without necessitating any increase in expenditures, via more efficient spending.
18
KWN conversation, 2015. 19
KWN conversation with the Department, 2015; and as evident in Kosovo Agency of Statistics (ASK), Social Welfare Statistics Q2, Prishtina: ASK, 2015, at: https://ask.rks-gov.net/ENG/social-welfare-and-literacy/publications.
Table 9. Basic Pension by Gender and Ethnicity
Year Basic pension
recipients
Albanian men
Alb. women
Non-Albanian
men
Non-Albanian women
2013 117,042 28,574 (24%)
61,099 (52%)
12,050 (10%)
15,319 (13%)
2014 125,883 30,509 (24%)
65,456 (52%)
13,330 (11%)
16,588 (13%)
2015 132,383 32,504 (25%)
68,055 (51%)
14,268 (11%)
17,556 (13%)
2016 139,100 34,158 (25%)
70,218 (50%)
15,368 (11%)
19,356 (14%)
2017 145,200 35,028 (24%)
71,987 (50%)
16,926 (12%)
21,259 (15%)
2018 151,500 37,119 (25%)
73,350 (48%)
18,239 (12%)
22,792 (15%)

13
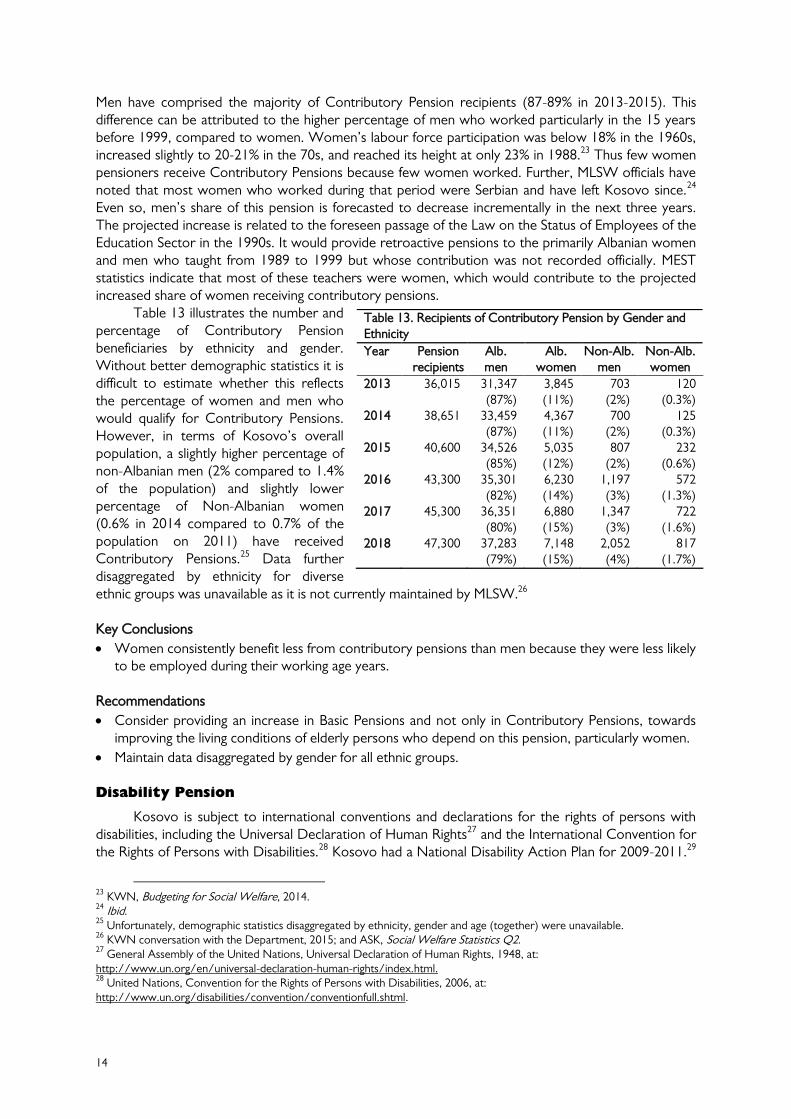
Contributory Pension
The Contributory Pension program requires all working permanent residents of Kosovo to contribute 5% of their gross salary to the pension trust. There is an additional 5% payment from the employer.20 Employees may select to pay an additional 5% on a voluntary basis, adding up to a maximum of 15%. Additionally, employers can contribute 10% more, adding up to a maximum of 15% from the employer. Persons who have contributed more to the pension trust qualify for increased pension amounts upon retirement. Thus, the percentage of pension recipients by gender could differ compared to the percentage of expenditures on recipients based on salaries and extra pay-ins made earlier in life.
Each year the amount of Contributory Pensions has increased slightly, and the amount is planned to increase by one Euro annually from 2016-2018 (see Table 10).
Table 11 shows planned expenditures for 2016-2018 based on the Draft Law on Budget 2016.21 MLSW has adequately budgeted for the €23 million planned increase to Contributory Pensions in 2016. This increase only applies to Contributory Pensions and not to Basic Pensions. This is concerning as Basic Pension recipients, primarily women, already receive less that persons receiving Contributory Pension. Further, MLSW has only budgeted for this increase to occur in 2015. Table 11 shows that Contributory Pension may decrease again from 2017.
The €23 million increase for Contributory Pensions, decided upon in November 2015 and reflected in the 2016 draft budget, is not reflected in the original beneficiary and budget projections that MLSW initially provided in October (see Table 12). However, this information is presented as it was received from MLSW because it contains projections regarding the number and percentages of beneficiaries by gender. Presumably the number and percentages of recipients will remain as originally planned.
The number of Contributory Pension beneficiaries has continuously increased, as illustrated by Table 12.
20
Assembly of the Republic of Kosovo, Administrative Instruction No. 15/2009, for the growth of pensions for implementation of decision of the government No. 02/51, July 2009, Art. 4, at: https://mpms.rks-gov.net/Portals/0/Ligji/Sekondar/U.A%20Nr.15-2009%20Për%20Rritjen%20e%20pensioneve%20për%20zbatimin%20e%20Vendimit%20të%20Qeverisë%20Nr.02-51.pdf. 21
Ministry of Finance, Draft Law on Budget 2016, 2015, at: https://mf.rks-gov.net/en-us/Budget/Budget-of-Republic-of-Kosovo/Central-Budget. 22
Notably the total amount distributed so far to women and men does not add up to the total budget because this table only includes amounts distributed as of September 2015.
Table 10. Annual Pension per Person
Year €
2013 1,372 2014 1,601 2015 1,690 2016 1,659 2017 1,660 2018 1,661
Table 11. Actual and Planned Expenditures for
Contributory Pension
Year Subsidies and transfers
2014 €47,897,475 2015 2016 2017 2018
€68,633,800 €91,683,800 €84,073,874 €89,073,874
Table 12. Contributory Pension Recipients by Gender
Year Pension recipients Total budget Men € for men Women € for women
2013 36,015 49,412,649 32,050 (89%)
43,836,297 (89%)
3,965 (11%)
5,576,352 (11%)
2014 38,651 61,895,592 34,159 (88%)
54,111,132 (87%)
4,492 (12%)
7,784,460 (13%)
2015 (Sep.)
22
40,600 68,633,800 35,333 (87%)
39,436,103 (57%)
5,267 (13%)
5,355,880 (8%)
2016 43,300 71,827,000 36,498 (84%)
53,347,438 (74%)
6,802 (16%)
18,479,562 (26%)
2017 45,300 75,180,000 37,698 (83%)
55,169,524 (73%)
7,602 (17%)
20,010,476 (27%)
2018 47,300 78,547,000 39,335 (83%)
56,676,331 (72%)
7,965 (17%)
21,870,669 (28%)
14
Men have comprised the majority of Contributory Pension recipients (87-89% in 2013-2015). This difference can be attributed to the higher percentage of men who worked particularly in the 15 years before 1999, compared to women. Women’s labour force participation was below 18% in the 1960s, increased slightly to 20-21% in the 70s, and reached its height at only 23% in 1988.23 Thus few women pensioners receive Contributory Pensions because few women worked. Further, MLSW officials have noted that most women who worked during that period were Serbian and have left Kosovo since.24 Even so, men’s share of this pension is forecasted to decrease incrementally in the next three years. The projected increase is related to the foreseen passage of the Law on the Status of Employees of the Education Sector in the 1990s. It would provide retroactive pensions to the primarily Albanian women and men who taught from 1989 to 1999 but whose contribution was not recorded officially. MEST statistics indicate that most of these teachers were women, which would contribute to the projected increased share of women receiving contributory pensions.
Table 13 illustrates the number and percentage of Contributory Pension beneficiaries by ethnicity and gender. Without better demographic statistics it is difficult to estimate whether this reflects the percentage of women and men who would qualify for Contributory Pensions. However, in terms of Kosovo’s overall population, a slightly higher percentage of non-Albanian men (2% compared to 1.4% of the population) and slightly lower percentage of Non-Albanian women (0.6% in 2014 compared to 0.7% of the population on 2011) have received Contributory Pensions.25 Data further disaggregated by ethnicity for diverse ethnic groups was unavailable as it is not currently maintained by MLSW.26
Key Conclusions
Women consistently benefit less from contributory pensions than men because they were less likely to be employed during their working age years.
Recommendations
Consider providing an increase in Basic Pensions and not only in Contributory Pensions, towards improving the living conditions of elderly persons who depend on this pension, particularly women.
Maintain data disaggregated by gender for all ethnic groups. Disability Pension
Kosovo is subject to international conventions and declarations for the rights of persons with disabilities, including the Universal Declaration of Human Rights27 and the International Convention for the Rights of Persons with Disabilities.28 Kosovo had a National Disability Action Plan for 2009-2011.29
23
KWN, Budgeting for Social Welfare, 2014. 24
Ibid. 25
Unfortunately, demographic statistics disaggregated by ethnicity, gender and age (together) were unavailable. 26
KWN conversation with the Department, 2015; and ASK, Social Welfare Statistics Q2. 27
General Assembly of the United Nations, Universal Declaration of Human Rights, 1948, at: http://www.un.org/en/universal-declaration-human-rights/index.html. 28
United Nations, Convention for the Rights of Persons with Disabilities, 2006, at: http://www.un.org/disabilities/convention/conventionfull.shtml.
Table 13. Recipients of Contributory Pension by Gender and Ethnicity
Year Pension recipients
Alb. men
Alb. women
Non-Alb. men
Non-Alb. women
2013 36,015 31,347 (87%)
3,845 (11%)
703 (2%)
120 (0.3%)
2014 38,651 33,459 (87%)
4,367 (11%)
700 (2%)
125 (0.3%)
2015 40,600 34,526 (85%)
5,035 (12%)
807 (2%)
232 (0.6%)
2016 43,300 35,301 (82%)
6,230 (14%)
1,197 (3%)
572 (1.3%)
2017 45,300 36,351 (80%)
6,880 (15%)
1,347 (3%)
722 (1.6%)
2018 47,300 37,283 (79%)
7,148 (15%)
2,052 (4%)
817 (1.7%)

15
Since 2013, Kosovo has a ten year strategy on the rights of persons with disabilities.30 Pensions for persons with disabilities in Kosovo are regulated by Law No. 2003/33 on Disability Pensions in Kosovo.31 This law provides “financial support to adult persons who are habitual residents of Kosovo and who are totally and permanently disabled and incapable of any form of occupational activity”.32 Children with disabilities and their families fall under another pension scheme detailed in another section of this report. One qualifies for this pension following diagnosis by a medical commission. The pension received by persons unable to work due to disability is the same amount as that of Basic Pension.
The law foresees recipients to be between the ages of 18 and 65. Only persons who are completely unable to work qualify for this pension scheme. Prior KWN research noted that this policy fails at encouraging persons with disabilities to be independent. Further, the minimal amount provided means that persons must rely heavily on support from their families for survival.33 When disabled persons over age 65 stop receiving disability pension, they receive basic old-age pension. In 2015, for example, this would mean that their annual pension would be reduced from €922 to €888 when they surpass age 65 (or from €77 to €74 per month).
Table 15 shows that from 2013 to 2015 slightly more men (51-52%) benefitted from this pension scheme than women (45-48%). However, census data suggests that more women might be in need of the disability pension than men. Further, all citizens in need of disability pension may not be receiving it. In total, 31,567 persons have “Substantial limits in basic physical activities such as walking, climbing, lifting objects”, 46% of whom are men and 54% women. The percentage of women (54%) with this form of disability does not align with actual recipients of this pension (48% women). Key Conclusions
Census data suggest that not all persons with “substantial” disabilities receive this pension.
Census data also show that more women have disabilities than men. Women may lack information about these benefits.
Recommendations
Work with civil society organizations (CSOs) assisting persons with disabilities and media to ensure that all are aware of their right to this pension, targeting women in particular with information.
29
Office of the Prime Minister of Kosovo, National Disability Action Plan for the Republic of Kosovo, 2009, at: http://www.cooperazioneallosviluppo.esteri.it/pdgcs/italiano/iniziative/pdf/Kosovo_Plan.pdf. 30
Office of the Prime Minister, National Strategy on the rights of persons with disabilities in the Republic of Kosovo 2013-2023, 2013, at: http://www.kryeministri-ks.net/repository/docs/STRATEGJIA_NACIONALE_PER_TE_DREJTAT_E_PERSONAVE_ME_AFTESI_TE..._Shq+Ser+Ang.pdf. 31
Assembly of the Republic of Kosovo, Law No. 2003/33 on Disability Pensions, 2003, at: http://www.kuvendikosoves.org/common/docs/ligjet/2003_23_en.pdf. 32
Ibid, p. 1. 33
KWN, Budgeting for Social Welfare.
Table 14. Annual Pension per Person
Year € 2013 1,164 2014 916 2015 922 2016 923 2017 941 2018 942
Table 15. Disability Pension Recipients Disaggregated by Gender
Year Pension recipients
Men € for men Women € for women
2013 11,748 6,264 (53%)
7,086,118 (50%)
5,476 (47%)
7,165,919 (50%)
2014 18,318 9,541 (52%)
8,859,560 (53%)
8,777 (48%)
7,904,520 (47%)
2015 19,445 10,027 (52%)
6,000,535 (50%)
9,418 (48%)
6,113,640 (50%)
2016 19,500 10,027 (51%)
8,924,723 (50%)
9,473 (49%)
9,075,277 (50%)
2017 19,200 9,876 (51%)
8,956,223 (50%)
9,324 (49%)
9,106,777 (50%)
2018 19,200 9,880 (51%)
8,969,723 (50%)
9,320 (49%)
9,120,277 (50%)
16
Consider putting forth a policy for parliamentary review that would enable persons with disabilities to continue to receive the same pension when over age 65.
Early Compensation for Workers of Trepca
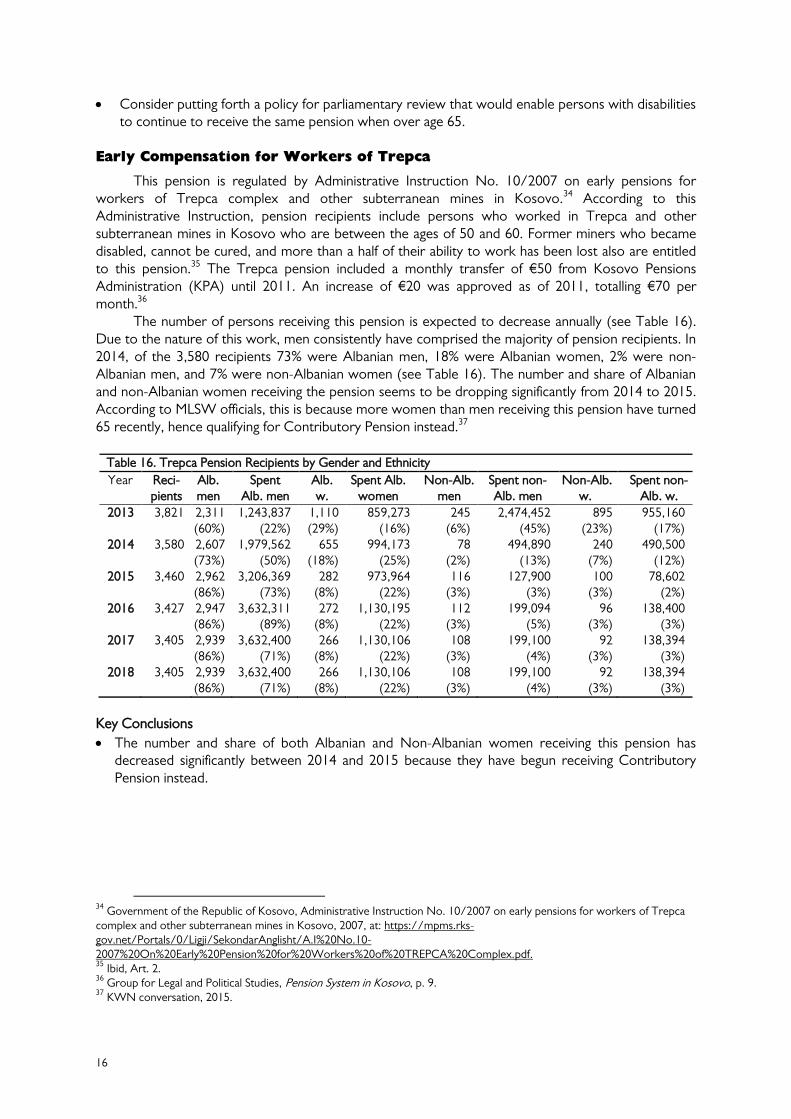
This pension is regulated by Administrative Instruction No. 10/2007 on early pensions for workers of Trepca complex and other subterranean mines in Kosovo.34 According to this Administrative Instruction, pension recipients include persons who worked in Trepca and other subterranean mines in Kosovo who are between the ages of 50 and 60. Former miners who became disabled, cannot be cured, and more than a half of their ability to work has been lost also are entitled to this pension.35 The Trepca pension included a monthly transfer of €50 from Kosovo Pensions Administration (KPA) until 2011. An increase of €20 was approved as of 2011, totalling €70 per month.36
The number of persons receiving this pension is expected to decrease annually (see Table 16). Due to the nature of this work, men consistently have comprised the majority of pension recipients. In 2014, of the 3,580 recipients 73% were Albanian men, 18% were Albanian women, 2% were non-Albanian men, and 7% were non-Albanian women (see Table 16). The number and share of Albanian and non-Albanian women receiving the pension seems to be dropping significantly from 2014 to 2015. According to MLSW officials, this is because more women than men receiving this pension have turned 65 recently, hence qualifying for Contributory Pension instead.37
Table 16. Trepca Pension Recipients by Gender and Ethnicity
Year Reci-pients
Alb. men
Spent Alb. men
Alb. w.
Spent Alb. women
Non-Alb. men
Spent non-Alb. men
Non-Alb. w.
Spent non-Alb. w.
2013 3,821 2,311(60%)
1,243,837 (22%)
1,110 (29%)
859,273 (16%)
245 (6%)
2,474,452 (45%)
895 (23%)
955,160 (17%)
2014 3,580 2,607 (73%)
1,979,562 (50%)
655 (18%)
994,173 (25%)
78 (2%)
494,890 (13%)
240 (7%)
490,500 (12%)
2015 3,460 2,962 (86%)
3,206,369 (73%)
282 (8%)
973,964 (22%)
116 (3%)
127,900 (3%)
100 (3%)
78,602 (2%)
2016 3,427 2,947 (86%)
3,632,311 (89%)
272 (8%)
1,130,195 (22%)
112 (3%)
199,094 (5%)
96 (3%)
138,400 (3%)
2017 3,405 2,939 (86%)
3,632,400 (71%)
266 (8%)
1,130,106 (22%)
108 (3%)
199,100 (4%)
92 (3%)
138,394 (3%)
2018 3,405 2,939 (86%)
3,632,400 (71%)
266 (8%)
1,130,106 (22%)
108 (3%)
199,100 (4%)
92 (3%)
138,394 (3%)
Key Conclusions
The number and share of both Albanian and Non-Albanian women receiving this pension has decreased significantly between 2014 and 2015 because they have begun receiving Contributory Pension instead.
34
Government of the Republic of Kosovo, Administrative Instruction No. 10/2007 on early pensions for workers of Trepca complex and other subterranean mines in Kosovo, 2007, at: https://mpms.rks-gov.net/Portals/0/Ligji/SekondarAnglisht/A.I%20No.10-2007%20On%20Early%20Pension%20for%20Workers%20of%20TREPCA%20Complex.pdf. 35
Ibid, Art. 2. 36
Group for Legal and Political Studies, Pension System in Kosovo, p. 9. 37
KWN conversation, 2015.

17
Division for Heritage Issues of the Kosovo Protection Corps
Pensions for Kosovo Protection Corps (KPC) members are regulated by Law No. 03/L-100.38 This pension is based on principles of equality and non-discrimination.39 Recipients include former KPC members and their families. The pension amount is calculated based on the position held and years of service in the KPC.40 The vast majority of pension recipients have been Albanian men, namely because most persons who served in KPC were Albanian men (see Table 17).
Table 17. KPC Pension Recipients by Gender and Ethnicity Year Reci-
pients Alb. men
% Alb. men
Spent Alb. men
Alb. w.
% Alb. w.
Spent Alb.
women
non- Alb. men
% non- Alb. men
Spent non-Alb.
men
Non-Alb. w.
% non-Alb. w.
Spent non-Alb.
w.
2013 801 760 95% 1,703,503 32 4% 57,752 6 1% 12,564 3 0% 7,092 2014 844 794 94% 2,099,727 41 5% 90,852 6 1% 15,708 3 0% 6,708 2015 922 844 92% 1,935,656 49 5% 201,684 16 2% 191,128 13 1% 94,800 2016 1,109 951 86% 2,443,757 102 9% 411,751 31 3% 270,760 25 2% 99,332 2017 1,195 987 83% 2,636,557 129 11% 479,351 46 4% 328,360 33 3% 126,932 2018 1,262 1,029 82% 2,767,947 136 11% 514,961 55 4% 353,360 42 3% 134,932
Pensions for Members of the Kosovo Security Force
Law No. 04/L-084 on Pensions of Members of the Kosovo Security Force (KSF) regulates this pension.41 KSF members are eligible for pension if they served in the KSF at least 20 years, and they have reached the age of 55, or if they need to terminate their service due to disability resulting from injuries sustained during service.42
The pension amount is set as a percentage of the member’s gross salary and time in service, and based on their rank. The base pension is 40% of their gross salary at the moment of retirement. For every year of service, the amount is increased by 2% but cannot exceed 60% of their salary.43
Recipients receive this pension regardless of whether they continue to work in other sectors, as long as they do not serve in KSF.44 However, they may choose whether they want to receive this pension or pension from another scheme that applies to them.45 Family members (spouses, children, and parents) of KSF members are eligible to receive this pension if the KSF member has passed away.
Again, most recipients of this pension are Albanian men, as they have comprised the majority of persons in KSF. The total budget for 2015 is €800,000, 69% of which is being distributed to Albanian men, 17% to Albanian women, and 14% to non-Albanian men. No non-Albanian women receive this pension as they have not served in KSF.
Table 18. KSF Pension Recipients by Ethnicity and Gender Year Reci-
pients Alb. men
% Alb. men
Spent Alb. men
Alb. w.
% Alb. w.
Spent Alb. women
Non Alb. men
% non-Alb. men
Spent non-Alb. women
2013 105 98 93% 209,257 5 5% 19,665 2 2% 5652 2014 134 125 93% 378,301 6 4% 35,268 3 2% 10,620 2015 175 154 88% 550,161 13 7% 136,780 8 5% 113,059 2016 200 167 84% 705,161 21 11% 234,280 12 6% 170,559 2017 240 185 77% 838,361 37 15% 300,800 18 8% 237,159 2018 298 219 73% 841,497 53 18% 300,880 26 9% 234,023
38
Assembly of the Republic of Kosovo, Law 03/L-100 on the Pensions for Kosovo Protection Corps Members, 2008, at: http://www.gazetazyrtare.com/e-gov/index.php?option=com_content&task=view&id=278&lang=en. 39
Ibid, Art. 4. 40
KWN, Budgeting for Social Welfare. 41
Assembly of the Republic of Kosovo, Law No. 04/L-084 on Pensions of Members of the Security Force, 2012, at: http://www.mksf-ks.org/repository/docs/ON_PENSIONS_OF_MEMBERS_OF_THE_KOSOVO_SECURITY_FORCE.pdf 42
Ibid, Art. 6 43
Ibid, Art. 7. 44
KWN, Budgeting for Social Welfare. 45
Ibid.

18
The budget for this pension is expected
to remain the same in 2016, and increase in 2017 and 2018 (see Table 19). At the same time, KSF has estimated that the number of pension recipients will increase (see Table 18).
Table 19 shows that KSF has continually over-budgeted for its transfers. This trend was observed last year as well.46
Blind Persons Pension
The pension for blind persons is regulated by Law No. 04/L-092 for Blind Persons.47 The Law determines eligibility criteria and outlines the benefits and rights of blind persons. Compensation is based on the minimum wage in Kosovo, but cannot be under €100.48 Persons become eligible following an assessment conducted by a MLSW medical-social commission in Prishtina or other regions of Kosovo.49 Since April 2014, pension increases have led each blind person to receive at least €125 per month and each of their companions at least €125 per month.50
In 2014, subsidies and transfers for this pension totalled €1,800,000 (see Table 20). With pension increases, the budget for this pension more than doubled in 2015. It is planned to remain the same through 2017.
According to the 2011 census, 9,435 people in Kosovo are either blind or severely visually impaired, 46% men and 51% women. However, Table 21 shows that in 2014 only approximately one-third of these people (3,144) received a blind pension. Only fully blind persons receive this pension, so not all people registered in the census as blind or visually impaired are eligible. Of the pension recipients, 58% were men and 42% women. While women comprise 51% of all blind persons in Kosovo, they receive only 42% of pension benefits. This may suggest that some blind women may not know about their right to this pension.
With regard to ethnicity, while Albanian men comprised 52-53% of beneficiaries, they received 57% of the funds. Albanian women received 31% of funds, Non-Albanian men 8%, and Non-Albanian women 4%.
Table 21. Blind Pension Recipients by Ethnicity and Gender
Year Reci-pients
Alb. men
% Alb. men
Spent Alb. men
Alb. w.
% Alb. w.
Spent Alb. w.
Non-Alb. men
% Non-Alb. men
Spent non-Alb.
men
Non-Alb w.
% non-Alb. w.
Spent non-Alb.
w. 2014 3,144 1,674 53% 3,092,252 1223 39% 1,713,778 158 5% 418,000 89 3% 216,550 2015 3,346 1,751 52% 2,806,974 1295 39% 1,988,456 192 6% 383,685 108 3% 320,884 2016 3,456 1,806 52% 2,837,038 1323 38% 2,003,487 206 6% 391,201 121 4% 328,401 2017 3,558 1,846 52% 2,868,201 1358 38% 2,019,069 218 6% 398,992 136 4% 336,191 2018 3,650 1,880 52% 2,889,100 1390 38% 2,036,909 232 6% 410,461 148 4% 345,572
Key Conclusions
Although census data suggest more women are blind than men, more men receive this pension. Blind Albanian women in particular may be unaware of their right to this pension. Blind Albanian
46
KWN, Budgeting for Social Welfare, p. 38. 47
Assembly of the Republic of Kosovo, Law No. 04/L-092 for Blind Persons, 2012, at: http://www.kuvendikosoves.org/common/docs/ligjet/Law%20for%20blind%20%20persons.pdf. 48
Ibid, Art. 7. 49
Ibid, Art. 17. 50
KWN, Budgeting for Social Welfare.
Table 19. KSF Planned and Spent Budget by Year
Year Budget planned Budget spent % difference
2013 €631,200 €234,559 37% 2014 €537,200 €465,337 79% 2015 (Sep.) €800,000 €376,083 49% 2016 €800,000 2017 €1,110,000 2018 €1,110,000
Table 20. Blend Pension Budget
Year Subsidies and
transfers
2014 1,800,000 2015 3,914,888 2016 3,914,888 2017 3,914,888

19
men also receive more pension funds that blind Albanian women, though the reasons why are unclear.
Recommendations
Collaborate with blind associations, particularly women-led blind associations to inform people of their rights to this pension, targeting Albanian women in particular with information.
Department of Labour and Employment
The Department of Labour and Employment is responsible for drafting, implementing, and monitoring implementation of employment policies and vocational training policies. It consists of the following divisions: Employment Policy Division, Vocational Training Division, and Employment Offices Coordination and Monitoring Division. The Department also supervises the network of seven regional employment centres, 23 municipal employment offices, eight vocational training centres, and three mobile training units.51 Each of these are analysed from a gender budgeting perspective in the sections that follow. Table 22 shows that in 2014 the Department of Labour and Employment over budgeted by 20%.
Persons Registered with Employment Offices
Kosovo has one of the highest unemployment rates in the region. Further, the 2014 Labour Force Survey shows that unemployment and inactivity rates have increased for both men and women since 2013. Table 23 illustrates that women, young women in particular, are more affected by unemployment and low labour force participation than men. Nearly 80% of women compared to 38.2% of men are economically inactive. The employment rate is only 12.5% among women and 41.3%, among men. The unemployment rate is 41.6% for women and 33.1% for men. Further, 56.2% of young men are unemployed compared to 71.7% of young women.
51
KWN, Budgeting for Social Welfare.
Table 22. Department of Labour and Employment Planned and Spent Budget, 2014-2018
Year Budget planned
Budget spent
% difference
2014 €4,036,517 €3,658,989 80.3%
2015 (Sep)
€4,378,388 €2,722,097 60.0%
2016 €6,469,562
2017 €7,448,262
2018 €7,448,262
Table 23. Labour Force Participation, Inactivity and Unemployment among Women and Men in 2014
Men Women Total
Labour force participation rate 61.8% 21.4% 41.6% Inactivity rate 38.2% 78.6% 58.4% Employment rate 41.3% 12.5% 26.9% Unemployment rate 33.1% 41,6% 35.3% Youth unemployment (ages15-24) 56.2% 71.7% 61.0%
Table 24. Newly Registered Jobseekers in Employment Offices by Gender
Year Total registered
Total women
Total men Total newly registered
Newly registered women
Newly registered
men
% newly registered women
% newly registered
men
2013 268,104
124,369 (46.4%)
143,735 (53.6%)
13,128 4,336 8,792 33% 67%
2014 274,490
127,921 (46.6%)
146,566 (53.4%)
32,927 10,084 22,843 31% 69%
2015 17,390 5,084 12,306 29% 71% 2016 33,180 10,102 23,078 30% 70% 2017 33,180 10,102 23,078 30% 70% 2018 33,180 10,102 23,078 30% 70%

20
Table 24 illustrates the percentages of women and men registered with employment offices in 2013 and 2014, newly registered persons in 2013-2015, and projections for 2016-2018. In 2014, 274,490 people were registered as unemployed, 46.6% women and 53.3% men. The total share of men and women registered in 2013 and 2014 has remained similar to that in prior years.
The percentage of newly registered men (67%-71%) and women (29%-33%) also has remained fairly consistent in 2013-2015.52 Considering that a much higher percentage of women are unemployed (41.6%) than men (33.1%), particularly young women (71.7%), it would seem plausible to suggest that employment offices should actively seek to target and support groups with the highest unemployment rates, namely: young women, young men, and women. The Department has not planned to increase the percentage of women registered with employment offices. Persons registered with employment offices are predicted to remain 70% men and 30% women from 2016 through 2018.
In 2013, Albanian men comprised 58% of persons newly registered with Employment Offices, and Albanian women comprised 28% (see Table 24). Serb men comprised 3%, Serb women 1%, Roma, Ashkali and Egyptian (RAE)53 men 3%, RAE women 1%, men of other ethnicities 3%, and women from other ethnicities 2%. Since then, the percentage of persons registered with employment offices that are Albanian men seems to have increased, whereas the percentage of Albanian women has decreased. The percentage of Serbian women and men, as well as the percentage of RAE women has remained the same, but the percentage of RAE men has decreased by 1% annually. Looking forward, the Department has planned for the percentages of women and men from diverse ethnic groups to remain fairly consistent. The Labour Force Survey for 2014 did not include data disaggregated by gender and ethnicity, which makes it difficult to compare whether the services provided by employment offices targeted a similar proportion of the population as those unemployed, by ethnicity and gender. Key Conclusions
Albanian men tend to benefit more from employment services than Albanian women, though Albanian women tend to be unemployed at higher rates, particularly young women.
Among Roma, Ashkali, and Egyptians, men also tend to be registered with employment services more than women of the same ethnic group.
The Labour Force Survey for 2014 did not include data disaggregated by gender and ethnicity. Recommendations
Undertake active outreach efforts in collaboration with women’s organizations and media that seek to increase the number of Albanian, Roma, Ashkali, and Egyptian women registered with employment offices, thereby increasing the percentage of beneficiaries who are women.
52
Given the nature of these services, it is not possible to calculate how much was spent on women and men respectively, nor by ethnic group. 53
While KWN recognizes the difference between Roma, Ashkali, and Egyptian ethnic groups, due to the way in which data is collected and reported in Kosovo, KWN had not choice other than to use an acronym for presenting data for all three groups combined into one as this was the only way that such data was available. This does not suggest that KWN considers Roma, Ashkali, and Egyptians a single ethnic group, but rather three distinct ethnic groups with the acronym of “RAE”.
Table 25. Persons Newly Registered in Employment Offices by Ethnicity and Gender
Year Newly registered
% Alb. men
% A. w.
% Serb men
% S. w.
% RAE m.
RAE w.
Other men
Other w.
2013 13,128 58% 28% 3% 1% 3% 1% 3% 2% 2014 32,927 61% 27% 3% 1% 2% 1% 3% 2% 2015 17,390 64% 26% 3% 1% 1% 1% 3% 2% 2016 33,180 61% 26% 3% 1% 3% 1% 3% 1% 2017 33,180 61% 26% 3% 1% 3% 1% 3% 1% 2018 33,180 61% 26% 3% 1% 3% 1% 3% 1%
21
Addressing women’s high unemployment rates in Kosovo, as a government priority,54 requires affirmative actions by the Department and employment offices to encourage more women to register for assistance, particularly Albanian and Roma, Ashkali, and Egyptian women. Such affirmative actions towards improving gender equality in Kosovo are foreseen in the Law on Gender Equality.55
Request for Labour Force Survey data to be disaggregated by gender and ethnicity, so that this information can be used for gender analysis.
Persons Employed through Employment Offices
From the aforementioned persons registered with employment offices, in 2014 these offices found employment for 20% of people. More men have consistently been employed than women (see Table 26). Women have comprised less than one-fourth of the persons employed by employment offices. The percentage of women employed is neither representative of the population of women registered with employment offices, nor of the greater target group of unemployed women in Kosovo.
Table 26. Persons Employed by Employment Offices by Gender
Year Total employed Women employed Men employed % women employed % men employed
2013 7,281 1,590 5,691 22% 78% 2014 6,685 1,376 5,309 21% 79% 2015 6,843 1,738 5,105 25% 75% 2016 6,850 1,650 5,200 24% 76% 2017 7,160 1,905 5,255 27% 73% 2018 7,160 1,905 5,255 27% 73%
Similarly, with regard to ethnicity, Albanian men comprised the largest percentage of persons
employed by employment offices in 2013 (65%) and 2014 (60%). While this is not significantly different from the percentage of Albanian men registered with employment offices, Albanian men are overrepresented when compared to the percentage of Albanian women who are unemployed in the population (albeit not registered). Gender disaggregated data was unavailable for other ethnic groups. However, Serb, RAE, and other ethnic groups appear to have been over-represented slightly in terms of securing employment when compared to the percentage of registered unemployed persons of these ethnicities (see Table 27).
Table 27. Persons Employed by Employment Offices by Ethnicity and Gender
Year Total employed
Albanian men
Albanian men
Alb. women
Alb. women
Serb Serb %
RAE RAE %
Other Other %
2013 7,281 4,729 65% 1,590 22% 233 3% 248 3% 481 7% 2014 6,685 4,025 60% 1,376 21% 290 4% 352 5% 642 10% 2015 6,843 2,417 35% 815 12% 2016 6,850 4,600 67% 1,550 23% 2017 7,160 4,650 65% 1,800 25% 2018 7,160 4,650 65% 1,800 25%
54
The government has committed itself to decreasing unemployment and increasing labour force participation. In its current Program, the Government of the Republic of Kosovo commits to alleviating poverty and unemployment (see Government of the Republic of Kosovo, Program of the Government of the Republic of Kosovo 2015-2018, at: http://www.kryeministri-ks.net/repository/docs/Government_Programme_2015-2018_eng_10_mars.pdf). Additionally, the Office of the Prime Minister of Kosovo has identified unemployment and the creation of employment opportunities as a key challenge faced by Kosovo (see: Office of the Prime Minister of Kosovo, Declaration of Medium-Term Policy Priorities 2014-2016, 2013, p. 13, at: http://www.kryeministri-ks.net/repository/docs/Declaration_of_Medium-Term_Policy_Priorities.pdf). 55
Law No. 05/020 on Gender Equality, Art. 6.
22
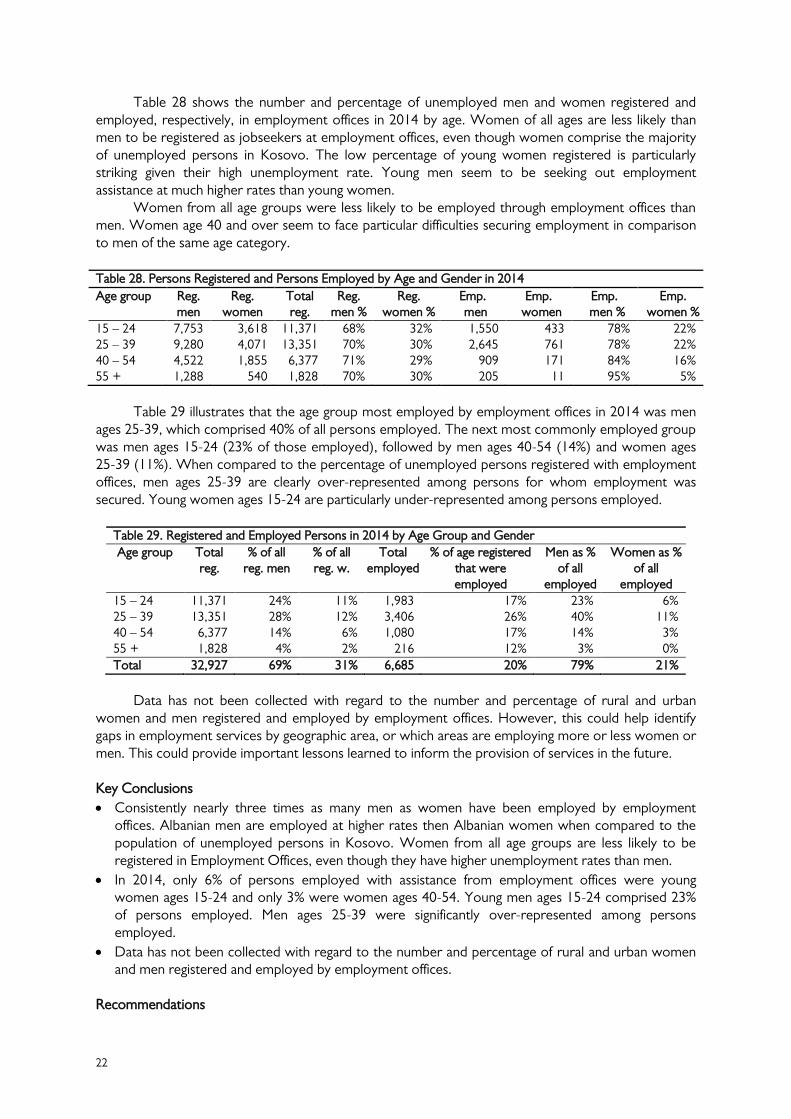
Table 28 shows the number and percentage of unemployed men and women registered and employed, respectively, in employment offices in 2014 by age. Women of all ages are less likely than men to be registered as jobseekers at employment offices, even though women comprise the majority of unemployed persons in Kosovo. The low percentage of young women registered is particularly striking given their high unemployment rate. Young men seem to be seeking out employment assistance at much higher rates than young women.
Women from all age groups were less likely to be employed through employment offices than men. Women age 40 and over seem to face particular difficulties securing employment in comparison to men of the same age category.
Table 28. Persons Registered and Persons Employed by Age and Gender in 2014
Age group Reg. men
Reg. women
Total reg.
Reg. men %
Reg. women %
Emp. men
Emp. women
Emp. men %
Emp. women %
15 – 24 7,753 3,618 11,371 68% 32% 1,550 433 78% 22% 25 – 39 9,280 4,071 13,351 70% 30% 2,645 761 78% 22% 40 – 54 4,522 1,855 6,377 71% 29% 909 171 84% 16% 55 + 1,288 540 1,828 70% 30% 205 11 95% 5%
Table 29 illustrates that the age group most employed by employment offices in 2014 was men
ages 25-39, which comprised 40% of all persons employed. The next most commonly employed group was men ages 15-24 (23% of those employed), followed by men ages 40-54 (14%) and women ages 25-39 (11%). When compared to the percentage of unemployed persons registered with employment offices, men ages 25-39 are clearly over-represented among persons for whom employment was secured. Young women ages 15-24 are particularly under-represented among persons employed.
Table 29. Registered and Employed Persons in 2014 by Age Group and Gender
Age group Total reg.
% of all reg. men
% of all reg. w.
Total employed
% of age registered that were employed
Men as % of all
employed
Women as % of all
employed
15 – 24 11,371 24% 11% 1,983 17% 23% 6% 25 – 39 13,351 28% 12% 3,406 26% 40% 11% 40 – 54 6,377 14% 6% 1,080 17% 14% 3% 55 + 1,828 4% 2% 216 12% 3% 0%
Total 32,927 69% 31% 6,685 20% 79% 21%
Data has not been collected with regard to the number and percentage of rural and urban
women and men registered and employed by employment offices. However, this could help identify gaps in employment services by geographic area, or which areas are employing more or less women or men. This could provide important lessons learned to inform the provision of services in the future. Key Conclusions
Consistently nearly three times as many men as women have been employed by employment offices. Albanian men are employed at higher rates then Albanian women when compared to the population of unemployed persons in Kosovo. Women from all age groups are less likely to be registered in Employment Offices, even though they have higher unemployment rates than men.
In 2014, only 6% of persons employed with assistance from employment offices were young women ages 15-24 and only 3% were women ages 40-54. Young men ages 15-24 comprised 23% of persons employed. Men ages 25-39 were significantly over-represented among persons employed.
Data has not been collected with regard to the number and percentage of rural and urban women and men registered and employed by employment offices.
Recommendations
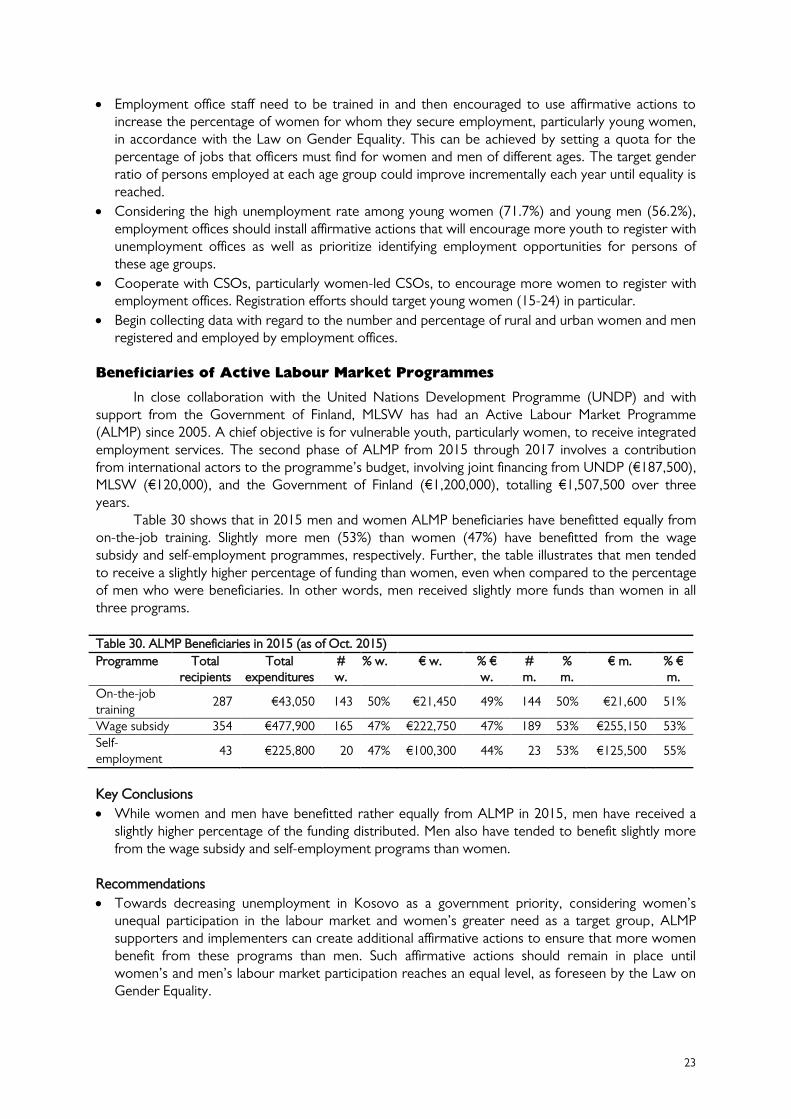
23
Employment office staff need to be trained in and then encouraged to use affirmative actions to increase the percentage of women for whom they secure employment, particularly young women, in accordance with the Law on Gender Equality. This can be achieved by setting a quota for the percentage of jobs that officers must find for women and men of different ages. The target gender ratio of persons employed at each age group could improve incrementally each year until equality is reached.
Considering the high unemployment rate among young women (71.7%) and young men (56.2%), employment offices should install affirmative actions that will encourage more youth to register with unemployment offices as well as prioritize identifying employment opportunities for persons of these age groups.
Cooperate with CSOs, particularly women-led CSOs, to encourage more women to register with employment offices. Registration efforts should target young women (15-24) in particular.
Begin collecting data with regard to the number and percentage of rural and urban women and men registered and employed by employment offices.
Beneficiaries of Active Labour Market Programmes
In close collaboration with the United Nations Development Programme (UNDP) and with support from the Government of Finland, MLSW has had an Active Labour Market Programme (ALMP) since 2005. A chief objective is for vulnerable youth, particularly women, to receive integrated employment services. The second phase of ALMP from 2015 through 2017 involves a contribution from international actors to the programme’s budget, involving joint financing from UNDP (€187,500), MLSW (€120,000), and the Government of Finland (€1,200,000), totalling €1,507,500 over three years.
Table 30 shows that in 2015 men and women ALMP beneficiaries have benefitted equally from on-the-job training. Slightly more men (53%) than women (47%) have benefitted from the wage subsidy and self-employment programmes, respectively. Further, the table illustrates that men tended to receive a slightly higher percentage of funding than women, even when compared to the percentage of men who were beneficiaries. In other words, men received slightly more funds than women in all three programs.
Table 30. ALMP Beneficiaries in 2015 (as of Oct. 2015)
Programme Total recipients
Total expenditures
# w.
% w. € w. % € w.
# m.
% m.
€ m. % € m.
On-the-job training
287 €43,050 143 50% €21,450 49% 144 50% €21,600 51%
Wage subsidy 354 €477,900 165 47% €222,750 47% 189 53% €255,150 53%
Self-employment
43 €225,800 20 47% €100,300 44% 23 53% €125,500 55%
Key Conclusions
While women and men have benefitted rather equally from ALMP in 2015, men have received a slightly higher percentage of the funding distributed. Men also have tended to benefit slightly more from the wage subsidy and self-employment programs than women.
Recommendations
Towards decreasing unemployment in Kosovo as a government priority, considering women’s unequal participation in the labour market and women’s greater need as a target group, ALMP supporters and implementers can create additional affirmative actions to ensure that more women benefit from these programs than men. Such affirmative actions should remain in place until women’s and men’s labour market participation reaches an equal level, as foreseen by the Law on Gender Equality.

24
Vocational Training Division
Table 31 illustrates that more men have tended to benefit from vocational training centres in 2013-2015 (as of September) than women. However, the Division clearly has increased the percentage of women beneficiaries in 2015 (to date) compared to 2014. This Division only provided data disaggregated by gender, but not by age, ethnicity, or geographic location. Further, while data on who enrolled and completed training programs were made available in 2014, these were not provided in 2015. This is because data on drop outs has not been integrated in the Employment Management Information System (EMIS) yet. Data in 2013 suggest that more women tended to drop out than men. KWN previously recommended that vocational training centres look into reasons why women and men drop-out by surveying persons who have left on their reasons why; this may enable centres to identify solutions for supporting people in completing their training (and thus making efficient use of the investment made by centres on these persons already).
This, as well as information regarding who was employed following training, is important to assess the effectiveness and efficiency of training programs. Given the particular nature of vocational training and the different types of training offered, it is difficult to assess the amount spent on women and men respectively.
Table 31. Persons Trained by Vocational Training Centres and Drop-outs of Trainings by Gender
Year Total trained
Men Women % men
% women
Total drop-outs
Total # of drop-outs
% drop-outs women
% drop-outs men
2013 3,350 1,814 1,536 54% 46% 11% 358 15% 8%
2014 3,419 2,254 1,165 66% 34%
2015 2,592 1,360 1,232 52% 48%
Key Conclusions
More men have benefitted from Vocational Training Centres than women, though progress has been made towards increasing the percentage of women beneficiaries in 2015.
Recommendations
Continue implementing affirmative actions to ensure that women enrol in and complete vocational training in at least equal percentages as men.
Maternity Leave
The Department of Labour and Employment monitors, administers, and budgets for the implementation of Maternity Leave provisions in accordance with the Labour Law. The current Labour Law is currently being amended. However, at present the government does not contribute to maternity leave compensation during the first six months of maternity leave. During this period, the employer covers 70% of the employee’s basic salary.57 In the three months that follow, the government covers 50% of the average salary in Kosovo.58 Table 32 illustrates the average wage in Kosovo since 2011, according to the Kosovo Agency for Statistics (ASK). Until 2015, the “average wage” used by MLSW for paying maternity leave benefits was significantly lower than the actual average wage. However, MLSW planned to increase its “average wage” significantly in 2015.
56
ASK, Press Release, “Kosova në shifta 2012,” 12 June 2013, at: http://ask.rks-gov.net/zyra-e-shtypit/602-komunikate-per-media-kosova-ne-shifta-2012. 57
Assembly of the Republic of Kosovo, Law No. 03/L-212 on Labour, 2010, Art. 49(3), at: http://www.assembly-kosova.org/common/docs/ligjet/2010-212-eng.pdf. 58
Ibid, Art 49(4).
Table 32. Average Wage56
Year Used by MLSW
Published by ASK
2011 € 292 € 368 2012 € 292 € 372 2013 € 292 € 374 2014 € 292 € 364 2015
(plan) € 374

25
As Table 33 and 34 illustrate, the number of women recipients of this benefit has increased incrementally almost every year, as has the budget for this benefit. While the exact amount received could differ depending on each woman’s length of leave, Table 34 shows that in 2011 women civil servants likely received more of this benefit (49%) than women working in the public (34%) or private (17%) sectors. However, in the 2012-2015, a higher percentage of beneficiaries were from the public or private sectors. No information was available with regard to the age, ethnicity, geographic location, or length of leave. Table 34. Maternity Leave Recipients by Sector and Budget Spent
Year Civil servants % Public sector % Private sector % Total Budget spent
2011 364 49% 256 34% 128 17% 748 256,833 2012 203 18% 560 50% 363 32% 1126 506,319 2013 238 19% 570 45% 462 36% 1270 523,212 2014 204 15% 531 39% 624 46% 1359 592,711 2015 170 14% 444 36% 609 50% 1223 814,091
Unemployment and Care Work
In 2011, at least 268,245 women (98.1%) and 5,240 men (1.9%) were not economically active in the week before the census because they were looking after their home or family. This was the main reason why most economically inactive women (55.8%) were inactive. A 2015 household survey by KWN also suggested that care responsibilities at home prevent women from entering the labour force.59 Any effective policy to decrease unemployment, more prevalent among women than men, must consider the unequal role women have in carrying out care work and provide opportunities for care to be provided to women’s family members, thereby enabling them to work. KWN has estimated that investing in care facilities in accordance with the Barcelona Objectives60 could create at least 8,019 new jobs.61 This could contribute to nearly three million Euros in new earnings, and taxes paid annually would amount to at least €233,513.62 In addition to this, it would enable more women who are currently caretakers to work as they would no longer have care responsibilities during the daytime. Key Conclusion
Addressing women’s high unemployment rate and low labour market force participation requires attention to care work and identifying alternative care possibilities.
Recommendation
Invest in affordable care facilities (private, public, or private-public partnerships) as an affirmative action foreseen by the Law on Gender Equality, which will create jobs for women and men, as well as enable more women to work by providing care services.
Department for Social Policies and Families
The Department for Social Policies and Families (DSPF) develops and implements policies, and legislation related to social welfare. It also administers assistance and other benefit schemes related to
59
KWN, No More Excuses: An Analysis of Attitudes, Incidence and Institutional Responses to Domestic Violence in Kosovo, Prishtina: KWN, 2015. 60
European Commission, Barcelona Objectives, Belgium: European Commission, 2013, at: http://eurogender.eige.europa.eu/sites/default/files/130531_barcelona_en.pdf. 61
Note that this number was calculated only based on child care facilities. The number would be substantially higher when considering elderly care, disability care, and other forms of care. 62
KWN, The Care Economy and Women’s Labour Force Participation, forthcoming.
Table 33. Maternity Leave Benefits
Year Women Budget spent
2006 540 113,904 2007 889 208,908 2008 874 214,060 2009 920 236,628 2010 971 240,702
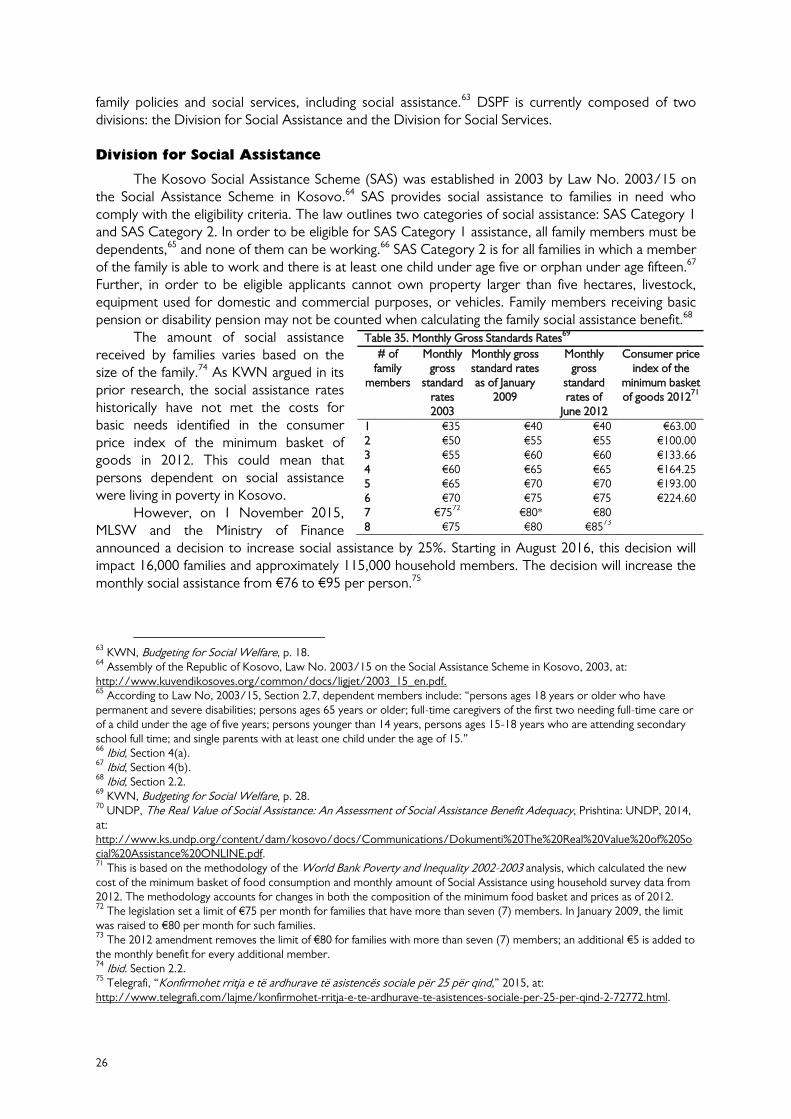
26
family policies and social services, including social assistance.63 DSPF is currently composed of two divisions: the Division for Social Assistance and the Division for Social Services.
Division for Social Assistance
The Kosovo Social Assistance Scheme (SAS) was established in 2003 by Law No. 2003/15 on the Social Assistance Scheme in Kosovo.64 SAS provides social assistance to families in need who comply with the eligibility criteria. The law outlines two categories of social assistance: SAS Category 1 and SAS Category 2. In order to be eligible for SAS Category 1 assistance, all family members must be dependents,65 and none of them can be working.66 SAS Category 2 is for all families in which a member of the family is able to work and there is at least one child under age five or orphan under age fifteen.67 Further, in order to be eligible applicants cannot own property larger than five hectares, livestock, equipment used for domestic and commercial purposes, or vehicles. Family members receiving basic pension or disability pension may not be counted when calculating the family social assistance benefit.68
The amount of social assistance received by families varies based on the size of the family.74 As KWN argued in its prior research, the social assistance rates historically have not met the costs for basic needs identified in the consumer price index of the minimum basket of goods in 2012. This could mean that persons dependent on social assistance were living in poverty in Kosovo.
However, on 1 November 2015, MLSW and the Ministry of Finance announced a decision to increase social assistance by 25%. Starting in August 2016, this decision will impact 16,000 families and approximately 115,000 household members. The decision will increase the monthly social assistance from €76 to €95 per person.75
63 KWN, Budgeting for Social Welfare, p. 18.
64 Assembly of the Republic of Kosovo, Law No. 2003/15 on the Social Assistance Scheme in Kosovo, 2003, at:
http://www.kuvendikosoves.org/common/docs/ligjet/2003_15_en.pdf. 65
According to Law No, 2003/15, Section 2.7, dependent members include: “persons ages 18 years or older who have permanent and severe disabilities; persons ages 65 years or older; full-time caregivers of the first two needing full-time care or of a child under the age of five years; persons younger than 14 years, persons ages 15-18 years who are attending secondary school full time; and single parents with at least one child under the age of 15.” 66
Ibid, Section 4(a). 67
Ibid, Section 4(b). 68
Ibid, Section 2.2. 69
KWN, Budgeting for Social Welfare, p. 28. 70
UNDP, The Real Value of Social Assistance: An Assessment of Social Assistance Benefit Adequacy, Prishtina: UNDP, 2014, at: http://www.ks.undp.org/content/dam/kosovo/docs/Communications/Dokumenti%20The%20Real%20Value%20of%20Social%20Assistance%20ONLINE.pdf. 71
This is based on the methodology of the World Bank Poverty and Inequality 2002-2003 analysis, which calculated the new cost of the minimum basket of food consumption and monthly amount of Social Assistance using household survey data from 2012. The methodology accounts for changes in both the composition of the minimum food basket and prices as of 2012. 72
The legislation set a limit of €75 per month for families that have more than seven (7) members. In January 2009, the limit was raised to €80 per month for such families. 73
The 2012 amendment removes the limit of €80 for families with more than seven (7) members; an additional €5 is added to the monthly benefit for every additional member. 74
Ibid. Section 2.2. 75
Telegrafi, “Konfirmohet rritja e të ardhurave të asistencës sociale për 25 për qind,” 2015, at: http://www.telegrafi.com/lajme/konfirmohet-rritja-e-te-ardhurave-te-asistences-sociale-per-25-per-qind-2-72772.html.
Table 35. Monthly Gross Standards Rates69
# of family
members70
Monthly gross
standard rates 2003
Monthly gross standard rates as of January
2009
Monthly gross
standard rates of
June 2012
Consumer price index of the
minimum basket of goods 2012
71
1 €35 €40 €40 €63.00 2 €50 €55 €55 €100.00 3 €55 €60 €60 €133.66 4 €60 €65 €65 €164.25 5 €65 €70 €70 €193.00 6 €70 €75 €75 €224.60 7 €75
72 €80* €80
8 €75 €80 €8573

27
Table 36 shows that the planned budget for 2016, including the increase, will be €30,653,324. The budget then is planned to decrease to €28,153,324 in 2017 and 2018 (remaining the same both years). The decreased budget reflects plans that more persons currently receiving social assistance will become employed. Ministry representatives also plan for the cleaning of recipient lists to decrease the number of recipients, as reflected in Tables 37 and 38 below.
While men comprise the majority of persons who physically collect social assistance (60%) on
behalf of their families (see Table 37),76 the majority of household members dependent on social assistance are women (60-65%). Beneficiaries can file complaints if they do not receive their share of social assistance, and they can request for the right to claim assistance to be transferred to another family member.77 However, according to MLSW officials, transferring the official claimant occurs rarely, and consolidated data regarding how often this has happened was not readily available.
Table 39 shows the recipients of both categories of social assistance, disaggregated by gender
and ethnicity. Men of all ethnicities collect social assistance more than women from the same ethnicity. No data was available to estimate the percentage of different ethnic groups in need of social assistance. However, in terms of the ethnic composition of the population of Kosovo as a proxy indicator, all minority persons appear to be slightly over-represented among SAS recipients.
76
Probably due to the fact that men comprise the majority of heads of households in Kosovo. ASK data shows that 8.3% of households are headed by women. Of households headed by women, 64.1% are led by widows (ASK, Gender Statistics in Kosovo, 2014, at: http://www.instat.gov.al/media/257404/gender_statistics_in_kosovo.pdf). 77
KWN conversation with MLSW official, 2015.
Table 36. Planned Social Assistance
Expenditures
Year Expenditures 2016 €30,653,324 2017 €28,153,324 2018 €28,153,324
Table 37. Total Collectors of SAS Category 1 and 2, Disaggregated by Gender and Ethnicity
Year Total Albanian men
Albanian women
Serb men
Serb w.
RAE men
RAE w.
Other men
Other women
2013 127,997 62,210 49%
42,752 33%
5,335 4%
3,354 3%
6,350 5%
4,263 3%
2,280 2%
1,453 1%
2014 124,720 60,153 48%
41,258 33%
5,570 5%
3,393 3%
6,350 5%
4,263 3%
2,280 2%
1,543 1%
2015 114,220 56,897 50%
38,654 34%
4,568 4%
3,125 3%
5,254 4%
3,568 3%
1,122 1%
1,032 1%
2016 104,720 53,897 51%
33,654 32%
3,668 4%
3,025 3%
5,054 5%
3,368 3%
1,022 1%
1,032 1%
2017 94,530 50,897 54%
30,654 32%
2,668 3%
2,025 2%
4,054 4%
2,368 3%
985 1%
879 1%
2018 86,809 45,897 53%
27,654 32%
2,668 3%
2,525 3%
4,054 4%
2,368 3%
858 1%
785 1%
Table 38. Collectors and Household Recipients of Social Assistance
Year Women collectors
Men collectors
Total household members
Women household members
Men household members
Total budget
2013 51,822 (40%)
76,175 (60%)
127,997 73,954 (60%) 49,600 (40%) 27,200,000
2014 50,367 (40%)
74,353 (60%)
124,720 74,535 (60%) 50,367 (40%) 27,280,000
2015 46,379 (41%)
67,841 (59%)
114,220 69,781 (65%) 38,272 (35%) 26,138,685
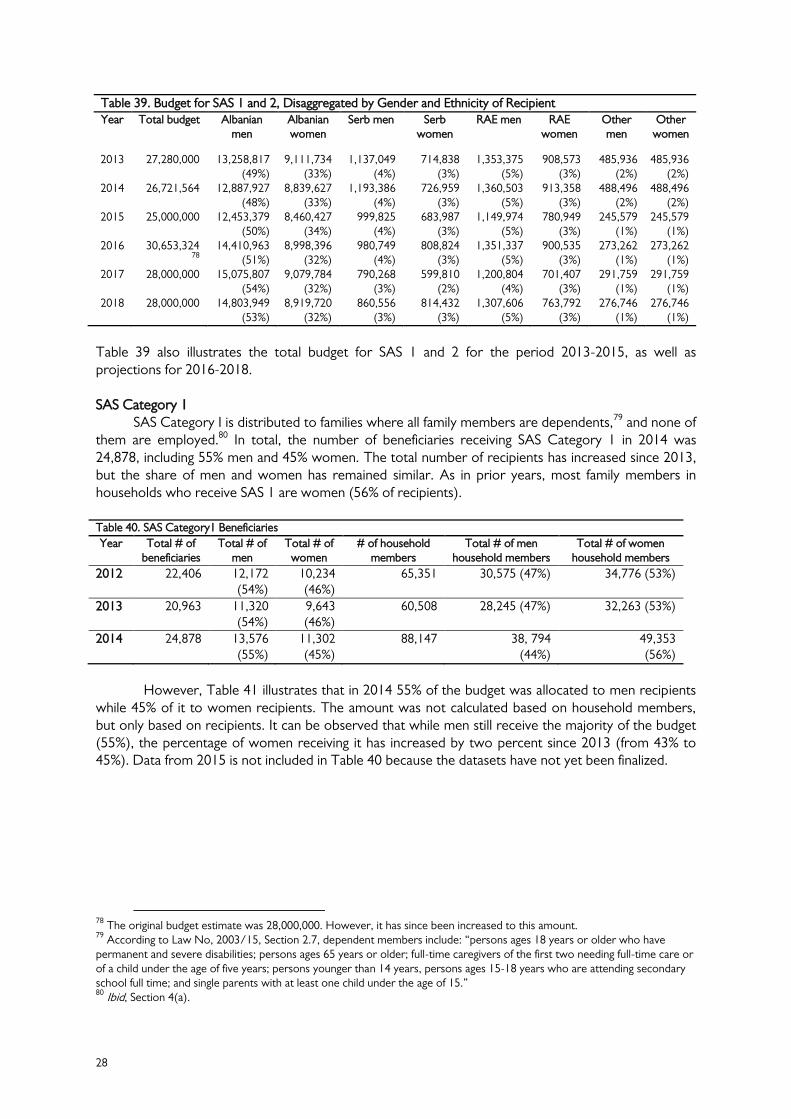
28
Table 39. Budget for SAS 1 and 2, Disaggregated by Gender and Ethnicity of Recipient
Year Total budget Albanian men
Albanian women
Serb men Serb women
RAE men RAE women
Other men
Other women
2013 27,280,000 13,258,817 (49%)
9,111,734 (33%)
1,137,049 (4%)
714,838 (3%)
1,353,375 (5%)
908,573 (3%)
485,936 (2%)
485,936 (2%)
2014 26,721,564 12,887,927 (48%)
8,839,627 (33%)
1,193,386 (4%)
726,959 (3%)
1,360,503 (5%)
913,358 (3%)
488,496 (2%)
488,496 (2%)
2015 25,000,000 12,453,379 (50%)
8,460,427 (34%)
999,825 (4%)
683,987 (3%)
1,149,974 (5%)
780,949 (3%)
245,579 (1%)
245,579 (1%)
2016 30,653,32478
14,410,963
(51%) 8,998,396
(32%) 980,749
(4%) 808,824
(3%) 1,351,337
(5%) 900,535
(3%) 273,262
(1%) 273,262
(1%) 2017 28,000,000 15,075,807
(54%) 9,079,784
(32%) 790,268
(3%) 599,810
(2%) 1,200,804
(4%) 701,407
(3%) 291,759
(1%) 291,759
(1%) 2018 28,000,000 14,803,949
(53%) 8,919,720
(32%) 860,556
(3%) 814,432
(3%) 1,307,606
(5%) 763,792
(3%) 276,746
(1%) 276,746
(1%)
Table 39 also illustrates the total budget for SAS 1 and 2 for the period 2013-2015, as well as projections for 2016-2018. SAS Category 1
SAS Category I is distributed to families where all family members are dependents,79 and none of them are employed.80 In total, the number of beneficiaries receiving SAS Category 1 in 2014 was 24,878, including 55% men and 45% women. The total number of recipients has increased since 2013, but the share of men and women has remained similar. As in prior years, most family members in households who receive SAS 1 are women (56% of recipients).
Table 40. SAS Category1 Beneficiaries
Year Total # of beneficiaries
Total # of men
Total # of women
# of household members
Total # of men household members
Total # of women household members
2012 22,406 12,172 (54%)
10,234 (46%)
65,351 30,575 (47%) 34,776 (53%)
2013 20,963 11,320 (54%)
9,643 (46%)
60,508 28,245 (47%) 32,263 (53%)
2014 24,878
13,576 (55%)
11,302 (45%)
88,147
38, 794 (44%)
49,353 (56%)
However, Table 41 illustrates that in 2014 55% of the budget was allocated to men recipients
while 45% of it to women recipients. The amount was not calculated based on household members, but only based on recipients. It can be observed that while men still receive the majority of the budget (55%), the percentage of women receiving it has increased by two percent since 2013 (from 43% to 45%). Data from 2015 is not included in Table 40 because the datasets have not yet been finalized.
78
The original budget estimate was 28,000,000. However, it has since been increased to this amount. 79
According to Law No, 2003/15, Section 2.7, dependent members include: “persons ages 18 years or older who have permanent and severe disabilities; persons ages 65 years or older; full-time caregivers of the first two needing full-time care or of a child under the age of five years; persons younger than 14 years, persons ages 15-18 years who are attending secondary school full time; and single parents with at least one child under the age of 15.” 80
Ibid, Section 4(a).

29
Table 41. SAS 1 Beneficiaries and Budget by Gender and Year
Year # of beneficiaries
# of men
# of women
Total budget Budget for men
beneficiaries
€ per capita men
Budget for women
beneficiaries
€ per capita
women
2012 22,406 12,172 (54%)
10,234 (46%)
€14,309,599 €8,125,598 (57%)
€55.6 €6,184,001 (43%)
€50.4
2013 20,963 11,320 (54%)
9,643 (46%)
€14,568,820 €8,272,422 (57%)
€60.9 €6,296,398 (43%)
€54.4
2014 24,878
13, 576 (55%)
11,302 (45%)
€14,536,538
€7,932,633 (55%)
€48.6. €6,603,905 (45%)
€48.6
SAS Category 2
SAS Category 2 is distributed to all families in which a member of the family is able to work and there is at least one child under age five or an orphan under age fifteen.81 Similar to last year,82 gender inequality among persons collecting SAS Category 2 is higher than SAS 1. Table 42 shows that most persons who collect SAS 2 transfers continued to be men in 2014 (85%). However, the vast majority of household members dependent on this type of SAS are women (61%). Interestingly, the share of women collecting this type of assistance did increase by 6% in 2014, an increase that did not occur in 2012 or 2013. The total number of recipients also has increased from 16,776 to 19,349. The percentage of men and women household members dependent on social assistance in 2012-2014 has remained fairly consistent; only a one percent increase in men and one percent decrease in women occurred in 2014.
Table 42. Category 2 SAS Distribution of Transfer Beneficiaries and Household Members by Gender
Year # of beneficiaries
Total # of men
Total # of women
# of household members
# of men household members
# of women household members
2012 18,176 16,620 (91%)
1,556 (9%)
75,470 28,732 (38%)
46,738 (62%)
2013 16,776 15,317 (91%)
1,459 (9%)
69,209 26,546 (38%)
42,663 (62%)
2014 19,349 16,427 (85%)
2,922 (15%)
77,935
30,663 (39%)
47,272 (61%)
Table 42 illustrates that men continue to collect the vast majority of the total budget allocated
for SAS Category 2. This difference has existed since at least 2012. Prior KWN research has observed that this difference may be in part due to persisting traditional gender roles in Kosovo, due to which men tend to have most responsibilities outside of the home, including retrieving social assistance, while women have responsibilities within the home, such as caretaking and other domestic work. 83 A further issue might be the fact that in order to be eligible for SAS Category 2, families must have at least one child under age five, which likely would further increase women’s care-work within the home. SAS Division representatives said that this difference can be attributed to women not being able to leave their children under age five alone to go retrieve social assistance.84 If women are not direct recipients, they may not have access to SAS funds when they are distributed within the household. Considering that women are primary care-takers of children and the elderly, SAS may be used more efficiently within the household if women receive social assistance directly. However, further research is needed on how social assistance is spent within households.
A slight change was observed in 2014 when the percentage of the budget received by women increased by 7%. While women received 8% of the budget in 2013, they received 15% in 2014. This may suggest that more women may receive SAS 2 in future years.
81
Ibid, Section 4(b). 82
KWN, Budgeting for Social Welfare, p. 32. 83
KWN, Budgeting for Social Welfare, p. 32. 84
KWN interview, November 2015.

30
Table 43. Recipients of Category 2 Social Assistance by Year, Gender, and Budget
Year Total beneficiaries
# of men (%)
# of women
(%)
Total budget Total budget for men
€ per capita men
Budget for women
€ per capita
women
2012 18,176 16,620 (91%)
1,556 (9%)
€12,850,053 €11,782,088 (92%)
€59.1 €1,067,965 (8%)
€57.2
2013 16,776 15,317 (91%)
1,459 (9%)
€12,858,869 €11,803,649 (92%)
€64.2 €1,055,220 (8%)
€60.3
2014 19,349 16,427 (85%)
2,922 (15%)
€12,011,453
€10,197,537 (85%)
€51.7 €1,813,916 (15%)
€51.7
Key Conclusions
For both categories it can be observed that while men are more likely to collect social assistance for their families, women are more likely to be among the household members dependent on it.
Total recipients of SAS Category 1 have increased from 2013 to 2014, but the share of men and women collecting SAS 1 has remained similar. As in prior years, most family members in households receiving SAS 1 are women (56% in 2014).
While men still collect most of the budget for SAS 1 (55% in 2014), the percentage of women receiving it has increased by two percent since 2013 (from 43% to 45%).
Men have consistently comprised the majority of direct recipients of SAS Category 2 (91% in 2012 and 2013 and 85% in 2014). However, the percentage of women who are direct recipients has increased by 7% from 2013 to 2014 (from 8% to 15%).
Recommendations
Conduct a study on why substantially more men receive SAS than women, as well as how social assistance is distributed within the family to ensure that family members not collecting social assistance benefit equally. If discrimination in distribution practices is found to exist, identify ways to ensure that social assistance reaches all family members.
Ensure all persons receiving SAS, including family members, have information as to how they can report misuse or change the recipient of the assistance, ensuring people are aware of their rights. This could include, for example, an outreach campaign targeting women in particular.
Establish specific indicators and activities towards increasing the proportion of women recipients of SAS transfers.
Social Services Division
Among other tasks and responsibilities, the Social Services Division (SSD) develops, proposes, and monitors the implementation of social services and social legislation; coordinates activities with other relevant actors; collaborates with CSOs; and develops and proposes vocational training programmes for social service officers.85
As of 2009, responsibilities for providing social services were transferred from the central to the local level.86 However, as prior KWN research has noted, this process of decentralization has been difficult so far.87 The tasks for which each level is responsible remain unclear, some social services remain centralized,88 and the 40 Centres for Social Welfare (CSW) around Kosovo remain linked to
85
MLSW, website, at: https://mpms.rks-gov.net/en-us/departments/departmentofsocialpolicyandfamilies/socialservicesdivision.aspx. 86
Memorandum of Understanding (MoU), signed in February 2009 between MLSW, the Ministry of Local Government Administration, the Ministry of Finance, and Kosovo municipalities for the transition of social services to municipalities. 87
KWN, Budgeting for Social Welfare. 88
This includes residential services for the elderly, community-based services for children and adults with disabilities, social services provided by CSOs, foster care benefits, and benefits for families of children with disabilities.

31
the central level.89 A lack of capacities among local level institutions and officials has hindered the decentralization process, according to MLSW officials.90 The services provided through this Division are discussed individually in the sections that follow.
MLSW contracts CSOs throughout Kosovo to offer particular social services. Table 45 illustrates the sums transferred in 2015.
Table 45. Sums transferred to CSOs by MLSW in 2015 Name of NGO or Association Total Services offered to
Hope and Homes for Children Kosovo 14,900 Children SOS Children’s Village Kosovo 13,500 Children Day Care Centre – PEMA 13,000 Children NGO Handikos 13,500 People with disabilities Associazione Amici dei Bambini 11,500 Children NGO “Humaniteti” 8,500 Multiethnic Organization for Persons with Disabilities 4,500 People with disabilities Association of Disabled Persons "Dom Nade" 1,570 People with disabilities Youth Iniciative in Kodra e Trimave 4,200 Youth Active Development of Society 3,700 Youth Organization Aktiv 4,800 Youth Prishtina Youth Centre 4,700 Youth NGO “Jeta Buron” 4,500 “Dëshira” Club 4,800 CODEX 4,700 Kosovo Youth Institute 4,900 Youth NGO – Women’s Centre "Prehja" 3,900 Women Institute for Social - Political Studies 4,500 Film Festival Hyjnesha në Fron 3,800 Women Kosovo Alternative for Youth Empowerment 3,300 Youth Podujeva Youth Centre 4.300 Youth Blind Association of Kosovo 4,900 Blind persons Business Support Centre Kosovo 4,950 Association “Nënë Terezë” 4,900 Letnica National Cuisine in Letuca 4,000 Total 155,820
Assistance for Families of Children with Disabilities
Kosovo is subject to several international conventions guaranteeing the rights of children, including the Convention on the Rights of the Child.91 National mechanisms for guaranteeing the rights of children exist as well, including Law No. 03/L-022 on the “material support for families of children with permanent disability,”92 which guarantees €100 support per month for their families.
Table 46 shows the number of families receiving assistance for their children with disabilities. More families with boys with disabilities receive this benefit (53%-58%) than do families with girls (41%-48%). According to the 2011 census, 3,376 persons ages 0-9 suffer from some form of disability, of whom 40% are girls and 60% boys. However, prior KWN research has noted that this data may not be
89
KWN, Budgeting for Social Welfare, p. 18. 90
KWN interview, May 2015. 91
United Nations, Convention on the Rights of the Child, 1989, at: http://www.ohchr.org/en/professionalinterest/pages/crc.aspx. 92
Assembly of the Republic of Kosovo, Law on Material Support for Families of Children with Permanent Disability, Law No. 03/L-022, Prishtina: Assembly of the Republic of Kosovo, 2008, at: https://mpms.rks-gov.net/Portals/0/Ligji/PrimarAnglisht/LAW%20ON%20MATERIAL%20SUPPORT%20FOR%20FAMILIES%20OF%20CHILDREN%20WITH%20PERMANENT%20DISABILITY.pdf.

32
reliable; experiential evidence suggests that families may register their boy children more than girl children with disabilities.93
Table 46. Number of Families of Children with Disabilities by Gender of Child
Year Total # of beneficiaries
Total # of girls
Total # of boys
Total budget
Budget for girls
Budget for boys
2011 2,893 1,382 (48%) 1,511 (52%) 289,300 138,200 (48%) 151,100 (52%)
2012 2,946 1,396 (47%) 1,550 (53%) 294,600 139,600 (47%) 155,000 (53%)
2013 2,995 1,242 (41%) 1,753 (59%) 299,500 124,200 (41%) 175,300 (59%)
2014 2,903 1,213 (42%) 1,690 (58%) 290,300 121,300 (42%) 169,000 (58%)
2015 2,761 1,167 (42%) 1,594 (58%) 276,100 116,700 (42%) 159,400 (58%)
Key Conclusions
More families with boys with disabilities receive monthly support than do families with girls with disabilities. Thus more of this budget goes to boys’ families (58%) than to girls’ families (42%).
Recommendations
Collaborate with CSOs working with persons with disabilities, particularly women’s organizations, as well as media to ensure that families with girls with disabilities are aware of the rights their children have related to these benefits.
Increase by one percent annually the percentage of families with girls that receive this benefit until it reaches 50%.
Foster Care for Abandoned Children
Provision of foster care for abandoned children is regulated by Law No. 02/L-17 on Social and Family Services as well as Administrative Instruction Nr. 05/2006 to regulate the provision of foster care for abandoned children.94 All host families for children undergo training in order to become providers of foster care.95 Foster care can be provided by both biological and non-biological foster families. In the first month, the non-biological foster family receives a payment of €225 and in other months €150. For cases of children with disabilities, the foster family receives €250 a month.96 Apart from foster care in non-biological families, MLSW provides an allowance for fostering children within the family, without parental care. The allowance is €75 a month per child fostered.
93
For more see KWN, Budgeting for Social Welfare, p. 20. 94
Assembly of the Republic of Kosovo, Law on Social and Family Services, Art. 3.3i and 11; MLSW, Administrative Instruction No. 05/2006 for the Establishment of Children in Foster Care and Adoption, Prishtina: MLSW, 2006, at: http://mpms.rks-gov.net/Portals/0/Ligji/SekondarAnglisht/A.I%20No.05-2006%20On%20Establishment%20of%20the%20Panel%20for%20Placing%20Childre.pdf, Art. 4. 95
KWN, Budgeting for Social Welfare, p. 44. 96
In Budgeting for Social Welfare, p. 44, KWN noted that in January 2012, the allowance for a foster family was increased from €150 to €250.
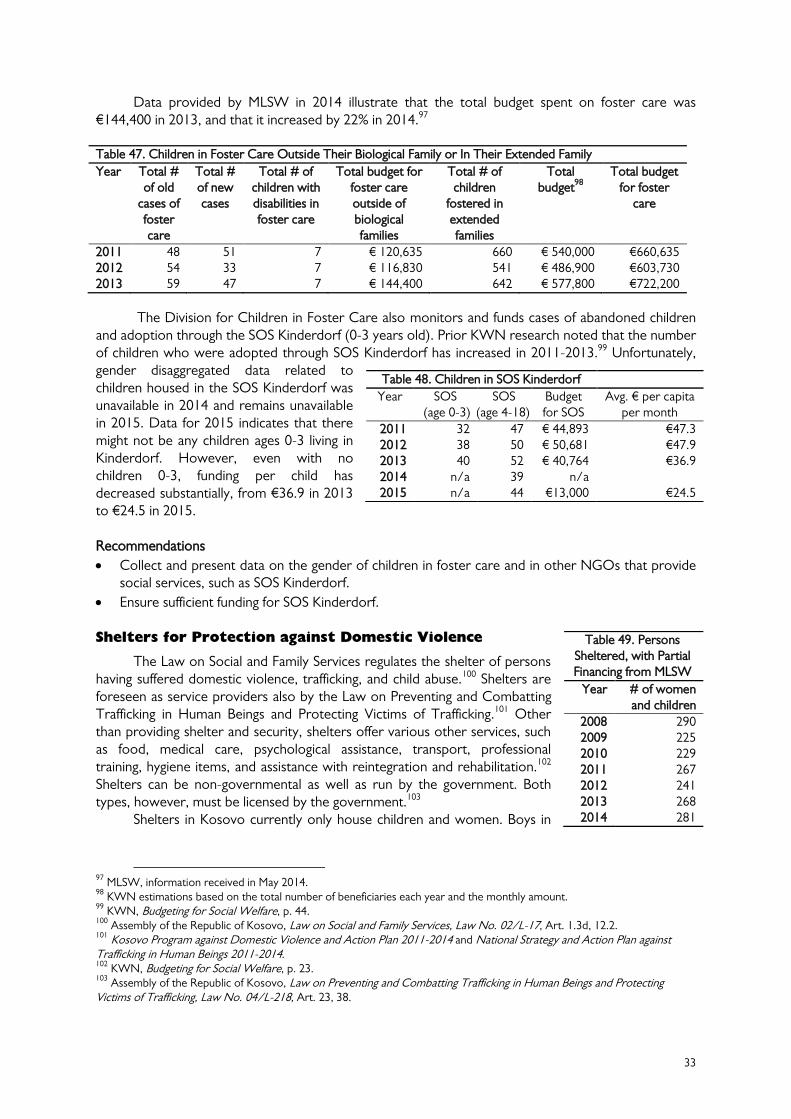
33
Data provided by MLSW in 2014 illustrate that the total budget spent on foster care was €144,400 in 2013, and that it increased by 22% in 2014.97
Table 47. Children in Foster Care Outside Their Biological Family or In Their Extended Family
Year Total # of old
cases of foster care
Total # of new cases
Total # of children with disabilities in foster care
Total budget for foster care outside of biological families
Total # of children
fostered in extended families
Total budget
98
Total budget for foster
care
2011 48 51 7 € 120,635 660 € 540,000 €660,635 2012 54 33 7 € 116,830 541 € 486,900 €603,730 2013 59 47 7 € 144,400 642 € 577,800 €722,200
The Division for Children in Foster Care also monitors and funds cases of abandoned children and adoption through the SOS Kinderdorf (0-3 years old). Prior KWN research noted that the number of children who were adopted through SOS Kinderdorf has increased in 2011-2013.99 Unfortunately, gender disaggregated data related to children housed in the SOS Kinderdorf was unavailable in 2014 and remains unavailable in 2015. Data for 2015 indicates that there might not be any children ages 0-3 living in Kinderdorf. However, even with no children 0-3, funding per child has decreased substantially, from €36.9 in 2013 to €24.5 in 2015.
Recommendations
Collect and present data on the gender of children in foster care and in other NGOs that provide social services, such as SOS Kinderdorf.
Ensure sufficient funding for SOS Kinderdorf.
Shelters for Protection against Domestic Violence
The Law on Social and Family Services regulates the shelter of persons having suffered domestic violence, trafficking, and child abuse.100 Shelters are foreseen as service providers also by the Law on Preventing and Combatting Trafficking in Human Beings and Protecting Victims of Trafficking.101 Other than providing shelter and security, shelters offer various other services, such as food, medical care, psychological assistance, transport, professional training, hygiene items, and assistance with reintegration and rehabilitation.102 Shelters can be non-governmental as well as run by the government. Both types, however, must be licensed by the government.103
Shelters in Kosovo currently only house children and women. Boys in
97
MLSW, information received in May 2014. 98
KWN estimations based on the total number of beneficiaries each year and the monthly amount. 99
KWN, Budgeting for Social Welfare, p. 44. 100
Assembly of the Republic of Kosovo, Law on Social and Family Services, Law No. 02/L-17, Art. 1.3d, 12.2. 101
Kosovo Program against Domestic Violence and Action Plan 2011-2014 and National Strategy and Action Plan against Trafficking in Human Beings 2011-2014. 102
KWN, Budgeting for Social Welfare, p. 23. 103
Assembly of the Republic of Kosovo, Law on Preventing and Combatting Trafficking in Human Beings and Protecting Victims of Trafficking, Law No. 04/L-218, Art. 23, 38.
Table 48. Children in SOS Kinderdorf
Year SOS (age 0-3)
SOS (age 4-18)
Budget for SOS
Avg. € per capita per month
2011 32 47 € 44,893 €47.3 2012 38 50 € 50,681 €47.9 2013 40 52 € 40,764 €36.9 2014 n/a 39 n/a 2015 n/a 44 €13,000 €24.5
Table 49. Persons Sheltered, with Partial Financing from MLSW
Year # of women and children
2008 290 2009 225 2010 229 2011 267 2012 241 2013 268 2014 281

34
shelters are accepted up to the age of 12.104 Table 49 illustrates the total number of women and children sheltered each year by shelters that receive partial financing from MLSW. All recipients have been women and children. Given that women are more likely to suffer violence than men, the need for shelter is clear. However, no shelters exist for men and boys over age 18, though evidence suggests that violence against boys and men exists as well.105 Further, currently no shelters are specialized in housing Lesbian, Gay, Bisexual, and Transgender (LGBT) persons in Kosovo, though domestic violence against LGBT persons exists.106
Table 50 portrays the budget allocated by MLSW to shelters in Kosovo from 2011 to 2014.107 All but one shelter consistently have received an equal amount of funding during this period, regardless of the number of persons housed.
As of 2015, shelters providing state-funded services are selected through a procurement process
through which MLSW purchases their services. MLSW selects shelters that fulfill criteria set by MLSW, and then signs MoUs with these shelters.110 Starting in April 2015, shelters have begun receiving government funding based on the number of persons they house. MLSW pays 50% of expenditures for elementary things such as food and shelter. The amount paid to the shelter per person housed is €208.33 monthly.111 Table 51 shows the amount distributed to shelters for protecting persons who have suffered domestic violence and human trafficking by MLSW. According to MLSW representatives, all shelters have proven that they can house a maximum of 12 people, meaning that they receive a maximum amount of €2,500 per month.
Members of the Shelter Coalition have calculated that it costs €30 to shelter someone for 24 hours and offer all necessary services, amounting to €900 monthly per person.112 However, the costs per person sheltered can vary significantly, depending on injuries suffered, psychological counselling
104
KWN, Budgeting for Social Welfare, p. 34. 105
KWN, No More Excuses, 2015. Police reports also suggest that men and boys are victims of violence as well. For more see: Farnsveden, Ulf, Ariana Qosaj-Mustafa, and Nicole Farnsworth for Orgut, Country Gender Profile, Prishtina: Sida, 2014. 106
KWN, No More Excuses, pp. 77 and 54. In a forthcoming research, over 70% of LGBT persons interviewed said that “home” is the “the most dangerous place” for them (interview with LGBT organization representatives, in KWN, No More Excuses, p. 77. 107
KWN, Budgeting for Social Welfare, p. 23. 108
These represent actual expenditures rather than originally budgeted expenses. Numbers have been rounded to the nearest Euro. Funding for ISF came from the Ministry of Justice. Source: ISF, correspondence, May 2014. 109
The budgeted amount was 75,000, so they spent less than was originally budgeted. 110
Interview with MLSW Division of Social Services representative, November 2015. 111
Ibid. 112
KWN, At What Cost? Budgeting for the Implementation of Legal Framework Against Domestic Violence in Kosovo, Prishtina: KWN, 2012, at: http://www.womensnetwork.org/documents/20130405120224756.pdf, p. 50.
Table 50. Total Budget Transferred to Each Shelter from MLSW by Year, 2011-2015
Shelter Location 2011 2012 2013 2014 2015 (plan)
Centre for Protection of Women and Children (CPWC)
Prishtina €17,000 €17,000 €24,000 €24,000 €24,000
CPWC Raba Voca Mitrovica €17,000 €17,000 €24,000 €24,000 €24,000
Women’s Wellness Centre (WWC) Peja €17,000 €17,000 €24,000 €24,000 €24,000
Safe House Gjakova €17,000 €17,000 €24,000 €24,000 €24,000
Centre for Sheltering Women and Children (CSWC)
Prizren €17,000 €17,000 €24,000 €24,000 €24,000
Centre Liria Gjilan €17,000 €17,000 €24,000 €24,000 €24,000
Interim Security Facility108
€51,469 €62,242109
€80,000 €80,000 N/A
Protect Victims Prevent Trafficking (PVPT) Prishtina €21,000 €26,500 €30,000 €30,000 €30,000
Home and Hope for Children Prishtina N/A N/A €50,000 €50,000 N/A
Total €174,469 €190,742 €304,000 €304,000 N/A
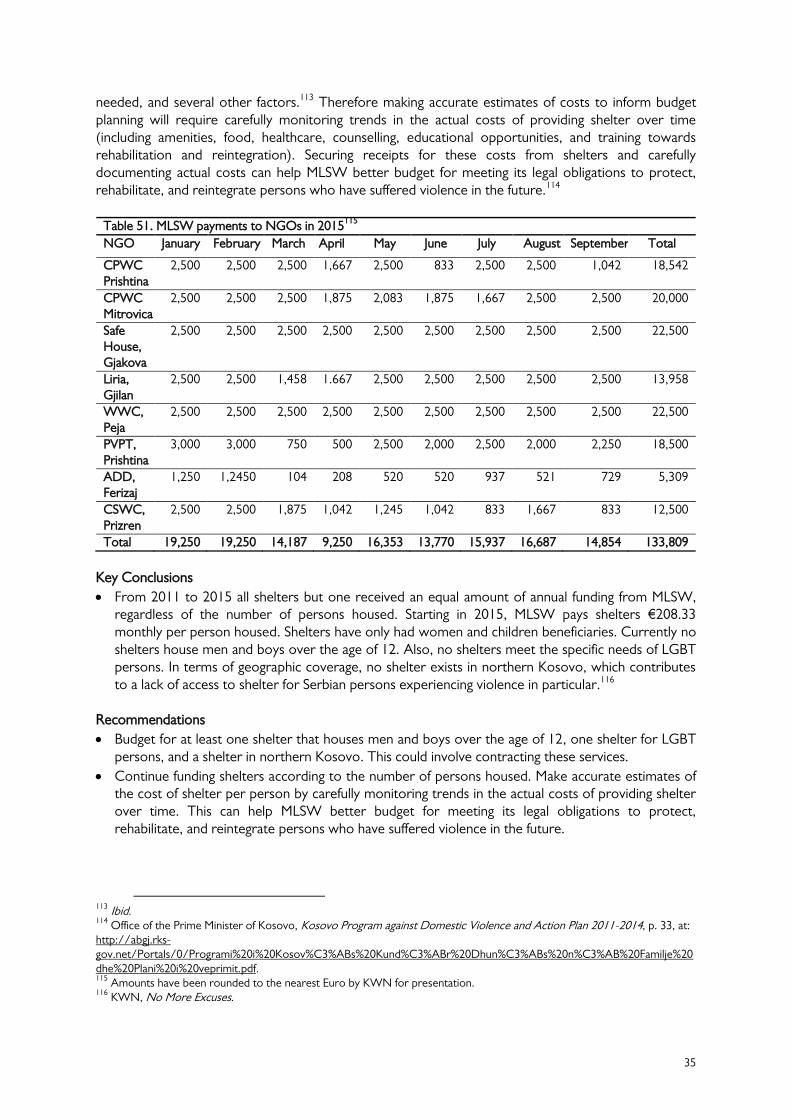
35
needed, and several other factors.113 Therefore making accurate estimates of costs to inform budget planning will require carefully monitoring trends in the actual costs of providing shelter over time (including amenities, food, healthcare, counselling, educational opportunities, and training towards rehabilitation and reintegration). Securing receipts for these costs from shelters and carefully documenting actual costs can help MLSW better budget for meeting its legal obligations to protect, rehabilitate, and reintegrate persons who have suffered violence in the future.114
Table 51. MLSW payments to NGOs in 2015
115
NGO January February March April May June July August September Total
CPWC Prishtina
2,500 2,500 2,500 1,667 2,500 833 2,500 2,500 1,042 18,542
CPWC Mitrovica
2,500 2,500 2,500 1,875 2,083 1,875 1,667 2,500 2,500 20,000
Safe House, Gjakova
2,500 2,500 2,500 2,500 2,500 2,500 2,500 2,500 2,500 22,500
Liria, Gjilan
2,500 2,500 1,458 1.667 2,500 2,500 2,500 2,500 2,500 13,958
WWC, Peja
2,500 2,500 2,500 2,500 2,500 2,500 2,500 2,500 2,500 22,500
PVPT, Prishtina
3,000 3,000 750 500 2,500 2,000 2,500 2,000 2,250 18,500
ADD, Ferizaj
1,250 1,2450 104 208 520 520 937 521 729 5,309
CSWC, Prizren
2,500 2,500 1,875 1,042 1,245 1,042 833 1,667 833 12,500
Total 19,250 19,250 14,187 9,250 16,353 13,770 15,937 16,687 14,854 133,809
Key Conclusions
From 2011 to 2015 all shelters but one received an equal amount of annual funding from MLSW, regardless of the number of persons housed. Starting in 2015, MLSW pays shelters €208.33 monthly per person housed. Shelters have only had women and children beneficiaries. Currently no shelters house men and boys over the age of 12. Also, no shelters meet the specific needs of LGBT persons. In terms of geographic coverage, no shelter exists in northern Kosovo, which contributes to a lack of access to shelter for Serbian persons experiencing violence in particular.116
Recommendations
Budget for at least one shelter that houses men and boys over the age of 12, one shelter for LGBT persons, and a shelter in northern Kosovo. This could involve contracting these services.
Continue funding shelters according to the number of persons housed. Make accurate estimates of the cost of shelter per person by carefully monitoring trends in the actual costs of providing shelter over time. This can help MLSW better budget for meeting its legal obligations to protect, rehabilitate, and reintegrate persons who have suffered violence in the future.
113
Ibid. 114
Office of the Prime Minister of Kosovo, Kosovo Program against Domestic Violence and Action Plan 2011-2014, p. 33, at: http://abgj.rks-gov.net/Portals/0/Programi%20i%20Kosov%C3%ABs%20Kund%C3%ABr%20Dhun%C3%ABs%20n%C3%AB%20Familje%20dhe%20Plani%20i%20veprimit.pdf. 115
Amounts have been rounded to the nearest Euro by KWN for presentation. 116
KWN, No More Excuses.

36
Disabled and Elderly People Division
This section analyses the beneficiaries of community housing for disabled persons and the elderly. As noted in KWN’s prior research,117 it is difficult to obtain budget information on each care institution as this budget is centralized. Funds are distributed through a single budget line for all “Institutions”. Table 52 suggests that the budget for all expenditure categories except subsidies and transfers was significantly decreased in 2015. However, the overall budget for these institutions more than doubled. This Division has budgeted €30,000 for a €10 monthly transfer per beneficiary in institutions. Since this transfer was made in cash, the Ministry of Finance interrupted it in 2011 due to irregularities in the Institute of Shtime. From 2011 until 2014 that amount was transferred to the Division, but it was not used.118 Prior KWN research noted that the transfers were reallocated and spent on other costs within MLSW.119 As of 2016, all of these institutions will be decentralized, except for three: the elderly home in Prishtina, the Special Institute in Shtime, and the Children’s Home in Shtime, which will remain under MLSW. All other institutions will be completely decentralized and will receive no funding from MLSW. They will need to ensure their own funding, which may come from municipalities or donors, but will be the responsibility of municipalities. Table 52. Budget for Institutions Serving the Disabled and Elderly, 2013-2015 by Economic Category Year Employed Wages and
salaries Goods and
services Municipal expenses
Subsidies and transfers
Capital expenditures
Total
2013 242 1,009,779 768,473 106,664 30,000 400,000 2,314,916 2014 242 966,216 849,510 177,000 30,000 400,000 2,422,726 2015 2016
219
198.581 794,974 155,000 30,000 455,000 2,557,270 1,424,709
Elderly Homes
Administrative Instruction No. 10/2014 for “activities and requirements of placement of residents in house of elderly without family care homes and community based”120 regulates the provision of this social service. Eligibility criteria include that all persons placed in elderly homes be over the age of 65, have no adopted or biological offspring, and be in good mental health.121 These stringent criteria may mean that some elderly persons in Kosovo are forced to remain in difficult household situations, which could place them at risk of violence. At the same time, the need to care for elderly persons may prevent people, particularly women, from entering the labour force.
Currently there are three elderly homes in Kosovo (in Prishtina, Gurakoc, and Skenderaj) and one community home in Gracanica, which opened in 2014. Table 53 illustrates the number of women and men who have received care in these centres. In 2014 and 2015, women comprised approximately 56% of beneficiaries. This marked an increase in the percentage of women beneficiaries from 45% in 2013. This increase seems a combination of more women and fewer men seeking these services. This may be attributable to women’s longer life expectancy or the fact that a slightly higher percentage of women exist in Kosovo at this age compared to men.122
Since the budget distributed to each institution was unavailable, it was not possible to calculate the amount spent on women and men. However, a rough estimation could be made that approximately 56% was spent on women and 44% on men in 2014, based on the percentage of beneficiaries.
117
KWN, Budgeting for Social Welfare, p. 24. 118
KWN Interview with Head of Division, November 2015. 119
KWN, Budgeting for Social Welfare, p. 25. 120
Government of the Republic of Kosovo, Administrative Instruction No. 10/2014, 2014, at: https://gzk.rks-gov.net/ActDocumentDetail.aspx?ActID=10414. 121
Ibid. Art. 5. 122
According to Census data, in 2011, 53% of citizens over age 65 were women, while 47% were men.

37
Key Conclusions
Very few elderly and disability homes exist compared to the size of the potential target group. The criteria for use of such homes are stringent and may place elderly persons at risk of being forced to remain in difficult home situations.
Recommendations
Investing in care centres, at least for daytime care, with less stringent criteria could contribute to improved living conditions and independence for elderly persons, create jobs, and enable persons presently caring for persons with disabilities or the elderly to enter into the labour force.
Department of Martyrs’ Families and War Invalids
The Department of Martyrs’ Families and War Invalids is responsible for policies that relate to persons affected by the war, including war invalids, civil victims, their surviving families, and sexual violence victims of war.123 Three types of pensions may be given under this scheme: family pensions (for close family members), personal disability pension (for disabled persons themselves), and family disability pension (for the family of the disabled person, after the disabled person’s death).124 This section examines each of these types of benefits vis-à-vis their target groups. An estimated 13,517 people died, were killed, or went missing during the war in Kosovo between 1 January 1998 and 4 June 1999, and after the deployment of international troops in Kosovo until December 2000.125 It has been
123
Assembly of the Republic of Kosovo, Law No. 04/L054 on the status and the rights of martyrs, invalids, veterans, members of the Kosovo Liberation Army, Civilian Victims of War and their Families, 2011, at: http://www.assembly-kosova.org/common/docs/ligjet/Law%20on%20the%20status%20of%20the%20martyrs.pdf and Law No. 04/L-172 on Amending and supplementing law No. 4/L-054 on the status and rights of martyrs, invalids, veterans, members of Kosovo liberation army, sexual violence victims of the war, civilian victims and their families, 2014, at: http://www.kuvendikosoves.org/common/docs/ligjet/04-L-172%20a.pdf. 124
Ibid. Art 5. 125
Humanitarian Law Centre, The Kosovo Memory Book 1998-2000, Humanitarian Law Centre, n.d., at: http://www.kosovskaknjigapamcenja.org/?page_id=107&lang=de.
Table 53. Elderly Care Centre Beneficiaries by Gender
Elderly care centre
Year Total # of clients
Total # of women clients
% of women clients
Total # of men clients
% of men clients
Prishtina (135 beds)
2012 97 58 60% 39 40% 2013 93 40 43% 53 57% 2014 84 47 56% 37 44% 2015 71 41 58% 30 42%
Gurakoc (20 beds)
2012 15 8 53% 7 47% 2013 16 9 56% 7 44% 2014 15 8 53% 7 47% 2015 14 8 57% 6 43%
Skenderaj (20 beds)
2012 15 7 47% 8 53% 2013 14 6 43% 8 57% 2014 14 8 57% 7 50% 2015 14 8 57% 7 50%
Graçanicë
2014 15 7 47% 8 53% 2015 6 2 33% 4 67%
Total Kosovo
2012 127 73 57% 54 43% 2013 123 55 45% 68 55% 2014 108 61 56% 47 44% 2015 105 59 56% 47 45%

38
estimated that 12,000 Albanians and more than 3,000 Serbs lost their lives, among persons of other ethnicities.126
Table 54 illustrates prior and planned future expenditures for this Department. The number of beneficiaries of some pensions elaborated below is predicted to increase in future years, accompanied by an increase in the subsidies and transfers expense category. Through Government Decision 171 (2011),127 MLSW did not permit new applications to pension schemes provided by this department. However, in 2014, through another Decision, former MLSW Minister Nenad Rasic enabled new applications for the following pension schemes: Civil Victims, Martyrs’ Families, KLA Invalids, and war veterans from March 2014. This explains the increase in beneficiaries and budget in the post-2014 period.128 Further budget increases are foreseen for most pension categories financed by this Department in future years, as detailed below.
Martyrs’ Families
This pension is received by close family members of war martyrs. Out of the 1,977 recipients of this pension in 2015, 78% are women, whereas 22% are men (see Table 55). This percentage has not changed substantially, and officials plan that it will remain similar through 2018. The fact that more women benefit from this pension is unsurprising considering that substantially more men fought in the Kosovo Liberation Army (KLA), so their close family member dependents are more likely to be women. For similar reasons, perhaps it is unsurprising that Albanian women received the highest percentage of this pension (78%), followed by Albanian men (22%), and a few women from other ethnic groups (0.15% of beneficiaries).
Table 55. Pension Recipients Disaggregated by Gender and Ethnicity
Year Total Recipients
Men%
Women%
Alb. men
Alb. men %
Alb. women
Alb. women %
Other women
% other women
2013 2,020 23% 77% 461 23% 1,556 77% 3 0.15% 2014 2,001 22% 78% 443 22% 1,555 78% 3 0.15% 2015 1,977 22% 78% 426 22% 1,548 78% 3 0.15% 2016 2,088 25% 75% 520 25% 1,565 75% 3 0.14% 2017 2,088 25% 75% 520 25% 1,565 75% 3 0.14% 2018 2,088 25% 76% 520 25% 1,565 75% 3 0.14%
In total, €931,690 was allocated for this pension in 2015. Based on the aforementioned percentage of recipients, an estimated 22% of this budget was received by Albanian men, 78% by Albanian women, and 0.15% by women from other ethnic groups (not including Serbs, Roma, Ashkali, or Egyptians).
As Table 56 illustrates, rural (Albanian) women tended to comprise the majority of recipients (54% in 2015), followed by urban (Albanian) women (25%), then rural men (15%), and finally urban men (6%). Given the specific nature of this pension, it would be difficult to make recommendations for
126
Douarin, E., Litchfield, J. and Sabates-Wheeler, R., 2010. Poverty, Livelihoods and War Legacies: the Case of Post-War Rural Kosovo. MICROCON Research Working Paper 37, Brighton: MICROCON. KWN struggled to find reliable sources and information with regard to the actual numbers of persons who died or were injured during the war, including information disaggregated by ethnicity, gender, and geographic location. 127
MLSW, Decision 171, 2011. 128
MLSW, Decision to Supersede MLSW decision 171, Protocol Nr. 98, March 2014.
Table 54. Department of Martyrs’ Families and War Invalids Planned and Actual Expenditures, 2011-2018
Year Budget Planned Budget Spent % Difference
2011 €29,921,019 €29,249,970 97.8% 2012 €30,121,019 €30,205,298 99.7% 2013 €30,364,117 €30,364,117 103.1% 2014 €37,309,231 €37,309,226 99.9% 2015 (Sept.)
€40,663,639 €25,343,673 62.3%
2016 €38,143,191 2017 €40,143,191 2018 €40,143,191

39
any changes, but understanding who the main beneficiaries are is useful in itself, towards ensuring that their particular needs are met in distributing this pension.
Table 56. Pension Recipients Disaggregated by Gender and Geographic Location Year Total
recipients Rural men
% Urban men
% Rural women
% Urban women
%
2013 2,020 334 17% 127 6% 1,073 53% 486 24% 2014 2,001 314 16% 129 6% 1,066 53% 429 21% 2015 1,977 302 15% 124 6% 1,059 54% 492 25% 2016 2,088 375 18% 145 7% 1,063 51% 505 24% 2017 2,088 375 18% 145 7% 1,063 51% 505 24% 2018 2,088 375 18% 145 7% 1,063 51% 505 24%
Civil Victims
Recipients of this pension scheme include relatives of civilian victims of war. Most beneficiaries of this pension from 2013 through 2015 have been women (84%-85%). From this, it can be estimated that men received approximately 16% of the €851,577 allocated for this pension (€136,252), whereas women received 84% (€715,324). The Department has planned for the percentage of women to remain similar in future years, including amid a planned increase in the total number of beneficiaries. The majority of civilians receiving this pension are Albanian women (83% of beneficiaries). Albanian men are the next most common recipients (16%). Serb men, Serb women, Roma, Ashkali, Egyptian men and women, and men and women from other ethnic groups all comprise less than one percent of recipients, respectively (see Table 57).
Table 57. Pension Recipients by Gender and Ethnicity
Year Total Alb. men
Alb. men
Alb. w.
Alb. w.
Serb men
Serb men
Serb w.
Serb w.
RAE men
RAE men
RAE w.
RAE w.
Other men
Other men
Other w.
Other w.
2013 4,914 804 16% 4,081 83% 3 0.06% 17 0.35% 1 0.02% 4 0.08% 1 0.02% 3 0.06% 2014 4,811 771 16% 4,010 83% 3 0.06% 17 0.35% 1 0.02% 4 0.08% 1 0.02% 4 0.08% 2015 4,656 739 16% 3,890 84% 4 0.09% 14 0.30% 1 0.02% 3 0.06% 1 0.02% 4 0.09% 2016 5,361 769 14% 4,534 85% 6 0.11% 39 0.73% 2 0.04% 6 0.11% 1 0.02% 4 0.07% 2017 5,361 769 14% 4,534 85% 6 0.11% 39 0.73% 2 0.04% 6 0.11% 1 0.02% 4 0.07% 2018 5,361 769 14% 4,534 85% 6 0.11% 39 0.73% 2 0.04% 6 0.11% 1 0.02% 4 0.07%
Given the nature of the war, perhaps it also is unsurprising that rural women comprise the majority of pension recipients (58% in 2015) as rural men civilians tended to lose their lives at higher rates than urban men (see Table 58). Rural men receive the next highest percentage of benefits (12%), followed by and equal share of urban women and men (4% respectively).
Table 58. Civil Victims Pension Recipients by Gender and Geographic Location
Year Total recipients
Rural men
% Urban men
% Rural women
% Urban women
%
2013 4,914 614 12% 195 4% 2,801 57% 1,304 4% 2014 4,811 586 12% 190 4% 2,755 57% 1,280 4% 2015 4,656 560 12% 185 4% 2,678 58% 1,233 4% 2016 5,361 580 11% 198 4% 2,788 52% 1,795 4% 2017 5,361 580 11% 198 4% 2,788 52% 1,795 4% 2018 5,361 580 11% 198 4% 2,788 52% 1,795 4%
Again, due to the specific nature of this particular pension, no recommendations can be made.
KLA Invalids
Recipients of this pension include persons who became disabled during the war and have remained disabled. The monthly amount transferred depends on the level of body injury the KLA

40
invalid has.129 Table 59 below shows that the vast majority (98%) of recipients are men. The budget allocated for 2015 is €1,050,845. Most beneficiaries are Albanian men (receiving 98% of the budget). Albanian women receive 2% of the budget, whereas men from ethnicities other than Serb, Roma, Ashkali, or Egyptian ethnicities receive 0.1%.
Table 59. KLA Invalid Pension Recipients by Gender and Ethnicity
Year Total recipients
Men %
Women %
Alb. men Alb. men %
Alb. women
Alb. women
Other men
%
2013 3,488 98% 2% 3,430 98% 56 2% 2 0.06% 2014 3,464 98% 2% 3,406 98% 56 2% 2 0.06% 2015 3,408 98% 2% 3,352 98% 54 2% 2 0.06% 2016 3,524 98% 2% 3,459 98% 63 2% 2 0.06% 2017 3,524 98% 2% 3,459 98% 63 2% 2 0.06% 2018 3,524 98% 2% 3,459 98% 63 2% 2 0.06%
Again given the nature of the war it is unsurprising that the majority of KLA invalid pension
recipients are rural men (69%), followed by urban men (30%). As few women fought in KLA, fewer women than men were wounded. Rural and urban women comprise less than 1% of beneficiaries, respectively (see Table 60). Given the nature of this pension, the beneficiaries will remain similar.
Table 60. KLA Invalid Pension Recipients by Geographic Area
Year Total recipients
Rural men
% Urban men
% Rural women
% Urban women
%
2013 3,488 2,398 69% 1,034 30% 28 0.80% 28 0.80% 2014 3,464 2,373 69% 1,035 30% 28 0.81% 28 0.81% 2015 3,408 2,337 69% 1,017 30% 27 0.79% 27 0.79% 2016 3,524 2,356 67% 1,105 31% 33 0.94% 30 0.85% 2017 3,524 2,356 67% 1,105 31% 33 0.94% 30 0.85% 2018 3,524 2,356 67% 1,105 31% 33 0.94% 30 0.85%
Civilian Invalids
This pension scheme benefits civilians who have disabilities as a result of the war. As per Law Nr. 04/L-054 the amount received by each person is determined by their level of body injury.130 Table 61 illustrates that men are the chief beneficiaries of this scheme, receiving at 72% of this pension. The number of beneficiaries is anticipated to increase in 2016 due to a new MLSW decision that allows new applications for this scheme from 2014 onward. While it may seem surprising that there may be new civilian invalids from the 1990s conflict, MLSW representatives cite stepping on minefields as one example of why they continue to receive new potential applicants. The budget allocated for this scheme in 2015 was €275,626. Men received approximately 71% of this (€195,694.46), while women received 29% (€79,931.54). With regard to ethnicity, most recipients are Albanian men (71%) and Albanian women (28%). Very few Serb men, Serb women, or women from other ethnic groups receive this pension.
129
As per Law Nr. 04/L-054, pensions rage from €180 for invalids with 20%-30% body damage, to €350.50 for invalids with body damage over 80%. 130
Amounts transferred monthly range from €96 for persons with 40-60% body damage, to €122 for persons with body damage over 80%.
Table 61. Civilian Invalid Pension Recipients Disaggregated by Gender
Year Total recipients
Men Men %
Women Women %
2013 2,137 1,530 72% 607 28% 2014 2,128 1,523 72% 605 28% 2015 2,068 1,479 72% 589 28% 2016 2,219 1,556 70% 663 30% 2017 2,219 1,556 70% 663 30% 2018 2,219 1,556 70% 663 30%

41
Table 62. Civil Invalid Benefits disaggregated by Gender and Ethnicity
Year Total Alb. men
Alb. men %
Alb. women
Alb. women
Serb men
% Serb women
% Other women
%
2013 2,137 1,527 71% 604 28% 3 0.14% 2 0.09% 1 0.05% 2014 2,128 1,520 71% 602 28% 3 0.14% 2 0.09% 1 0.05% 2015 2,068 1,476 71% 586 28% 3 0.15% 2 0.10% 1 0.05% 2016 2,219 1,553 70% 660 30% 3 0.14% 2 0.09% 1 0.05% 2017 2,219 1,553 70% 660 30% 3 0.14% 2 0.09% 1 0.05% 2018 2,219 1,553 70% 660 30% 3 0.14% 2 0.09% 1 0.05%
Rural, civilian Albanian men received a slightly larger share of this pension (52%). Urban men receive the next highest share of the overall benefits (20%), followed closely by rural women (19%) and then urban women (10%). Given the nature of this pension, no recommendations can be made.
Table 63. Civil Invalid Benefits Disaggregated by Gender and Geographic Location
Year Total recipients
Rural men
% Urban men
% Rural women
% Urban women
%
2013 2,137 1,112 52% 418 20% 404 19% 203 9% 2014 2,128 1,105 52% 418 20% 400 19% 205 10% 2015 2,068 1,080 52% 392 19% 399 19% 197 10% 2016 2,219 1,132 51% 427 19% 432 19% 228 10% 2017 2,219 1,132 51% 427 19% 432 19% 228 10% 2018 2,219 1,132 51% 427 19% 432 19% 228 10%
Missing Persons from KLA
This pension scheme is offered for families of missing KLA members. Data obtained from MLSW indicate that all registered missing persons who fought in the KLA are Albanian. As per Nr. 04/L-054, the amount transferred monthly depends on the number of people who are missing from individual families.131 This scheme has 20 recipients, 90% of whom are women and 10% men. This number and percentage has remained consistent over time and will likely remain similar in the future as well. The budget allocated for this scheme in 2015 was €9,948.48. Albanian men received 14% (€1,392.79), whereas Albanian women received 86% (€8,555.69) of this allocation.
Table 65 shows that most recipients of this pension are women from rural areas (65%), followed by urban women (25%). Given the nature of this pension, no recommendations can be made.
131
Amounts transferred monthly range from €358.50 for one missing person per family to €534.00 for families with more than four missing persons.
Table 64. KLA Missing Persons Pension Recipients by Gender and Ethnicity
Year Total recipients
Albanian men
Men %
Albanian women
Women %
2013 20 2 10% 18 90%
2014 20 2 10% 18 90%
2015 20 2 10% 18 90%
2016 20 2 10% 18 90%
2017 20 2 10% 18 90%
2018 20 2 10% 18 90%
Table 65. KLA Missing Persons Pension Recipients by Geographic Location
Year Total recipients
Rural men
% Urban men
% Rural women
% Urban women
%
2013 20 1 5% 1 5% 13 65% 5 25% 2014 20 1 5% 1 5% 13 65% 5 25% 2015 20 1 5% 1 5% 13 65% 5 25% 2016 20 1 5% 1 5% 13 65% 5 25% 2017 20 1 5% 1 5% 13 65% 5 25% 2018 20 1 5% 1 5% 13 65% 5 25%

42
Civilian Missing People
The pension for Civilian Missing People is distributed to families of civilian missing persons. As per Law Nr. 04/L-054, the amount transferred to families with civilian missing persons is €135. According to the International Committee of the Red Cross, 1,655 people still were missing as of 2014, including Serbs, Albanians, and other ethnic minorities. This includes missing civilians and KLA missing persons (see above).132
Overall 82% of the 351 recipients of this pension in 2014 were women and 18% men. As Albanian men comprise the majority of missing persons in Kosovo, the fact that 70% of pension recipients are their family members, namely Albanian women, is understandable. Albanian men comprise 16% of recipients, Serb women 11%, Serb men 2%, and women of other ethnicities less than one percent (see Table 66). It can be roughly estimated that the same percentage of the subsidies and transfers budget line for this pension is distributed to each of the aforementioned groups.
As missing persons tend to be primarily from rural areas, family members in rural areas receive most of this pension (45% in 2014). Urban women receive the next highest percentage (37%), followed by rural men (12%), and urban men (7%).
From 2016, the number of beneficiaries of this pension is expected to increase substantially with an increase in all types of recipients, but particularly Albanian, rural women. This increase is expected due to the new MLSW decision which permits new applications for this type of pension starting from 2014.133
Families of Dead War Invalids
Families receive this pension after the death of a war invalid. In 2015, the budget allocated for this scheme was €35,304. Table 68 depicts that 91-92% of recipients have been women, compared to 8-9% who have been men. Albanian women received 89% of the subsidies and transfers (€31,421), whereas Albanian men received 10% (€3,530).
132
International Committee of the Red Cross. 18 Nov. 2014. Web. 30 Nov. 2015, at: https://www.icrc.org/en/document/western-balkans-after-15-years-more-1600-people-still-missing-kosovo#.VGxTJfmG_V8. 133
KWN interview, November 2015.
Table 66. Pension for Civilian Missing People by Ethnicity and Gender
Year Total Men%
W. %
Alb. men
Alb. men %
Alb. w.
Alb. w. %
Serb men
% Serb w.
% RAE w.
% Other w.
Other w.
2013 321 20% 80% 62 19% 245 76% 3 0.9% 8 2% 0 0% 3 0.9%
2014 351 18% 82% 57 16% 246 70% 7 2.0% 37 11% 1 0.28% 3 0.85%
2015 354 17% 83% 54 15% 248 70% 7 2.0% 41 12% 1 0.28% 3 0.85%
2016 1,994 13% 87% 234 12% 1,604 80% 26 1.3% 120 6% 5 0.25% 5 0.25%
2017 1,994 13% 87% 234 12% 1,604 80% 26 1.3% 120 6% 5 0.25% 5 0.25%
2018 1,994 13% 87% 234 12% 1,604 80% 26 1.3% 120 6% 5 0.25% 5 0.25%
Table 67. Pension for Civilian Missing Persons by Location and Gender
Year Total Rural Men
% Urban Men
% Rural Women
% Urban women
%
2013 321 42 13% 23 7% 109 34% 147 46%
2014 351 41 12% 24 7% 158 45% 129 37%
2015 354 42 12% 19 5% 164 46% 129 36%
2016 1994 196 10% 64 3% 1245 62% 489 25%
2017 1994 196 10% 64 3% 1245 62% 489 25%
2018 1994 196 10% 64 3% 1245 62% 489 25%

43
Table 68. Families of Dead War Invalids Pension Disaggregated by gender and ethnicity
Year Total recipients
% men
% women
Alb. men % Alb. men
Alb. women
% Alb. women
Other men
% other men
2013 106 8% 92% 8 8% 97 92% 1 0.9% 2014 124 9% 91% 11 9% 113 91% 1 0.8% 2015 133 9% 91% 12 9% 121 91% 1 0.8% 2016 149 8% 92% 12 8% 137 92% 1 0.7% 2017 149 8% 92% 12 8% 137 92% 1 0.7% 2018 149 8% 92% 12 8% 137 92% 1 0.7%
Families of Dead Civilian Invalids
Recipients of this pension scheme include close family members of civilian invalids, after this person has died. Table 69 shows that most recipients have been women (83-84%). The total budget allocated for this scheme in 2015 was €10,238. Albanian women received 84% of these funds (€8,702), compared to 16% received by Albanian men (€1,638) and 1% by non-Serb, non-RAE minority women (€102.38).
Pension recipients tend to live primarily in rural areas with rural women receiving 55% of funds in 2015, followed by urban women receiving 29% of funds, rural men receiving 13%, and urban men 3%.
The number of pension recipients is expected to increase slightly in 2016, but the percentage of recipients by ethnicity and geographic location is expected to remain similar.
Caretakers of Civil Invalids
This scheme is for caretakers of civilians who became invalids as a result of the war. As per Law No. 04/L-054, civilian invalids who suffered damages on 80% of their bodies due to the war are entitled to receive care. Caretakers can be family members, or, in the absence of family members, social workers. The monthly transfer for a caretaker is €40.10. Table 71 illustrates that women have comprised the majority of caretakers and thus have received most of the subsidies and transfers related to this pension (61-65%). Women received 58% of the €1,905 allocated in 2015 (€1,105), whereas Albanian men received (€800).
Table 69. Recipients of Pension for Families of Dead Civilian Invalids by Gender and Ethnicity
Year Total recipients
Alb. men
Men %
Alb. w.
W. % Other women
Other women %
2013 77 12 16% 65 84% 0 2014 86 16 19% 70 81% 1 1% 2015 93 15 16% 78 84% 1 1% 2016 103 17 17% 86 83% 1 1% 2017 103 17 17% 86 83% 1 1% 2018 103 17 17% 86 83% 1 1%
Table 70. Recipients of Pension for Families of Dead Civilian Invalids by Location and Gender
Year Total Rural men
% Urban men
% Rural women
% Urban women
%
2013 77 8 10% 4 5% 41 53% 24 31% 2014 86 12 14% 4 5% 44 51% 26 30% 2015 93 12 13% 3 3% 51 55% 27 29% 2016 103 13 13% 4 4% 58 56% 29 28% 2017 103 13 13% 4 4% 58 56% 29 28% 2018 103 13 13% 4 4% 58 56% 29 28%
Table 71. Recipients of Caretakers of Civil Invalids Pension by Ethnicity and Gender
Year Total Alb. men
Men %
Alb. w.
W. %
2013 36 14 39% 22 61% 2014 36 13 36% 23 64% 2015 36 14 39% 22 61% 2016 43 15 35% 28 65% 2017 43 15 35% 28 65% 2018 43 15 35% 28 65%

44
With regard to geographic location, rural women comprised 47% of caretakers in 2015, rural men 33%, urban women 14%, and urban men 6% (see Table 72). The number of recipients is expected to increase slightly in 2016 and remain the same through 2018 with comparatively larger increases in the percentage of Albanian women caretakers foreseen.
Caretakers of War Invalids
As per Law No. 04/L-054, war invalids who have damages on 80% of their bodies are entitled to caretakers. Caretakers can be family members, or, in the absence of family members, social workers. War invalids who have suffered damages on more than 80% of their body are entitled to one caretaker who receives €180 monthly. Persons caring for war invalids who have disabilities resulting from the war receive this pension. Notably, the pension for caretakers of war invalids is 4.5 times the pension for caretakers of civilians. Yet, the responsibilities and work performed by the caretaker in either case is similar. In the context of equal pay for equal work, this seems discriminatory against caretakers of civilians, who tend to be women.
Table 73 shows that most recipients of this pension also have been women (79-82%). In 2015, of the €17,325 allocated for this pension, Albanian women received 77% (€13,340), Albanian men 22% (€3,812), and women from other, non-Serb, non-RAE minorities 1% (€173). The number of beneficiaries is expected to increase slightly in 2016 and remain constant through 2018 with a similar percentage of subsidies and transfers being distributed to the aforementioned ethnic groups.
Key Conclusions
Most benefits from this Department go to rural, Albanian women, though others also receive these benefits.
Albanian women, primarily from rural areas, comprise the majority of caretakers of persons with disabilities resulting from war. The pension for caretakers of war invalids is 4.5 times the pension for caretakers of civilian invalids. Yet, the responsibilities and work performed by the caretaker in either case is similar. Considering principles of equal pay for equal work, this seems discriminatory against caretakers of civilians, who tend to be women.
Recommendations
Demographic information regarding the recipients of these pensions can be useful in ensuring that they have easy access to services related to these pensions, considering their specific needs.
Consider amending Law Nr. 04/L-054 on the status and rights of martyrs and war invalids to ensure equal pay for equal work performed by all caretakers of persons who have sustained injuries during the war. The subsidies and transfers economic category is foreseen to be €38,000,000 in 2016 and should be increased by €72,240 to address this current inequality.
Table 72. Recipients of Caretakers of Civilian Invalids Pension by Gender and Location
Year Total Rural men
% Urban men
% Rural w.
% Urban w.
%
2013 36 12 33% 2 6% 17 47% 5 14% 2014 36 11 31% 2 6% 18 50% 5 14% 2015 36 12 33% 2 6% 17 47% 5 14% 2016 43 12 28% 2 5% 21 49% 7 16% 2017 43 12 28% 2 5% 21 49% 7 16% 2018 43 12 28% 2 5% 21 49% 7 16%
Table 73. Recipients of Pensions for Caretakers of War Invalids by Gender and Ethnicity Year Total Men % Women % Alb. men % Alb. men Alb. w. % Alb. w. Other w. %
2013 76 18% 82% 14 18% 61 80% 1 1% 2014 75 20% 80% 15 20% 59 79% 1 1% 2015 75 21% 79% 16 21% 58 77% 1 1% 2016 81 21% 79% 17 21% 63 78% 1 1% 2017 81 21% 79% 17 21% 63 78% 1 1% 2018 81 21% 79% 17 21% 63 78% 1 1%

45
Bibliography
Kosovo Agency of Statistics, “Gender Statistics in Kosovo”, by Sanije Uka 2014, at:
http://www.instat.gov.al/media/257404/gender_statistics_in_kosovo.pdf _____, “Seria 1, Statistikat e përgjithshme, Kosova në shifra 2012” 12 June 2013, at: https://ask.rks-
gov.net/publikimet/doc_download/1006-kosova-naeuml-shifra-2012. Assembly of the Republic of Kosovo, Administrative Instruction No. 15/2009, at: https://mpms.rks-
gov.net/Portals/0/Ligji/Sekondar/U.A%20Nr.15-2009%20Për%20Rritjen%20e%20pensioneve%20për%20zbatimin%20e%20Vendimit%20të%20Qeverisë%20Nr.02-51.pdf.
_____. Kosovo Law on Budget of The Republic of Kosovo for year 2015, at: http://www.kuvendikosoves.org/common/docs/ligjet/04-L-172%20a.pdf.
_____. Kosovo Law on Disability Pensions 2003, No. 2003/33, at: http://www.kuvendikosoves.org/common/docs/ligjet/2003_23_en.pdf.
_____. Kosovo Law on Gender Equality, 2015, No. 05/L-020, at: http://www.kuvendikosoves.org/common/docs/ligjet/05-L-020%20a.pdf.
_____. Kosovo Law on Material Support for Families of Children with Permanent Disability, No. 03/L-022, at: http://www.gazetazyrtare.com/e-gov/index.php?option=com_content&task=view&id=260&Itemid=28&lang=en.
_____. Kosovo Law on the Pensions for Kosovo Protection Corps Members, 2008, No. 03/L-100, at: http://www.gazetazyrtare.com/e-gov/index.php?option=com_content&task=view&id=278&lang=en. _____. Kosovo Law on Pensions of Members of the Security Force, 2012, No. 04/L-084, at: http://www.mksf-
ks.org/repository/docs/ON_PENSIONS_OF_MEMBERS_OF_THE_KOSOVO_SECURITY_FORCE.pdf _____. Kosovo Law on Preventing and Combatting Trafficking in Human Beings, NO. 04/L-218, at:
https://www.mpb-ks.org/repository/docs/Ligji_kunder_trafikimit-_Anglisht.pdf. _____. Kosovo Law on the Social Assistance Scheme in Kosovo, 2003, No. 2003/15, at:
http://www.kuvendikosoves.org/common/docs/ligjet/2003_15_en.pdf. _____. Kosovo Law on the status and the rights of martyrs, invalids, veterans, members of the Kosovo Liberation
Army, Civilian Victims of War and their Families, 2011, No. 04/L054, at: http://www.assembly-kosova.org/common/docs/ligjet/Law%20on%20the%20status%20of%20the%20martyrs.pdf and Law No.
_____. Law No. 04/L-101 on Pension Funds in Kosovo, 2012, at: http://www.kuvendikosoves.org/common/docs/ligjet/Law%20on%20Pension%20Funds%20of%20Kosovo.pdf.
_____. Kosovo Law on Social and Family Services, NO. 02/L-17, at: http://www.kuvendikosoves.org/common/docs/ligjet/2005_02-L17_en.pdf.
_____. Kosovo Law on The Social Assistance Scheme in Kosovo, No, 2003/15 , at: http://www.assembly-kosova.org/common/docs/ligjet/2003_15_en.pdf.
Douarin, E., Litchfield, J. and Sabates-Wheeler, R., 2010. Poverty, Livelihoods and War Legacies: the Case of Post-War Rural Kosovo. MICROCON Research Working Paper 37, Brighton: MICROCON.
European Commission, Barcelona Objectives, Belgium: European Commission, 2013, at: http://eurogender.eige.europa.eu/sites/default/files/130531_barcelona_en.pdf.
Farsvenden, Ulf Nicole Farnsworth and Ariana Qosaj-Mustafa for Orgut, Country Gender Profile, Prishtina: Sida, 2014, at: http://womensnetwork.org/documents/20140513160130237.pdf.
Humanitarian Law Centre, The Kosovo Memory Book 1998-2000. Humanitarian Law Centre, n.d., at: http://www.kosovskaknjigapamcenja.org/?page_id=107&lang=de.
International Committee of the Red Cross. 18 Nov. 2014, Nov. 2015, at: https://www.icrc.org/en/document/western-balkans-after-15-years-more-1600-people-still-missing-kosovo#.VGxTJfmG_V8.
General Assembly of the United Nations, Universal Declaration of Human Rights, 1948, at: http://www.un.org/en/universal-declaration-human-rights/index.html.
Government of the Republic of Kosovo, Administrative Instruction No 10/2014, at: https://gzk.rks-gov.net/ActDocumentDetail.aspx?ActID=10414.
_____, Administrative Instruction No. 10/2007 on early pensions for workers of Trepca complex and other subterranean mines in Kosovo, 2007, at: https://mpms.rks-gov.net/Portals/0/Ligji/SekondarAnglisht/A.I%20No.10-2007%20On%20Early%20Pension%20for%20Workers%20of%20TREPCA%20Complex.pdf.

46
_____, National Strategy and Action Plan against Trafficking in Human Beings 2011-2014, at: https://www.mpb-ks.org/repository/docs/TQNJAnglisht.pdf.
_____, Program of the Government of the Republic of Kosovo 2015-2018, at: http://www.kryeministri-ks.net/repository/docs/Government_Programme_2015-2018_eng_10_mars.pdf ).
_____, Kosovo Program against Domestic Violence and Action Plan 2011-2014, at: http://www.kuvendikosoves.org/common/docs/ligjet/Law%20on%20Pension%20Funds%20of%20Kosovo.pdf.
_____, Regulation Nr. 02/2011 on the Areas of Administrative Responsibility of the Office of the Prime Minister and Ministries, 2011, at: http://www.kryeministri-ks.net/repository/docs/Rregullorja_02-2011-e_miratuar_nga_Qeveria-finale.pdf.
_____,Strategjia për Decentralizimin e Shërbimeve Sociale në Kosovë 2013-2017, Zhvilluar nga Komisioni Këshillimor për politika vendore për Decentralizimin e Shërbimeve Sociale, September 2012, at: http://www.kryeministri-ks.net/repository/docs/Strategjia_per_Decentralizimin_e_Sherbimeve_Sociale_ne_Kosove_2013-2017.pdf.
Group for Legal and Political Studies, Pension System in Kosovo: Review of current state, main challenges and gaps, Prishtina: 2012, at: http://legalpoliticalstudies.org/download/Policy%20Report%2006%202012%20eng.pdf .
Kosovo Women’s Network, Budgeting for Social Welfare, Prishtina: 2014, at: http://www.womensnetwork.org/documents/20140702111942678.pdf.
_____. At What Cost? Budgeting for the Implementation of Legal Framework Against Domestic Violence in Kosovo, Prishtina: KWN, 2012, at: http://www.womensnetwork.org/documents/20130405120224756.pdf
_____, No More Excuses: An Analysis of Attitudes, Incidence, and institutional response to Domestic Violence in Kosovo, Prishtina, Kosovo, 2015, at: http://www.womensnetwork.org/documents/20151124105025622.pdf.
_____, The Care Economy and Women’s Labour Force Participation, Prishtina: Forthcoming, 2016. Ministry of Finance of the Republic of Kosovo, Budget Circular 2015/02 for Ministries, 2015, at: https://mf.rks-
gov.net/en-us/Reports/Reports-and-Publications/Budget-Circular. _____, Budget Circular 2015/02 for Municipalities, 2015, at: https://mf.rks-gov.net/en-us/Reports/Reports-
and-Publications/Budget-Circular. _____, Draft Law on Budget 2016, 2015, at: https://mf.rks-gov.net/en-us/Budget/Budget-of-Republic-of-
Kosovo/Central-Budget. MLSW, Administrative Instruction No.05/2006 for the Establishment of Children in Foster Care and Adoption,
Prishtina: 2006, at: http://mpms.rks-gov.net/Portals/0/Ligji/SekondarAnglisht/A.I%20No.05-2006%20On%20Establishment%20of%20the%20Panel%20for%20Placing%20Childre.pdf.
_____, Division of Human Resources, Duties and Responsibilities, at: https://mpms.rks-gov.net/en-us/departments/departmentoffinanceandgeneralservices/humanresourcesdivision.aspx.
_____, Division for Social Services, Duties and Responsibilities, at: https://mpms.rks-gov.net/en-us/departments/departmentofsocialpolicyandfamilies/socialservicesdivision.aspx.
Office of the Prime Minister of Kosovo, Declaration of Medium-Term Policy Priorities 2014-2016, 2013, at: http://www.kryeministri-ks.net/repository/docs/Declaration_of_Medium-Term_Policy_Priorities.pdf.
_____, National Disability Action Plan for the Republic of Kosovo, 2009, at: http://www.cooperazioneallosviluppo.esteri.it/pdgcs/italiano/iniziative/pdf/Kosovo_Plan.pdf .
_____, National Strategy on the rights of persons with disabilities in the Republic of Kosovo 2013-2023, 2013, at: http://www.kryeministri-ks.net/repository/docs/STRATEGJIA_NACIONALE_PER_TE_DREJTAT_E_PERSONAVE_ME_AFTESI_TE..._Shq+Ser+Ang.pdf.
Farsvenden, Ulf Nicole Farnsworth and Ariana Qosaj-Mustafa for Orgut, Country Gender Profile, Prishtina: Sida, 2014, at: http://womensnetwork.org/documents/20140513160130237.pdf.
Telegrafi, Article: “Konfirmohet rritja e të ardhurave të asistencës sociale për 25 për qind”, 2015, at: http://www.telegrafi.com/lajme/konfirmohet-rritja-e-te-ardhurave-te-asistences-sociale-per-25-per-qind-2-72772.html, accessed on 16.11.2015
United Nations, Convention for the Rights of Persons with Disabilities, 2006, at: http://www.un.org/disabilities/convention/conventionfull.shtml.
_____, Convention on the Rights of the Child, 1989, at: http://www.ohchr.org/en/professionalinterest/pages/crc.aspx.
UNDP, The Real Value of Social Assistance: An Assessment of Social Assistance Benefit Adequacy, Prishtina: UNDP, 2014, at:
47
http://www.ks.undp.org/content/dam/kosovo/docs/Communications/Dokumenti%20The%20Real%20Value%20of%20Social%20Assistance%20ONLINE.pdf.
World Bank, The Kosovo Pension Reform: Achievements and Lessons, Prishtina: 2007, at: http://siteresources.worldbank.org/SOCIALPROTECTION/Resources/SP-Discussion-papers/Pensions-DP/0707.pdf.
Katalogimi në botim – (CIP) Biblioteka Kombëtare e Kosovës “Pjetër Bogdani”
36.073(496.51)
336.121(496.51)
Morina, Donjeta
Budgeting for Social Welfare: A Gender+ Analysis to Inform
Gender Responsive Budgeting in the Ministry of Labour and Social Welfare in
Kosovo for 2016-2018 / By Donjeta Morina and Nicole Farnsworth. –
Prishtina : Kosovo Women’s Network, 2015. - 52 f. ; 21 cm.
Bibliography : f. 45-46
1.Farnsworth, Nicole
ISBN 978-9951-8852-8-7