christine p. dancey and john reidy statistics without
TRANSCRIPT
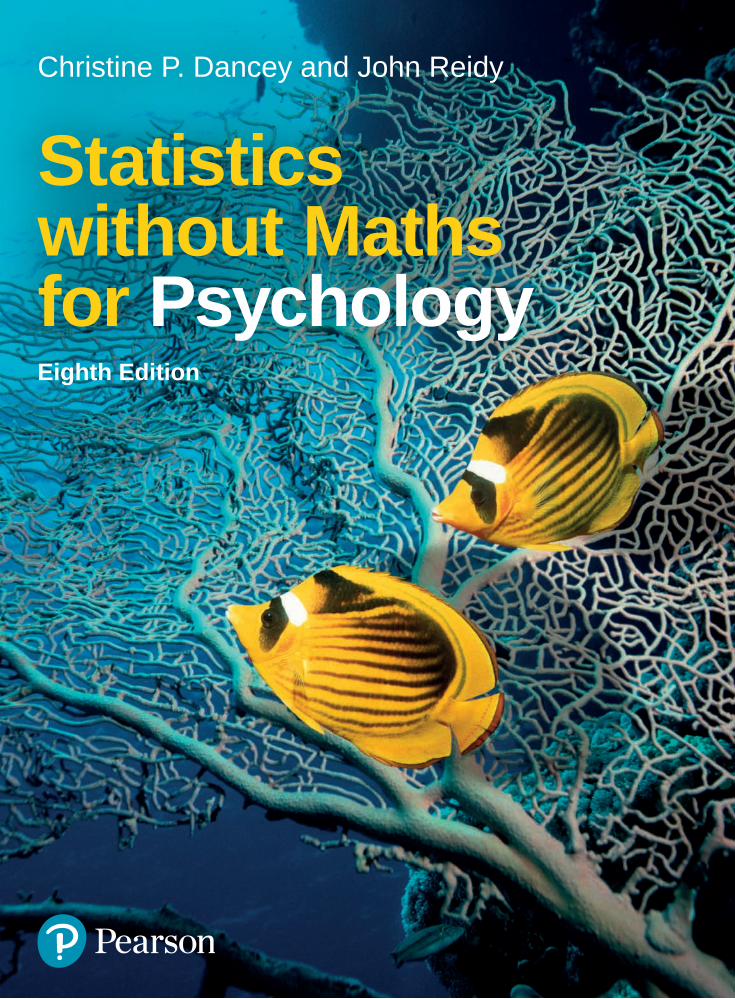
Statistics without Maths for Psychology
Christine P. Dancey and John Reidy
Eighth Edition

At Pearson, we have a simple mission: to help people
make more of their lives through learning.
We combine innovative learning technology with trusted
content and educational expertise to provide engaging
and effective learning experiences that serve people
wherever and whenever they are learning.
From classroom to boardroom, our curriculum materials, digital
learning tools and testing programmes help to educate millions
of people worldwide – more than any other private enterprise.
Every day our work helps learning flourish, and
wherever learning flourishes, so do people.
To learn more, please visit us at www.pearson.com/uk
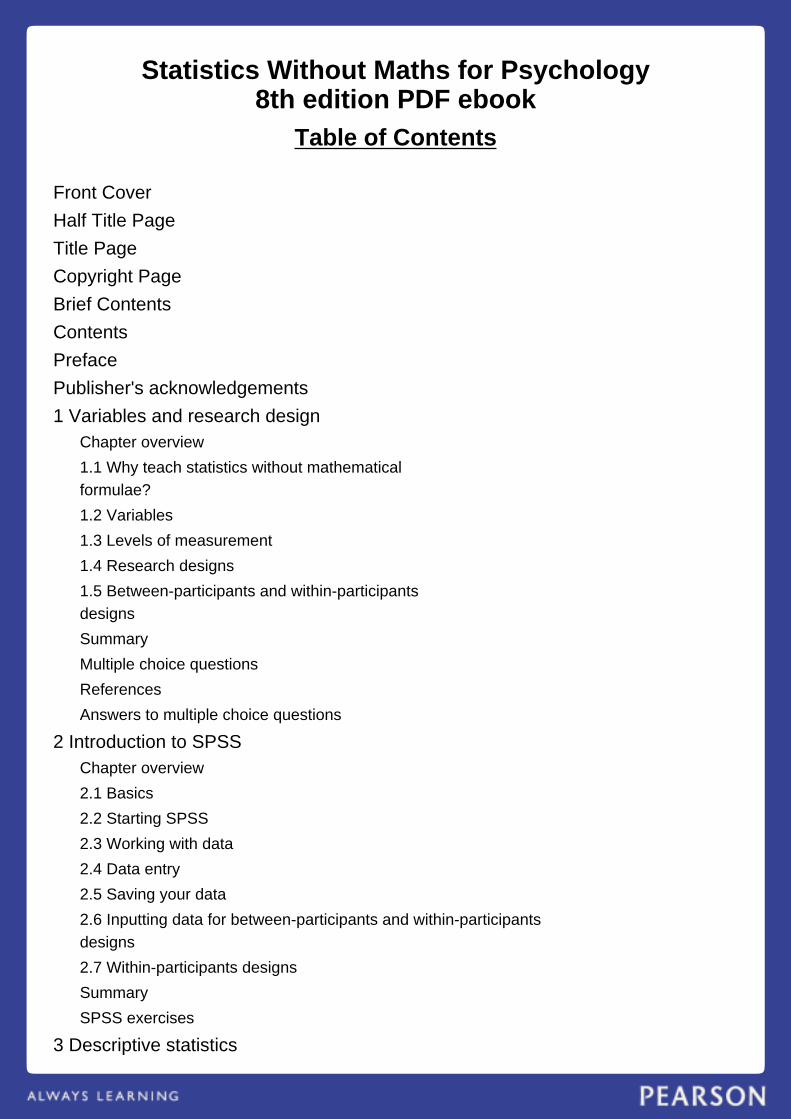
Statistics Without Maths for Psychology8th edition PDF ebook
Table of Contents
Front Cover
Half Title Page
Title Page
Copyright Page
Brief Contents
Contents
Preface��������������
Publisher's acknowledgements
1 Variables and research design��������������������������������������Chapter overview�����������������������
1.1 Why teach statistics without mathematicalformulae?��������������������������������������������������������������
1.2 Variables��������������������
1.3 Levels of measurement��������������������������������
1.4 Research designs���������������������������
1.5 Between-participants and within-participantsdesigns���������������������������������������������������������������
Summary��������������
Multiple choice questions��������������������������������
References�����������������
Answers to multiple choice questions�������������������������������������������
2 Introduction to SPSS�����������������������������Chapter overview�����������������������
2.1 Basics�����������������
2.2 Starting SPSS������������������������
2.3 Working with data����������������������������
2.4 Data entry���������������������
2.5 Saving your data���������������������������
2.6 Inputting data for between-participants and within-participantsdesigns����������������������������������������������������������������������������������
2.7 Within-participants designs��������������������������������������
Summary��������������
SPSS exercises���������������������
3 Descriptive statistics�������������������������������
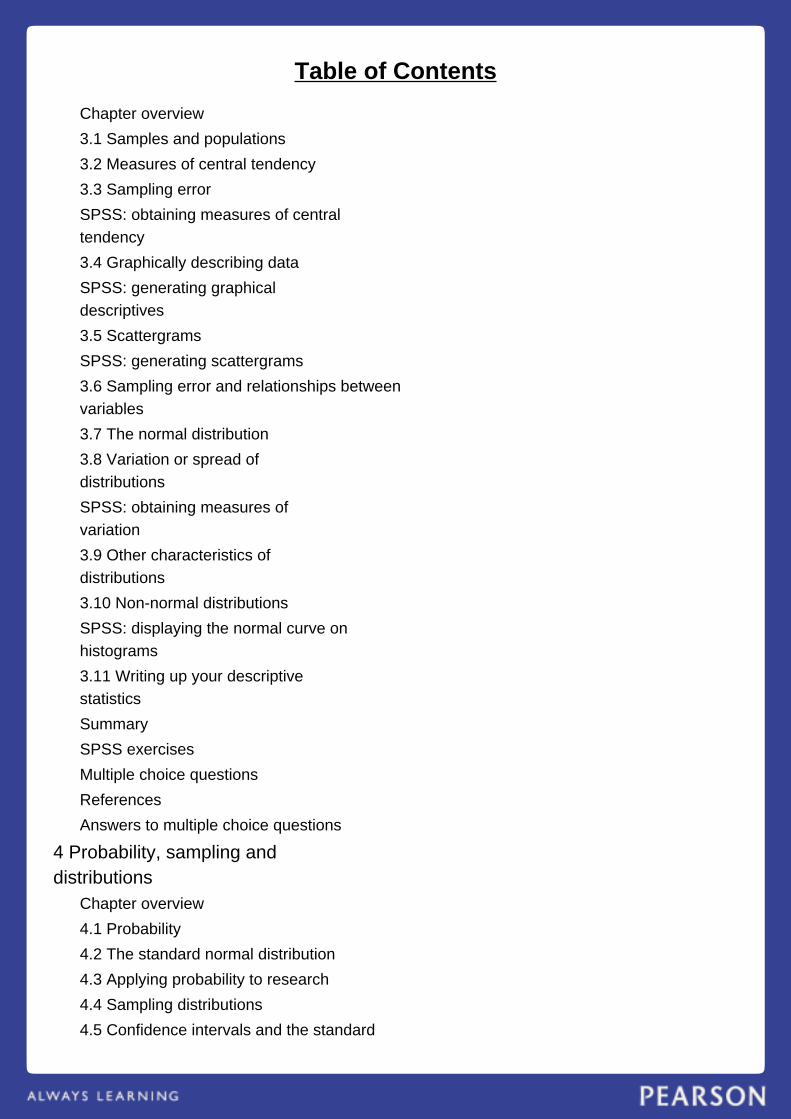
Table of Contents
Chapter overview�����������������������
3.1 Samples and populations����������������������������������
3.2 Measures of central tendency���������������������������������������
3.3 Sampling error�������������������������
SPSS: obtaining measures of centraltendency���������������������������������������������������
3.4 Graphically describing data��������������������������������������
SPSS: generating graphicaldescriptives����������������������������������������������
3.5 Scattergrams�����������������������
SPSS: generating scattergrams������������������������������������
3.6 Sampling error and relationships betweenvariables�������������������������������������������������������������
3.7 The normal distribution����������������������������������
3.8 Variation or spread ofdistributions�����������������������������������������������
SPSS: obtaining measures ofvariation��������������������������������������������
3.9 Other characteristics ofdistributions�������������������������������������������������
3.10 Non-normal distributions������������������������������������
SPSS: displaying the normal curve onhistograms������������������������������������������������������
3.11 Writing up your descriptivestatistics��������������������������������������������������
Summary��������������
SPSS exercises���������������������
Multiple choice questions��������������������������������
References�����������������
Answers to multiple choice questions�������������������������������������������
4 Probability, sampling anddistributions������������������������������������������������
Chapter overview�����������������������
4.1 Probability����������������������
4.2 The standard normal distribution�������������������������������������������
4.3 Applying probability to research�������������������������������������������
4.4 Sampling distributions���������������������������������
4.5 Confidence intervals and the standard
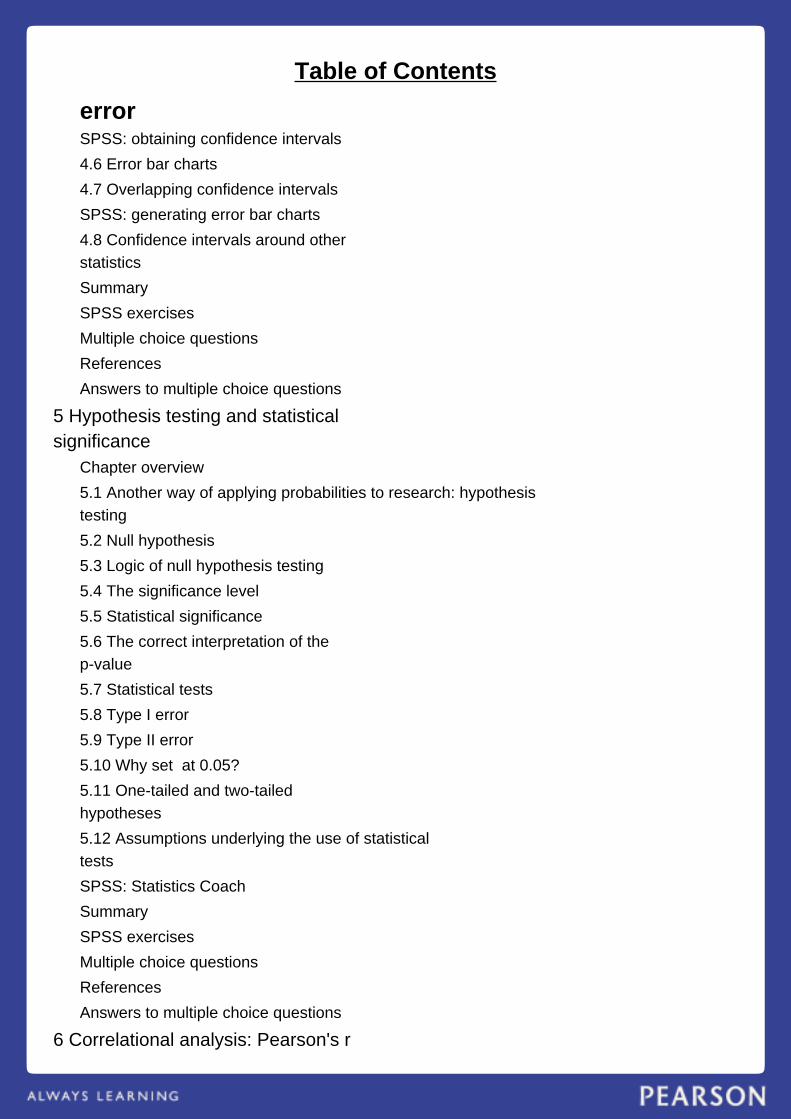
Table of Contents
error������������������������������������������������������SPSS: obtaining confidence intervals�������������������������������������������
4.6 Error bar charts���������������������������
4.7 Overlapping confidence intervals�������������������������������������������
SPSS: generating error bar charts����������������������������������������
4.8 Confidence intervals around otherstatistics�������������������������������������������������������
Summary��������������
SPSS exercises���������������������
Multiple choice questions��������������������������������
References�����������������
Answers to multiple choice questions�������������������������������������������
5 Hypothesis testing and statisticalsignificance��������������������������������������������������������
Chapter overview�����������������������
5.1 Another way of applying probabilities to research: hypothesistesting��������������������������������������������������������������������������������
5.2 Null hypothesis��������������������������
5.3 Logic of null hypothesis testing�������������������������������������������
5.4 The significance level���������������������������������
5.5 Statistical significance�����������������������������������
5.6 The correct interpretation of thep-value����������������������������������������������������
5.7 Statistical tests����������������������������
5.8 Type I error�����������������������
5.9 Type II error������������������������
5.10 Why set at 0.05?�����������������������������
5.11 One-tailed and two-tailedhypotheses������������������������������������������������
5.12 Assumptions underlying the use of statisticaltests���������������������������������������������������������������
SPSS: Statistics Coach�����������������������������
Summary��������������
SPSS exercises���������������������
Multiple choice questions��������������������������������
References�����������������
Answers to multiple choice questions�������������������������������������������
6 Correlational analysis: Pearson's r
Table of Contents
Chapter overview�����������������������
6.1 Bivariate correlations���������������������������������
SPSS: bivariate correlations - Pearson's r
SPSS: obtaining a scattergram matrix�������������������������������������������
6.2 First- and second-ordercorrelations�����������������������������������������������
SPSS: partial correlations - Pearson's r
6.3 Patterns of correlations�����������������������������������
Summary��������������
SPSS exercise��������������������
Multiple choice questions��������������������������������
References�����������������
Answers to multiple choice questions�������������������������������������������
7 Analyses of differences between two conditions: thet-test�������������������������������������������������������������������
Chapter overview�����������������������
7.1 Analysis of two conditions�������������������������������������
SPSS: for an independent t-test��������������������������������������
SPSS: two samples repeated-measures design - paired t-test
Summary��������������
SPSS exercise��������������������
Multiple choice questions��������������������������������
References�����������������
Answers to multiple choice questions�������������������������������������������
8 Issues of significance�������������������������������Chapter overview�����������������������
8.1 Criterion significance levels����������������������������������������
8.2 Effect size����������������������
8.3 Power����������������
8.4 Factors influencing power������������������������������������
8.5 Calculating power����������������������������
8.6 Confidence intervals�������������������������������
Summary��������������
Multiple choice questions��������������������������������
References�����������������
Answers to multiple choice questions�������������������������������������������
9 Measures of association��������������������������������
Table of Contents
Chapter overview�����������������������
9.1 Frequency (categorical) data���������������������������������������
9.2 One-variable x2 or goodness-of-fit test
SPSS: one-variable x2
SPSS: one-variable x2 - using frequencies different from those expected underthe null hypothesis
9.3 x2 test for independence: 2 * 2
SPSS: 2 * 2x2
9.4 x2 test of independence: r * c
Summary��������������
SPSS exercises���������������������
Multiple choice questions��������������������������������
References�����������������
Answers to multiple choice questions�������������������������������������������
10 Analysis of differences between three or moreconditions������������������������������������������������������������������
Chapter overview�����������������������
10.1 Visualising the design����������������������������������
10.2 Meaning of analysis of variance�������������������������������������������
SPSS: performing a one-way ANOVA���������������������������������������
10.3 Descriptive statistics����������������������������������
10.4 Planned comparisons�������������������������������
10.5 Controlling for multipletesting��������������������������������������������
10.6 Post-hoc tests��������������������������
10.7 Repeated-measures ANOVA�����������������������������������
SPSS: instructions for repeated-measuresANOVA�����������������������������������������������������
Summary��������������
SPSS exercises���������������������
Multiple choice questions��������������������������������
References�����������������
Answers to multiple choice questions�������������������������������������������
11 Analysis of variance with more than oneIV����������������������������������������������������
Chapter overview�����������������������
11.1 Introduction������������������������
11.2 Sources of variance�������������������������������
Table of Contents
11.3 Designs suitable for factorialANOVA������������������������������������������������
11.4 ANOVA terminology�����������������������������
11.5 Two between-participants independentvariables����������������������������������������������������������
SPSS: analysis of two between-participantsfactors���������������������������������������������������������
11.6 Two within-participantsvariables���������������������������������������������
SPSS: ANOVA with two within-participantsfactors�������������������������������������������������������
11.7 One between- and one within-participantsvariable�������������������������������������������������������������
SPSS: ANOVA with one between-participants factor and one within-participantsfactor������������������������������������������������������������������������������������������
Summary��������������
SPSS exercises���������������������
Multiple choice questions��������������������������������
References�����������������
Answers to multiple choice questions�������������������������������������������
12 Regression analysis�����������������������������Chapter overview�����������������������
12.1 The purpose of linearregression��������������������������������������������
SPSS: drawing the line of best fit�����������������������������������������
SPSS: linear regression analysis���������������������������������������
12.2 Multiple regression�������������������������������
Summary��������������
SPSS exercises���������������������
Multiple choice questions��������������������������������
References�����������������
Answers to multiple choice questions�������������������������������������������
13 Analysis of three or more groups partialling out effects of acovariate���������������������������������������������������������������������������������
Chapter overview�����������������������
SPSS: obtaining a chart of regressionlines��������������������������������������������������
13.1 Pre-existing groups�������������������������������
Table of Contents
13.2 Pretest-posttest designs
SPSS: obtaining output for an ANCOVA�������������������������������������������
Summary��������������
SPSS exercise��������������������
Multiple choice questions��������������������������������
References�����������������
Answers to multiple choice questions�������������������������������������������
14 Introduction to factor analysis�����������������������������������������Chapter overview�����������������������
14.1 What is the purpose of factoranalysis?���������������������������������������������������
14.2 The two main types of factoranalysis�������������������������������������������������
14.3 Use of factor analysis inpsychometrics���������������������������������������������������
14.4 Visualising factors�������������������������������
14.5 Conceptualising factor analysis�������������������������������������������
14.6 Naming the factors������������������������������
14.7 Loadings of variables onfactors��������������������������������������������
14.8 The correlational matrix������������������������������������
14.9 The unrotated and rotatedmatrices����������������������������������������������
14.10 Plotting the variables in factorspace���������������������������������������������������
14.11 Rotating the matrix��������������������������������
14.12 Steps taken in performing a factoranalysis��������������������������������������������������������
14.13 Use of factors or components in furtheranalyses�������������������������������������������������������������
14.14 The meaning of negativeloadings���������������������������������������������
SPSS: factor analysis - principal components analysis
Summary��������������
Multiple choice questions��������������������������������
References�����������������
Answers to multiple choice questions�������������������������������������������
15 Introduction to multivariate analysis of variance
Table of Contents
(MANOVA)��������������������������������������������������������������������Chapter overview�����������������������
15.1 Multivariate statistics�����������������������������������
15.2 Why use multivariate analyses ofvariance?������������������������������������������������������
15.3 Multivariate analysis ofvariance���������������������������������������������
15.4 Logic of MANOVA���������������������������
15.5 Assumptions of MANOVA���������������������������������
15.6 Which F-value?��������������������������
15.7 Post-hoc analyses of individualDVs�����������������������������������������������
15.8 Correlated DVs��������������������������
15.9 How to write up these analyses������������������������������������������
SPSS: conducting MANOVA with one between-participants IV and twoDVs���������������������������������������������������������������������������
15.10 Within-participants designs����������������������������������������
SPSS: one within-participants IV and twoDVs���������������������������������������������������
Summary��������������
SPSS exercises���������������������
Multiple choice questions��������������������������������
References�����������������
Recommended texts������������������������
Answers to multiple choice questions�������������������������������������������
16 Non-parametric statistics�����������������������������������Chapter overview�����������������������
16.1 Alternative to Pearson's r: Spearman's rho
SPSS: correlational analysis - Spearman's rho
SPSS exercise��������������������
16.2 Alternatives to the t-test: Mann-Whitney and Wilcoxon
SPSS: two-sample test for independent groups - Mann-Whitney
SPSS exercise��������������������
SPSS: two-sample test for repeated measures - Wilcoxon
SPSS exercise��������������������
16.3 Alternatives to ANOVA���������������������������������
SPSS: independent samples test for more than two conditions - Kruskal-Wallis
SPSS exercise��������������������
Table of Contents
SPSS: repeated-measures test for more than two conditions - Friedman's test
SPSS exercise��������������������
Summary��������������
Multiple choice questions��������������������������������
References�����������������
Answers to multiple choice questions�������������������������������������������
Answers to activities and SPSSexercises�����������������������������������������������
Appendix 1: Table of z-scores and the proportion of the standard normaldistribution falling above and below eachscore������������������������������������������������������������������������������������������������������������������������������
Appendix 2: Table r to zr��������������������������������
Index������������
Back Cover