company performance bjtm 1h17 - yang … bjtm network 2011 2012 2013 2014 2015 2016 1h17 network...
TRANSCRIPT
Company Performance
BJTM 1H17
ANALYST MEETING QUARTER II 2017IR BJTM 1
judul
IR BJTM
Table of Contents
2
Description Page
Agenda Cover
Table of Contents 2
Overview 2017 3 ndash 5
Business Plan 2017 6 ndash 8
Appendix 9 ndash 17
- Macro Economy Review 10
- Balance Sheet Profit amp Loss 11 ndash 12
- Financial Ratio 13
- Third Party Fund amp Loan 14 - 17
- Management 18 - 25
- Strength 26 ndash 34
Contact 35
IR BJTM
OVERVIEW
3
judul
IR BJTM
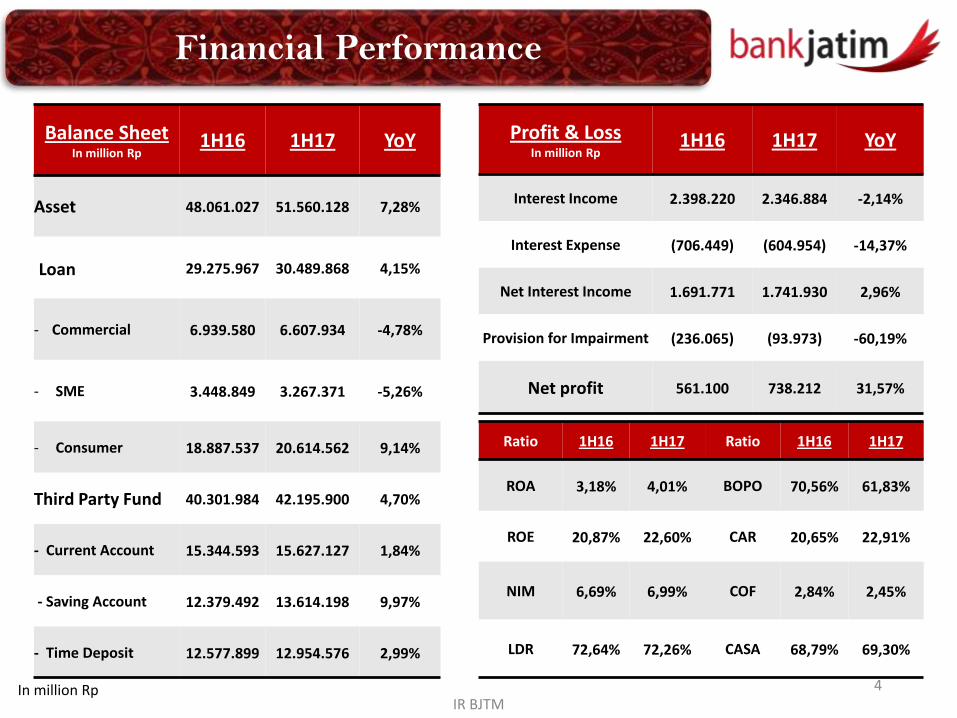
Balance SheetIn million Rp
1H16 1H17 YoY
Asset 48061027 51560128 728
Loan 29275967 30489868 415
- Commercial 6939580 6607934 -478
- SME 3448849 3267371 -526
- Consumer 18887537 20614562 914
Third Party Fund 40301984 42195900 470
- Current Account 15344593 15627127 184
- Saving Account 12379492 13614198 997
- Time Deposit 12577899 12954576 299
Profit amp LossIn million Rp
1H16 1H17 YoY
Interest Income 2398220 2346884 -214
Interest Expense (706449) (604954) -1437
Net Interest Income 1691771 1741930 296
Provision for Impairment (236065) (93973) -6019
Net profit 561100 738212 3157
Ratio 1H16 1H17 Ratio 1H16 1H17
ROA 318 401 BOPO 7056 6183
ROE 2087 2260 CAR 2065 2291
NIM 669 699 COF 284 245
LDR 7264 7226 CASA 6879 6930
Financial Performance
In million Rp 4
IR BJTM
Collectibility 5
Collectibility 4
Collectibility 3
Collectibility 2
Collectibility 1
Loan Impairment Loan Impairment
1233 978 1356 120162 28 55 30
47 22 52 27
456 49 431 30
27478
41
28596
55
Loan amp Impairment CompositionNPL
Information1H16 1H17
NPL Gross 458 480
NPL Net 107 067
Coverage Ratio
8337 9180
Consumerrsquos NPL
085 069
Commercialrsquos NPL
1310 1643
SMErsquos NPL 749 717
1H16 1H17
In Billion Rp
Non Performing Loan
5
NPLbull Collateral sold in auction 147 billion rupiah and auction registered still up to 100 billion rupiahbull Extracomptable or write-off collection result to 336 billion rupiah
IR BJTM
BUSINESS PLAN 2017
6
IR BJTM
Description 2015 2016 2017 Econsolidated
2017 Econventional
Total Asset 1265 054 512 919
Loan 846 445 863 1175
Third Party Fund 1319 -428 744 1257
Pre Tax Profit -833 1513 1001 1020
Financial Ratio
- CAR 2122 2388 2259
- LDR 8292 9048 9148
- NPL Gross 429 477 310
- NIM 641 694 687
- BOPO 7611 7222 7076
- ROE 1611 1782 2055
- ROA 267 298 329
Business Plan
7
IR BJTM
Network 2011 2012 2013 2014 2015 2016 1H17
NETWORK
PLAN
2017
SHARIA
PLAN
2017
Head Office 1 1 1 1 1 1 1 1
Territorial Office - - - - - - - 4
Branch Office 41 41 41 43 45 47 48 1
Sub Branch Office 67 81 107 153 165 166 166 6 11
Cash office 164 164 176 165 185 190 192 16 2
Sharia service
office47 47 47 97 97 191 191
Payment Point 115 138 155 167 171 181 182 21 7
Mobile cash 61 63 65 68 71 85 87 7
CDM 1 1 1 2 2 2 2
ATM 262 368 479 595 688 703 706 46 18
Total network 759 904 1072 1291 1425 1566 1575
Networks Plan
8
IR BJTM
APPENDIX
9
IR BJTM
- - - - - - -
550525500475475475430
838836
638726
683
335
445
345307302
361437
BI 7-Day RR INFLASI
36644114 4199
3862 3990 4092 4030 4200 4244 4413 4403
3320
3707 3714 4320 4464 4413 4469 4575 46054837 4917
FY13 FY14 3M15 1H15 9M15 FY15 3M16 1H16 9M16 FY16 3M17
in trillion Rp
LOAN FUND
558502471470473479492504502490501
608586
518525544544534555561550537
FY13 FY14 3M15 1H15 9M15 FY15 3M16 1H16 9M16 FY16 3M17
INDONESIA EAST JAVA
Economic Growth Economic Share
Indonesia Java
JAVA
59 Java
22 Sumatra
2 Bali amp Nusa Tenggara
6 Sulawesi
8 Kalimantan
3 Maluku amp Papua
East Java
29 DKI Jakarta
25 East Java
23 West Java
15 Central Java
7 Banten
1 DIY
Source Bank Indonesia
Macro Economy Review
10
IR BJTM 11
InformationIn million Rp
1H16 1H17 YoY 2Q16 1Q17 2Q17 YoY QoQ
Total Asset 48061027 51560128 728 (1084245) 7284038 1243141 -21466 -8293
Placement BI amp SBI 11321922 13658218 2064 (1906658) 7342886 (1220968) -3596 -11663
Loan 29275967 30489868 415 1007664 (383849) 1198296 1892 -41218
Allowance for Impairment Losses
(1118884) (1342818) 2001 (69008) (29896) 9433 -11367 -13155
Third Party Fund 40301984 42195900 470 (1203937) 8680695 716548 -15952 -9175
- Current Account 15344593 15627127 184 (5692038) 7517556 (3179879) -4413 -14230
- Saving Account 12379492 13614198 997 1392434 (2176446) 1429005 263 -16566
- Time Deposit 12577899 12954576 299 3095668 3339585 2467422 -2029 -2612
Equity 6210672 7323052 1791 248261 (284738) 398219 6040 -23985
Balance Sheet
IR BJTM 12
InformationIn million Rp
1H16 1H17 YoY 2Q16 1Q17 2Q17 YoY QoQ
Interest Income 2398220 2346884 -214 1237862 1113221 1233663 -034 1082
Interest Expense (706449) (604954) -1437 (384498) (266362) (338592) -1194 2712
Nett Interest Income 1691771 1741930 296 853364 846859 895071 489 569
Non Interest Operational Income
229819 245809 696 123216 108360 137449 1155 2684
Non Interest Operational Expense
(911948) (904037) -087 (487031) (401957) (502080) 309 2491
Provision for Impairment Losses
(236065) (93973) -6019 (155374) (96610) 2638 -10170 -10273
Nett Non Interest Operational Income (Expense)
(918193) (752201) -1808 (519189) (390207) (361994) -3028 -723
Operational Profit 773578 989730 2794 334175 456653 533077 5952 1674
Non Operational Profit 4587 10442 12766 (161) 7596 2846 -186692 -6253
Pre Tax Profit 778164 1000171 2853 334014 464248 535923 6045 1544
Taxes (217065) (261959) 2068 (85752) (124255) (137704) 6058 1082
Net profit 561100 738212 3157 248261 339993 398219 6040 1713
Profit Loss
IR BJTM
R
O
A
R
O
E
N
I
M
407355
394 375
558 497
334382 352
267
380318 309 298
396 401
3848
3085 31482859
40573365
1896 1904 18981611
2349 20872014
17822071 2260
934
728835
766917
795648
714 690 641 683 669 670 694 718 699
L
D
R
C
A
R
B
O
P
O
3875 4211
5404
69678070 8011 8355 8498 8654 8292
6811 7264 71979048
7062 7226
38453339
25362132 1919
1653
26562372 2217 2122 1946 2065 2243 2388 2230 2291
6943 6820 6742 66045958 6002
6869 7028 6963 7611 6532 7056 7115 722262626183
2006 2007 2008 2009 2010 2011 2012 2013 2014 2015 3M16 1H16 9M16 FY16 3M17 1H17
Financial Ratio
13
22210
27416 25987
35479
30270
42681 43754
34263
41506 40302 41165
32799
41479 42196
20000
25000
30000
35000
40000
45000
FY12 1H13 FY13 1H14 FY14 1H15 9M15 FY15 3M16 1H16 9M16 FY16 3M17 1H17
Third Party Fund
IR BJTM
Current Account Junrsquo16 Junrsquo17 YoY Junrsquo16 Junrsquo17 Junrsquo16 Junrsquo17
Government 10411 10660 239 2583 2526 1119484 1122058
Private 4933 4968 069 1224 1177 927 866
Total 15345 15627 184 3807 3703 2877 2721
Saving Account Junrsquo16 Junrsquo17 YoY Junrsquo16 Junrsquo17 Junrsquo16 Junrsquo17
Simpeda 10330 10524 187 2563 2494 58 57
Siklus 752 1561 10759 187 370 60 88
Tab Haji 208 213 277 052 051 18 17
TabunganKu SimPel 980 1177 2011 243 279 04 04
Barokah 110 139 2647 027 033 59 59
Total 12379 13614 997 3072 3226 26 26
Time Deposit Junrsquo16 Junrsquo17 YoY Junrsquo16 Junrsquo17 Junrsquo16 Junrsquo17
Deposit 12578 12955 299 3121 3070 3506 3109
Total 12578 12955 299 3121 3070 3506 3109
Funding Growth Composition
Third Party Fund
Ticket Sizein million
in billion
14
24821 26087 26195 26568
28288 29235
28411 28268 29276 29625 29676 29292
30490
24000
26000
28000
30000
32000
1H14 9M14 FY14 3M15 1H15 9M15 FY15 3M16 1H16 9M16 FY16 3M17 1H17
Loan
IR BJTM
CONSUMER Junrsquo16 Junrsquo17 YoY Junrsquo16 Junrsquo17 Junrsquo16 Junrsquo17
Multi Purpose 16499 17767 769 5636 5827 690 746
Mortgage 1502 1715 1420 513 563 1772 1874Other 887 1133 2772 303 371 1404 2096
Total 18888 20615 914 6452 6761 744 816
COMMERCIAL Junrsquo16 Junrsquo17 YoY Junrsquo16 Junrsquo17 Junrsquo16 Junrsquo17
Standby Loan 656 548 -1636 224 180 2913 4517Keppres 964 625 -3519 329 205 3033 3102
Overdraft 2867 2965 340 979 972 7739 8273Syndicate 1301 1002 -2300 445 329 520557 527398
General 1151 1468 2753 393 481 8880 7043
Total 6940 6608 -478 2370 2167 6637 7411
S M E Junrsquo16 Junrsquo17 YoY Junrsquo16 Junrsquo17 Junrsquo16 Junrsquo17
Pundi 1273 1415 1116 435 464 623 612
Laguna 17 30 7319 006 010 111 199Bankit KKPA 175 396 12559 060 130 417 606
Siumi 14 29 9789 005 009 1253 977
Jatim Mikro 557 602 795 190 197 1356 1050Others 1411 796 -4357 482 261 1347 1489
Total 3449 3267 -526 1178 1072 843 768
Lending Growth Composition
Loan
Ticket Sizein million
in billion
15
IR BJTM 16
LOAN FY14 ndash 1H17
CONSUMER FY14 3M15 1H15 9M15 FY15 3M16 1H16 9M16 FY16 3M17 1H17
Multi Purpose 14849126 15151844 15609337 15793553 15924309 16116984 16498907 16671584 17131199 17177244 17766924
Mortgage 1298747 1339574 1368836 1399421 1434353 1464781 1501875 1528177 1589130 1614312 1715118
Other 612797 600017 650766 792056 827428 845423 886754 916066 1104855 1142783 1132520
Total 16760670 17091435 17628939 17985030 18186090 18427187 18887537 19115827 19825183 19934339 20614562
COMMERCIAL FY14 3M15 1H15 9M15 FY15 3M16 1H16 9M16 FY16 3M17 1H17
Standby Loan 1013324 811732 1023403 1244437 847263 593513 655632 657163 531315 436239 548373
Keppres 687257 449185 977652 1336954 748105 559221 964276 1091251 546405 357492 624976
Overdraft 2307783 2575177 2741317 2691570 2766452 2821776 2867474 2950827 2985503 2935996 2964871
Syndicate 1171171 1218198 1281280 1313528 1335649 1359599 1301393 1318861 1254721 1055945 1002057
General 1004389 1088496 1145543 1243918 1251986 1116825 1316609 1346781 1375272 1391778 1467658
Total 6183924 6142789 7169195 7830406 6949455 6450934 7105384 7364883 6693215 6177449 6607934
S M E FY14 3M15 1H15 9M15 FY15 3M16 1H16 9M16 FY16 3M17 1H17
Pundi 796281 949857 1108092 1156961 1177643 1222691 1273067 1256921 1300929 1346491 1415106
Laguna 30078 26657 30143 24925 21204 18774 17258 15390 35975 38768 29890
Bankit KKPA 73113 86147 103885 131054 130478 128615 175481 208789 272642 338899 395875
Siumi 0 0 0 995 954 2456 14412 23176 26523 24611 28521
Jatim Mikro 263067 344132 451632 490838 519834 530118 557303 561646 562361 578536 601615
Others 2087748 1926924 1796856 1615658 1426340 1487528 1245524 1078463 958593 852479 796364
Total 3250286 3333717 3490608 3420431 3276454 3390182 3283046 3144384 3157023 3179783 3267371
in million
IR BJTM 17
NPL FY14 ndash 1H17
FY14 3M15 1H15 9M15 FY15 3M16 1H16 9M16 FY16 3M17 1H17
NPL Gross 331 387 382 422 429 459 458 492 477 484 480
NPL Net 108 111 147 128 110 119 107 104 065 055 067
Coverage Ratio 7143 7895 7582 8428 8102 8087 8337 8418 9349 9533 9180
CONSUMER 060 066 075 086 074 082 085 089 084 064 069
COMMERCIAL 727 1040 922 1001 1207 1369 1310 1416 1502 1693 1643
S M E 764 824 814 841 709 738 749 729 695 691 717
IR BJTM
MANAGEMENT
18
IR BJTM
Board of Commissioners
Heru SantosoIndependent President
Commissioner
Experience
Bank Indonesia
Last Position
Governor Board
Expert Staff
SoebagyoIndependent
Commissioner
Experience
University Lecturer
Surabaya Mayor Expert Staff
Currently
Lecturer
WibisonoIndependent
Commissioner
Experience
Bank Indonesia
Last Position
Deputy Head
Surabaya Branch
Rudi PurwonoIndependent Commissioner
Experience
Airlangga University Lecturer
BNI Regional Chief Economist
Currently
Airlangga Univ Vice Dean
Payment Board East Java Gov
Regional Research Board Gov
Akhmad SukardiCommissioner
Experience
East Java Government
Currently
East Java
Regional Secretary
19
IR BJTM
Change of Director Structures
20
No Old Structures No New Structures
1 President Director 1 President Director
2 Medium amp Corporate Business Director 2 Medium amp Corporate Director
3 Operational Director 3 Operational Director
4 Agribusiness amp Sharia Business Director 4 Retail Consumer amp Sharia Business Director
5 Compliance Director 5 Compliance amp Human Capital Director
6 Risk Management Director
7 Finance Director
As a result of Bank Jatimrsquos Extraordinary General Meeting June 15th 2017
IR BJTM
Board of Directors
R SoerosoPresident Director
Experience
Corporate Secretary
Bank Jatim
President Director
Bank UMKM
Ferdian Timur S
Finance Director
Experience
Kepanjen Branch
Head
Corporate Secretary
Bank Jatim
Tony SudjiaryantoRetail Consumer amp
Sharia Business
Director
Experience
Credit Division Head
Special Credit Division
Head
Treasury Division Head
Bank Jatim
SuuacutediMedium amp Corporate
Director
Experience
IT Division Head
Planning Division
Head
Risk Management
Division Head
Bank Jatim
Rudie HardionoOperational
Director
Experience
Corporate
Secretary
Compliance
Director
Bank Jatim
21
Hadi Santoso Compliance amp
Human Capital
Director
Experience
Sharia Business Div
MediumampCorporate
Credit Div
Bank Jatim
Rizyana Mirda Risk Management
Director
Experience
Credit Risk Div
MediumampCorporate
Credit Div
Bank Jatim
Effective after pass OJKrsquos Fit and Proper Test
IR BJTM 22
Compliance amp Human Capital Directorbull Compliance amp GCG Divisionbull Law Divisionbull Human Capital Division
bull Competent human resources with sufficient amountbull Fund transaction activity and services which not
contradict with legalbull Determination of procedures inherent to the compliance
violantbull Workers productivity
Risk Management Directorbull Credit Risk Divisionbull Corporate Risk Management
Divisionbull Credit Rescue amp Completion
Division
bull Contribution Marginbull Delinquency rate 30+ days past due (DPD) for the main
products especially individual loan (loan quality)bull Classified Loanbull Recovery Ratebull Recovery Intracomptable dan Extracomptablebull Expansion and average volume of loan balance
Finance Directorbull Treasury Divisionbull Budget amp Financial
Controlling Divisionbull Strategic Planning amp
Management Performance Strategy Division
bull Market cap growth realizationbull Return after tax gainingbull Return on Equity (after tax)bull Finance Director Revenue included Total of Treasury
Revenue dan FI segmentbull Fee Based Income contributionbull Yield Portofolio Treasury
New Director Target
IR BJTM 23
SUBJECT STRATEGY
Optimizing Human Capital tosupport banking business
1 Evaluate human capital position structures
Accelerate staff and management development programs
Evaluating outsourcing and non career employee
Training and education to achieve target
2 Increase employee spiritual mental by religious event
Compliance Cultural Improving employee job desk understanding by socialization
Mitigation and managingcountermeasures of legal risk
1 Organize the implementation of development evaluation and
legal system application such as reviewing mou
2 Organize internal legal system to handle legal issues such as
legal assistance and legal opinion
3 Synergize and integrate managing process and law
implementation strategy to achieve legal issues optimal
resolution
Compliance amp Human Capital Director Current Strategies
IR BJTM 24
SUBJECT STRATEGY
Risk mitigation into activities new products or existing including 8 risks analysis
- Identify measure and evaluate all bank business risk- Giving early warning to right business sector for future lending
with stress testing all portfolio segment and products- Proactive customer visit to understand the condition directly
Minimize credit risk Improving the quality of whole credit portfolio which sustainable by providing correct analysis with credit scoring amp rating analysis
Credit Rescue amp Completion Division
- Lowering NPL1 Monitoring credit expansion2 Comprehensive collection3 Collateral auction4 Conduct bankcruptcy- Increase extracomptable collection by filtering potensial debtor
Risk Management Director Current Strategies
IR BJTM 25
SUBJECT STRATEGY
Bank Placement Interest IncomeICM provides a lower interest rate compared to time deposit
Strategy of optimizing short-term placements in time deposit
Securities interest incomeSecurities with high yield not optimal
Mid-term liquidity securities to be optimized to high yield securities
Treasury Marketing and SalesForeign exchange and bank note transaction still lowNot all branch actively sell foreign exchange and bank note
All branches required for foreign exchange and bank note transactions
Business-leading programs is constrained by the lack of competitive products
Take new pricing and leading products
Finance Director Current Strategies
IR BJTM
STRENGTH
26
IR BJTM 27
142157163174200
249291
331
380
525
429
516
46 55 74
101
131
161 186
223
262 287 297 305
120 132 137 145162
201222
260
303
446
328
422
04040505
090907
08094
118
103
148
0607 07 07 07
0809
08
12
134136
12
17 172 21
27 28 2933
41
4648 47
TOTAL ASSET (Rp Tril)
INTEREST INCOME (Rp Tril) INTEREST EXPENSE (Rp Tril)
CAGR =
857
CAGR =
1197
CAGR =
531
NET PROFIT (Rp Tril)
THIRD PARTY FUND(Rp Tril)
CAGR =
1006
LOAN (Rp Tril)
CAGR =
1699
CAGR =
1136
Compound Annual Growth Rate
2002 2003 2004 2005 2006 2007 2008 2009 2010 2011 2012 2013 2014 2015 2016 1H17
63
0
54
8
55
0
62
9
58
2
52
2
46
3
48
0
43
1
40
7
43
5
38
4
38
5
39
4
34
4
37
03
17
1
23
1
24
0
19
9
21
3
24
1
25
0
28
4
35
9
35
4
36
8
38
4
36
3
37
2
43
8
32
26
19
9
22
1
21
0
17
2
20
5
23
7
28
7
23
7
21
0
23
9
19
7
23
2
25
2
23
4
21
8
30
70
Current account Saving deposit Time deposit
453
300 253 302 318 321261 316 354 348
268 301368 363
256 301 284 278186 230 245
500
275239
310 328 331258
326381 371
267345
395 382
250277 297 288
181235 256
1H12 9M12 FY12 3M13 1H13 9M13 FY13 3M14 1H14 9M14 FY14 3M15 1H15 9M15 FY15 3M16 1H16 9M16 FY16 3M17 1H17
Cost of Fund(+) Local Government (-) Local Government
IR BJTM 28
Strength of Funding
Loan balance 5827 of total loan
NPL 031 as of June 2017
567 593 612 619 631 640 666 675 690 697 732 732 746
1H14 9M14 FY14 3M15 1H15 9M15 FY15 3M16 1H16 9M16 FY16 3M17 1H17
MULTIGUNA TICKET SIZE
13864 14408 14849 15152 15609 15794 15924 16117 16499 16672 17131 17117 17767
1H14 9M14 FY14 3M15 1H15 9M15 FY15 3M16 1H16 9M16 FY16 3M17 1H17
MULTIGUNA LOAN BALANCE
million Rp
billion Rp
IR BJTM 29
Strength of Loan (Multipurpose)
IR BJTM 30
No DATA June 2016 June 2017
1 Board of Commisioner 4 5
2 Board of Sharia Supervisory 3 3
3 Board of Director 5 5
4 Management 1 22 24
5 Management 2 97 98
6 Management 3 280 264
7 Management 4 697 746
8 Staff of Administration 1975 1963
9 Staff Non Administration 332 319
10 Non Permanent 1155 1045
11 Outsource 1920 1974
Total 6490 6446
Human Resources
IR BJTM
31
B Series Investor 1H16 1H17
Foreign Investor 6771 6064
Domestic Investor 3229 3936
No Country Share
1 INDONESIA 393565
2 AMERIKA 280926
3 FINLANDIA 73038
4 IRLANDIA 67525
5 NORWEGIA 49673
6 LUKSEMBURG 38169
7 INGGRIS 21608
8 KANADA 18517
9 JEPANG 12271
10 AUSTRALIA 10972
11 SAUDI ARABIA 08573
12 SWITSERLAND 06143
B Series Investor Composition
Ownership
(A Series)East Java
Government5136
(A Series)City amp
Municipal Government
2848
(B Series)Public
Domestic793
(B Series)Public Foreign
1222
Total 100
No Country Share
13 SINGAPURA 04906
14 BERMUDA 03550
15 THAILAND 03331
16 BELANDA 01807
17 KOREA SELATAN 01645
18 CAYMAN ISLAND 00896
19 HONGKONG 00844
20 SWEDIA 00725
21 JERMAN 00646
22 CINA 00400
23 MALAYSIA 00247
24 FILIPINA 00022
Total 100
IR BJTM32
Dividen amp Stock
Fiscal yearPayment of Dividend Cash Per Share (Rp)
Net ProfitDividen Payment
Ratio
2012 3974 72463931390899 818
2013 4061 82431181537019 7350
2014 4186 93908359225350 665
2015 4300 88570838014200 7242
2016 4364 102821627432600 6343
BJTM Price June 22 2017 IDR 665 share
PBV 136
EPS 9878
PER 673
Market Cap Rp 9939 bn
IR BJTM33
Competitive Products
No 1 BUMD Listed
Annual Report Award
Padmamitra Award Bank Jatim Regional Banks with
excellent service of the year
2016
Top BPD 2016 Active Role as Resi Gudang
Lending
IR BJTM 34
Award
The Higher Bank that Disbursing
FLPP Fund
IR BJTM
Investor Relations (IR)
Corporate Secretary
(031) 5310090 ext 469
Email irubankjatimcoid
IR Contact
35
judul
IR BJTM
Table of Contents
2
Description Page
Agenda Cover
Table of Contents 2
Overview 2017 3 ndash 5
Business Plan 2017 6 ndash 8
Appendix 9 ndash 17
- Macro Economy Review 10
- Balance Sheet Profit amp Loss 11 ndash 12
- Financial Ratio 13
- Third Party Fund amp Loan 14 - 17
- Management 18 - 25
- Strength 26 ndash 34
Contact 35
IR BJTM
OVERVIEW
3
judul
IR BJTM
Balance SheetIn million Rp
1H16 1H17 YoY
Asset 48061027 51560128 728
Loan 29275967 30489868 415
- Commercial 6939580 6607934 -478
- SME 3448849 3267371 -526
- Consumer 18887537 20614562 914
Third Party Fund 40301984 42195900 470
- Current Account 15344593 15627127 184
- Saving Account 12379492 13614198 997
- Time Deposit 12577899 12954576 299
Profit amp LossIn million Rp
1H16 1H17 YoY
Interest Income 2398220 2346884 -214
Interest Expense (706449) (604954) -1437
Net Interest Income 1691771 1741930 296
Provision for Impairment (236065) (93973) -6019
Net profit 561100 738212 3157
Ratio 1H16 1H17 Ratio 1H16 1H17
ROA 318 401 BOPO 7056 6183
ROE 2087 2260 CAR 2065 2291
NIM 669 699 COF 284 245
LDR 7264 7226 CASA 6879 6930
Financial Performance
In million Rp 4
IR BJTM
Collectibility 5
Collectibility 4
Collectibility 3
Collectibility 2
Collectibility 1
Loan Impairment Loan Impairment
1233 978 1356 120162 28 55 30
47 22 52 27
456 49 431 30
27478
41
28596
55
Loan amp Impairment CompositionNPL
Information1H16 1H17
NPL Gross 458 480
NPL Net 107 067
Coverage Ratio
8337 9180
Consumerrsquos NPL
085 069
Commercialrsquos NPL
1310 1643
SMErsquos NPL 749 717
1H16 1H17
In Billion Rp
Non Performing Loan
5
NPLbull Collateral sold in auction 147 billion rupiah and auction registered still up to 100 billion rupiahbull Extracomptable or write-off collection result to 336 billion rupiah
IR BJTM
BUSINESS PLAN 2017
6
IR BJTM
Description 2015 2016 2017 Econsolidated
2017 Econventional
Total Asset 1265 054 512 919
Loan 846 445 863 1175
Third Party Fund 1319 -428 744 1257
Pre Tax Profit -833 1513 1001 1020
Financial Ratio
- CAR 2122 2388 2259
- LDR 8292 9048 9148
- NPL Gross 429 477 310
- NIM 641 694 687
- BOPO 7611 7222 7076
- ROE 1611 1782 2055
- ROA 267 298 329
Business Plan
7
IR BJTM
Network 2011 2012 2013 2014 2015 2016 1H17
NETWORK
PLAN
2017
SHARIA
PLAN
2017
Head Office 1 1 1 1 1 1 1 1
Territorial Office - - - - - - - 4
Branch Office 41 41 41 43 45 47 48 1
Sub Branch Office 67 81 107 153 165 166 166 6 11
Cash office 164 164 176 165 185 190 192 16 2
Sharia service
office47 47 47 97 97 191 191
Payment Point 115 138 155 167 171 181 182 21 7
Mobile cash 61 63 65 68 71 85 87 7
CDM 1 1 1 2 2 2 2
ATM 262 368 479 595 688 703 706 46 18
Total network 759 904 1072 1291 1425 1566 1575
Networks Plan
8
IR BJTM
APPENDIX
9
IR BJTM
- - - - - - -
550525500475475475430
838836
638726
683
335
445
345307302
361437
BI 7-Day RR INFLASI
36644114 4199
3862 3990 4092 4030 4200 4244 4413 4403
3320
3707 3714 4320 4464 4413 4469 4575 46054837 4917
FY13 FY14 3M15 1H15 9M15 FY15 3M16 1H16 9M16 FY16 3M17
in trillion Rp
LOAN FUND
558502471470473479492504502490501
608586
518525544544534555561550537
FY13 FY14 3M15 1H15 9M15 FY15 3M16 1H16 9M16 FY16 3M17
INDONESIA EAST JAVA
Economic Growth Economic Share
Indonesia Java
JAVA
59 Java
22 Sumatra
2 Bali amp Nusa Tenggara
6 Sulawesi
8 Kalimantan
3 Maluku amp Papua
East Java
29 DKI Jakarta
25 East Java
23 West Java
15 Central Java
7 Banten
1 DIY
Source Bank Indonesia
Macro Economy Review
10
IR BJTM 11
InformationIn million Rp
1H16 1H17 YoY 2Q16 1Q17 2Q17 YoY QoQ
Total Asset 48061027 51560128 728 (1084245) 7284038 1243141 -21466 -8293
Placement BI amp SBI 11321922 13658218 2064 (1906658) 7342886 (1220968) -3596 -11663
Loan 29275967 30489868 415 1007664 (383849) 1198296 1892 -41218
Allowance for Impairment Losses
(1118884) (1342818) 2001 (69008) (29896) 9433 -11367 -13155
Third Party Fund 40301984 42195900 470 (1203937) 8680695 716548 -15952 -9175
- Current Account 15344593 15627127 184 (5692038) 7517556 (3179879) -4413 -14230
- Saving Account 12379492 13614198 997 1392434 (2176446) 1429005 263 -16566
- Time Deposit 12577899 12954576 299 3095668 3339585 2467422 -2029 -2612
Equity 6210672 7323052 1791 248261 (284738) 398219 6040 -23985
Balance Sheet
IR BJTM 12
InformationIn million Rp
1H16 1H17 YoY 2Q16 1Q17 2Q17 YoY QoQ
Interest Income 2398220 2346884 -214 1237862 1113221 1233663 -034 1082
Interest Expense (706449) (604954) -1437 (384498) (266362) (338592) -1194 2712
Nett Interest Income 1691771 1741930 296 853364 846859 895071 489 569
Non Interest Operational Income
229819 245809 696 123216 108360 137449 1155 2684
Non Interest Operational Expense
(911948) (904037) -087 (487031) (401957) (502080) 309 2491
Provision for Impairment Losses
(236065) (93973) -6019 (155374) (96610) 2638 -10170 -10273
Nett Non Interest Operational Income (Expense)
(918193) (752201) -1808 (519189) (390207) (361994) -3028 -723
Operational Profit 773578 989730 2794 334175 456653 533077 5952 1674
Non Operational Profit 4587 10442 12766 (161) 7596 2846 -186692 -6253
Pre Tax Profit 778164 1000171 2853 334014 464248 535923 6045 1544
Taxes (217065) (261959) 2068 (85752) (124255) (137704) 6058 1082
Net profit 561100 738212 3157 248261 339993 398219 6040 1713
Profit Loss
IR BJTM
R
O
A
R
O
E
N
I
M
407355
394 375
558 497
334382 352
267
380318 309 298
396 401
3848
3085 31482859
40573365
1896 1904 18981611
2349 20872014
17822071 2260
934
728835
766917
795648
714 690 641 683 669 670 694 718 699
L
D
R
C
A
R
B
O
P
O
3875 4211
5404
69678070 8011 8355 8498 8654 8292
6811 7264 71979048
7062 7226
38453339
25362132 1919
1653
26562372 2217 2122 1946 2065 2243 2388 2230 2291
6943 6820 6742 66045958 6002
6869 7028 6963 7611 6532 7056 7115 722262626183
2006 2007 2008 2009 2010 2011 2012 2013 2014 2015 3M16 1H16 9M16 FY16 3M17 1H17
Financial Ratio
13
22210
27416 25987
35479
30270
42681 43754
34263
41506 40302 41165
32799
41479 42196
20000
25000
30000
35000
40000
45000
FY12 1H13 FY13 1H14 FY14 1H15 9M15 FY15 3M16 1H16 9M16 FY16 3M17 1H17
Third Party Fund
IR BJTM
Current Account Junrsquo16 Junrsquo17 YoY Junrsquo16 Junrsquo17 Junrsquo16 Junrsquo17
Government 10411 10660 239 2583 2526 1119484 1122058
Private 4933 4968 069 1224 1177 927 866
Total 15345 15627 184 3807 3703 2877 2721
Saving Account Junrsquo16 Junrsquo17 YoY Junrsquo16 Junrsquo17 Junrsquo16 Junrsquo17
Simpeda 10330 10524 187 2563 2494 58 57
Siklus 752 1561 10759 187 370 60 88
Tab Haji 208 213 277 052 051 18 17
TabunganKu SimPel 980 1177 2011 243 279 04 04
Barokah 110 139 2647 027 033 59 59
Total 12379 13614 997 3072 3226 26 26
Time Deposit Junrsquo16 Junrsquo17 YoY Junrsquo16 Junrsquo17 Junrsquo16 Junrsquo17
Deposit 12578 12955 299 3121 3070 3506 3109
Total 12578 12955 299 3121 3070 3506 3109
Funding Growth Composition
Third Party Fund
Ticket Sizein million
in billion
14
24821 26087 26195 26568
28288 29235
28411 28268 29276 29625 29676 29292
30490
24000
26000
28000
30000
32000
1H14 9M14 FY14 3M15 1H15 9M15 FY15 3M16 1H16 9M16 FY16 3M17 1H17
Loan
IR BJTM
CONSUMER Junrsquo16 Junrsquo17 YoY Junrsquo16 Junrsquo17 Junrsquo16 Junrsquo17
Multi Purpose 16499 17767 769 5636 5827 690 746
Mortgage 1502 1715 1420 513 563 1772 1874Other 887 1133 2772 303 371 1404 2096
Total 18888 20615 914 6452 6761 744 816
COMMERCIAL Junrsquo16 Junrsquo17 YoY Junrsquo16 Junrsquo17 Junrsquo16 Junrsquo17
Standby Loan 656 548 -1636 224 180 2913 4517Keppres 964 625 -3519 329 205 3033 3102
Overdraft 2867 2965 340 979 972 7739 8273Syndicate 1301 1002 -2300 445 329 520557 527398
General 1151 1468 2753 393 481 8880 7043
Total 6940 6608 -478 2370 2167 6637 7411
S M E Junrsquo16 Junrsquo17 YoY Junrsquo16 Junrsquo17 Junrsquo16 Junrsquo17
Pundi 1273 1415 1116 435 464 623 612
Laguna 17 30 7319 006 010 111 199Bankit KKPA 175 396 12559 060 130 417 606
Siumi 14 29 9789 005 009 1253 977
Jatim Mikro 557 602 795 190 197 1356 1050Others 1411 796 -4357 482 261 1347 1489
Total 3449 3267 -526 1178 1072 843 768
Lending Growth Composition
Loan
Ticket Sizein million
in billion
15
IR BJTM 16
LOAN FY14 ndash 1H17
CONSUMER FY14 3M15 1H15 9M15 FY15 3M16 1H16 9M16 FY16 3M17 1H17
Multi Purpose 14849126 15151844 15609337 15793553 15924309 16116984 16498907 16671584 17131199 17177244 17766924
Mortgage 1298747 1339574 1368836 1399421 1434353 1464781 1501875 1528177 1589130 1614312 1715118
Other 612797 600017 650766 792056 827428 845423 886754 916066 1104855 1142783 1132520
Total 16760670 17091435 17628939 17985030 18186090 18427187 18887537 19115827 19825183 19934339 20614562
COMMERCIAL FY14 3M15 1H15 9M15 FY15 3M16 1H16 9M16 FY16 3M17 1H17
Standby Loan 1013324 811732 1023403 1244437 847263 593513 655632 657163 531315 436239 548373
Keppres 687257 449185 977652 1336954 748105 559221 964276 1091251 546405 357492 624976
Overdraft 2307783 2575177 2741317 2691570 2766452 2821776 2867474 2950827 2985503 2935996 2964871
Syndicate 1171171 1218198 1281280 1313528 1335649 1359599 1301393 1318861 1254721 1055945 1002057
General 1004389 1088496 1145543 1243918 1251986 1116825 1316609 1346781 1375272 1391778 1467658
Total 6183924 6142789 7169195 7830406 6949455 6450934 7105384 7364883 6693215 6177449 6607934
S M E FY14 3M15 1H15 9M15 FY15 3M16 1H16 9M16 FY16 3M17 1H17
Pundi 796281 949857 1108092 1156961 1177643 1222691 1273067 1256921 1300929 1346491 1415106
Laguna 30078 26657 30143 24925 21204 18774 17258 15390 35975 38768 29890
Bankit KKPA 73113 86147 103885 131054 130478 128615 175481 208789 272642 338899 395875
Siumi 0 0 0 995 954 2456 14412 23176 26523 24611 28521
Jatim Mikro 263067 344132 451632 490838 519834 530118 557303 561646 562361 578536 601615
Others 2087748 1926924 1796856 1615658 1426340 1487528 1245524 1078463 958593 852479 796364
Total 3250286 3333717 3490608 3420431 3276454 3390182 3283046 3144384 3157023 3179783 3267371
in million
IR BJTM 17
NPL FY14 ndash 1H17
FY14 3M15 1H15 9M15 FY15 3M16 1H16 9M16 FY16 3M17 1H17
NPL Gross 331 387 382 422 429 459 458 492 477 484 480
NPL Net 108 111 147 128 110 119 107 104 065 055 067
Coverage Ratio 7143 7895 7582 8428 8102 8087 8337 8418 9349 9533 9180
CONSUMER 060 066 075 086 074 082 085 089 084 064 069
COMMERCIAL 727 1040 922 1001 1207 1369 1310 1416 1502 1693 1643
S M E 764 824 814 841 709 738 749 729 695 691 717
IR BJTM
MANAGEMENT
18
IR BJTM
Board of Commissioners
Heru SantosoIndependent President
Commissioner
Experience
Bank Indonesia
Last Position
Governor Board
Expert Staff
SoebagyoIndependent
Commissioner
Experience
University Lecturer
Surabaya Mayor Expert Staff
Currently
Lecturer
WibisonoIndependent
Commissioner
Experience
Bank Indonesia
Last Position
Deputy Head
Surabaya Branch
Rudi PurwonoIndependent Commissioner
Experience
Airlangga University Lecturer
BNI Regional Chief Economist
Currently
Airlangga Univ Vice Dean
Payment Board East Java Gov
Regional Research Board Gov
Akhmad SukardiCommissioner
Experience
East Java Government
Currently
East Java
Regional Secretary
19
IR BJTM
Change of Director Structures
20
No Old Structures No New Structures
1 President Director 1 President Director
2 Medium amp Corporate Business Director 2 Medium amp Corporate Director
3 Operational Director 3 Operational Director
4 Agribusiness amp Sharia Business Director 4 Retail Consumer amp Sharia Business Director
5 Compliance Director 5 Compliance amp Human Capital Director
6 Risk Management Director
7 Finance Director
As a result of Bank Jatimrsquos Extraordinary General Meeting June 15th 2017
IR BJTM
Board of Directors
R SoerosoPresident Director
Experience
Corporate Secretary
Bank Jatim
President Director
Bank UMKM
Ferdian Timur S
Finance Director
Experience
Kepanjen Branch
Head
Corporate Secretary
Bank Jatim
Tony SudjiaryantoRetail Consumer amp
Sharia Business
Director
Experience
Credit Division Head
Special Credit Division
Head
Treasury Division Head
Bank Jatim
SuuacutediMedium amp Corporate
Director
Experience
IT Division Head
Planning Division
Head
Risk Management
Division Head
Bank Jatim
Rudie HardionoOperational
Director
Experience
Corporate
Secretary
Compliance
Director
Bank Jatim
21
Hadi Santoso Compliance amp
Human Capital
Director
Experience
Sharia Business Div
MediumampCorporate
Credit Div
Bank Jatim
Rizyana Mirda Risk Management
Director
Experience
Credit Risk Div
MediumampCorporate
Credit Div
Bank Jatim
Effective after pass OJKrsquos Fit and Proper Test
IR BJTM 22
Compliance amp Human Capital Directorbull Compliance amp GCG Divisionbull Law Divisionbull Human Capital Division
bull Competent human resources with sufficient amountbull Fund transaction activity and services which not
contradict with legalbull Determination of procedures inherent to the compliance
violantbull Workers productivity
Risk Management Directorbull Credit Risk Divisionbull Corporate Risk Management
Divisionbull Credit Rescue amp Completion
Division
bull Contribution Marginbull Delinquency rate 30+ days past due (DPD) for the main
products especially individual loan (loan quality)bull Classified Loanbull Recovery Ratebull Recovery Intracomptable dan Extracomptablebull Expansion and average volume of loan balance
Finance Directorbull Treasury Divisionbull Budget amp Financial
Controlling Divisionbull Strategic Planning amp
Management Performance Strategy Division
bull Market cap growth realizationbull Return after tax gainingbull Return on Equity (after tax)bull Finance Director Revenue included Total of Treasury
Revenue dan FI segmentbull Fee Based Income contributionbull Yield Portofolio Treasury
New Director Target
IR BJTM 23
SUBJECT STRATEGY
Optimizing Human Capital tosupport banking business
1 Evaluate human capital position structures
Accelerate staff and management development programs
Evaluating outsourcing and non career employee
Training and education to achieve target
2 Increase employee spiritual mental by religious event
Compliance Cultural Improving employee job desk understanding by socialization
Mitigation and managingcountermeasures of legal risk
1 Organize the implementation of development evaluation and
legal system application such as reviewing mou
2 Organize internal legal system to handle legal issues such as
legal assistance and legal opinion
3 Synergize and integrate managing process and law
implementation strategy to achieve legal issues optimal
resolution
Compliance amp Human Capital Director Current Strategies
IR BJTM 24
SUBJECT STRATEGY
Risk mitigation into activities new products or existing including 8 risks analysis
- Identify measure and evaluate all bank business risk- Giving early warning to right business sector for future lending
with stress testing all portfolio segment and products- Proactive customer visit to understand the condition directly
Minimize credit risk Improving the quality of whole credit portfolio which sustainable by providing correct analysis with credit scoring amp rating analysis
Credit Rescue amp Completion Division
- Lowering NPL1 Monitoring credit expansion2 Comprehensive collection3 Collateral auction4 Conduct bankcruptcy- Increase extracomptable collection by filtering potensial debtor
Risk Management Director Current Strategies
IR BJTM 25
SUBJECT STRATEGY
Bank Placement Interest IncomeICM provides a lower interest rate compared to time deposit
Strategy of optimizing short-term placements in time deposit
Securities interest incomeSecurities with high yield not optimal
Mid-term liquidity securities to be optimized to high yield securities
Treasury Marketing and SalesForeign exchange and bank note transaction still lowNot all branch actively sell foreign exchange and bank note
All branches required for foreign exchange and bank note transactions
Business-leading programs is constrained by the lack of competitive products
Take new pricing and leading products
Finance Director Current Strategies
IR BJTM
STRENGTH
26
IR BJTM 27
142157163174200
249291
331
380
525
429
516
46 55 74
101
131
161 186
223
262 287 297 305
120 132 137 145162
201222
260
303
446
328
422
04040505
090907
08094
118
103
148
0607 07 07 07
0809
08
12
134136
12
17 172 21
27 28 2933
41
4648 47
TOTAL ASSET (Rp Tril)
INTEREST INCOME (Rp Tril) INTEREST EXPENSE (Rp Tril)
CAGR =
857
CAGR =
1197
CAGR =
531
NET PROFIT (Rp Tril)
THIRD PARTY FUND(Rp Tril)
CAGR =
1006
LOAN (Rp Tril)
CAGR =
1699
CAGR =
1136
Compound Annual Growth Rate
2002 2003 2004 2005 2006 2007 2008 2009 2010 2011 2012 2013 2014 2015 2016 1H17
63
0
54
8
55
0
62
9
58
2
52
2
46
3
48
0
43
1
40
7
43
5
38
4
38
5
39
4
34
4
37
03
17
1
23
1
24
0
19
9
21
3
24
1
25
0
28
4
35
9
35
4
36
8
38
4
36
3
37
2
43
8
32
26
19
9
22
1
21
0
17
2
20
5
23
7
28
7
23
7
21
0
23
9
19
7
23
2
25
2
23
4
21
8
30
70
Current account Saving deposit Time deposit
453
300 253 302 318 321261 316 354 348
268 301368 363
256 301 284 278186 230 245
500
275239
310 328 331258
326381 371
267345
395 382
250277 297 288
181235 256
1H12 9M12 FY12 3M13 1H13 9M13 FY13 3M14 1H14 9M14 FY14 3M15 1H15 9M15 FY15 3M16 1H16 9M16 FY16 3M17 1H17
Cost of Fund(+) Local Government (-) Local Government
IR BJTM 28
Strength of Funding
Loan balance 5827 of total loan
NPL 031 as of June 2017
567 593 612 619 631 640 666 675 690 697 732 732 746
1H14 9M14 FY14 3M15 1H15 9M15 FY15 3M16 1H16 9M16 FY16 3M17 1H17
MULTIGUNA TICKET SIZE
13864 14408 14849 15152 15609 15794 15924 16117 16499 16672 17131 17117 17767
1H14 9M14 FY14 3M15 1H15 9M15 FY15 3M16 1H16 9M16 FY16 3M17 1H17
MULTIGUNA LOAN BALANCE
million Rp
billion Rp
IR BJTM 29
Strength of Loan (Multipurpose)
IR BJTM 30
No DATA June 2016 June 2017
1 Board of Commisioner 4 5
2 Board of Sharia Supervisory 3 3
3 Board of Director 5 5
4 Management 1 22 24
5 Management 2 97 98
6 Management 3 280 264
7 Management 4 697 746
8 Staff of Administration 1975 1963
9 Staff Non Administration 332 319
10 Non Permanent 1155 1045
11 Outsource 1920 1974
Total 6490 6446
Human Resources
IR BJTM
31
B Series Investor 1H16 1H17
Foreign Investor 6771 6064
Domestic Investor 3229 3936
No Country Share
1 INDONESIA 393565
2 AMERIKA 280926
3 FINLANDIA 73038
4 IRLANDIA 67525
5 NORWEGIA 49673
6 LUKSEMBURG 38169
7 INGGRIS 21608
8 KANADA 18517
9 JEPANG 12271
10 AUSTRALIA 10972
11 SAUDI ARABIA 08573
12 SWITSERLAND 06143
B Series Investor Composition
Ownership
(A Series)East Java
Government5136
(A Series)City amp
Municipal Government
2848
(B Series)Public
Domestic793
(B Series)Public Foreign
1222
Total 100
No Country Share
13 SINGAPURA 04906
14 BERMUDA 03550
15 THAILAND 03331
16 BELANDA 01807
17 KOREA SELATAN 01645
18 CAYMAN ISLAND 00896
19 HONGKONG 00844
20 SWEDIA 00725
21 JERMAN 00646
22 CINA 00400
23 MALAYSIA 00247
24 FILIPINA 00022
Total 100
IR BJTM32
Dividen amp Stock
Fiscal yearPayment of Dividend Cash Per Share (Rp)
Net ProfitDividen Payment
Ratio
2012 3974 72463931390899 818
2013 4061 82431181537019 7350
2014 4186 93908359225350 665
2015 4300 88570838014200 7242
2016 4364 102821627432600 6343
BJTM Price June 22 2017 IDR 665 share
PBV 136
EPS 9878
PER 673
Market Cap Rp 9939 bn
IR BJTM33
Competitive Products
No 1 BUMD Listed
Annual Report Award
Padmamitra Award Bank Jatim Regional Banks with
excellent service of the year
2016
Top BPD 2016 Active Role as Resi Gudang
Lending
IR BJTM 34
Award
The Higher Bank that Disbursing
FLPP Fund
IR BJTM
Investor Relations (IR)
Corporate Secretary
(031) 5310090 ext 469
Email irubankjatimcoid
IR Contact
35

IR BJTM
OVERVIEW
3
judul
IR BJTM
Balance SheetIn million Rp
1H16 1H17 YoY
Asset 48061027 51560128 728
Loan 29275967 30489868 415
- Commercial 6939580 6607934 -478
- SME 3448849 3267371 -526
- Consumer 18887537 20614562 914
Third Party Fund 40301984 42195900 470
- Current Account 15344593 15627127 184
- Saving Account 12379492 13614198 997
- Time Deposit 12577899 12954576 299
Profit amp LossIn million Rp
1H16 1H17 YoY
Interest Income 2398220 2346884 -214
Interest Expense (706449) (604954) -1437
Net Interest Income 1691771 1741930 296
Provision for Impairment (236065) (93973) -6019
Net profit 561100 738212 3157
Ratio 1H16 1H17 Ratio 1H16 1H17
ROA 318 401 BOPO 7056 6183
ROE 2087 2260 CAR 2065 2291
NIM 669 699 COF 284 245
LDR 7264 7226 CASA 6879 6930
Financial Performance
In million Rp 4
IR BJTM
Collectibility 5
Collectibility 4
Collectibility 3
Collectibility 2
Collectibility 1
Loan Impairment Loan Impairment
1233 978 1356 120162 28 55 30
47 22 52 27
456 49 431 30
27478
41
28596
55
Loan amp Impairment CompositionNPL
Information1H16 1H17
NPL Gross 458 480
NPL Net 107 067
Coverage Ratio
8337 9180
Consumerrsquos NPL
085 069
Commercialrsquos NPL
1310 1643
SMErsquos NPL 749 717
1H16 1H17
In Billion Rp
Non Performing Loan
5
NPLbull Collateral sold in auction 147 billion rupiah and auction registered still up to 100 billion rupiahbull Extracomptable or write-off collection result to 336 billion rupiah
IR BJTM
BUSINESS PLAN 2017
6
IR BJTM
Description 2015 2016 2017 Econsolidated
2017 Econventional
Total Asset 1265 054 512 919
Loan 846 445 863 1175
Third Party Fund 1319 -428 744 1257
Pre Tax Profit -833 1513 1001 1020
Financial Ratio
- CAR 2122 2388 2259
- LDR 8292 9048 9148
- NPL Gross 429 477 310
- NIM 641 694 687
- BOPO 7611 7222 7076
- ROE 1611 1782 2055
- ROA 267 298 329
Business Plan
7
IR BJTM
Network 2011 2012 2013 2014 2015 2016 1H17
NETWORK
PLAN
2017
SHARIA
PLAN
2017
Head Office 1 1 1 1 1 1 1 1
Territorial Office - - - - - - - 4
Branch Office 41 41 41 43 45 47 48 1
Sub Branch Office 67 81 107 153 165 166 166 6 11
Cash office 164 164 176 165 185 190 192 16 2
Sharia service
office47 47 47 97 97 191 191
Payment Point 115 138 155 167 171 181 182 21 7
Mobile cash 61 63 65 68 71 85 87 7
CDM 1 1 1 2 2 2 2
ATM 262 368 479 595 688 703 706 46 18
Total network 759 904 1072 1291 1425 1566 1575
Networks Plan
8
IR BJTM
APPENDIX
9
IR BJTM
- - - - - - -
550525500475475475430
838836
638726
683
335
445
345307302
361437
BI 7-Day RR INFLASI
36644114 4199
3862 3990 4092 4030 4200 4244 4413 4403
3320
3707 3714 4320 4464 4413 4469 4575 46054837 4917
FY13 FY14 3M15 1H15 9M15 FY15 3M16 1H16 9M16 FY16 3M17
in trillion Rp
LOAN FUND
558502471470473479492504502490501
608586
518525544544534555561550537
FY13 FY14 3M15 1H15 9M15 FY15 3M16 1H16 9M16 FY16 3M17
INDONESIA EAST JAVA
Economic Growth Economic Share
Indonesia Java
JAVA
59 Java
22 Sumatra
2 Bali amp Nusa Tenggara
6 Sulawesi
8 Kalimantan
3 Maluku amp Papua
East Java
29 DKI Jakarta
25 East Java
23 West Java
15 Central Java
7 Banten
1 DIY
Source Bank Indonesia
Macro Economy Review
10
IR BJTM 11
InformationIn million Rp
1H16 1H17 YoY 2Q16 1Q17 2Q17 YoY QoQ
Total Asset 48061027 51560128 728 (1084245) 7284038 1243141 -21466 -8293
Placement BI amp SBI 11321922 13658218 2064 (1906658) 7342886 (1220968) -3596 -11663
Loan 29275967 30489868 415 1007664 (383849) 1198296 1892 -41218
Allowance for Impairment Losses
(1118884) (1342818) 2001 (69008) (29896) 9433 -11367 -13155
Third Party Fund 40301984 42195900 470 (1203937) 8680695 716548 -15952 -9175
- Current Account 15344593 15627127 184 (5692038) 7517556 (3179879) -4413 -14230
- Saving Account 12379492 13614198 997 1392434 (2176446) 1429005 263 -16566
- Time Deposit 12577899 12954576 299 3095668 3339585 2467422 -2029 -2612
Equity 6210672 7323052 1791 248261 (284738) 398219 6040 -23985
Balance Sheet
IR BJTM 12
InformationIn million Rp
1H16 1H17 YoY 2Q16 1Q17 2Q17 YoY QoQ
Interest Income 2398220 2346884 -214 1237862 1113221 1233663 -034 1082
Interest Expense (706449) (604954) -1437 (384498) (266362) (338592) -1194 2712
Nett Interest Income 1691771 1741930 296 853364 846859 895071 489 569
Non Interest Operational Income
229819 245809 696 123216 108360 137449 1155 2684
Non Interest Operational Expense
(911948) (904037) -087 (487031) (401957) (502080) 309 2491
Provision for Impairment Losses
(236065) (93973) -6019 (155374) (96610) 2638 -10170 -10273
Nett Non Interest Operational Income (Expense)
(918193) (752201) -1808 (519189) (390207) (361994) -3028 -723
Operational Profit 773578 989730 2794 334175 456653 533077 5952 1674
Non Operational Profit 4587 10442 12766 (161) 7596 2846 -186692 -6253
Pre Tax Profit 778164 1000171 2853 334014 464248 535923 6045 1544
Taxes (217065) (261959) 2068 (85752) (124255) (137704) 6058 1082
Net profit 561100 738212 3157 248261 339993 398219 6040 1713
Profit Loss
IR BJTM
R
O
A
R
O
E
N
I
M
407355
394 375
558 497
334382 352
267
380318 309 298
396 401
3848
3085 31482859
40573365
1896 1904 18981611
2349 20872014
17822071 2260
934
728835
766917
795648
714 690 641 683 669 670 694 718 699
L
D
R
C
A
R
B
O
P
O
3875 4211
5404
69678070 8011 8355 8498 8654 8292
6811 7264 71979048
7062 7226
38453339
25362132 1919
1653
26562372 2217 2122 1946 2065 2243 2388 2230 2291
6943 6820 6742 66045958 6002
6869 7028 6963 7611 6532 7056 7115 722262626183
2006 2007 2008 2009 2010 2011 2012 2013 2014 2015 3M16 1H16 9M16 FY16 3M17 1H17
Financial Ratio
13
22210
27416 25987
35479
30270
42681 43754
34263
41506 40302 41165
32799
41479 42196
20000
25000
30000
35000
40000
45000
FY12 1H13 FY13 1H14 FY14 1H15 9M15 FY15 3M16 1H16 9M16 FY16 3M17 1H17
Third Party Fund
IR BJTM
Current Account Junrsquo16 Junrsquo17 YoY Junrsquo16 Junrsquo17 Junrsquo16 Junrsquo17
Government 10411 10660 239 2583 2526 1119484 1122058
Private 4933 4968 069 1224 1177 927 866
Total 15345 15627 184 3807 3703 2877 2721
Saving Account Junrsquo16 Junrsquo17 YoY Junrsquo16 Junrsquo17 Junrsquo16 Junrsquo17
Simpeda 10330 10524 187 2563 2494 58 57
Siklus 752 1561 10759 187 370 60 88
Tab Haji 208 213 277 052 051 18 17
TabunganKu SimPel 980 1177 2011 243 279 04 04
Barokah 110 139 2647 027 033 59 59
Total 12379 13614 997 3072 3226 26 26
Time Deposit Junrsquo16 Junrsquo17 YoY Junrsquo16 Junrsquo17 Junrsquo16 Junrsquo17
Deposit 12578 12955 299 3121 3070 3506 3109
Total 12578 12955 299 3121 3070 3506 3109
Funding Growth Composition
Third Party Fund
Ticket Sizein million
in billion
14
24821 26087 26195 26568
28288 29235
28411 28268 29276 29625 29676 29292
30490
24000
26000
28000
30000
32000
1H14 9M14 FY14 3M15 1H15 9M15 FY15 3M16 1H16 9M16 FY16 3M17 1H17
Loan
IR BJTM
CONSUMER Junrsquo16 Junrsquo17 YoY Junrsquo16 Junrsquo17 Junrsquo16 Junrsquo17
Multi Purpose 16499 17767 769 5636 5827 690 746
Mortgage 1502 1715 1420 513 563 1772 1874Other 887 1133 2772 303 371 1404 2096
Total 18888 20615 914 6452 6761 744 816
COMMERCIAL Junrsquo16 Junrsquo17 YoY Junrsquo16 Junrsquo17 Junrsquo16 Junrsquo17
Standby Loan 656 548 -1636 224 180 2913 4517Keppres 964 625 -3519 329 205 3033 3102
Overdraft 2867 2965 340 979 972 7739 8273Syndicate 1301 1002 -2300 445 329 520557 527398
General 1151 1468 2753 393 481 8880 7043
Total 6940 6608 -478 2370 2167 6637 7411
S M E Junrsquo16 Junrsquo17 YoY Junrsquo16 Junrsquo17 Junrsquo16 Junrsquo17
Pundi 1273 1415 1116 435 464 623 612
Laguna 17 30 7319 006 010 111 199Bankit KKPA 175 396 12559 060 130 417 606
Siumi 14 29 9789 005 009 1253 977
Jatim Mikro 557 602 795 190 197 1356 1050Others 1411 796 -4357 482 261 1347 1489
Total 3449 3267 -526 1178 1072 843 768
Lending Growth Composition
Loan
Ticket Sizein million
in billion
15
IR BJTM 16
LOAN FY14 ndash 1H17
CONSUMER FY14 3M15 1H15 9M15 FY15 3M16 1H16 9M16 FY16 3M17 1H17
Multi Purpose 14849126 15151844 15609337 15793553 15924309 16116984 16498907 16671584 17131199 17177244 17766924
Mortgage 1298747 1339574 1368836 1399421 1434353 1464781 1501875 1528177 1589130 1614312 1715118
Other 612797 600017 650766 792056 827428 845423 886754 916066 1104855 1142783 1132520
Total 16760670 17091435 17628939 17985030 18186090 18427187 18887537 19115827 19825183 19934339 20614562
COMMERCIAL FY14 3M15 1H15 9M15 FY15 3M16 1H16 9M16 FY16 3M17 1H17
Standby Loan 1013324 811732 1023403 1244437 847263 593513 655632 657163 531315 436239 548373
Keppres 687257 449185 977652 1336954 748105 559221 964276 1091251 546405 357492 624976
Overdraft 2307783 2575177 2741317 2691570 2766452 2821776 2867474 2950827 2985503 2935996 2964871
Syndicate 1171171 1218198 1281280 1313528 1335649 1359599 1301393 1318861 1254721 1055945 1002057
General 1004389 1088496 1145543 1243918 1251986 1116825 1316609 1346781 1375272 1391778 1467658
Total 6183924 6142789 7169195 7830406 6949455 6450934 7105384 7364883 6693215 6177449 6607934
S M E FY14 3M15 1H15 9M15 FY15 3M16 1H16 9M16 FY16 3M17 1H17
Pundi 796281 949857 1108092 1156961 1177643 1222691 1273067 1256921 1300929 1346491 1415106
Laguna 30078 26657 30143 24925 21204 18774 17258 15390 35975 38768 29890
Bankit KKPA 73113 86147 103885 131054 130478 128615 175481 208789 272642 338899 395875
Siumi 0 0 0 995 954 2456 14412 23176 26523 24611 28521
Jatim Mikro 263067 344132 451632 490838 519834 530118 557303 561646 562361 578536 601615
Others 2087748 1926924 1796856 1615658 1426340 1487528 1245524 1078463 958593 852479 796364
Total 3250286 3333717 3490608 3420431 3276454 3390182 3283046 3144384 3157023 3179783 3267371
in million
IR BJTM 17
NPL FY14 ndash 1H17
FY14 3M15 1H15 9M15 FY15 3M16 1H16 9M16 FY16 3M17 1H17
NPL Gross 331 387 382 422 429 459 458 492 477 484 480
NPL Net 108 111 147 128 110 119 107 104 065 055 067
Coverage Ratio 7143 7895 7582 8428 8102 8087 8337 8418 9349 9533 9180
CONSUMER 060 066 075 086 074 082 085 089 084 064 069
COMMERCIAL 727 1040 922 1001 1207 1369 1310 1416 1502 1693 1643
S M E 764 824 814 841 709 738 749 729 695 691 717
IR BJTM
MANAGEMENT
18
IR BJTM
Board of Commissioners
Heru SantosoIndependent President
Commissioner
Experience
Bank Indonesia
Last Position
Governor Board
Expert Staff
SoebagyoIndependent
Commissioner
Experience
University Lecturer
Surabaya Mayor Expert Staff
Currently
Lecturer
WibisonoIndependent
Commissioner
Experience
Bank Indonesia
Last Position
Deputy Head
Surabaya Branch
Rudi PurwonoIndependent Commissioner
Experience
Airlangga University Lecturer
BNI Regional Chief Economist
Currently
Airlangga Univ Vice Dean
Payment Board East Java Gov
Regional Research Board Gov
Akhmad SukardiCommissioner
Experience
East Java Government
Currently
East Java
Regional Secretary
19
IR BJTM
Change of Director Structures
20
No Old Structures No New Structures
1 President Director 1 President Director
2 Medium amp Corporate Business Director 2 Medium amp Corporate Director
3 Operational Director 3 Operational Director
4 Agribusiness amp Sharia Business Director 4 Retail Consumer amp Sharia Business Director
5 Compliance Director 5 Compliance amp Human Capital Director
6 Risk Management Director
7 Finance Director
As a result of Bank Jatimrsquos Extraordinary General Meeting June 15th 2017
IR BJTM
Board of Directors
R SoerosoPresident Director
Experience
Corporate Secretary
Bank Jatim
President Director
Bank UMKM
Ferdian Timur S
Finance Director
Experience
Kepanjen Branch
Head
Corporate Secretary
Bank Jatim
Tony SudjiaryantoRetail Consumer amp
Sharia Business
Director
Experience
Credit Division Head
Special Credit Division
Head
Treasury Division Head
Bank Jatim
SuuacutediMedium amp Corporate
Director
Experience
IT Division Head
Planning Division
Head
Risk Management
Division Head
Bank Jatim
Rudie HardionoOperational
Director
Experience
Corporate
Secretary
Compliance
Director
Bank Jatim
21
Hadi Santoso Compliance amp
Human Capital
Director
Experience
Sharia Business Div
MediumampCorporate
Credit Div
Bank Jatim
Rizyana Mirda Risk Management
Director
Experience
Credit Risk Div
MediumampCorporate
Credit Div
Bank Jatim
Effective after pass OJKrsquos Fit and Proper Test
IR BJTM 22
Compliance amp Human Capital Directorbull Compliance amp GCG Divisionbull Law Divisionbull Human Capital Division
bull Competent human resources with sufficient amountbull Fund transaction activity and services which not
contradict with legalbull Determination of procedures inherent to the compliance
violantbull Workers productivity
Risk Management Directorbull Credit Risk Divisionbull Corporate Risk Management
Divisionbull Credit Rescue amp Completion
Division
bull Contribution Marginbull Delinquency rate 30+ days past due (DPD) for the main
products especially individual loan (loan quality)bull Classified Loanbull Recovery Ratebull Recovery Intracomptable dan Extracomptablebull Expansion and average volume of loan balance
Finance Directorbull Treasury Divisionbull Budget amp Financial
Controlling Divisionbull Strategic Planning amp
Management Performance Strategy Division
bull Market cap growth realizationbull Return after tax gainingbull Return on Equity (after tax)bull Finance Director Revenue included Total of Treasury
Revenue dan FI segmentbull Fee Based Income contributionbull Yield Portofolio Treasury
New Director Target
IR BJTM 23
SUBJECT STRATEGY
Optimizing Human Capital tosupport banking business
1 Evaluate human capital position structures
Accelerate staff and management development programs
Evaluating outsourcing and non career employee
Training and education to achieve target
2 Increase employee spiritual mental by religious event
Compliance Cultural Improving employee job desk understanding by socialization
Mitigation and managingcountermeasures of legal risk
1 Organize the implementation of development evaluation and
legal system application such as reviewing mou
2 Organize internal legal system to handle legal issues such as
legal assistance and legal opinion
3 Synergize and integrate managing process and law
implementation strategy to achieve legal issues optimal
resolution
Compliance amp Human Capital Director Current Strategies
IR BJTM 24
SUBJECT STRATEGY
Risk mitigation into activities new products or existing including 8 risks analysis
- Identify measure and evaluate all bank business risk- Giving early warning to right business sector for future lending
with stress testing all portfolio segment and products- Proactive customer visit to understand the condition directly
Minimize credit risk Improving the quality of whole credit portfolio which sustainable by providing correct analysis with credit scoring amp rating analysis
Credit Rescue amp Completion Division
- Lowering NPL1 Monitoring credit expansion2 Comprehensive collection3 Collateral auction4 Conduct bankcruptcy- Increase extracomptable collection by filtering potensial debtor
Risk Management Director Current Strategies
IR BJTM 25
SUBJECT STRATEGY
Bank Placement Interest IncomeICM provides a lower interest rate compared to time deposit
Strategy of optimizing short-term placements in time deposit
Securities interest incomeSecurities with high yield not optimal
Mid-term liquidity securities to be optimized to high yield securities
Treasury Marketing and SalesForeign exchange and bank note transaction still lowNot all branch actively sell foreign exchange and bank note
All branches required for foreign exchange and bank note transactions
Business-leading programs is constrained by the lack of competitive products
Take new pricing and leading products
Finance Director Current Strategies
IR BJTM
STRENGTH
26
IR BJTM 27
142157163174200
249291
331
380
525
429
516
46 55 74
101
131
161 186
223
262 287 297 305
120 132 137 145162
201222
260
303
446
328
422
04040505
090907
08094
118
103
148
0607 07 07 07
0809
08
12
134136
12
17 172 21
27 28 2933
41
4648 47
TOTAL ASSET (Rp Tril)
INTEREST INCOME (Rp Tril) INTEREST EXPENSE (Rp Tril)
CAGR =
857
CAGR =
1197
CAGR =
531
NET PROFIT (Rp Tril)
THIRD PARTY FUND(Rp Tril)
CAGR =
1006
LOAN (Rp Tril)
CAGR =
1699
CAGR =
1136
Compound Annual Growth Rate
2002 2003 2004 2005 2006 2007 2008 2009 2010 2011 2012 2013 2014 2015 2016 1H17
63
0
54
8
55
0
62
9
58
2
52
2
46
3
48
0
43
1
40
7
43
5
38
4
38
5
39
4
34
4
37
03
17
1
23
1
24
0
19
9
21
3
24
1
25
0
28
4
35
9
35
4
36
8
38
4
36
3
37
2
43
8
32
26
19
9
22
1
21
0
17
2
20
5
23
7
28
7
23
7
21
0
23
9
19
7
23
2
25
2
23
4
21
8
30
70
Current account Saving deposit Time deposit
453
300 253 302 318 321261 316 354 348
268 301368 363
256 301 284 278186 230 245
500
275239
310 328 331258
326381 371
267345
395 382
250277 297 288
181235 256
1H12 9M12 FY12 3M13 1H13 9M13 FY13 3M14 1H14 9M14 FY14 3M15 1H15 9M15 FY15 3M16 1H16 9M16 FY16 3M17 1H17
Cost of Fund(+) Local Government (-) Local Government
IR BJTM 28
Strength of Funding
Loan balance 5827 of total loan
NPL 031 as of June 2017
567 593 612 619 631 640 666 675 690 697 732 732 746
1H14 9M14 FY14 3M15 1H15 9M15 FY15 3M16 1H16 9M16 FY16 3M17 1H17
MULTIGUNA TICKET SIZE
13864 14408 14849 15152 15609 15794 15924 16117 16499 16672 17131 17117 17767
1H14 9M14 FY14 3M15 1H15 9M15 FY15 3M16 1H16 9M16 FY16 3M17 1H17
MULTIGUNA LOAN BALANCE
million Rp
billion Rp
IR BJTM 29
Strength of Loan (Multipurpose)
IR BJTM 30
No DATA June 2016 June 2017
1 Board of Commisioner 4 5
2 Board of Sharia Supervisory 3 3
3 Board of Director 5 5
4 Management 1 22 24
5 Management 2 97 98
6 Management 3 280 264
7 Management 4 697 746
8 Staff of Administration 1975 1963
9 Staff Non Administration 332 319
10 Non Permanent 1155 1045
11 Outsource 1920 1974
Total 6490 6446
Human Resources
IR BJTM
31
B Series Investor 1H16 1H17
Foreign Investor 6771 6064
Domestic Investor 3229 3936
No Country Share
1 INDONESIA 393565
2 AMERIKA 280926
3 FINLANDIA 73038
4 IRLANDIA 67525
5 NORWEGIA 49673
6 LUKSEMBURG 38169
7 INGGRIS 21608
8 KANADA 18517
9 JEPANG 12271
10 AUSTRALIA 10972
11 SAUDI ARABIA 08573
12 SWITSERLAND 06143
B Series Investor Composition
Ownership
(A Series)East Java
Government5136
(A Series)City amp
Municipal Government
2848
(B Series)Public
Domestic793
(B Series)Public Foreign
1222
Total 100
No Country Share
13 SINGAPURA 04906
14 BERMUDA 03550
15 THAILAND 03331
16 BELANDA 01807
17 KOREA SELATAN 01645
18 CAYMAN ISLAND 00896
19 HONGKONG 00844
20 SWEDIA 00725
21 JERMAN 00646
22 CINA 00400
23 MALAYSIA 00247
24 FILIPINA 00022
Total 100
IR BJTM32
Dividen amp Stock
Fiscal yearPayment of Dividend Cash Per Share (Rp)
Net ProfitDividen Payment
Ratio
2012 3974 72463931390899 818
2013 4061 82431181537019 7350
2014 4186 93908359225350 665
2015 4300 88570838014200 7242
2016 4364 102821627432600 6343
BJTM Price June 22 2017 IDR 665 share
PBV 136
EPS 9878
PER 673
Market Cap Rp 9939 bn
IR BJTM33
Competitive Products
No 1 BUMD Listed
Annual Report Award
Padmamitra Award Bank Jatim Regional Banks with
excellent service of the year
2016
Top BPD 2016 Active Role as Resi Gudang
Lending
IR BJTM 34
Award
The Higher Bank that Disbursing
FLPP Fund
IR BJTM
Investor Relations (IR)
Corporate Secretary
(031) 5310090 ext 469
Email irubankjatimcoid
IR Contact
35
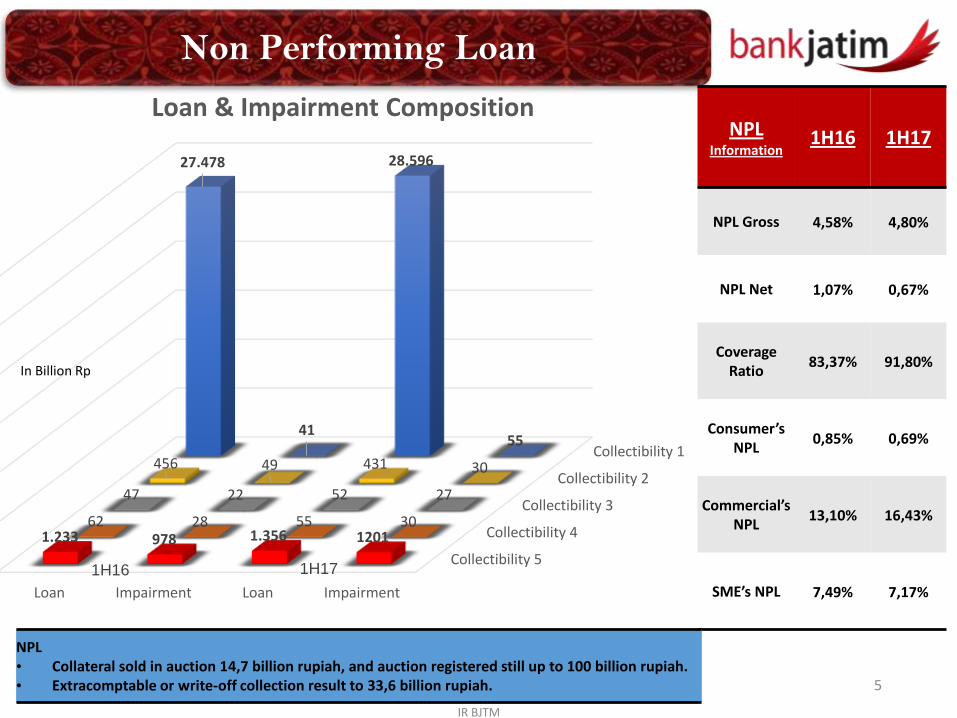
IR BJTM
BUSINESS PLAN 2017
6
IR BJTM
Description 2015 2016 2017 Econsolidated
2017 Econventional
Total Asset 1265 054 512 919
Loan 846 445 863 1175
Third Party Fund 1319 -428 744 1257
Pre Tax Profit -833 1513 1001 1020
Financial Ratio
- CAR 2122 2388 2259
- LDR 8292 9048 9148
- NPL Gross 429 477 310
- NIM 641 694 687
- BOPO 7611 7222 7076
- ROE 1611 1782 2055
- ROA 267 298 329
Business Plan
7
IR BJTM
Network 2011 2012 2013 2014 2015 2016 1H17
NETWORK
PLAN
2017
SHARIA
PLAN
2017
Head Office 1 1 1 1 1 1 1 1
Territorial Office - - - - - - - 4
Branch Office 41 41 41 43 45 47 48 1
Sub Branch Office 67 81 107 153 165 166 166 6 11
Cash office 164 164 176 165 185 190 192 16 2
Sharia service
office47 47 47 97 97 191 191
Payment Point 115 138 155 167 171 181 182 21 7
Mobile cash 61 63 65 68 71 85 87 7
CDM 1 1 1 2 2 2 2
ATM 262 368 479 595 688 703 706 46 18
Total network 759 904 1072 1291 1425 1566 1575
Networks Plan
8
IR BJTM
APPENDIX
9
IR BJTM
- - - - - - -
550525500475475475430
838836
638726
683
335
445
345307302
361437
BI 7-Day RR INFLASI
36644114 4199
3862 3990 4092 4030 4200 4244 4413 4403
3320
3707 3714 4320 4464 4413 4469 4575 46054837 4917
FY13 FY14 3M15 1H15 9M15 FY15 3M16 1H16 9M16 FY16 3M17
in trillion Rp
LOAN FUND
558502471470473479492504502490501
608586
518525544544534555561550537
FY13 FY14 3M15 1H15 9M15 FY15 3M16 1H16 9M16 FY16 3M17
INDONESIA EAST JAVA
Economic Growth Economic Share
Indonesia Java
JAVA
59 Java
22 Sumatra
2 Bali amp Nusa Tenggara
6 Sulawesi
8 Kalimantan
3 Maluku amp Papua
East Java
29 DKI Jakarta
25 East Java
23 West Java
15 Central Java
7 Banten
1 DIY
Source Bank Indonesia
Macro Economy Review
10
IR BJTM 11
InformationIn million Rp
1H16 1H17 YoY 2Q16 1Q17 2Q17 YoY QoQ
Total Asset 48061027 51560128 728 (1084245) 7284038 1243141 -21466 -8293
Placement BI amp SBI 11321922 13658218 2064 (1906658) 7342886 (1220968) -3596 -11663
Loan 29275967 30489868 415 1007664 (383849) 1198296 1892 -41218
Allowance for Impairment Losses
(1118884) (1342818) 2001 (69008) (29896) 9433 -11367 -13155
Third Party Fund 40301984 42195900 470 (1203937) 8680695 716548 -15952 -9175
- Current Account 15344593 15627127 184 (5692038) 7517556 (3179879) -4413 -14230
- Saving Account 12379492 13614198 997 1392434 (2176446) 1429005 263 -16566
- Time Deposit 12577899 12954576 299 3095668 3339585 2467422 -2029 -2612
Equity 6210672 7323052 1791 248261 (284738) 398219 6040 -23985
Balance Sheet
IR BJTM 12
InformationIn million Rp
1H16 1H17 YoY 2Q16 1Q17 2Q17 YoY QoQ
Interest Income 2398220 2346884 -214 1237862 1113221 1233663 -034 1082
Interest Expense (706449) (604954) -1437 (384498) (266362) (338592) -1194 2712
Nett Interest Income 1691771 1741930 296 853364 846859 895071 489 569
Non Interest Operational Income
229819 245809 696 123216 108360 137449 1155 2684
Non Interest Operational Expense
(911948) (904037) -087 (487031) (401957) (502080) 309 2491
Provision for Impairment Losses
(236065) (93973) -6019 (155374) (96610) 2638 -10170 -10273
Nett Non Interest Operational Income (Expense)
(918193) (752201) -1808 (519189) (390207) (361994) -3028 -723
Operational Profit 773578 989730 2794 334175 456653 533077 5952 1674
Non Operational Profit 4587 10442 12766 (161) 7596 2846 -186692 -6253
Pre Tax Profit 778164 1000171 2853 334014 464248 535923 6045 1544
Taxes (217065) (261959) 2068 (85752) (124255) (137704) 6058 1082
Net profit 561100 738212 3157 248261 339993 398219 6040 1713
Profit Loss
IR BJTM
R
O
A
R
O
E
N
I
M
407355
394 375
558 497
334382 352
267
380318 309 298
396 401
3848
3085 31482859
40573365
1896 1904 18981611
2349 20872014
17822071 2260
934
728835
766917
795648
714 690 641 683 669 670 694 718 699
L
D
R
C
A
R
B
O
P
O
3875 4211
5404
69678070 8011 8355 8498 8654 8292
6811 7264 71979048
7062 7226
38453339
25362132 1919
1653
26562372 2217 2122 1946 2065 2243 2388 2230 2291
6943 6820 6742 66045958 6002
6869 7028 6963 7611 6532 7056 7115 722262626183
2006 2007 2008 2009 2010 2011 2012 2013 2014 2015 3M16 1H16 9M16 FY16 3M17 1H17
Financial Ratio
13
22210
27416 25987
35479
30270
42681 43754
34263
41506 40302 41165
32799
41479 42196
20000
25000
30000
35000
40000
45000
FY12 1H13 FY13 1H14 FY14 1H15 9M15 FY15 3M16 1H16 9M16 FY16 3M17 1H17
Third Party Fund
IR BJTM
Current Account Junrsquo16 Junrsquo17 YoY Junrsquo16 Junrsquo17 Junrsquo16 Junrsquo17
Government 10411 10660 239 2583 2526 1119484 1122058
Private 4933 4968 069 1224 1177 927 866
Total 15345 15627 184 3807 3703 2877 2721
Saving Account Junrsquo16 Junrsquo17 YoY Junrsquo16 Junrsquo17 Junrsquo16 Junrsquo17
Simpeda 10330 10524 187 2563 2494 58 57
Siklus 752 1561 10759 187 370 60 88
Tab Haji 208 213 277 052 051 18 17
TabunganKu SimPel 980 1177 2011 243 279 04 04
Barokah 110 139 2647 027 033 59 59
Total 12379 13614 997 3072 3226 26 26
Time Deposit Junrsquo16 Junrsquo17 YoY Junrsquo16 Junrsquo17 Junrsquo16 Junrsquo17
Deposit 12578 12955 299 3121 3070 3506 3109
Total 12578 12955 299 3121 3070 3506 3109
Funding Growth Composition
Third Party Fund
Ticket Sizein million
in billion
14
24821 26087 26195 26568
28288 29235
28411 28268 29276 29625 29676 29292
30490
24000
26000
28000
30000
32000
1H14 9M14 FY14 3M15 1H15 9M15 FY15 3M16 1H16 9M16 FY16 3M17 1H17
Loan
IR BJTM
CONSUMER Junrsquo16 Junrsquo17 YoY Junrsquo16 Junrsquo17 Junrsquo16 Junrsquo17
Multi Purpose 16499 17767 769 5636 5827 690 746
Mortgage 1502 1715 1420 513 563 1772 1874Other 887 1133 2772 303 371 1404 2096
Total 18888 20615 914 6452 6761 744 816
COMMERCIAL Junrsquo16 Junrsquo17 YoY Junrsquo16 Junrsquo17 Junrsquo16 Junrsquo17
Standby Loan 656 548 -1636 224 180 2913 4517Keppres 964 625 -3519 329 205 3033 3102
Overdraft 2867 2965 340 979 972 7739 8273Syndicate 1301 1002 -2300 445 329 520557 527398
General 1151 1468 2753 393 481 8880 7043
Total 6940 6608 -478 2370 2167 6637 7411
S M E Junrsquo16 Junrsquo17 YoY Junrsquo16 Junrsquo17 Junrsquo16 Junrsquo17
Pundi 1273 1415 1116 435 464 623 612
Laguna 17 30 7319 006 010 111 199Bankit KKPA 175 396 12559 060 130 417 606
Siumi 14 29 9789 005 009 1253 977
Jatim Mikro 557 602 795 190 197 1356 1050Others 1411 796 -4357 482 261 1347 1489
Total 3449 3267 -526 1178 1072 843 768
Lending Growth Composition
Loan
Ticket Sizein million
in billion
15
IR BJTM 16
LOAN FY14 ndash 1H17
CONSUMER FY14 3M15 1H15 9M15 FY15 3M16 1H16 9M16 FY16 3M17 1H17
Multi Purpose 14849126 15151844 15609337 15793553 15924309 16116984 16498907 16671584 17131199 17177244 17766924
Mortgage 1298747 1339574 1368836 1399421 1434353 1464781 1501875 1528177 1589130 1614312 1715118
Other 612797 600017 650766 792056 827428 845423 886754 916066 1104855 1142783 1132520
Total 16760670 17091435 17628939 17985030 18186090 18427187 18887537 19115827 19825183 19934339 20614562
COMMERCIAL FY14 3M15 1H15 9M15 FY15 3M16 1H16 9M16 FY16 3M17 1H17
Standby Loan 1013324 811732 1023403 1244437 847263 593513 655632 657163 531315 436239 548373
Keppres 687257 449185 977652 1336954 748105 559221 964276 1091251 546405 357492 624976
Overdraft 2307783 2575177 2741317 2691570 2766452 2821776 2867474 2950827 2985503 2935996 2964871
Syndicate 1171171 1218198 1281280 1313528 1335649 1359599 1301393 1318861 1254721 1055945 1002057
General 1004389 1088496 1145543 1243918 1251986 1116825 1316609 1346781 1375272 1391778 1467658
Total 6183924 6142789 7169195 7830406 6949455 6450934 7105384 7364883 6693215 6177449 6607934
S M E FY14 3M15 1H15 9M15 FY15 3M16 1H16 9M16 FY16 3M17 1H17
Pundi 796281 949857 1108092 1156961 1177643 1222691 1273067 1256921 1300929 1346491 1415106
Laguna 30078 26657 30143 24925 21204 18774 17258 15390 35975 38768 29890
Bankit KKPA 73113 86147 103885 131054 130478 128615 175481 208789 272642 338899 395875
Siumi 0 0 0 995 954 2456 14412 23176 26523 24611 28521
Jatim Mikro 263067 344132 451632 490838 519834 530118 557303 561646 562361 578536 601615
Others 2087748 1926924 1796856 1615658 1426340 1487528 1245524 1078463 958593 852479 796364
Total 3250286 3333717 3490608 3420431 3276454 3390182 3283046 3144384 3157023 3179783 3267371
in million
IR BJTM 17
NPL FY14 ndash 1H17
FY14 3M15 1H15 9M15 FY15 3M16 1H16 9M16 FY16 3M17 1H17
NPL Gross 331 387 382 422 429 459 458 492 477 484 480
NPL Net 108 111 147 128 110 119 107 104 065 055 067
Coverage Ratio 7143 7895 7582 8428 8102 8087 8337 8418 9349 9533 9180
CONSUMER 060 066 075 086 074 082 085 089 084 064 069
COMMERCIAL 727 1040 922 1001 1207 1369 1310 1416 1502 1693 1643
S M E 764 824 814 841 709 738 749 729 695 691 717
IR BJTM
MANAGEMENT
18
IR BJTM
Board of Commissioners
Heru SantosoIndependent President
Commissioner
Experience
Bank Indonesia
Last Position
Governor Board
Expert Staff
SoebagyoIndependent
Commissioner
Experience
University Lecturer
Surabaya Mayor Expert Staff
Currently
Lecturer
WibisonoIndependent
Commissioner
Experience
Bank Indonesia
Last Position
Deputy Head
Surabaya Branch
Rudi PurwonoIndependent Commissioner
Experience
Airlangga University Lecturer
BNI Regional Chief Economist
Currently
Airlangga Univ Vice Dean
Payment Board East Java Gov
Regional Research Board Gov
Akhmad SukardiCommissioner
Experience
East Java Government
Currently
East Java
Regional Secretary
19
IR BJTM
Change of Director Structures
20
No Old Structures No New Structures
1 President Director 1 President Director
2 Medium amp Corporate Business Director 2 Medium amp Corporate Director
3 Operational Director 3 Operational Director
4 Agribusiness amp Sharia Business Director 4 Retail Consumer amp Sharia Business Director
5 Compliance Director 5 Compliance amp Human Capital Director
6 Risk Management Director
7 Finance Director
As a result of Bank Jatimrsquos Extraordinary General Meeting June 15th 2017
IR BJTM
Board of Directors
R SoerosoPresident Director
Experience
Corporate Secretary
Bank Jatim
President Director
Bank UMKM
Ferdian Timur S
Finance Director
Experience
Kepanjen Branch
Head
Corporate Secretary
Bank Jatim
Tony SudjiaryantoRetail Consumer amp
Sharia Business
Director
Experience
Credit Division Head
Special Credit Division
Head
Treasury Division Head
Bank Jatim
SuuacutediMedium amp Corporate
Director
Experience
IT Division Head
Planning Division
Head
Risk Management
Division Head
Bank Jatim
Rudie HardionoOperational
Director
Experience
Corporate
Secretary
Compliance
Director
Bank Jatim
21
Hadi Santoso Compliance amp
Human Capital
Director
Experience
Sharia Business Div
MediumampCorporate
Credit Div
Bank Jatim
Rizyana Mirda Risk Management
Director
Experience
Credit Risk Div
MediumampCorporate
Credit Div
Bank Jatim
Effective after pass OJKrsquos Fit and Proper Test
IR BJTM 22
Compliance amp Human Capital Directorbull Compliance amp GCG Divisionbull Law Divisionbull Human Capital Division
bull Competent human resources with sufficient amountbull Fund transaction activity and services which not
contradict with legalbull Determination of procedures inherent to the compliance
violantbull Workers productivity
Risk Management Directorbull Credit Risk Divisionbull Corporate Risk Management
Divisionbull Credit Rescue amp Completion
Division
bull Contribution Marginbull Delinquency rate 30+ days past due (DPD) for the main
products especially individual loan (loan quality)bull Classified Loanbull Recovery Ratebull Recovery Intracomptable dan Extracomptablebull Expansion and average volume of loan balance
Finance Directorbull Treasury Divisionbull Budget amp Financial
Controlling Divisionbull Strategic Planning amp
Management Performance Strategy Division
bull Market cap growth realizationbull Return after tax gainingbull Return on Equity (after tax)bull Finance Director Revenue included Total of Treasury
Revenue dan FI segmentbull Fee Based Income contributionbull Yield Portofolio Treasury
New Director Target
IR BJTM 23
SUBJECT STRATEGY
Optimizing Human Capital tosupport banking business
1 Evaluate human capital position structures
Accelerate staff and management development programs
Evaluating outsourcing and non career employee
Training and education to achieve target
2 Increase employee spiritual mental by religious event
Compliance Cultural Improving employee job desk understanding by socialization
Mitigation and managingcountermeasures of legal risk
1 Organize the implementation of development evaluation and
legal system application such as reviewing mou
2 Organize internal legal system to handle legal issues such as
legal assistance and legal opinion
3 Synergize and integrate managing process and law
implementation strategy to achieve legal issues optimal
resolution
Compliance amp Human Capital Director Current Strategies
IR BJTM 24
SUBJECT STRATEGY
Risk mitigation into activities new products or existing including 8 risks analysis
- Identify measure and evaluate all bank business risk- Giving early warning to right business sector for future lending
with stress testing all portfolio segment and products- Proactive customer visit to understand the condition directly
Minimize credit risk Improving the quality of whole credit portfolio which sustainable by providing correct analysis with credit scoring amp rating analysis
Credit Rescue amp Completion Division
- Lowering NPL1 Monitoring credit expansion2 Comprehensive collection3 Collateral auction4 Conduct bankcruptcy- Increase extracomptable collection by filtering potensial debtor
Risk Management Director Current Strategies
IR BJTM 25
SUBJECT STRATEGY
Bank Placement Interest IncomeICM provides a lower interest rate compared to time deposit
Strategy of optimizing short-term placements in time deposit
Securities interest incomeSecurities with high yield not optimal
Mid-term liquidity securities to be optimized to high yield securities
Treasury Marketing and SalesForeign exchange and bank note transaction still lowNot all branch actively sell foreign exchange and bank note
All branches required for foreign exchange and bank note transactions
Business-leading programs is constrained by the lack of competitive products
Take new pricing and leading products
Finance Director Current Strategies
IR BJTM
STRENGTH
26
IR BJTM 27
142157163174200
249291
331
380
525
429
516
46 55 74
101
131
161 186
223
262 287 297 305
120 132 137 145162
201222
260
303
446
328
422
04040505
090907
08094
118
103
148
0607 07 07 07
0809
08
12
134136
12
17 172 21
27 28 2933
41
4648 47
TOTAL ASSET (Rp Tril)
INTEREST INCOME (Rp Tril) INTEREST EXPENSE (Rp Tril)
CAGR =
857
CAGR =
1197
CAGR =
531
NET PROFIT (Rp Tril)
THIRD PARTY FUND(Rp Tril)
CAGR =
1006
LOAN (Rp Tril)
CAGR =
1699
CAGR =
1136
Compound Annual Growth Rate
2002 2003 2004 2005 2006 2007 2008 2009 2010 2011 2012 2013 2014 2015 2016 1H17
63
0
54
8
55
0
62
9
58
2
52
2
46
3
48
0
43
1
40
7
43
5
38
4
38
5
39
4
34
4
37
03
17
1
23
1
24
0
19
9
21
3
24
1
25
0
28
4
35
9
35
4
36
8
38
4
36
3
37
2
43
8
32
26
19
9
22
1
21
0
17
2
20
5
23
7
28
7
23
7
21
0
23
9
19
7
23
2
25
2
23
4
21
8
30
70
Current account Saving deposit Time deposit
453
300 253 302 318 321261 316 354 348
268 301368 363
256 301 284 278186 230 245
500
275239
310 328 331258
326381 371
267345
395 382
250277 297 288
181235 256
1H12 9M12 FY12 3M13 1H13 9M13 FY13 3M14 1H14 9M14 FY14 3M15 1H15 9M15 FY15 3M16 1H16 9M16 FY16 3M17 1H17
Cost of Fund(+) Local Government (-) Local Government
IR BJTM 28
Strength of Funding
Loan balance 5827 of total loan
NPL 031 as of June 2017
567 593 612 619 631 640 666 675 690 697 732 732 746
1H14 9M14 FY14 3M15 1H15 9M15 FY15 3M16 1H16 9M16 FY16 3M17 1H17
MULTIGUNA TICKET SIZE
13864 14408 14849 15152 15609 15794 15924 16117 16499 16672 17131 17117 17767
1H14 9M14 FY14 3M15 1H15 9M15 FY15 3M16 1H16 9M16 FY16 3M17 1H17
MULTIGUNA LOAN BALANCE
million Rp
billion Rp
IR BJTM 29
Strength of Loan (Multipurpose)
IR BJTM 30
No DATA June 2016 June 2017
1 Board of Commisioner 4 5
2 Board of Sharia Supervisory 3 3
3 Board of Director 5 5
4 Management 1 22 24
5 Management 2 97 98
6 Management 3 280 264
7 Management 4 697 746
8 Staff of Administration 1975 1963
9 Staff Non Administration 332 319
10 Non Permanent 1155 1045
11 Outsource 1920 1974
Total 6490 6446
Human Resources
IR BJTM
31
B Series Investor 1H16 1H17
Foreign Investor 6771 6064
Domestic Investor 3229 3936
No Country Share
1 INDONESIA 393565
2 AMERIKA 280926
3 FINLANDIA 73038
4 IRLANDIA 67525
5 NORWEGIA 49673
6 LUKSEMBURG 38169
7 INGGRIS 21608
8 KANADA 18517
9 JEPANG 12271
10 AUSTRALIA 10972
11 SAUDI ARABIA 08573
12 SWITSERLAND 06143
B Series Investor Composition
Ownership
(A Series)East Java
Government5136
(A Series)City amp
Municipal Government
2848
(B Series)Public
Domestic793
(B Series)Public Foreign
1222
Total 100
No Country Share
13 SINGAPURA 04906
14 BERMUDA 03550
15 THAILAND 03331
16 BELANDA 01807
17 KOREA SELATAN 01645
18 CAYMAN ISLAND 00896
19 HONGKONG 00844
20 SWEDIA 00725
21 JERMAN 00646
22 CINA 00400
23 MALAYSIA 00247
24 FILIPINA 00022
Total 100
IR BJTM32
Dividen amp Stock
Fiscal yearPayment of Dividend Cash Per Share (Rp)
Net ProfitDividen Payment
Ratio
2012 3974 72463931390899 818
2013 4061 82431181537019 7350
2014 4186 93908359225350 665
2015 4300 88570838014200 7242
2016 4364 102821627432600 6343
BJTM Price June 22 2017 IDR 665 share
PBV 136
EPS 9878
PER 673
Market Cap Rp 9939 bn
IR BJTM33
Competitive Products
No 1 BUMD Listed
Annual Report Award
Padmamitra Award Bank Jatim Regional Banks with
excellent service of the year
2016
Top BPD 2016 Active Role as Resi Gudang
Lending
IR BJTM 34
Award
The Higher Bank that Disbursing
FLPP Fund
IR BJTM
Investor Relations (IR)
Corporate Secretary
(031) 5310090 ext 469
Email irubankjatimcoid
IR Contact
35
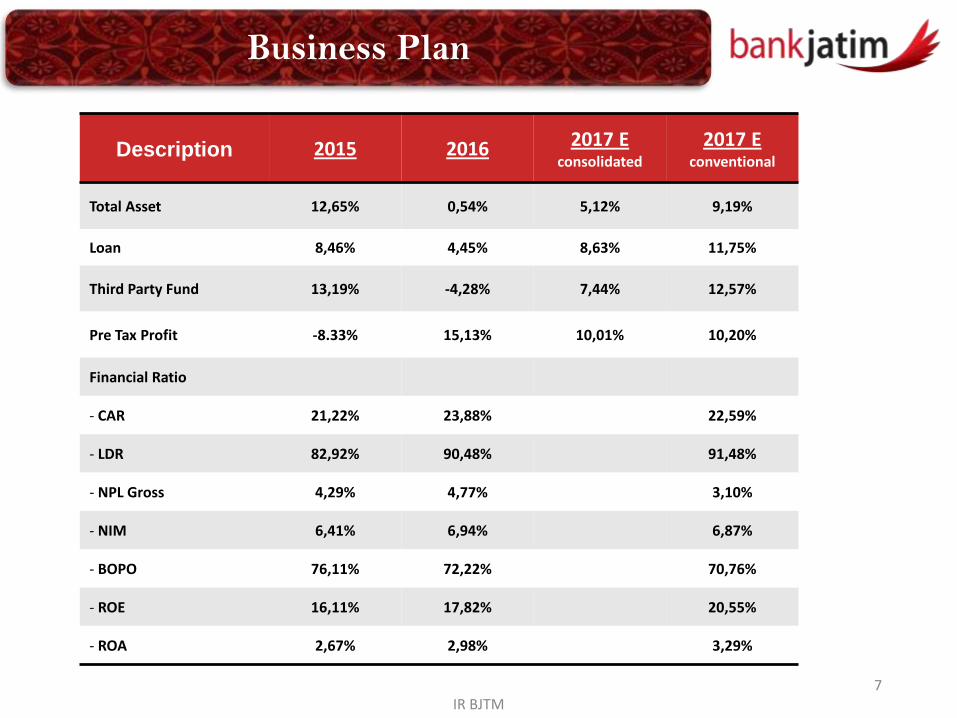
IR BJTM
Description 2015 2016 2017 Econsolidated
2017 Econventional
Total Asset 1265 054 512 919
Loan 846 445 863 1175
Third Party Fund 1319 -428 744 1257
Pre Tax Profit -833 1513 1001 1020
Financial Ratio
- CAR 2122 2388 2259
- LDR 8292 9048 9148
- NPL Gross 429 477 310
- NIM 641 694 687
- BOPO 7611 7222 7076
- ROE 1611 1782 2055
- ROA 267 298 329
Business Plan
7
IR BJTM
Network 2011 2012 2013 2014 2015 2016 1H17
NETWORK
PLAN
2017
SHARIA
PLAN
2017
Head Office 1 1 1 1 1 1 1 1
Territorial Office - - - - - - - 4
Branch Office 41 41 41 43 45 47 48 1
Sub Branch Office 67 81 107 153 165 166 166 6 11
Cash office 164 164 176 165 185 190 192 16 2
Sharia service
office47 47 47 97 97 191 191
Payment Point 115 138 155 167 171 181 182 21 7
Mobile cash 61 63 65 68 71 85 87 7
CDM 1 1 1 2 2 2 2
ATM 262 368 479 595 688 703 706 46 18
Total network 759 904 1072 1291 1425 1566 1575
Networks Plan
8
IR BJTM
APPENDIX
9
IR BJTM
- - - - - - -
550525500475475475430
838836
638726
683
335
445
345307302
361437
BI 7-Day RR INFLASI
36644114 4199
3862 3990 4092 4030 4200 4244 4413 4403
3320
3707 3714 4320 4464 4413 4469 4575 46054837 4917
FY13 FY14 3M15 1H15 9M15 FY15 3M16 1H16 9M16 FY16 3M17
in trillion Rp
LOAN FUND
558502471470473479492504502490501
608586
518525544544534555561550537
FY13 FY14 3M15 1H15 9M15 FY15 3M16 1H16 9M16 FY16 3M17
INDONESIA EAST JAVA
Economic Growth Economic Share
Indonesia Java
JAVA
59 Java
22 Sumatra
2 Bali amp Nusa Tenggara
6 Sulawesi
8 Kalimantan
3 Maluku amp Papua
East Java
29 DKI Jakarta
25 East Java
23 West Java
15 Central Java
7 Banten
1 DIY
Source Bank Indonesia
Macro Economy Review
10
IR BJTM 11
InformationIn million Rp
1H16 1H17 YoY 2Q16 1Q17 2Q17 YoY QoQ
Total Asset 48061027 51560128 728 (1084245) 7284038 1243141 -21466 -8293
Placement BI amp SBI 11321922 13658218 2064 (1906658) 7342886 (1220968) -3596 -11663
Loan 29275967 30489868 415 1007664 (383849) 1198296 1892 -41218
Allowance for Impairment Losses
(1118884) (1342818) 2001 (69008) (29896) 9433 -11367 -13155
Third Party Fund 40301984 42195900 470 (1203937) 8680695 716548 -15952 -9175
- Current Account 15344593 15627127 184 (5692038) 7517556 (3179879) -4413 -14230
- Saving Account 12379492 13614198 997 1392434 (2176446) 1429005 263 -16566
- Time Deposit 12577899 12954576 299 3095668 3339585 2467422 -2029 -2612
Equity 6210672 7323052 1791 248261 (284738) 398219 6040 -23985
Balance Sheet
IR BJTM 12
InformationIn million Rp
1H16 1H17 YoY 2Q16 1Q17 2Q17 YoY QoQ
Interest Income 2398220 2346884 -214 1237862 1113221 1233663 -034 1082
Interest Expense (706449) (604954) -1437 (384498) (266362) (338592) -1194 2712
Nett Interest Income 1691771 1741930 296 853364 846859 895071 489 569
Non Interest Operational Income
229819 245809 696 123216 108360 137449 1155 2684
Non Interest Operational Expense
(911948) (904037) -087 (487031) (401957) (502080) 309 2491
Provision for Impairment Losses
(236065) (93973) -6019 (155374) (96610) 2638 -10170 -10273
Nett Non Interest Operational Income (Expense)
(918193) (752201) -1808 (519189) (390207) (361994) -3028 -723
Operational Profit 773578 989730 2794 334175 456653 533077 5952 1674
Non Operational Profit 4587 10442 12766 (161) 7596 2846 -186692 -6253
Pre Tax Profit 778164 1000171 2853 334014 464248 535923 6045 1544
Taxes (217065) (261959) 2068 (85752) (124255) (137704) 6058 1082
Net profit 561100 738212 3157 248261 339993 398219 6040 1713
Profit Loss
IR BJTM
R
O
A
R
O
E
N
I
M
407355
394 375
558 497
334382 352
267
380318 309 298
396 401
3848
3085 31482859
40573365
1896 1904 18981611
2349 20872014
17822071 2260
934
728835
766917
795648
714 690 641 683 669 670 694 718 699
L
D
R
C
A
R
B
O
P
O
3875 4211
5404
69678070 8011 8355 8498 8654 8292
6811 7264 71979048
7062 7226
38453339
25362132 1919
1653
26562372 2217 2122 1946 2065 2243 2388 2230 2291
6943 6820 6742 66045958 6002
6869 7028 6963 7611 6532 7056 7115 722262626183
2006 2007 2008 2009 2010 2011 2012 2013 2014 2015 3M16 1H16 9M16 FY16 3M17 1H17
Financial Ratio
13
22210
27416 25987
35479
30270
42681 43754
34263
41506 40302 41165
32799
41479 42196
20000
25000
30000
35000
40000
45000
FY12 1H13 FY13 1H14 FY14 1H15 9M15 FY15 3M16 1H16 9M16 FY16 3M17 1H17
Third Party Fund
IR BJTM
Current Account Junrsquo16 Junrsquo17 YoY Junrsquo16 Junrsquo17 Junrsquo16 Junrsquo17
Government 10411 10660 239 2583 2526 1119484 1122058
Private 4933 4968 069 1224 1177 927 866
Total 15345 15627 184 3807 3703 2877 2721
Saving Account Junrsquo16 Junrsquo17 YoY Junrsquo16 Junrsquo17 Junrsquo16 Junrsquo17
Simpeda 10330 10524 187 2563 2494 58 57
Siklus 752 1561 10759 187 370 60 88
Tab Haji 208 213 277 052 051 18 17
TabunganKu SimPel 980 1177 2011 243 279 04 04
Barokah 110 139 2647 027 033 59 59
Total 12379 13614 997 3072 3226 26 26
Time Deposit Junrsquo16 Junrsquo17 YoY Junrsquo16 Junrsquo17 Junrsquo16 Junrsquo17
Deposit 12578 12955 299 3121 3070 3506 3109
Total 12578 12955 299 3121 3070 3506 3109
Funding Growth Composition
Third Party Fund
Ticket Sizein million
in billion
14
24821 26087 26195 26568
28288 29235
28411 28268 29276 29625 29676 29292
30490
24000
26000
28000
30000
32000
1H14 9M14 FY14 3M15 1H15 9M15 FY15 3M16 1H16 9M16 FY16 3M17 1H17
Loan
IR BJTM
CONSUMER Junrsquo16 Junrsquo17 YoY Junrsquo16 Junrsquo17 Junrsquo16 Junrsquo17
Multi Purpose 16499 17767 769 5636 5827 690 746
Mortgage 1502 1715 1420 513 563 1772 1874Other 887 1133 2772 303 371 1404 2096
Total 18888 20615 914 6452 6761 744 816
COMMERCIAL Junrsquo16 Junrsquo17 YoY Junrsquo16 Junrsquo17 Junrsquo16 Junrsquo17
Standby Loan 656 548 -1636 224 180 2913 4517Keppres 964 625 -3519 329 205 3033 3102
Overdraft 2867 2965 340 979 972 7739 8273Syndicate 1301 1002 -2300 445 329 520557 527398
General 1151 1468 2753 393 481 8880 7043
Total 6940 6608 -478 2370 2167 6637 7411
S M E Junrsquo16 Junrsquo17 YoY Junrsquo16 Junrsquo17 Junrsquo16 Junrsquo17
Pundi 1273 1415 1116 435 464 623 612
Laguna 17 30 7319 006 010 111 199Bankit KKPA 175 396 12559 060 130 417 606
Siumi 14 29 9789 005 009 1253 977
Jatim Mikro 557 602 795 190 197 1356 1050Others 1411 796 -4357 482 261 1347 1489
Total 3449 3267 -526 1178 1072 843 768
Lending Growth Composition
Loan
Ticket Sizein million
in billion
15
IR BJTM 16
LOAN FY14 ndash 1H17
CONSUMER FY14 3M15 1H15 9M15 FY15 3M16 1H16 9M16 FY16 3M17 1H17
Multi Purpose 14849126 15151844 15609337 15793553 15924309 16116984 16498907 16671584 17131199 17177244 17766924
Mortgage 1298747 1339574 1368836 1399421 1434353 1464781 1501875 1528177 1589130 1614312 1715118
Other 612797 600017 650766 792056 827428 845423 886754 916066 1104855 1142783 1132520
Total 16760670 17091435 17628939 17985030 18186090 18427187 18887537 19115827 19825183 19934339 20614562
COMMERCIAL FY14 3M15 1H15 9M15 FY15 3M16 1H16 9M16 FY16 3M17 1H17
Standby Loan 1013324 811732 1023403 1244437 847263 593513 655632 657163 531315 436239 548373
Keppres 687257 449185 977652 1336954 748105 559221 964276 1091251 546405 357492 624976
Overdraft 2307783 2575177 2741317 2691570 2766452 2821776 2867474 2950827 2985503 2935996 2964871
Syndicate 1171171 1218198 1281280 1313528 1335649 1359599 1301393 1318861 1254721 1055945 1002057
General 1004389 1088496 1145543 1243918 1251986 1116825 1316609 1346781 1375272 1391778 1467658
Total 6183924 6142789 7169195 7830406 6949455 6450934 7105384 7364883 6693215 6177449 6607934
S M E FY14 3M15 1H15 9M15 FY15 3M16 1H16 9M16 FY16 3M17 1H17
Pundi 796281 949857 1108092 1156961 1177643 1222691 1273067 1256921 1300929 1346491 1415106
Laguna 30078 26657 30143 24925 21204 18774 17258 15390 35975 38768 29890
Bankit KKPA 73113 86147 103885 131054 130478 128615 175481 208789 272642 338899 395875
Siumi 0 0 0 995 954 2456 14412 23176 26523 24611 28521
Jatim Mikro 263067 344132 451632 490838 519834 530118 557303 561646 562361 578536 601615
Others 2087748 1926924 1796856 1615658 1426340 1487528 1245524 1078463 958593 852479 796364
Total 3250286 3333717 3490608 3420431 3276454 3390182 3283046 3144384 3157023 3179783 3267371
in million
IR BJTM 17
NPL FY14 ndash 1H17
FY14 3M15 1H15 9M15 FY15 3M16 1H16 9M16 FY16 3M17 1H17
NPL Gross 331 387 382 422 429 459 458 492 477 484 480
NPL Net 108 111 147 128 110 119 107 104 065 055 067
Coverage Ratio 7143 7895 7582 8428 8102 8087 8337 8418 9349 9533 9180
CONSUMER 060 066 075 086 074 082 085 089 084 064 069
COMMERCIAL 727 1040 922 1001 1207 1369 1310 1416 1502 1693 1643
S M E 764 824 814 841 709 738 749 729 695 691 717
IR BJTM
MANAGEMENT
18
IR BJTM
Board of Commissioners
Heru SantosoIndependent President
Commissioner
Experience
Bank Indonesia
Last Position
Governor Board
Expert Staff
SoebagyoIndependent
Commissioner
Experience
University Lecturer
Surabaya Mayor Expert Staff
Currently
Lecturer
WibisonoIndependent
Commissioner
Experience
Bank Indonesia
Last Position
Deputy Head
Surabaya Branch
Rudi PurwonoIndependent Commissioner
Experience
Airlangga University Lecturer
BNI Regional Chief Economist
Currently
Airlangga Univ Vice Dean
Payment Board East Java Gov
Regional Research Board Gov
Akhmad SukardiCommissioner
Experience
East Java Government
Currently
East Java
Regional Secretary
19
IR BJTM
Change of Director Structures
20
No Old Structures No New Structures
1 President Director 1 President Director
2 Medium amp Corporate Business Director 2 Medium amp Corporate Director
3 Operational Director 3 Operational Director
4 Agribusiness amp Sharia Business Director 4 Retail Consumer amp Sharia Business Director
5 Compliance Director 5 Compliance amp Human Capital Director
6 Risk Management Director
7 Finance Director
As a result of Bank Jatimrsquos Extraordinary General Meeting June 15th 2017
IR BJTM
Board of Directors
R SoerosoPresident Director
Experience
Corporate Secretary
Bank Jatim
President Director
Bank UMKM
Ferdian Timur S
Finance Director
Experience
Kepanjen Branch
Head
Corporate Secretary
Bank Jatim
Tony SudjiaryantoRetail Consumer amp
Sharia Business
Director
Experience
Credit Division Head
Special Credit Division
Head
Treasury Division Head
Bank Jatim
SuuacutediMedium amp Corporate
Director
Experience
IT Division Head
Planning Division
Head
Risk Management
Division Head
Bank Jatim
Rudie HardionoOperational
Director
Experience
Corporate
Secretary
Compliance
Director
Bank Jatim
21
Hadi Santoso Compliance amp
Human Capital
Director
Experience
Sharia Business Div
MediumampCorporate
Credit Div
Bank Jatim
Rizyana Mirda Risk Management
Director
Experience
Credit Risk Div
MediumampCorporate
Credit Div
Bank Jatim
Effective after pass OJKrsquos Fit and Proper Test
IR BJTM 22
Compliance amp Human Capital Directorbull Compliance amp GCG Divisionbull Law Divisionbull Human Capital Division
bull Competent human resources with sufficient amountbull Fund transaction activity and services which not
contradict with legalbull Determination of procedures inherent to the compliance
violantbull Workers productivity
Risk Management Directorbull Credit Risk Divisionbull Corporate Risk Management
Divisionbull Credit Rescue amp Completion
Division
bull Contribution Marginbull Delinquency rate 30+ days past due (DPD) for the main
products especially individual loan (loan quality)bull Classified Loanbull Recovery Ratebull Recovery Intracomptable dan Extracomptablebull Expansion and average volume of loan balance
Finance Directorbull Treasury Divisionbull Budget amp Financial
Controlling Divisionbull Strategic Planning amp
Management Performance Strategy Division
bull Market cap growth realizationbull Return after tax gainingbull Return on Equity (after tax)bull Finance Director Revenue included Total of Treasury
Revenue dan FI segmentbull Fee Based Income contributionbull Yield Portofolio Treasury
New Director Target
IR BJTM 23
SUBJECT STRATEGY
Optimizing Human Capital tosupport banking business
1 Evaluate human capital position structures
Accelerate staff and management development programs
Evaluating outsourcing and non career employee
Training and education to achieve target
2 Increase employee spiritual mental by religious event
Compliance Cultural Improving employee job desk understanding by socialization
Mitigation and managingcountermeasures of legal risk
1 Organize the implementation of development evaluation and
legal system application such as reviewing mou
2 Organize internal legal system to handle legal issues such as
legal assistance and legal opinion
3 Synergize and integrate managing process and law
implementation strategy to achieve legal issues optimal
resolution
Compliance amp Human Capital Director Current Strategies
IR BJTM 24
SUBJECT STRATEGY
Risk mitigation into activities new products or existing including 8 risks analysis
- Identify measure and evaluate all bank business risk- Giving early warning to right business sector for future lending
with stress testing all portfolio segment and products- Proactive customer visit to understand the condition directly
Minimize credit risk Improving the quality of whole credit portfolio which sustainable by providing correct analysis with credit scoring amp rating analysis
Credit Rescue amp Completion Division
- Lowering NPL1 Monitoring credit expansion2 Comprehensive collection3 Collateral auction4 Conduct bankcruptcy- Increase extracomptable collection by filtering potensial debtor
Risk Management Director Current Strategies
IR BJTM 25
SUBJECT STRATEGY
Bank Placement Interest IncomeICM provides a lower interest rate compared to time deposit
Strategy of optimizing short-term placements in time deposit
Securities interest incomeSecurities with high yield not optimal
Mid-term liquidity securities to be optimized to high yield securities
Treasury Marketing and SalesForeign exchange and bank note transaction still lowNot all branch actively sell foreign exchange and bank note
All branches required for foreign exchange and bank note transactions
Business-leading programs is constrained by the lack of competitive products
Take new pricing and leading products
Finance Director Current Strategies
IR BJTM
STRENGTH
26
IR BJTM 27
142157163174200
249291
331
380
525
429
516
46 55 74
101
131
161 186
223
262 287 297 305
120 132 137 145162
201222
260
303
446
328
422
04040505
090907
08094
118
103
148
0607 07 07 07
0809
08
12
134136
12
17 172 21
27 28 2933
41
4648 47
TOTAL ASSET (Rp Tril)
INTEREST INCOME (Rp Tril) INTEREST EXPENSE (Rp Tril)
CAGR =
857
CAGR =
1197
CAGR =
531
NET PROFIT (Rp Tril)
THIRD PARTY FUND(Rp Tril)
CAGR =
1006
LOAN (Rp Tril)
CAGR =
1699
CAGR =
1136
Compound Annual Growth Rate
2002 2003 2004 2005 2006 2007 2008 2009 2010 2011 2012 2013 2014 2015 2016 1H17
63
0
54
8
55
0
62
9
58
2
52
2
46
3
48
0
43
1
40
7
43
5
38
4
38
5
39
4
34
4
37
03
17
1
23
1
24
0
19
9
21
3
24
1
25
0
28
4
35
9
35
4
36
8
38
4
36
3
37
2
43
8
32
26
19
9
22
1
21
0
17
2
20
5
23
7
28
7
23
7
21
0
23
9
19
7
23
2
25
2
23
4
21
8
30
70
Current account Saving deposit Time deposit
453
300 253 302 318 321261 316 354 348
268 301368 363
256 301 284 278186 230 245
500
275239
310 328 331258
326381 371
267345
395 382
250277 297 288
181235 256
1H12 9M12 FY12 3M13 1H13 9M13 FY13 3M14 1H14 9M14 FY14 3M15 1H15 9M15 FY15 3M16 1H16 9M16 FY16 3M17 1H17
Cost of Fund(+) Local Government (-) Local Government
IR BJTM 28
Strength of Funding
Loan balance 5827 of total loan
NPL 031 as of June 2017
567 593 612 619 631 640 666 675 690 697 732 732 746
1H14 9M14 FY14 3M15 1H15 9M15 FY15 3M16 1H16 9M16 FY16 3M17 1H17
MULTIGUNA TICKET SIZE
13864 14408 14849 15152 15609 15794 15924 16117 16499 16672 17131 17117 17767
1H14 9M14 FY14 3M15 1H15 9M15 FY15 3M16 1H16 9M16 FY16 3M17 1H17
MULTIGUNA LOAN BALANCE
million Rp
billion Rp
IR BJTM 29
Strength of Loan (Multipurpose)
IR BJTM 30
No DATA June 2016 June 2017
1 Board of Commisioner 4 5
2 Board of Sharia Supervisory 3 3
3 Board of Director 5 5
4 Management 1 22 24
5 Management 2 97 98
6 Management 3 280 264
7 Management 4 697 746
8 Staff of Administration 1975 1963
9 Staff Non Administration 332 319
10 Non Permanent 1155 1045
11 Outsource 1920 1974
Total 6490 6446
Human Resources
IR BJTM
31
B Series Investor 1H16 1H17
Foreign Investor 6771 6064
Domestic Investor 3229 3936
No Country Share
1 INDONESIA 393565
2 AMERIKA 280926
3 FINLANDIA 73038
4 IRLANDIA 67525
5 NORWEGIA 49673
6 LUKSEMBURG 38169
7 INGGRIS 21608
8 KANADA 18517
9 JEPANG 12271
10 AUSTRALIA 10972
11 SAUDI ARABIA 08573
12 SWITSERLAND 06143
B Series Investor Composition
Ownership
(A Series)East Java
Government5136
(A Series)City amp
Municipal Government
2848
(B Series)Public
Domestic793
(B Series)Public Foreign
1222
Total 100
No Country Share
13 SINGAPURA 04906
14 BERMUDA 03550
15 THAILAND 03331
16 BELANDA 01807
17 KOREA SELATAN 01645
18 CAYMAN ISLAND 00896
19 HONGKONG 00844
20 SWEDIA 00725
21 JERMAN 00646
22 CINA 00400
23 MALAYSIA 00247
24 FILIPINA 00022
Total 100
IR BJTM32
Dividen amp Stock
Fiscal yearPayment of Dividend Cash Per Share (Rp)
Net ProfitDividen Payment
Ratio
2012 3974 72463931390899 818
2013 4061 82431181537019 7350
2014 4186 93908359225350 665
2015 4300 88570838014200 7242
2016 4364 102821627432600 6343
BJTM Price June 22 2017 IDR 665 share
PBV 136
EPS 9878
PER 673
Market Cap Rp 9939 bn
IR BJTM33
Competitive Products
No 1 BUMD Listed
Annual Report Award
Padmamitra Award Bank Jatim Regional Banks with
excellent service of the year
2016
Top BPD 2016 Active Role as Resi Gudang
Lending
IR BJTM 34
Award
The Higher Bank that Disbursing
FLPP Fund
IR BJTM
Investor Relations (IR)
Corporate Secretary
(031) 5310090 ext 469
Email irubankjatimcoid
IR Contact
35
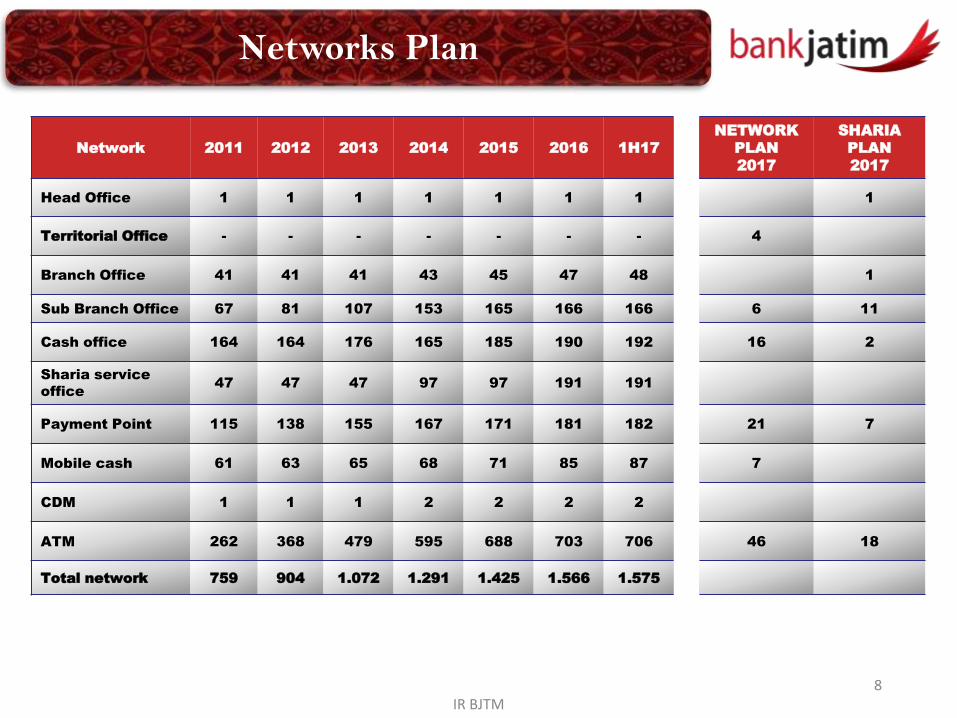
IR BJTM
APPENDIX
9
IR BJTM
- - - - - - -
550525500475475475430
838836
638726
683
335
445
345307302
361437
BI 7-Day RR INFLASI
36644114 4199
3862 3990 4092 4030 4200 4244 4413 4403
3320
3707 3714 4320 4464 4413 4469 4575 46054837 4917
FY13 FY14 3M15 1H15 9M15 FY15 3M16 1H16 9M16 FY16 3M17
in trillion Rp
LOAN FUND
558502471470473479492504502490501
608586
518525544544534555561550537
FY13 FY14 3M15 1H15 9M15 FY15 3M16 1H16 9M16 FY16 3M17
INDONESIA EAST JAVA
Economic Growth Economic Share
Indonesia Java
JAVA
59 Java
22 Sumatra
2 Bali amp Nusa Tenggara
6 Sulawesi
8 Kalimantan
3 Maluku amp Papua
East Java
29 DKI Jakarta
25 East Java
23 West Java
15 Central Java
7 Banten
1 DIY
Source Bank Indonesia
Macro Economy Review
10
IR BJTM 11
InformationIn million Rp
1H16 1H17 YoY 2Q16 1Q17 2Q17 YoY QoQ
Total Asset 48061027 51560128 728 (1084245) 7284038 1243141 -21466 -8293
Placement BI amp SBI 11321922 13658218 2064 (1906658) 7342886 (1220968) -3596 -11663
Loan 29275967 30489868 415 1007664 (383849) 1198296 1892 -41218
Allowance for Impairment Losses
(1118884) (1342818) 2001 (69008) (29896) 9433 -11367 -13155
Third Party Fund 40301984 42195900 470 (1203937) 8680695 716548 -15952 -9175
- Current Account 15344593 15627127 184 (5692038) 7517556 (3179879) -4413 -14230
- Saving Account 12379492 13614198 997 1392434 (2176446) 1429005 263 -16566
- Time Deposit 12577899 12954576 299 3095668 3339585 2467422 -2029 -2612
Equity 6210672 7323052 1791 248261 (284738) 398219 6040 -23985
Balance Sheet
IR BJTM 12
InformationIn million Rp
1H16 1H17 YoY 2Q16 1Q17 2Q17 YoY QoQ
Interest Income 2398220 2346884 -214 1237862 1113221 1233663 -034 1082
Interest Expense (706449) (604954) -1437 (384498) (266362) (338592) -1194 2712
Nett Interest Income 1691771 1741930 296 853364 846859 895071 489 569
Non Interest Operational Income
229819 245809 696 123216 108360 137449 1155 2684
Non Interest Operational Expense
(911948) (904037) -087 (487031) (401957) (502080) 309 2491
Provision for Impairment Losses
(236065) (93973) -6019 (155374) (96610) 2638 -10170 -10273
Nett Non Interest Operational Income (Expense)
(918193) (752201) -1808 (519189) (390207) (361994) -3028 -723
Operational Profit 773578 989730 2794 334175 456653 533077 5952 1674
Non Operational Profit 4587 10442 12766 (161) 7596 2846 -186692 -6253
Pre Tax Profit 778164 1000171 2853 334014 464248 535923 6045 1544
Taxes (217065) (261959) 2068 (85752) (124255) (137704) 6058 1082
Net profit 561100 738212 3157 248261 339993 398219 6040 1713
Profit Loss
IR BJTM
R
O
A
R
O
E
N
I
M
407355
394 375
558 497
334382 352
267
380318 309 298
396 401
3848
3085 31482859
40573365
1896 1904 18981611
2349 20872014
17822071 2260
934
728835
766917
795648
714 690 641 683 669 670 694 718 699
L
D
R
C
A
R
B
O
P
O
3875 4211
5404
69678070 8011 8355 8498 8654 8292
6811 7264 71979048
7062 7226
38453339
25362132 1919
1653
26562372 2217 2122 1946 2065 2243 2388 2230 2291
6943 6820 6742 66045958 6002
6869 7028 6963 7611 6532 7056 7115 722262626183
2006 2007 2008 2009 2010 2011 2012 2013 2014 2015 3M16 1H16 9M16 FY16 3M17 1H17
Financial Ratio
13
22210
27416 25987
35479
30270
42681 43754
34263
41506 40302 41165
32799
41479 42196
20000
25000
30000
35000
40000
45000
FY12 1H13 FY13 1H14 FY14 1H15 9M15 FY15 3M16 1H16 9M16 FY16 3M17 1H17
Third Party Fund
IR BJTM
Current Account Junrsquo16 Junrsquo17 YoY Junrsquo16 Junrsquo17 Junrsquo16 Junrsquo17
Government 10411 10660 239 2583 2526 1119484 1122058
Private 4933 4968 069 1224 1177 927 866
Total 15345 15627 184 3807 3703 2877 2721
Saving Account Junrsquo16 Junrsquo17 YoY Junrsquo16 Junrsquo17 Junrsquo16 Junrsquo17
Simpeda 10330 10524 187 2563 2494 58 57
Siklus 752 1561 10759 187 370 60 88
Tab Haji 208 213 277 052 051 18 17
TabunganKu SimPel 980 1177 2011 243 279 04 04
Barokah 110 139 2647 027 033 59 59
Total 12379 13614 997 3072 3226 26 26
Time Deposit Junrsquo16 Junrsquo17 YoY Junrsquo16 Junrsquo17 Junrsquo16 Junrsquo17
Deposit 12578 12955 299 3121 3070 3506 3109
Total 12578 12955 299 3121 3070 3506 3109
Funding Growth Composition
Third Party Fund
Ticket Sizein million
in billion
14
24821 26087 26195 26568
28288 29235
28411 28268 29276 29625 29676 29292
30490
24000
26000
28000
30000
32000
1H14 9M14 FY14 3M15 1H15 9M15 FY15 3M16 1H16 9M16 FY16 3M17 1H17
Loan
IR BJTM
CONSUMER Junrsquo16 Junrsquo17 YoY Junrsquo16 Junrsquo17 Junrsquo16 Junrsquo17
Multi Purpose 16499 17767 769 5636 5827 690 746
Mortgage 1502 1715 1420 513 563 1772 1874Other 887 1133 2772 303 371 1404 2096
Total 18888 20615 914 6452 6761 744 816
COMMERCIAL Junrsquo16 Junrsquo17 YoY Junrsquo16 Junrsquo17 Junrsquo16 Junrsquo17
Standby Loan 656 548 -1636 224 180 2913 4517Keppres 964 625 -3519 329 205 3033 3102
Overdraft 2867 2965 340 979 972 7739 8273Syndicate 1301 1002 -2300 445 329 520557 527398
General 1151 1468 2753 393 481 8880 7043
Total 6940 6608 -478 2370 2167 6637 7411
S M E Junrsquo16 Junrsquo17 YoY Junrsquo16 Junrsquo17 Junrsquo16 Junrsquo17
Pundi 1273 1415 1116 435 464 623 612
Laguna 17 30 7319 006 010 111 199Bankit KKPA 175 396 12559 060 130 417 606
Siumi 14 29 9789 005 009 1253 977
Jatim Mikro 557 602 795 190 197 1356 1050Others 1411 796 -4357 482 261 1347 1489
Total 3449 3267 -526 1178 1072 843 768
Lending Growth Composition
Loan
Ticket Sizein million
in billion
15
IR BJTM 16
LOAN FY14 ndash 1H17
CONSUMER FY14 3M15 1H15 9M15 FY15 3M16 1H16 9M16 FY16 3M17 1H17
Multi Purpose 14849126 15151844 15609337 15793553 15924309 16116984 16498907 16671584 17131199 17177244 17766924
Mortgage 1298747 1339574 1368836 1399421 1434353 1464781 1501875 1528177 1589130 1614312 1715118
Other 612797 600017 650766 792056 827428 845423 886754 916066 1104855 1142783 1132520
Total 16760670 17091435 17628939 17985030 18186090 18427187 18887537 19115827 19825183 19934339 20614562
COMMERCIAL FY14 3M15 1H15 9M15 FY15 3M16 1H16 9M16 FY16 3M17 1H17
Standby Loan 1013324 811732 1023403 1244437 847263 593513 655632 657163 531315 436239 548373
Keppres 687257 449185 977652 1336954 748105 559221 964276 1091251 546405 357492 624976
Overdraft 2307783 2575177 2741317 2691570 2766452 2821776 2867474 2950827 2985503 2935996 2964871
Syndicate 1171171 1218198 1281280 1313528 1335649 1359599 1301393 1318861 1254721 1055945 1002057
General 1004389 1088496 1145543 1243918 1251986 1116825 1316609 1346781 1375272 1391778 1467658
Total 6183924 6142789 7169195 7830406 6949455 6450934 7105384 7364883 6693215 6177449 6607934
S M E FY14 3M15 1H15 9M15 FY15 3M16 1H16 9M16 FY16 3M17 1H17
Pundi 796281 949857 1108092 1156961 1177643 1222691 1273067 1256921 1300929 1346491 1415106
Laguna 30078 26657 30143 24925 21204 18774 17258 15390 35975 38768 29890
Bankit KKPA 73113 86147 103885 131054 130478 128615 175481 208789 272642 338899 395875
Siumi 0 0 0 995 954 2456 14412 23176 26523 24611 28521
Jatim Mikro 263067 344132 451632 490838 519834 530118 557303 561646 562361 578536 601615
Others 2087748 1926924 1796856 1615658 1426340 1487528 1245524 1078463 958593 852479 796364
Total 3250286 3333717 3490608 3420431 3276454 3390182 3283046 3144384 3157023 3179783 3267371
in million
IR BJTM 17
NPL FY14 ndash 1H17
FY14 3M15 1H15 9M15 FY15 3M16 1H16 9M16 FY16 3M17 1H17
NPL Gross 331 387 382 422 429 459 458 492 477 484 480
NPL Net 108 111 147 128 110 119 107 104 065 055 067
Coverage Ratio 7143 7895 7582 8428 8102 8087 8337 8418 9349 9533 9180
CONSUMER 060 066 075 086 074 082 085 089 084 064 069
COMMERCIAL 727 1040 922 1001 1207 1369 1310 1416 1502 1693 1643
S M E 764 824 814 841 709 738 749 729 695 691 717
IR BJTM
MANAGEMENT
18
IR BJTM
Board of Commissioners
Heru SantosoIndependent President
Commissioner
Experience
Bank Indonesia
Last Position
Governor Board
Expert Staff
SoebagyoIndependent
Commissioner
Experience
University Lecturer
Surabaya Mayor Expert Staff
Currently
Lecturer
WibisonoIndependent
Commissioner
Experience
Bank Indonesia
Last Position
Deputy Head
Surabaya Branch
Rudi PurwonoIndependent Commissioner
Experience
Airlangga University Lecturer
BNI Regional Chief Economist
Currently
Airlangga Univ Vice Dean
Payment Board East Java Gov
Regional Research Board Gov
Akhmad SukardiCommissioner
Experience
East Java Government
Currently
East Java
Regional Secretary
19
IR BJTM
Change of Director Structures
20
No Old Structures No New Structures
1 President Director 1 President Director
2 Medium amp Corporate Business Director 2 Medium amp Corporate Director
3 Operational Director 3 Operational Director
4 Agribusiness amp Sharia Business Director 4 Retail Consumer amp Sharia Business Director
5 Compliance Director 5 Compliance amp Human Capital Director
6 Risk Management Director
7 Finance Director
As a result of Bank Jatimrsquos Extraordinary General Meeting June 15th 2017
IR BJTM
Board of Directors
R SoerosoPresident Director
Experience
Corporate Secretary
Bank Jatim
President Director
Bank UMKM
Ferdian Timur S
Finance Director
Experience
Kepanjen Branch
Head
Corporate Secretary
Bank Jatim
Tony SudjiaryantoRetail Consumer amp
Sharia Business
Director
Experience
Credit Division Head
Special Credit Division
Head
Treasury Division Head
Bank Jatim
SuuacutediMedium amp Corporate
Director
Experience
IT Division Head
Planning Division
Head
Risk Management
Division Head
Bank Jatim
Rudie HardionoOperational
Director
Experience
Corporate
Secretary
Compliance
Director
Bank Jatim
21
Hadi Santoso Compliance amp
Human Capital
Director
Experience
Sharia Business Div
MediumampCorporate
Credit Div
Bank Jatim
Rizyana Mirda Risk Management
Director
Experience
Credit Risk Div
MediumampCorporate
Credit Div
Bank Jatim
Effective after pass OJKrsquos Fit and Proper Test
IR BJTM 22
Compliance amp Human Capital Directorbull Compliance amp GCG Divisionbull Law Divisionbull Human Capital Division
bull Competent human resources with sufficient amountbull Fund transaction activity and services which not
contradict with legalbull Determination of procedures inherent to the compliance
violantbull Workers productivity
Risk Management Directorbull Credit Risk Divisionbull Corporate Risk Management
Divisionbull Credit Rescue amp Completion
Division
bull Contribution Marginbull Delinquency rate 30+ days past due (DPD) for the main
products especially individual loan (loan quality)bull Classified Loanbull Recovery Ratebull Recovery Intracomptable dan Extracomptablebull Expansion and average volume of loan balance
Finance Directorbull Treasury Divisionbull Budget amp Financial
Controlling Divisionbull Strategic Planning amp
Management Performance Strategy Division
bull Market cap growth realizationbull Return after tax gainingbull Return on Equity (after tax)bull Finance Director Revenue included Total of Treasury
Revenue dan FI segmentbull Fee Based Income contributionbull Yield Portofolio Treasury
New Director Target
IR BJTM 23
SUBJECT STRATEGY
Optimizing Human Capital tosupport banking business
1 Evaluate human capital position structures
Accelerate staff and management development programs
Evaluating outsourcing and non career employee
Training and education to achieve target
2 Increase employee spiritual mental by religious event
Compliance Cultural Improving employee job desk understanding by socialization
Mitigation and managingcountermeasures of legal risk
1 Organize the implementation of development evaluation and
legal system application such as reviewing mou
2 Organize internal legal system to handle legal issues such as
legal assistance and legal opinion
3 Synergize and integrate managing process and law
implementation strategy to achieve legal issues optimal
resolution
Compliance amp Human Capital Director Current Strategies
IR BJTM 24
SUBJECT STRATEGY
Risk mitigation into activities new products or existing including 8 risks analysis
- Identify measure and evaluate all bank business risk- Giving early warning to right business sector for future lending
with stress testing all portfolio segment and products- Proactive customer visit to understand the condition directly
Minimize credit risk Improving the quality of whole credit portfolio which sustainable by providing correct analysis with credit scoring amp rating analysis
Credit Rescue amp Completion Division
- Lowering NPL1 Monitoring credit expansion2 Comprehensive collection3 Collateral auction4 Conduct bankcruptcy- Increase extracomptable collection by filtering potensial debtor
Risk Management Director Current Strategies
IR BJTM 25
SUBJECT STRATEGY
Bank Placement Interest IncomeICM provides a lower interest rate compared to time deposit
Strategy of optimizing short-term placements in time deposit
Securities interest incomeSecurities with high yield not optimal
Mid-term liquidity securities to be optimized to high yield securities
Treasury Marketing and SalesForeign exchange and bank note transaction still lowNot all branch actively sell foreign exchange and bank note
All branches required for foreign exchange and bank note transactions
Business-leading programs is constrained by the lack of competitive products
Take new pricing and leading products
Finance Director Current Strategies
IR BJTM
STRENGTH
26
IR BJTM 27
142157163174200
249291
331
380
525
429
516
46 55 74
101
131
161 186
223
262 287 297 305
120 132 137 145162
201222
260
303
446
328
422
04040505
090907
08094
118
103
148
0607 07 07 07
0809
08
12
134136
12
17 172 21
27 28 2933
41
4648 47
TOTAL ASSET (Rp Tril)
INTEREST INCOME (Rp Tril) INTEREST EXPENSE (Rp Tril)
CAGR =
857
CAGR =
1197
CAGR =
531
NET PROFIT (Rp Tril)
THIRD PARTY FUND(Rp Tril)
CAGR =
1006
LOAN (Rp Tril)
CAGR =
1699
CAGR =
1136
Compound Annual Growth Rate
2002 2003 2004 2005 2006 2007 2008 2009 2010 2011 2012 2013 2014 2015 2016 1H17
63
0
54
8
55
0
62
9
58
2
52
2
46
3
48
0
43
1
40
7
43
5
38
4
38
5
39
4
34
4
37
03
17
1
23
1
24
0
19
9
21
3
24
1
25
0
28
4
35
9
35
4
36
8
38
4
36
3
37
2
43
8
32
26
19
9
22
1
21
0
17
2
20
5
23
7
28
7
23
7
21
0
23
9
19
7
23
2
25
2
23
4
21
8
30
70
Current account Saving deposit Time deposit
453
300 253 302 318 321261 316 354 348
268 301368 363
256 301 284 278186 230 245
500
275239
310 328 331258
326381 371
267345
395 382
250277 297 288
181235 256
1H12 9M12 FY12 3M13 1H13 9M13 FY13 3M14 1H14 9M14 FY14 3M15 1H15 9M15 FY15 3M16 1H16 9M16 FY16 3M17 1H17
Cost of Fund(+) Local Government (-) Local Government
IR BJTM 28
Strength of Funding
Loan balance 5827 of total loan
NPL 031 as of June 2017
567 593 612 619 631 640 666 675 690 697 732 732 746
1H14 9M14 FY14 3M15 1H15 9M15 FY15 3M16 1H16 9M16 FY16 3M17 1H17
MULTIGUNA TICKET SIZE
13864 14408 14849 15152 15609 15794 15924 16117 16499 16672 17131 17117 17767
1H14 9M14 FY14 3M15 1H15 9M15 FY15 3M16 1H16 9M16 FY16 3M17 1H17
MULTIGUNA LOAN BALANCE
million Rp
billion Rp
IR BJTM 29
Strength of Loan (Multipurpose)
IR BJTM 30
No DATA June 2016 June 2017
1 Board of Commisioner 4 5
2 Board of Sharia Supervisory 3 3
3 Board of Director 5 5
4 Management 1 22 24
5 Management 2 97 98
6 Management 3 280 264
7 Management 4 697 746
8 Staff of Administration 1975 1963
9 Staff Non Administration 332 319
10 Non Permanent 1155 1045
11 Outsource 1920 1974
Total 6490 6446
Human Resources
IR BJTM
31
B Series Investor 1H16 1H17
Foreign Investor 6771 6064
Domestic Investor 3229 3936
No Country Share
1 INDONESIA 393565
2 AMERIKA 280926
3 FINLANDIA 73038
4 IRLANDIA 67525
5 NORWEGIA 49673
6 LUKSEMBURG 38169
7 INGGRIS 21608
8 KANADA 18517
9 JEPANG 12271
10 AUSTRALIA 10972
11 SAUDI ARABIA 08573
12 SWITSERLAND 06143
B Series Investor Composition
Ownership
(A Series)East Java
Government5136
(A Series)City amp
Municipal Government
2848
(B Series)Public
Domestic793
(B Series)Public Foreign
1222
Total 100
No Country Share
13 SINGAPURA 04906
14 BERMUDA 03550
15 THAILAND 03331
16 BELANDA 01807
17 KOREA SELATAN 01645
18 CAYMAN ISLAND 00896
19 HONGKONG 00844
20 SWEDIA 00725
21 JERMAN 00646
22 CINA 00400
23 MALAYSIA 00247
24 FILIPINA 00022
Total 100
IR BJTM32
Dividen amp Stock
Fiscal yearPayment of Dividend Cash Per Share (Rp)
Net ProfitDividen Payment
Ratio
2012 3974 72463931390899 818
2013 4061 82431181537019 7350
2014 4186 93908359225350 665
2015 4300 88570838014200 7242
2016 4364 102821627432600 6343
BJTM Price June 22 2017 IDR 665 share
PBV 136
EPS 9878
PER 673
Market Cap Rp 9939 bn
IR BJTM33
Competitive Products
No 1 BUMD Listed
Annual Report Award
Padmamitra Award Bank Jatim Regional Banks with
excellent service of the year
2016
Top BPD 2016 Active Role as Resi Gudang
Lending
IR BJTM 34
Award
The Higher Bank that Disbursing
FLPP Fund
IR BJTM
Investor Relations (IR)
Corporate Secretary
(031) 5310090 ext 469
Email irubankjatimcoid
IR Contact
35
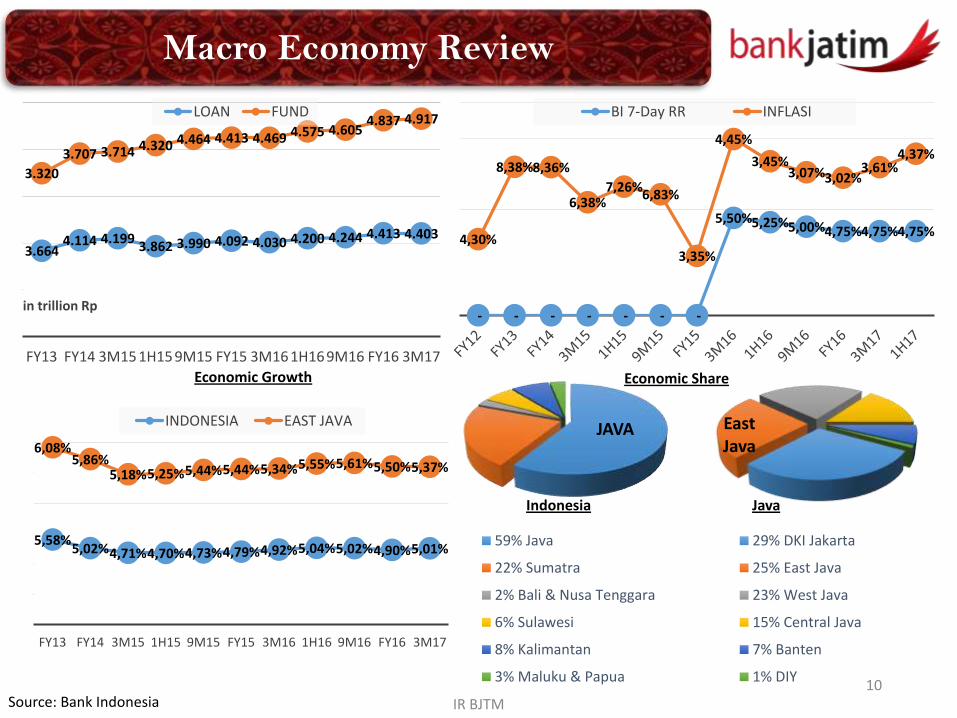
IR BJTM
- - - - - - -
550525500475475475430
838836
638726
683
335
445
345307302
361437
BI 7-Day RR INFLASI
36644114 4199
3862 3990 4092 4030 4200 4244 4413 4403
3320
3707 3714 4320 4464 4413 4469 4575 46054837 4917
FY13 FY14 3M15 1H15 9M15 FY15 3M16 1H16 9M16 FY16 3M17
in trillion Rp
LOAN FUND
558502471470473479492504502490501
608586
518525544544534555561550537
FY13 FY14 3M15 1H15 9M15 FY15 3M16 1H16 9M16 FY16 3M17
INDONESIA EAST JAVA
Economic Growth Economic Share
Indonesia Java
JAVA
59 Java
22 Sumatra
2 Bali amp Nusa Tenggara
6 Sulawesi
8 Kalimantan
3 Maluku amp Papua
East Java
29 DKI Jakarta
25 East Java
23 West Java
15 Central Java
7 Banten
1 DIY
Source Bank Indonesia
Macro Economy Review
10
IR BJTM 11
InformationIn million Rp
1H16 1H17 YoY 2Q16 1Q17 2Q17 YoY QoQ
Total Asset 48061027 51560128 728 (1084245) 7284038 1243141 -21466 -8293
Placement BI amp SBI 11321922 13658218 2064 (1906658) 7342886 (1220968) -3596 -11663
Loan 29275967 30489868 415 1007664 (383849) 1198296 1892 -41218
Allowance for Impairment Losses
(1118884) (1342818) 2001 (69008) (29896) 9433 -11367 -13155
Third Party Fund 40301984 42195900 470 (1203937) 8680695 716548 -15952 -9175
- Current Account 15344593 15627127 184 (5692038) 7517556 (3179879) -4413 -14230
- Saving Account 12379492 13614198 997 1392434 (2176446) 1429005 263 -16566
- Time Deposit 12577899 12954576 299 3095668 3339585 2467422 -2029 -2612
Equity 6210672 7323052 1791 248261 (284738) 398219 6040 -23985
Balance Sheet
IR BJTM 12
InformationIn million Rp
1H16 1H17 YoY 2Q16 1Q17 2Q17 YoY QoQ
Interest Income 2398220 2346884 -214 1237862 1113221 1233663 -034 1082
Interest Expense (706449) (604954) -1437 (384498) (266362) (338592) -1194 2712
Nett Interest Income 1691771 1741930 296 853364 846859 895071 489 569
Non Interest Operational Income
229819 245809 696 123216 108360 137449 1155 2684
Non Interest Operational Expense
(911948) (904037) -087 (487031) (401957) (502080) 309 2491
Provision for Impairment Losses
(236065) (93973) -6019 (155374) (96610) 2638 -10170 -10273
Nett Non Interest Operational Income (Expense)
(918193) (752201) -1808 (519189) (390207) (361994) -3028 -723
Operational Profit 773578 989730 2794 334175 456653 533077 5952 1674
Non Operational Profit 4587 10442 12766 (161) 7596 2846 -186692 -6253
Pre Tax Profit 778164 1000171 2853 334014 464248 535923 6045 1544
Taxes (217065) (261959) 2068 (85752) (124255) (137704) 6058 1082
Net profit 561100 738212 3157 248261 339993 398219 6040 1713
Profit Loss
IR BJTM
R
O
A
R
O
E
N
I
M
407355
394 375
558 497
334382 352
267
380318 309 298
396 401
3848
3085 31482859
40573365
1896 1904 18981611
2349 20872014
17822071 2260
934
728835
766917
795648
714 690 641 683 669 670 694 718 699
L
D
R
C
A
R
B
O
P
O
3875 4211
5404
69678070 8011 8355 8498 8654 8292
6811 7264 71979048
7062 7226
38453339
25362132 1919
1653
26562372 2217 2122 1946 2065 2243 2388 2230 2291
6943 6820 6742 66045958 6002
6869 7028 6963 7611 6532 7056 7115 722262626183
2006 2007 2008 2009 2010 2011 2012 2013 2014 2015 3M16 1H16 9M16 FY16 3M17 1H17
Financial Ratio
13
22210
27416 25987
35479
30270
42681 43754
34263
41506 40302 41165
32799
41479 42196
20000
25000
30000
35000
40000
45000
FY12 1H13 FY13 1H14 FY14 1H15 9M15 FY15 3M16 1H16 9M16 FY16 3M17 1H17
Third Party Fund
IR BJTM
Current Account Junrsquo16 Junrsquo17 YoY Junrsquo16 Junrsquo17 Junrsquo16 Junrsquo17
Government 10411 10660 239 2583 2526 1119484 1122058
Private 4933 4968 069 1224 1177 927 866
Total 15345 15627 184 3807 3703 2877 2721
Saving Account Junrsquo16 Junrsquo17 YoY Junrsquo16 Junrsquo17 Junrsquo16 Junrsquo17
Simpeda 10330 10524 187 2563 2494 58 57
Siklus 752 1561 10759 187 370 60 88
Tab Haji 208 213 277 052 051 18 17
TabunganKu SimPel 980 1177 2011 243 279 04 04
Barokah 110 139 2647 027 033 59 59
Total 12379 13614 997 3072 3226 26 26
Time Deposit Junrsquo16 Junrsquo17 YoY Junrsquo16 Junrsquo17 Junrsquo16 Junrsquo17
Deposit 12578 12955 299 3121 3070 3506 3109
Total 12578 12955 299 3121 3070 3506 3109
Funding Growth Composition
Third Party Fund
Ticket Sizein million
in billion
14
24821 26087 26195 26568
28288 29235
28411 28268 29276 29625 29676 29292
30490
24000
26000
28000
30000
32000
1H14 9M14 FY14 3M15 1H15 9M15 FY15 3M16 1H16 9M16 FY16 3M17 1H17
Loan
IR BJTM
CONSUMER Junrsquo16 Junrsquo17 YoY Junrsquo16 Junrsquo17 Junrsquo16 Junrsquo17
Multi Purpose 16499 17767 769 5636 5827 690 746
Mortgage 1502 1715 1420 513 563 1772 1874Other 887 1133 2772 303 371 1404 2096
Total 18888 20615 914 6452 6761 744 816
COMMERCIAL Junrsquo16 Junrsquo17 YoY Junrsquo16 Junrsquo17 Junrsquo16 Junrsquo17
Standby Loan 656 548 -1636 224 180 2913 4517Keppres 964 625 -3519 329 205 3033 3102
Overdraft 2867 2965 340 979 972 7739 8273Syndicate 1301 1002 -2300 445 329 520557 527398
General 1151 1468 2753 393 481 8880 7043
Total 6940 6608 -478 2370 2167 6637 7411
S M E Junrsquo16 Junrsquo17 YoY Junrsquo16 Junrsquo17 Junrsquo16 Junrsquo17
Pundi 1273 1415 1116 435 464 623 612
Laguna 17 30 7319 006 010 111 199Bankit KKPA 175 396 12559 060 130 417 606
Siumi 14 29 9789 005 009 1253 977
Jatim Mikro 557 602 795 190 197 1356 1050Others 1411 796 -4357 482 261 1347 1489
Total 3449 3267 -526 1178 1072 843 768
Lending Growth Composition
Loan
Ticket Sizein million
in billion
15
IR BJTM 16
LOAN FY14 ndash 1H17
CONSUMER FY14 3M15 1H15 9M15 FY15 3M16 1H16 9M16 FY16 3M17 1H17
Multi Purpose 14849126 15151844 15609337 15793553 15924309 16116984 16498907 16671584 17131199 17177244 17766924
Mortgage 1298747 1339574 1368836 1399421 1434353 1464781 1501875 1528177 1589130 1614312 1715118
Other 612797 600017 650766 792056 827428 845423 886754 916066 1104855 1142783 1132520
Total 16760670 17091435 17628939 17985030 18186090 18427187 18887537 19115827 19825183 19934339 20614562
COMMERCIAL FY14 3M15 1H15 9M15 FY15 3M16 1H16 9M16 FY16 3M17 1H17
Standby Loan 1013324 811732 1023403 1244437 847263 593513 655632 657163 531315 436239 548373
Keppres 687257 449185 977652 1336954 748105 559221 964276 1091251 546405 357492 624976
Overdraft 2307783 2575177 2741317 2691570 2766452 2821776 2867474 2950827 2985503 2935996 2964871
Syndicate 1171171 1218198 1281280 1313528 1335649 1359599 1301393 1318861 1254721 1055945 1002057
General 1004389 1088496 1145543 1243918 1251986 1116825 1316609 1346781 1375272 1391778 1467658
Total 6183924 6142789 7169195 7830406 6949455 6450934 7105384 7364883 6693215 6177449 6607934
S M E FY14 3M15 1H15 9M15 FY15 3M16 1H16 9M16 FY16 3M17 1H17
Pundi 796281 949857 1108092 1156961 1177643 1222691 1273067 1256921 1300929 1346491 1415106
Laguna 30078 26657 30143 24925 21204 18774 17258 15390 35975 38768 29890
Bankit KKPA 73113 86147 103885 131054 130478 128615 175481 208789 272642 338899 395875
Siumi 0 0 0 995 954 2456 14412 23176 26523 24611 28521
Jatim Mikro 263067 344132 451632 490838 519834 530118 557303 561646 562361 578536 601615
Others 2087748 1926924 1796856 1615658 1426340 1487528 1245524 1078463 958593 852479 796364
Total 3250286 3333717 3490608 3420431 3276454 3390182 3283046 3144384 3157023 3179783 3267371
in million
IR BJTM 17
NPL FY14 ndash 1H17
FY14 3M15 1H15 9M15 FY15 3M16 1H16 9M16 FY16 3M17 1H17
NPL Gross 331 387 382 422 429 459 458 492 477 484 480
NPL Net 108 111 147 128 110 119 107 104 065 055 067
Coverage Ratio 7143 7895 7582 8428 8102 8087 8337 8418 9349 9533 9180
CONSUMER 060 066 075 086 074 082 085 089 084 064 069
COMMERCIAL 727 1040 922 1001 1207 1369 1310 1416 1502 1693 1643
S M E 764 824 814 841 709 738 749 729 695 691 717
IR BJTM
MANAGEMENT
18
IR BJTM
Board of Commissioners
Heru SantosoIndependent President
Commissioner
Experience
Bank Indonesia
Last Position
Governor Board
Expert Staff
SoebagyoIndependent
Commissioner
Experience
University Lecturer
Surabaya Mayor Expert Staff
Currently
Lecturer
WibisonoIndependent
Commissioner
Experience
Bank Indonesia
Last Position
Deputy Head
Surabaya Branch
Rudi PurwonoIndependent Commissioner
Experience
Airlangga University Lecturer
BNI Regional Chief Economist
Currently
Airlangga Univ Vice Dean
Payment Board East Java Gov
Regional Research Board Gov
Akhmad SukardiCommissioner
Experience
East Java Government
Currently
East Java
Regional Secretary
19
IR BJTM
Change of Director Structures
20
No Old Structures No New Structures
1 President Director 1 President Director
2 Medium amp Corporate Business Director 2 Medium amp Corporate Director
3 Operational Director 3 Operational Director
4 Agribusiness amp Sharia Business Director 4 Retail Consumer amp Sharia Business Director
5 Compliance Director 5 Compliance amp Human Capital Director
6 Risk Management Director
7 Finance Director
As a result of Bank Jatimrsquos Extraordinary General Meeting June 15th 2017
IR BJTM
Board of Directors
R SoerosoPresident Director
Experience
Corporate Secretary
Bank Jatim
President Director
Bank UMKM
Ferdian Timur S
Finance Director
Experience
Kepanjen Branch
Head
Corporate Secretary
Bank Jatim
Tony SudjiaryantoRetail Consumer amp
Sharia Business
Director
Experience
Credit Division Head
Special Credit Division
Head
Treasury Division Head
Bank Jatim
SuuacutediMedium amp Corporate
Director
Experience
IT Division Head
Planning Division
Head
Risk Management
Division Head
Bank Jatim
Rudie HardionoOperational
Director
Experience
Corporate
Secretary
Compliance
Director
Bank Jatim
21
Hadi Santoso Compliance amp
Human Capital
Director
Experience
Sharia Business Div
MediumampCorporate
Credit Div
Bank Jatim
Rizyana Mirda Risk Management
Director
Experience
Credit Risk Div
MediumampCorporate
Credit Div
Bank Jatim
Effective after pass OJKrsquos Fit and Proper Test
IR BJTM 22
Compliance amp Human Capital Directorbull Compliance amp GCG Divisionbull Law Divisionbull Human Capital Division
bull Competent human resources with sufficient amountbull Fund transaction activity and services which not
contradict with legalbull Determination of procedures inherent to the compliance
violantbull Workers productivity
Risk Management Directorbull Credit Risk Divisionbull Corporate Risk Management
Divisionbull Credit Rescue amp Completion
Division
bull Contribution Marginbull Delinquency rate 30+ days past due (DPD) for the main
products especially individual loan (loan quality)bull Classified Loanbull Recovery Ratebull Recovery Intracomptable dan Extracomptablebull Expansion and average volume of loan balance
Finance Directorbull Treasury Divisionbull Budget amp Financial
Controlling Divisionbull Strategic Planning amp
Management Performance Strategy Division
bull Market cap growth realizationbull Return after tax gainingbull Return on Equity (after tax)bull Finance Director Revenue included Total of Treasury
Revenue dan FI segmentbull Fee Based Income contributionbull Yield Portofolio Treasury
New Director Target
IR BJTM 23
SUBJECT STRATEGY
Optimizing Human Capital tosupport banking business
1 Evaluate human capital position structures
Accelerate staff and management development programs
Evaluating outsourcing and non career employee
Training and education to achieve target
2 Increase employee spiritual mental by religious event
Compliance Cultural Improving employee job desk understanding by socialization
Mitigation and managingcountermeasures of legal risk
1 Organize the implementation of development evaluation and
legal system application such as reviewing mou
2 Organize internal legal system to handle legal issues such as
legal assistance and legal opinion
3 Synergize and integrate managing process and law
implementation strategy to achieve legal issues optimal
resolution
Compliance amp Human Capital Director Current Strategies
IR BJTM 24
SUBJECT STRATEGY
Risk mitigation into activities new products or existing including 8 risks analysis
- Identify measure and evaluate all bank business risk- Giving early warning to right business sector for future lending
with stress testing all portfolio segment and products- Proactive customer visit to understand the condition directly
Minimize credit risk Improving the quality of whole credit portfolio which sustainable by providing correct analysis with credit scoring amp rating analysis
Credit Rescue amp Completion Division
- Lowering NPL1 Monitoring credit expansion2 Comprehensive collection3 Collateral auction4 Conduct bankcruptcy- Increase extracomptable collection by filtering potensial debtor
Risk Management Director Current Strategies
IR BJTM 25
SUBJECT STRATEGY
Bank Placement Interest IncomeICM provides a lower interest rate compared to time deposit
Strategy of optimizing short-term placements in time deposit
Securities interest incomeSecurities with high yield not optimal
Mid-term liquidity securities to be optimized to high yield securities
Treasury Marketing and SalesForeign exchange and bank note transaction still lowNot all branch actively sell foreign exchange and bank note
All branches required for foreign exchange and bank note transactions
Business-leading programs is constrained by the lack of competitive products
Take new pricing and leading products
Finance Director Current Strategies
IR BJTM
STRENGTH
26
IR BJTM 27
142157163174200
249291
331
380
525
429
516
46 55 74
101
131
161 186
223
262 287 297 305
120 132 137 145162
201222
260
303
446
328
422
04040505
090907
08094
118
103
148
0607 07 07 07
0809
08
12
134136
12
17 172 21
27 28 2933
41
4648 47
TOTAL ASSET (Rp Tril)
INTEREST INCOME (Rp Tril) INTEREST EXPENSE (Rp Tril)
CAGR =
857
CAGR =
1197
CAGR =
531
NET PROFIT (Rp Tril)
THIRD PARTY FUND(Rp Tril)
CAGR =
1006
LOAN (Rp Tril)
CAGR =
1699
CAGR =
1136
Compound Annual Growth Rate
2002 2003 2004 2005 2006 2007 2008 2009 2010 2011 2012 2013 2014 2015 2016 1H17
63
0
54
8
55
0
62
9
58
2
52
2
46
3
48
0
43
1
40
7
43
5
38
4
38
5
39
4
34
4
37
03
17
1
23
1
24
0
19
9
21
3
24
1
25
0
28
4
35
9
35
4
36
8
38
4
36
3
37
2
43
8
32
26
19
9
22
1
21
0
17
2
20
5
23
7
28
7
23
7
21
0
23
9
19
7
23
2
25
2
23
4
21
8
30
70
Current account Saving deposit Time deposit
453
300 253 302 318 321261 316 354 348
268 301368 363
256 301 284 278186 230 245
500
275239
310 328 331258
326381 371
267345
395 382
250277 297 288
181235 256
1H12 9M12 FY12 3M13 1H13 9M13 FY13 3M14 1H14 9M14 FY14 3M15 1H15 9M15 FY15 3M16 1H16 9M16 FY16 3M17 1H17
Cost of Fund(+) Local Government (-) Local Government
IR BJTM 28
Strength of Funding
Loan balance 5827 of total loan
NPL 031 as of June 2017
567 593 612 619 631 640 666 675 690 697 732 732 746
1H14 9M14 FY14 3M15 1H15 9M15 FY15 3M16 1H16 9M16 FY16 3M17 1H17
MULTIGUNA TICKET SIZE
13864 14408 14849 15152 15609 15794 15924 16117 16499 16672 17131 17117 17767
1H14 9M14 FY14 3M15 1H15 9M15 FY15 3M16 1H16 9M16 FY16 3M17 1H17
MULTIGUNA LOAN BALANCE
million Rp
billion Rp
IR BJTM 29
Strength of Loan (Multipurpose)
IR BJTM 30
No DATA June 2016 June 2017
1 Board of Commisioner 4 5
2 Board of Sharia Supervisory 3 3
3 Board of Director 5 5
4 Management 1 22 24
5 Management 2 97 98
6 Management 3 280 264
7 Management 4 697 746
8 Staff of Administration 1975 1963
9 Staff Non Administration 332 319
10 Non Permanent 1155 1045
11 Outsource 1920 1974
Total 6490 6446
Human Resources
IR BJTM
31
B Series Investor 1H16 1H17
Foreign Investor 6771 6064
Domestic Investor 3229 3936
No Country Share
1 INDONESIA 393565
2 AMERIKA 280926
3 FINLANDIA 73038
4 IRLANDIA 67525
5 NORWEGIA 49673
6 LUKSEMBURG 38169
7 INGGRIS 21608
8 KANADA 18517
9 JEPANG 12271
10 AUSTRALIA 10972
11 SAUDI ARABIA 08573
12 SWITSERLAND 06143
B Series Investor Composition
Ownership
(A Series)East Java
Government5136
(A Series)City amp
Municipal Government
2848
(B Series)Public
Domestic793
(B Series)Public Foreign
1222
Total 100
No Country Share
13 SINGAPURA 04906
14 BERMUDA 03550
15 THAILAND 03331
16 BELANDA 01807
17 KOREA SELATAN 01645
18 CAYMAN ISLAND 00896
19 HONGKONG 00844
20 SWEDIA 00725
21 JERMAN 00646
22 CINA 00400
23 MALAYSIA 00247
24 FILIPINA 00022
Total 100
IR BJTM32
Dividen amp Stock
Fiscal yearPayment of Dividend Cash Per Share (Rp)
Net ProfitDividen Payment
Ratio
2012 3974 72463931390899 818
2013 4061 82431181537019 7350
2014 4186 93908359225350 665
2015 4300 88570838014200 7242
2016 4364 102821627432600 6343
BJTM Price June 22 2017 IDR 665 share
PBV 136
EPS 9878
PER 673
Market Cap Rp 9939 bn
IR BJTM33
Competitive Products
No 1 BUMD Listed
Annual Report Award
Padmamitra Award Bank Jatim Regional Banks with
excellent service of the year
2016
Top BPD 2016 Active Role as Resi Gudang
Lending
IR BJTM 34
Award
The Higher Bank that Disbursing
FLPP Fund
IR BJTM
Investor Relations (IR)
Corporate Secretary
(031) 5310090 ext 469
Email irubankjatimcoid
IR Contact
35
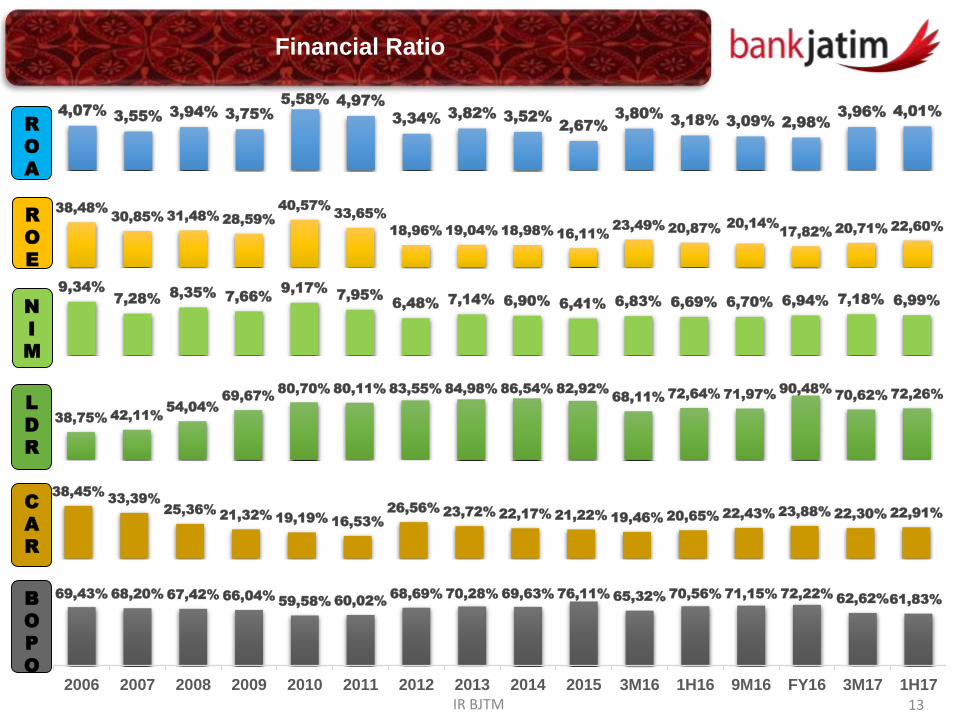
IR BJTM
R
O
A
R
O
E
N
I
M
407355
394 375
558 497
334382 352
267
380318 309 298
396 401
3848
3085 31482859
40573365
1896 1904 18981611
2349 20872014
17822071 2260
934
728835
766917
795648
714 690 641 683 669 670 694 718 699
L
D
R
C
A
R
B
O
P
O
3875 4211
5404
69678070 8011 8355 8498 8654 8292
6811 7264 71979048
7062 7226
38453339
25362132 1919
1653
26562372 2217 2122 1946 2065 2243 2388 2230 2291
6943 6820 6742 66045958 6002
6869 7028 6963 7611 6532 7056 7115 722262626183
2006 2007 2008 2009 2010 2011 2012 2013 2014 2015 3M16 1H16 9M16 FY16 3M17 1H17
Financial Ratio
13
22210
27416 25987
35479
30270
42681 43754
34263
41506 40302 41165
32799
41479 42196
20000
25000
30000
35000
40000
45000
FY12 1H13 FY13 1H14 FY14 1H15 9M15 FY15 3M16 1H16 9M16 FY16 3M17 1H17
Third Party Fund
IR BJTM
Current Account Junrsquo16 Junrsquo17 YoY Junrsquo16 Junrsquo17 Junrsquo16 Junrsquo17
Government 10411 10660 239 2583 2526 1119484 1122058
Private 4933 4968 069 1224 1177 927 866
Total 15345 15627 184 3807 3703 2877 2721
Saving Account Junrsquo16 Junrsquo17 YoY Junrsquo16 Junrsquo17 Junrsquo16 Junrsquo17
Simpeda 10330 10524 187 2563 2494 58 57
Siklus 752 1561 10759 187 370 60 88
Tab Haji 208 213 277 052 051 18 17
TabunganKu SimPel 980 1177 2011 243 279 04 04
Barokah 110 139 2647 027 033 59 59
Total 12379 13614 997 3072 3226 26 26
Time Deposit Junrsquo16 Junrsquo17 YoY Junrsquo16 Junrsquo17 Junrsquo16 Junrsquo17
Deposit 12578 12955 299 3121 3070 3506 3109
Total 12578 12955 299 3121 3070 3506 3109
Funding Growth Composition
Third Party Fund
Ticket Sizein million
in billion
14
24821 26087 26195 26568
28288 29235
28411 28268 29276 29625 29676 29292
30490
24000
26000
28000
30000
32000
1H14 9M14 FY14 3M15 1H15 9M15 FY15 3M16 1H16 9M16 FY16 3M17 1H17
Loan
IR BJTM
CONSUMER Junrsquo16 Junrsquo17 YoY Junrsquo16 Junrsquo17 Junrsquo16 Junrsquo17
Multi Purpose 16499 17767 769 5636 5827 690 746
Mortgage 1502 1715 1420 513 563 1772 1874Other 887 1133 2772 303 371 1404 2096
Total 18888 20615 914 6452 6761 744 816
COMMERCIAL Junrsquo16 Junrsquo17 YoY Junrsquo16 Junrsquo17 Junrsquo16 Junrsquo17
Standby Loan 656 548 -1636 224 180 2913 4517Keppres 964 625 -3519 329 205 3033 3102
Overdraft 2867 2965 340 979 972 7739 8273Syndicate 1301 1002 -2300 445 329 520557 527398
General 1151 1468 2753 393 481 8880 7043
Total 6940 6608 -478 2370 2167 6637 7411
S M E Junrsquo16 Junrsquo17 YoY Junrsquo16 Junrsquo17 Junrsquo16 Junrsquo17
Pundi 1273 1415 1116 435 464 623 612
Laguna 17 30 7319 006 010 111 199Bankit KKPA 175 396 12559 060 130 417 606
Siumi 14 29 9789 005 009 1253 977
Jatim Mikro 557 602 795 190 197 1356 1050Others 1411 796 -4357 482 261 1347 1489
Total 3449 3267 -526 1178 1072 843 768
Lending Growth Composition
Loan
Ticket Sizein million
in billion
15
IR BJTM 16
LOAN FY14 ndash 1H17
CONSUMER FY14 3M15 1H15 9M15 FY15 3M16 1H16 9M16 FY16 3M17 1H17
Multi Purpose 14849126 15151844 15609337 15793553 15924309 16116984 16498907 16671584 17131199 17177244 17766924
Mortgage 1298747 1339574 1368836 1399421 1434353 1464781 1501875 1528177 1589130 1614312 1715118
Other 612797 600017 650766 792056 827428 845423 886754 916066 1104855 1142783 1132520
Total 16760670 17091435 17628939 17985030 18186090 18427187 18887537 19115827 19825183 19934339 20614562
COMMERCIAL FY14 3M15 1H15 9M15 FY15 3M16 1H16 9M16 FY16 3M17 1H17
Standby Loan 1013324 811732 1023403 1244437 847263 593513 655632 657163 531315 436239 548373
Keppres 687257 449185 977652 1336954 748105 559221 964276 1091251 546405 357492 624976
Overdraft 2307783 2575177 2741317 2691570 2766452 2821776 2867474 2950827 2985503 2935996 2964871
Syndicate 1171171 1218198 1281280 1313528 1335649 1359599 1301393 1318861 1254721 1055945 1002057
General 1004389 1088496 1145543 1243918 1251986 1116825 1316609 1346781 1375272 1391778 1467658
Total 6183924 6142789 7169195 7830406 6949455 6450934 7105384 7364883 6693215 6177449 6607934
S M E FY14 3M15 1H15 9M15 FY15 3M16 1H16 9M16 FY16 3M17 1H17
Pundi 796281 949857 1108092 1156961 1177643 1222691 1273067 1256921 1300929 1346491 1415106
Laguna 30078 26657 30143 24925 21204 18774 17258 15390 35975 38768 29890
Bankit KKPA 73113 86147 103885 131054 130478 128615 175481 208789 272642 338899 395875
Siumi 0 0 0 995 954 2456 14412 23176 26523 24611 28521
Jatim Mikro 263067 344132 451632 490838 519834 530118 557303 561646 562361 578536 601615
Others 2087748 1926924 1796856 1615658 1426340 1487528 1245524 1078463 958593 852479 796364
Total 3250286 3333717 3490608 3420431 3276454 3390182 3283046 3144384 3157023 3179783 3267371
in million
IR BJTM 17
NPL FY14 ndash 1H17
FY14 3M15 1H15 9M15 FY15 3M16 1H16 9M16 FY16 3M17 1H17
NPL Gross 331 387 382 422 429 459 458 492 477 484 480
NPL Net 108 111 147 128 110 119 107 104 065 055 067
Coverage Ratio 7143 7895 7582 8428 8102 8087 8337 8418 9349 9533 9180
CONSUMER 060 066 075 086 074 082 085 089 084 064 069
COMMERCIAL 727 1040 922 1001 1207 1369 1310 1416 1502 1693 1643
S M E 764 824 814 841 709 738 749 729 695 691 717
IR BJTM
MANAGEMENT
18
IR BJTM
Board of Commissioners
Heru SantosoIndependent President
Commissioner
Experience
Bank Indonesia
Last Position
Governor Board
Expert Staff
SoebagyoIndependent
Commissioner
Experience
University Lecturer
Surabaya Mayor Expert Staff
Currently
Lecturer
WibisonoIndependent
Commissioner
Experience
Bank Indonesia
Last Position
Deputy Head
Surabaya Branch
Rudi PurwonoIndependent Commissioner
Experience
Airlangga University Lecturer
BNI Regional Chief Economist
Currently
Airlangga Univ Vice Dean
Payment Board East Java Gov
Regional Research Board Gov
Akhmad SukardiCommissioner
Experience
East Java Government
Currently
East Java
Regional Secretary
19
IR BJTM
Change of Director Structures
20
No Old Structures No New Structures
1 President Director 1 President Director
2 Medium amp Corporate Business Director 2 Medium amp Corporate Director
3 Operational Director 3 Operational Director
4 Agribusiness amp Sharia Business Director 4 Retail Consumer amp Sharia Business Director
5 Compliance Director 5 Compliance amp Human Capital Director
6 Risk Management Director
7 Finance Director
As a result of Bank Jatimrsquos Extraordinary General Meeting June 15th 2017
IR BJTM
Board of Directors
R SoerosoPresident Director
Experience
Corporate Secretary
Bank Jatim
President Director
Bank UMKM
Ferdian Timur S
Finance Director
Experience
Kepanjen Branch
Head
Corporate Secretary
Bank Jatim
Tony SudjiaryantoRetail Consumer amp
Sharia Business
Director
Experience
Credit Division Head
Special Credit Division
Head
Treasury Division Head
Bank Jatim
SuuacutediMedium amp Corporate
Director
Experience
IT Division Head
Planning Division
Head
Risk Management
Division Head
Bank Jatim
Rudie HardionoOperational
Director
Experience
Corporate
Secretary
Compliance
Director
Bank Jatim
21
Hadi Santoso Compliance amp
Human Capital
Director
Experience
Sharia Business Div
MediumampCorporate
Credit Div
Bank Jatim
Rizyana Mirda Risk Management
Director
Experience
Credit Risk Div
MediumampCorporate
Credit Div
Bank Jatim
Effective after pass OJKrsquos Fit and Proper Test
IR BJTM 22
Compliance amp Human Capital Directorbull Compliance amp GCG Divisionbull Law Divisionbull Human Capital Division
bull Competent human resources with sufficient amountbull Fund transaction activity and services which not
contradict with legalbull Determination of procedures inherent to the compliance
violantbull Workers productivity
Risk Management Directorbull Credit Risk Divisionbull Corporate Risk Management
Divisionbull Credit Rescue amp Completion
Division
bull Contribution Marginbull Delinquency rate 30+ days past due (DPD) for the main
products especially individual loan (loan quality)bull Classified Loanbull Recovery Ratebull Recovery Intracomptable dan Extracomptablebull Expansion and average volume of loan balance
Finance Directorbull Treasury Divisionbull Budget amp Financial
Controlling Divisionbull Strategic Planning amp
Management Performance Strategy Division
bull Market cap growth realizationbull Return after tax gainingbull Return on Equity (after tax)bull Finance Director Revenue included Total of Treasury
Revenue dan FI segmentbull Fee Based Income contributionbull Yield Portofolio Treasury
New Director Target
IR BJTM 23
SUBJECT STRATEGY
Optimizing Human Capital tosupport banking business
1 Evaluate human capital position structures
Accelerate staff and management development programs
Evaluating outsourcing and non career employee
Training and education to achieve target
2 Increase employee spiritual mental by religious event
Compliance Cultural Improving employee job desk understanding by socialization
Mitigation and managingcountermeasures of legal risk
1 Organize the implementation of development evaluation and
legal system application such as reviewing mou
2 Organize internal legal system to handle legal issues such as
legal assistance and legal opinion
3 Synergize and integrate managing process and law
implementation strategy to achieve legal issues optimal
resolution
Compliance amp Human Capital Director Current Strategies
IR BJTM 24
SUBJECT STRATEGY
Risk mitigation into activities new products or existing including 8 risks analysis
- Identify measure and evaluate all bank business risk- Giving early warning to right business sector for future lending
with stress testing all portfolio segment and products- Proactive customer visit to understand the condition directly
Minimize credit risk Improving the quality of whole credit portfolio which sustainable by providing correct analysis with credit scoring amp rating analysis
Credit Rescue amp Completion Division
- Lowering NPL1 Monitoring credit expansion2 Comprehensive collection3 Collateral auction4 Conduct bankcruptcy- Increase extracomptable collection by filtering potensial debtor
Risk Management Director Current Strategies
IR BJTM 25
SUBJECT STRATEGY
Bank Placement Interest IncomeICM provides a lower interest rate compared to time deposit
Strategy of optimizing short-term placements in time deposit
Securities interest incomeSecurities with high yield not optimal
Mid-term liquidity securities to be optimized to high yield securities
Treasury Marketing and SalesForeign exchange and bank note transaction still lowNot all branch actively sell foreign exchange and bank note
All branches required for foreign exchange and bank note transactions
Business-leading programs is constrained by the lack of competitive products
Take new pricing and leading products
Finance Director Current Strategies
IR BJTM
STRENGTH
26
IR BJTM 27
142157163174200
249291
331
380
525
429
516
46 55 74
101
131
161 186
223
262 287 297 305
120 132 137 145162
201222
260
303
446
328
422
04040505
090907
08094
118
103
148
0607 07 07 07
0809
08
12
134136
12
17 172 21
27 28 2933
41
4648 47
TOTAL ASSET (Rp Tril)
INTEREST INCOME (Rp Tril) INTEREST EXPENSE (Rp Tril)
CAGR =
857
CAGR =
1197
CAGR =
531
NET PROFIT (Rp Tril)
THIRD PARTY FUND(Rp Tril)
CAGR =
1006
LOAN (Rp Tril)
CAGR =
1699
CAGR =
1136
Compound Annual Growth Rate
2002 2003 2004 2005 2006 2007 2008 2009 2010 2011 2012 2013 2014 2015 2016 1H17
63
0
54
8
55
0
62
9
58
2
52
2
46
3
48
0
43
1
40
7
43
5
38
4
38
5
39
4
34
4
37
03
17
1
23
1
24
0
19
9
21
3
24
1
25
0
28
4
35
9
35
4
36
8
38
4
36
3
37
2
43
8
32
26
19
9
22
1
21
0
17
2
20
5
23
7
28
7
23
7
21
0
23
9
19
7
23
2
25
2
23
4
21
8
30
70
Current account Saving deposit Time deposit
453
300 253 302 318 321261 316 354 348
268 301368 363
256 301 284 278186 230 245
500
275239
310 328 331258
326381 371
267345
395 382
250277 297 288
181235 256
1H12 9M12 FY12 3M13 1H13 9M13 FY13 3M14 1H14 9M14 FY14 3M15 1H15 9M15 FY15 3M16 1H16 9M16 FY16 3M17 1H17
Cost of Fund(+) Local Government (-) Local Government
IR BJTM 28
Strength of Funding
Loan balance 5827 of total loan
NPL 031 as of June 2017
567 593 612 619 631 640 666 675 690 697 732 732 746
1H14 9M14 FY14 3M15 1H15 9M15 FY15 3M16 1H16 9M16 FY16 3M17 1H17
MULTIGUNA TICKET SIZE
13864 14408 14849 15152 15609 15794 15924 16117 16499 16672 17131 17117 17767
1H14 9M14 FY14 3M15 1H15 9M15 FY15 3M16 1H16 9M16 FY16 3M17 1H17
MULTIGUNA LOAN BALANCE
million Rp
billion Rp
IR BJTM 29
Strength of Loan (Multipurpose)
IR BJTM 30
No DATA June 2016 June 2017
1 Board of Commisioner 4 5
2 Board of Sharia Supervisory 3 3
3 Board of Director 5 5
4 Management 1 22 24
5 Management 2 97 98
6 Management 3 280 264
7 Management 4 697 746
8 Staff of Administration 1975 1963
9 Staff Non Administration 332 319
10 Non Permanent 1155 1045
11 Outsource 1920 1974
Total 6490 6446
Human Resources
IR BJTM
31
B Series Investor 1H16 1H17
Foreign Investor 6771 6064
Domestic Investor 3229 3936
No Country Share
1 INDONESIA 393565
2 AMERIKA 280926
3 FINLANDIA 73038
4 IRLANDIA 67525
5 NORWEGIA 49673
6 LUKSEMBURG 38169
7 INGGRIS 21608
8 KANADA 18517
9 JEPANG 12271
10 AUSTRALIA 10972
11 SAUDI ARABIA 08573
12 SWITSERLAND 06143
B Series Investor Composition
Ownership
(A Series)East Java
Government5136
(A Series)City amp
Municipal Government
2848
(B Series)Public
Domestic793
(B Series)Public Foreign
1222
Total 100
No Country Share
13 SINGAPURA 04906
14 BERMUDA 03550
15 THAILAND 03331
16 BELANDA 01807
17 KOREA SELATAN 01645
18 CAYMAN ISLAND 00896
19 HONGKONG 00844
20 SWEDIA 00725
21 JERMAN 00646
22 CINA 00400
23 MALAYSIA 00247
24 FILIPINA 00022
Total 100
IR BJTM32
Dividen amp Stock
Fiscal yearPayment of Dividend Cash Per Share (Rp)
Net ProfitDividen Payment
Ratio
2012 3974 72463931390899 818
2013 4061 82431181537019 7350
2014 4186 93908359225350 665
2015 4300 88570838014200 7242
2016 4364 102821627432600 6343
BJTM Price June 22 2017 IDR 665 share
PBV 136
EPS 9878
PER 673
Market Cap Rp 9939 bn
IR BJTM33
Competitive Products
No 1 BUMD Listed
Annual Report Award
Padmamitra Award Bank Jatim Regional Banks with
excellent service of the year
2016
Top BPD 2016 Active Role as Resi Gudang
Lending
IR BJTM 34
Award
The Higher Bank that Disbursing
FLPP Fund
IR BJTM
Investor Relations (IR)
Corporate Secretary
(031) 5310090 ext 469
Email irubankjatimcoid
IR Contact
35
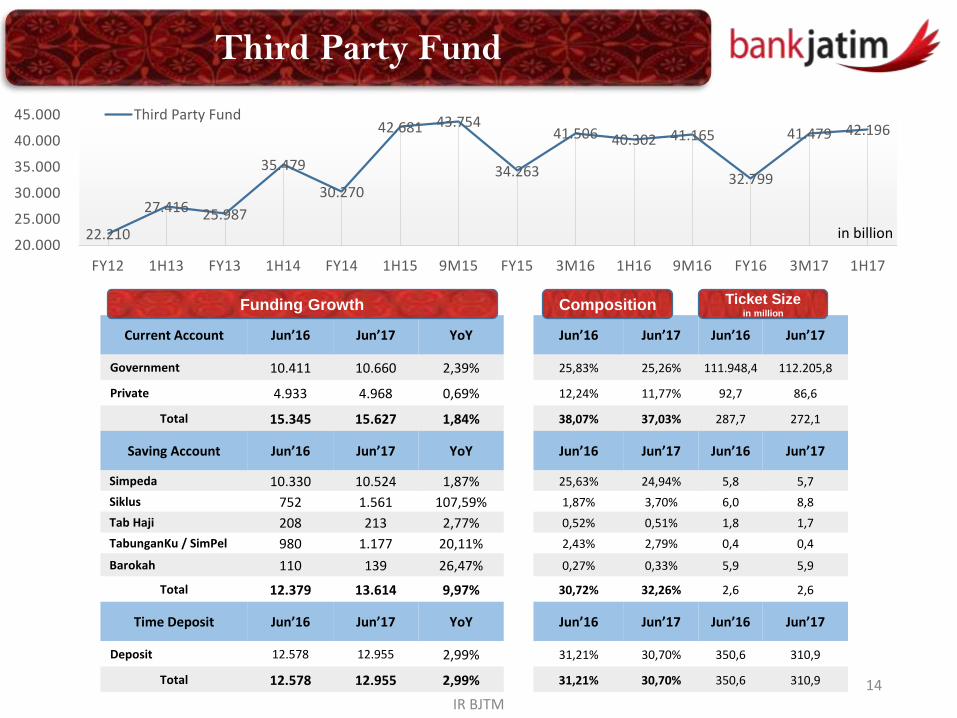
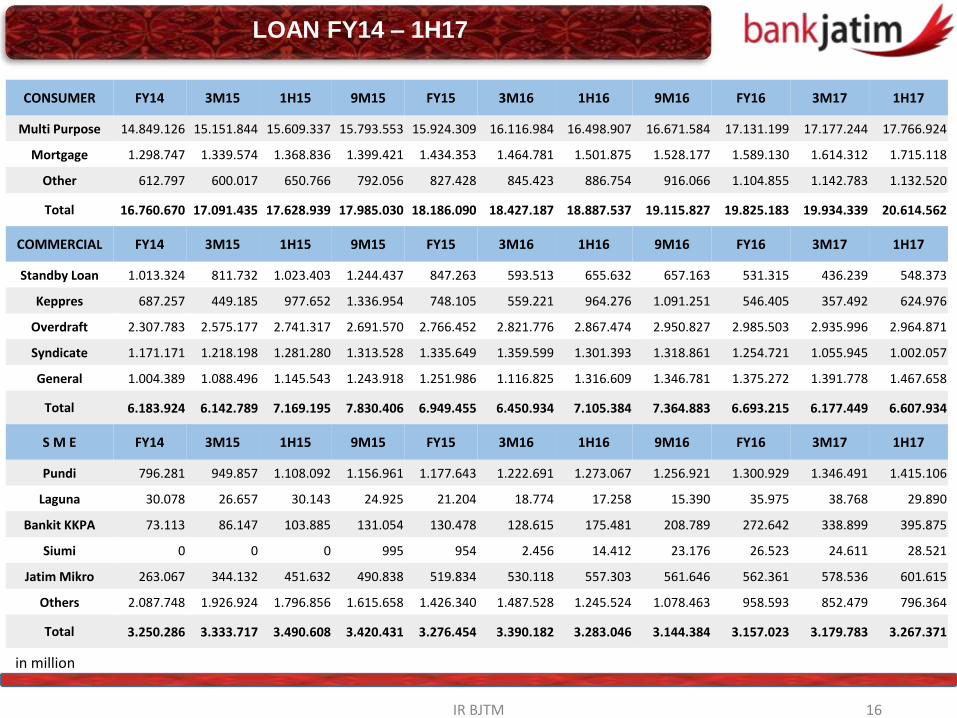
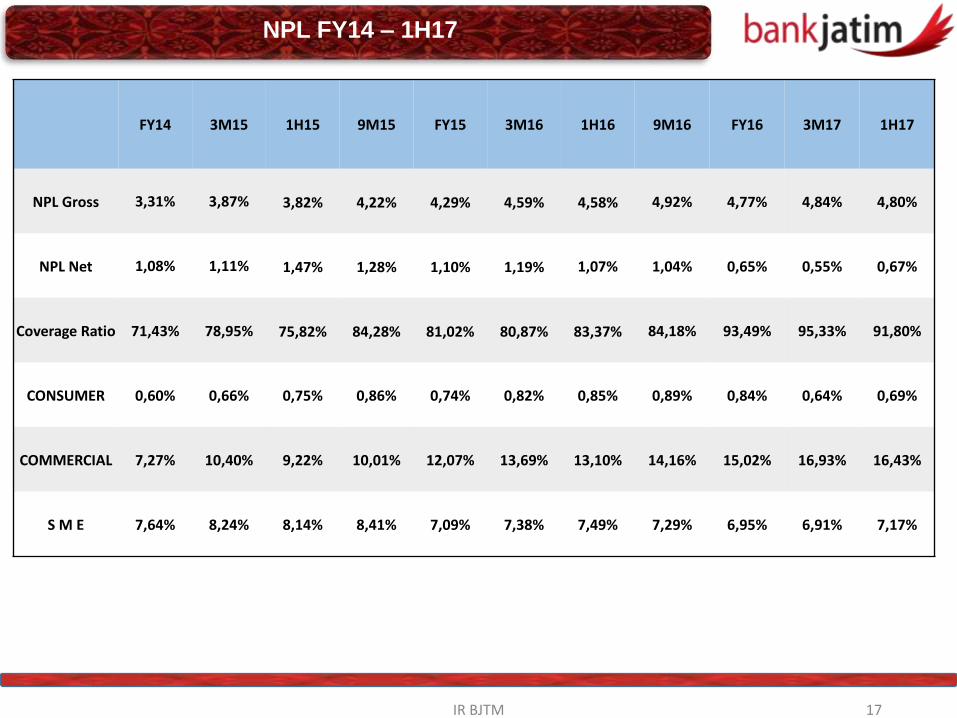

IR BJTM
Board of Directors
R SoerosoPresident Director
Experience
Corporate Secretary
Bank Jatim
President Director
Bank UMKM
Ferdian Timur S
Finance Director
Experience
Kepanjen Branch
Head
Corporate Secretary
Bank Jatim
Tony SudjiaryantoRetail Consumer amp
Sharia Business
Director
Experience
Credit Division Head
Special Credit Division
Head
Treasury Division Head
Bank Jatim
SuuacutediMedium amp Corporate
Director
Experience
IT Division Head
Planning Division
Head
Risk Management
Division Head
Bank Jatim
Rudie HardionoOperational
Director
Experience
Corporate
Secretary
Compliance
Director
Bank Jatim
21
Hadi Santoso Compliance amp
Human Capital
Director
Experience
Sharia Business Div
MediumampCorporate
Credit Div
Bank Jatim
Rizyana Mirda Risk Management
Director
Experience
Credit Risk Div
MediumampCorporate
Credit Div
Bank Jatim
Effective after pass OJKrsquos Fit and Proper Test
IR BJTM 22
Compliance amp Human Capital Directorbull Compliance amp GCG Divisionbull Law Divisionbull Human Capital Division
bull Competent human resources with sufficient amountbull Fund transaction activity and services which not
contradict with legalbull Determination of procedures inherent to the compliance
violantbull Workers productivity
Risk Management Directorbull Credit Risk Divisionbull Corporate Risk Management
Divisionbull Credit Rescue amp Completion
Division
bull Contribution Marginbull Delinquency rate 30+ days past due (DPD) for the main
products especially individual loan (loan quality)bull Classified Loanbull Recovery Ratebull Recovery Intracomptable dan Extracomptablebull Expansion and average volume of loan balance
Finance Directorbull Treasury Divisionbull Budget amp Financial
Controlling Divisionbull Strategic Planning amp
Management Performance Strategy Division
bull Market cap growth realizationbull Return after tax gainingbull Return on Equity (after tax)bull Finance Director Revenue included Total of Treasury
Revenue dan FI segmentbull Fee Based Income contributionbull Yield Portofolio Treasury
New Director Target
IR BJTM 23
SUBJECT STRATEGY
Optimizing Human Capital tosupport banking business
1 Evaluate human capital position structures
Accelerate staff and management development programs
Evaluating outsourcing and non career employee
Training and education to achieve target
2 Increase employee spiritual mental by religious event
Compliance Cultural Improving employee job desk understanding by socialization
Mitigation and managingcountermeasures of legal risk
1 Organize the implementation of development evaluation and
legal system application such as reviewing mou
2 Organize internal legal system to handle legal issues such as
legal assistance and legal opinion
3 Synergize and integrate managing process and law
implementation strategy to achieve legal issues optimal
resolution
Compliance amp Human Capital Director Current Strategies
IR BJTM 24
SUBJECT STRATEGY
Risk mitigation into activities new products or existing including 8 risks analysis
- Identify measure and evaluate all bank business risk- Giving early warning to right business sector for future lending
with stress testing all portfolio segment and products- Proactive customer visit to understand the condition directly
Minimize credit risk Improving the quality of whole credit portfolio which sustainable by providing correct analysis with credit scoring amp rating analysis
Credit Rescue amp Completion Division
- Lowering NPL1 Monitoring credit expansion2 Comprehensive collection3 Collateral auction4 Conduct bankcruptcy- Increase extracomptable collection by filtering potensial debtor
Risk Management Director Current Strategies
IR BJTM 25
SUBJECT STRATEGY
Bank Placement Interest IncomeICM provides a lower interest rate compared to time deposit
Strategy of optimizing short-term placements in time deposit
Securities interest incomeSecurities with high yield not optimal
Mid-term liquidity securities to be optimized to high yield securities
Treasury Marketing and SalesForeign exchange and bank note transaction still lowNot all branch actively sell foreign exchange and bank note
All branches required for foreign exchange and bank note transactions
Business-leading programs is constrained by the lack of competitive products
Take new pricing and leading products
Finance Director Current Strategies
IR BJTM
STRENGTH
26
IR BJTM 27
142157163174200
249291
331
380
525
429
516
46 55 74
101
131
161 186
223
262 287 297 305
120 132 137 145162
201222
260
303
446
328
422
04040505
090907
08094
118
103
148
0607 07 07 07
0809
08
12
134136
12
17 172 21
27 28 2933
41
4648 47
TOTAL ASSET (Rp Tril)
INTEREST INCOME (Rp Tril) INTEREST EXPENSE (Rp Tril)
CAGR =
857
CAGR =
1197
CAGR =
531
NET PROFIT (Rp Tril)
THIRD PARTY FUND(Rp Tril)
CAGR =
1006
LOAN (Rp Tril)
CAGR =
1699
CAGR =
1136
Compound Annual Growth Rate
2002 2003 2004 2005 2006 2007 2008 2009 2010 2011 2012 2013 2014 2015 2016 1H17
63
0
54
8
55
0
62
9
58
2
52
2
46
3
48
0
43
1
40
7
43
5
38
4
38
5
39
4
34
4
37
03
17
1
23
1
24
0
19
9
21
3
24
1
25
0
28
4
35
9
35
4
36
8
38
4
36
3
37
2
43
8
32
26
19
9
22
1
21
0
17
2
20
5
23
7
28
7
23
7
21
0
23
9
19
7
23
2
25
2
23
4
21
8
30
70
Current account Saving deposit Time deposit
453
300 253 302 318 321261 316 354 348
268 301368 363
256 301 284 278186 230 245
500
275239
310 328 331258
326381 371
267345
395 382
250277 297 288
181235 256
1H12 9M12 FY12 3M13 1H13 9M13 FY13 3M14 1H14 9M14 FY14 3M15 1H15 9M15 FY15 3M16 1H16 9M16 FY16 3M17 1H17
Cost of Fund(+) Local Government (-) Local Government
IR BJTM 28
Strength of Funding
Loan balance 5827 of total loan
NPL 031 as of June 2017
567 593 612 619 631 640 666 675 690 697 732 732 746
1H14 9M14 FY14 3M15 1H15 9M15 FY15 3M16 1H16 9M16 FY16 3M17 1H17
MULTIGUNA TICKET SIZE
13864 14408 14849 15152 15609 15794 15924 16117 16499 16672 17131 17117 17767
1H14 9M14 FY14 3M15 1H15 9M15 FY15 3M16 1H16 9M16 FY16 3M17 1H17
MULTIGUNA LOAN BALANCE
million Rp
billion Rp
IR BJTM 29
Strength of Loan (Multipurpose)
IR BJTM 30
No DATA June 2016 June 2017
1 Board of Commisioner 4 5
2 Board of Sharia Supervisory 3 3
3 Board of Director 5 5
4 Management 1 22 24
5 Management 2 97 98
6 Management 3 280 264
7 Management 4 697 746
8 Staff of Administration 1975 1963
9 Staff Non Administration 332 319
10 Non Permanent 1155 1045
11 Outsource 1920 1974
Total 6490 6446
Human Resources
IR BJTM
31
B Series Investor 1H16 1H17
Foreign Investor 6771 6064
Domestic Investor 3229 3936
No Country Share
1 INDONESIA 393565
2 AMERIKA 280926
3 FINLANDIA 73038
4 IRLANDIA 67525
5 NORWEGIA 49673
6 LUKSEMBURG 38169
7 INGGRIS 21608
8 KANADA 18517
9 JEPANG 12271
10 AUSTRALIA 10972
11 SAUDI ARABIA 08573
12 SWITSERLAND 06143
B Series Investor Composition
Ownership
(A Series)East Java
Government5136
(A Series)City amp
Municipal Government
2848
(B Series)Public
Domestic793
(B Series)Public Foreign
1222
Total 100
No Country Share
13 SINGAPURA 04906
14 BERMUDA 03550
15 THAILAND 03331
16 BELANDA 01807
17 KOREA SELATAN 01645
18 CAYMAN ISLAND 00896
19 HONGKONG 00844
20 SWEDIA 00725
21 JERMAN 00646
22 CINA 00400
23 MALAYSIA 00247
24 FILIPINA 00022
Total 100
IR BJTM32
Dividen amp Stock
Fiscal yearPayment of Dividend Cash Per Share (Rp)
Net ProfitDividen Payment
Ratio
2012 3974 72463931390899 818
2013 4061 82431181537019 7350
2014 4186 93908359225350 665
2015 4300 88570838014200 7242
2016 4364 102821627432600 6343
BJTM Price June 22 2017 IDR 665 share
PBV 136
EPS 9878
PER 673
Market Cap Rp 9939 bn
IR BJTM33
Competitive Products
No 1 BUMD Listed
Annual Report Award
Padmamitra Award Bank Jatim Regional Banks with
excellent service of the year
2016
Top BPD 2016 Active Role as Resi Gudang
Lending
IR BJTM 34
Award
The Higher Bank that Disbursing
FLPP Fund
IR BJTM
Investor Relations (IR)
Corporate Secretary
(031) 5310090 ext 469
Email irubankjatimcoid
IR Contact
35
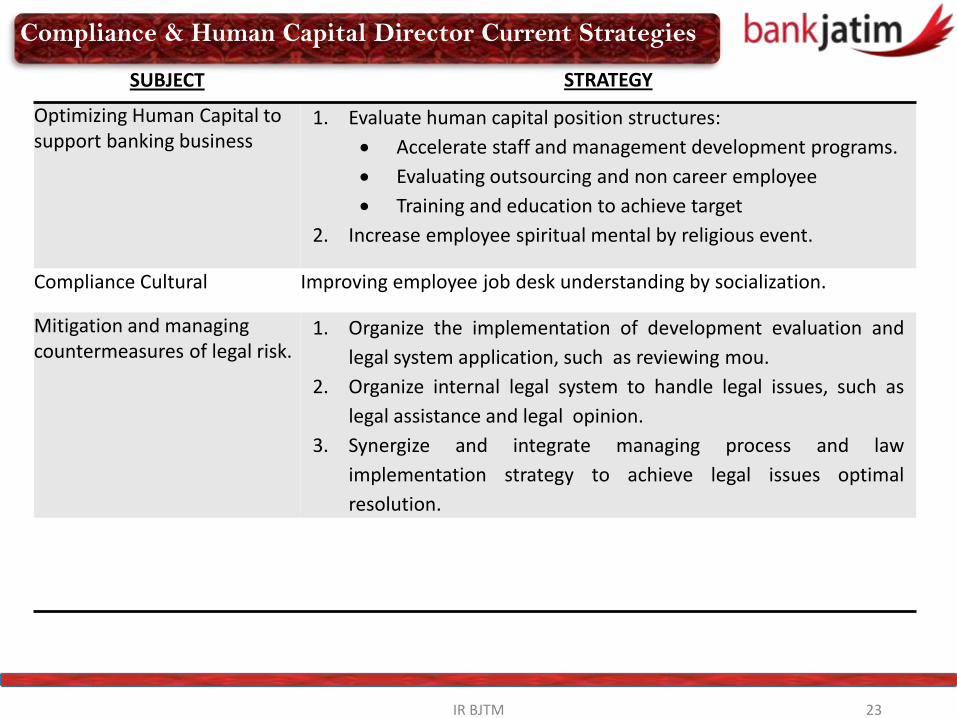

IR BJTM
STRENGTH
26
IR BJTM 27
142157163174200
249291
331
380
525
429
516
46 55 74
101
131
161 186
223
262 287 297 305
120 132 137 145162
201222
260
303
446
328
422
04040505
090907
08094
118
103
148
0607 07 07 07
0809
08
12
134136
12
17 172 21
27 28 2933
41
4648 47
TOTAL ASSET (Rp Tril)
INTEREST INCOME (Rp Tril) INTEREST EXPENSE (Rp Tril)
CAGR =
857
CAGR =
1197
CAGR =
531
NET PROFIT (Rp Tril)
THIRD PARTY FUND(Rp Tril)
CAGR =
1006
LOAN (Rp Tril)
CAGR =
1699
CAGR =
1136
Compound Annual Growth Rate
2002 2003 2004 2005 2006 2007 2008 2009 2010 2011 2012 2013 2014 2015 2016 1H17
63
0
54
8
55
0
62
9
58
2
52
2
46
3
48
0
43
1
40
7
43
5
38
4
38
5
39
4
34
4
37
03
17
1
23
1
24
0
19
9
21
3
24
1
25
0
28
4
35
9
35
4
36
8
38
4
36
3
37
2
43
8
32
26
19
9
22
1
21
0
17
2
20
5
23
7
28
7
23
7
21
0
23
9
19
7
23
2
25
2
23
4
21
8
30
70
Current account Saving deposit Time deposit
453
300 253 302 318 321261 316 354 348
268 301368 363
256 301 284 278186 230 245
500
275239
310 328 331258
326381 371
267345
395 382
250277 297 288
181235 256
1H12 9M12 FY12 3M13 1H13 9M13 FY13 3M14 1H14 9M14 FY14 3M15 1H15 9M15 FY15 3M16 1H16 9M16 FY16 3M17 1H17
Cost of Fund(+) Local Government (-) Local Government
IR BJTM 28
Strength of Funding
Loan balance 5827 of total loan
NPL 031 as of June 2017
567 593 612 619 631 640 666 675 690 697 732 732 746
1H14 9M14 FY14 3M15 1H15 9M15 FY15 3M16 1H16 9M16 FY16 3M17 1H17
MULTIGUNA TICKET SIZE
13864 14408 14849 15152 15609 15794 15924 16117 16499 16672 17131 17117 17767
1H14 9M14 FY14 3M15 1H15 9M15 FY15 3M16 1H16 9M16 FY16 3M17 1H17
MULTIGUNA LOAN BALANCE
million Rp
billion Rp
IR BJTM 29
Strength of Loan (Multipurpose)
IR BJTM 30
No DATA June 2016 June 2017
1 Board of Commisioner 4 5
2 Board of Sharia Supervisory 3 3
3 Board of Director 5 5
4 Management 1 22 24
5 Management 2 97 98
6 Management 3 280 264
7 Management 4 697 746
8 Staff of Administration 1975 1963
9 Staff Non Administration 332 319
10 Non Permanent 1155 1045
11 Outsource 1920 1974
Total 6490 6446
Human Resources
IR BJTM
31
B Series Investor 1H16 1H17
Foreign Investor 6771 6064
Domestic Investor 3229 3936
No Country Share
1 INDONESIA 393565
2 AMERIKA 280926
3 FINLANDIA 73038
4 IRLANDIA 67525
5 NORWEGIA 49673
6 LUKSEMBURG 38169
7 INGGRIS 21608
8 KANADA 18517
9 JEPANG 12271
10 AUSTRALIA 10972
11 SAUDI ARABIA 08573
12 SWITSERLAND 06143
B Series Investor Composition
Ownership
(A Series)East Java
Government5136
(A Series)City amp
Municipal Government
2848
(B Series)Public
Domestic793
(B Series)Public Foreign
1222
Total 100
No Country Share
13 SINGAPURA 04906
14 BERMUDA 03550
15 THAILAND 03331
16 BELANDA 01807
17 KOREA SELATAN 01645
18 CAYMAN ISLAND 00896
19 HONGKONG 00844
20 SWEDIA 00725
21 JERMAN 00646
22 CINA 00400
23 MALAYSIA 00247
24 FILIPINA 00022
Total 100
IR BJTM32
Dividen amp Stock
Fiscal yearPayment of Dividend Cash Per Share (Rp)
Net ProfitDividen Payment
Ratio
2012 3974 72463931390899 818
2013 4061 82431181537019 7350
2014 4186 93908359225350 665
2015 4300 88570838014200 7242
2016 4364 102821627432600 6343
BJTM Price June 22 2017 IDR 665 share
PBV 136
EPS 9878
PER 673
Market Cap Rp 9939 bn
IR BJTM33
Competitive Products
No 1 BUMD Listed
Annual Report Award
Padmamitra Award Bank Jatim Regional Banks with
excellent service of the year
2016
Top BPD 2016 Active Role as Resi Gudang
Lending
IR BJTM 34
Award
The Higher Bank that Disbursing
FLPP Fund
IR BJTM
Investor Relations (IR)
Corporate Secretary
(031) 5310090 ext 469
Email irubankjatimcoid
IR Contact
35
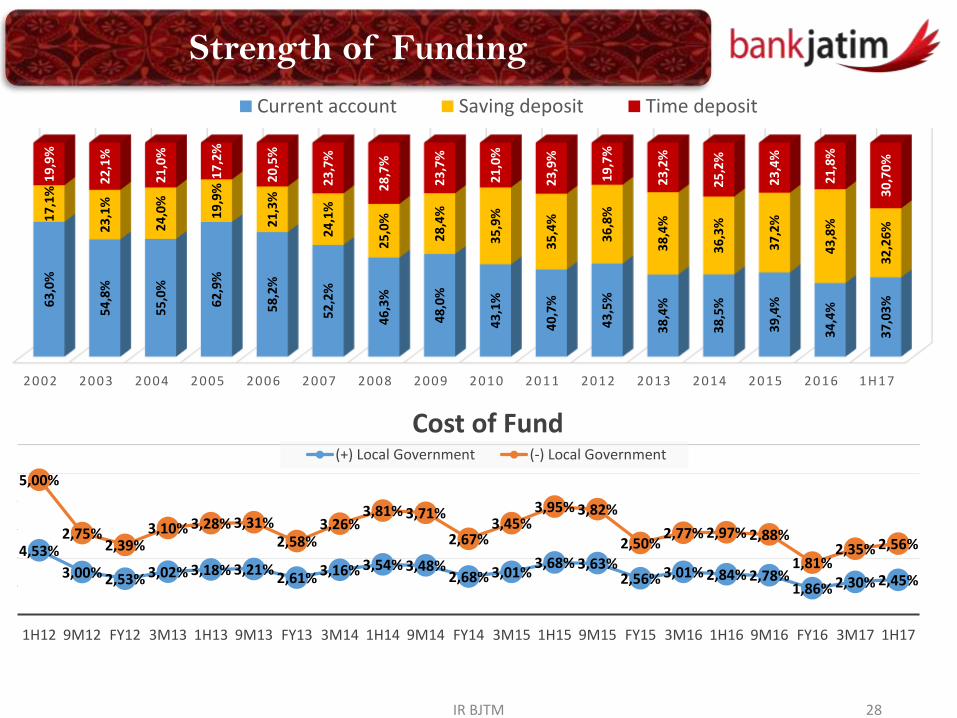
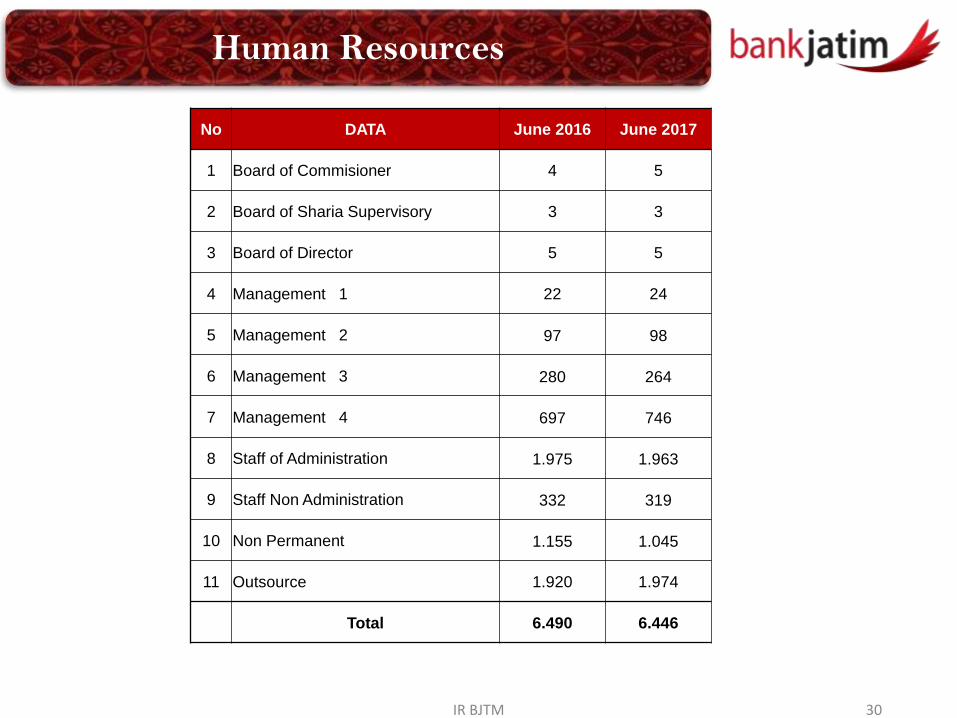
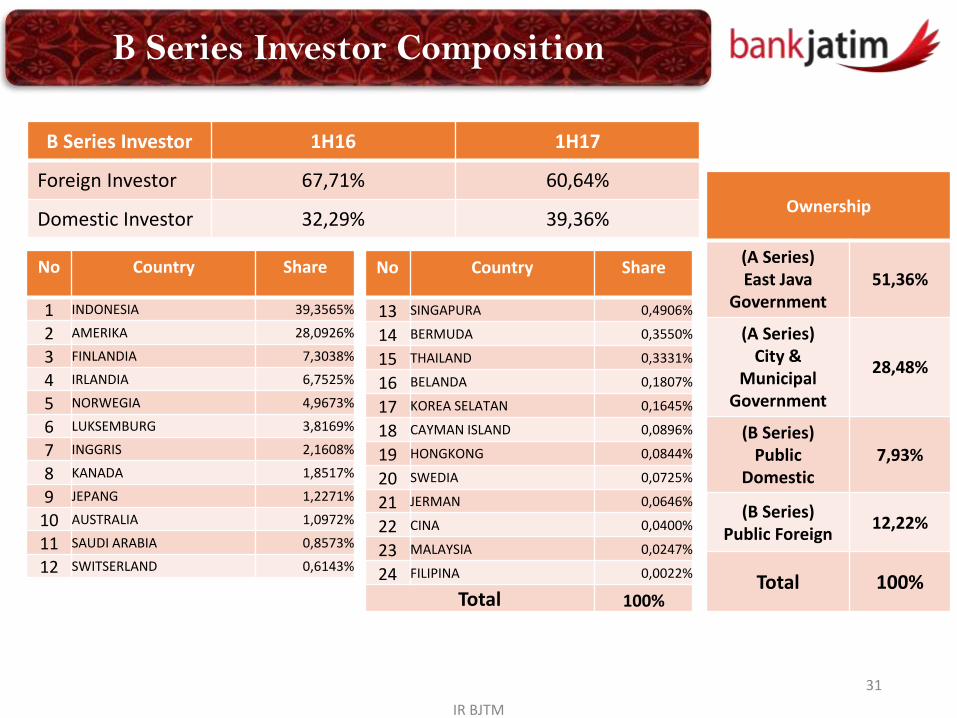
IR BJTM
31
B Series Investor 1H16 1H17
Foreign Investor 6771 6064
Domestic Investor 3229 3936
No Country Share
1 INDONESIA 393565
2 AMERIKA 280926
3 FINLANDIA 73038
4 IRLANDIA 67525
5 NORWEGIA 49673
6 LUKSEMBURG 38169
7 INGGRIS 21608
8 KANADA 18517
9 JEPANG 12271
10 AUSTRALIA 10972
11 SAUDI ARABIA 08573
12 SWITSERLAND 06143
B Series Investor Composition
Ownership
(A Series)East Java
Government5136
(A Series)City amp
Municipal Government
2848
(B Series)Public
Domestic793
(B Series)Public Foreign
1222
Total 100
No Country Share
13 SINGAPURA 04906
14 BERMUDA 03550
15 THAILAND 03331
16 BELANDA 01807
17 KOREA SELATAN 01645
18 CAYMAN ISLAND 00896
19 HONGKONG 00844
20 SWEDIA 00725
21 JERMAN 00646
22 CINA 00400
23 MALAYSIA 00247
24 FILIPINA 00022
Total 100
IR BJTM32
Dividen amp Stock
Fiscal yearPayment of Dividend Cash Per Share (Rp)
Net ProfitDividen Payment
Ratio
2012 3974 72463931390899 818
2013 4061 82431181537019 7350
2014 4186 93908359225350 665
2015 4300 88570838014200 7242
2016 4364 102821627432600 6343
BJTM Price June 22 2017 IDR 665 share
PBV 136
EPS 9878
PER 673
Market Cap Rp 9939 bn
IR BJTM33
Competitive Products
No 1 BUMD Listed
Annual Report Award
Padmamitra Award Bank Jatim Regional Banks with
excellent service of the year
2016
Top BPD 2016 Active Role as Resi Gudang
Lending
IR BJTM 34
Award
The Higher Bank that Disbursing
FLPP Fund
IR BJTM
Investor Relations (IR)
Corporate Secretary
(031) 5310090 ext 469
Email irubankjatimcoid
IR Contact
35
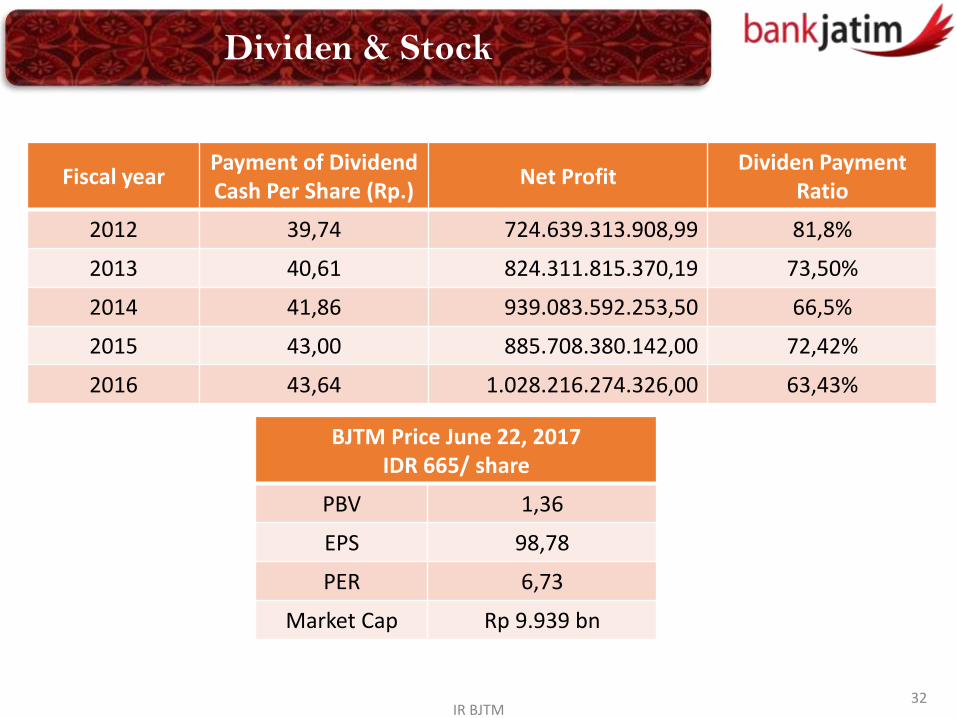

IR BJTM
Investor Relations (IR)
Corporate Secretary
(031) 5310090 ext 469
Email irubankjatimcoid
IR Contact
35