contact - my purchasing center · the gbta foundation, the education and research arm of the global...
TRANSCRIPT
2
The GBTA Foundation, the education and research arm of the Global Business Travel Association (GBTA), has commissioned Vantage Strategy, LLC to build the first-ever quarterly business travel outlook for the United States. Sponsored by Visa, Inc., the purpose is to provide corporate travel professionals and the broader business community insight into both short- and long-term trends in business travel volumes, spending, and inflation.
The Business Travel Quarterly Outlook – United States projects aggregate business travel trends over the next eight quarters. The report includes key buy-side metrics such as total business travel volume and spending, plus supply-side projections of changes in costs, across both transient and meetings travel. Business Travel Quarterly Outlook – 2011 Q1 United States is the third report in the series. Releases are published on the second Tuesday of each quarter(.
Vantage Strategy developed an econometric model to better inform the forecast process. The model explicitly relates measures of business trip volume and spending, sourced from D.K. Shifflet & Associates (www.dksa.com), to key economic and market drivers of business travel including:
U.S. Gross Domestic Product (GDP) and its components
U.S. Corporate Profits and Cash Flow
U.S. Employment & Unemployment
ISM Business Sentiment Index
Key Travel Components of CPI (airfare, lodging, food away from home, rental cars, fuel, transportation)
Hitwise® data (www.hitwise.com) analyzing Internet traffic to business-oriented travel Websites and to potential travel alternative sites such as GoToMeeting and WebEx
Productivity rates for business travel spending as a key business input to U.S. corporations
Supply variables such as the number of rooms, occupancy, available Seat Miles (ASM), and rental car fleet size from various travel information vendors and government/NGOs.
Another unique measure created for the Outlook is the GBTA/Visa Business Travel Index (BTI). This
index provides a way to distil recent market performance and the outlook for business travel into a
single metric that can be tracked over time. The BTI compares business travel spending activity
today and over the next eight quarters to levels achieved in 2005, a mid-expansion period also used as a
base year for many U.S. government statistics.
CONTACT:
Meghan Henning Communications & Public Relations GBTA 703-684-0836 ext. 133 [email protected]
Matt Flegal Public Relations Visa, Inc. 650-432-1139 [email protected]
3
Forecast Highlights
The 2011 Q1 Outlook for U.S-originated business travel1 continues to show projected growth across domestic transient and group meeting travel, as well and international travel. Additionally, the fourth quarter of 2010 showed the strongest, seasonally adjusted, quarter-over-quarter growth since the recession began. The recent growth in business travel and the near-term forecast have been bolstered by long-awaited gains in employment, better top-line sales results, and strong exports. Total Person-Trip volume fell by -0.6% in 2010 but total U.S spending on business travel grew by 3.2%. The outlook for 2011 calls for business travel spend to advance by 6.9% to $246 billion while total U.S trip volume will rise 3.2% to 446 million trips. We have revised our growth expectations for spending upward this quarter due to an improving macroeconomic environment and faster than expected advances in travel price inflation. Air fare hikes, oil price increases, and some ADR advances are combining to lift travel pricing slightly more than originally expected.
U.S. Economic Performance
The economy gathered momentum during the first quarter and the recovery showed encouraging signs of having switched over from being dependent upon policy help to finally being self-reinforcing. This welcome transition comes primarily from the long-overdue improvement in the labor market. The economic recovery still faces challenges, however, some that are carryovers from 2010 and others that have recently burst on to the scene. The March jobs numbers (+216,000) were a welcome sign of gathering strength and slight vindication to those that had been predicting more significant gains a few months ago. Private sector employment gains were actually stronger than the total implied. At +240,000 for the month, the private sector more than compensated for loses in government hiring (-14,000). Moreover, initial unemployment claims have continued to trend downward. This leading indicator of job growth had been pointing toward increased hiring for some time, but gains had been somewhat elusive until February. Leisure & Hospitality jobs advanced by 37,000 in March, after a revised gain of 48,000 the month before. Business travel growth is largely responsible for renewed hiring in this sector. Two other key drivers of business travel have also shown improvement during the first quarter –business activity and exports. Business activity and sentiment remain positive demonstrated through the performance of corporate profits, cash flow, business sentiment, and business investment spending indicators. Drivers of travel in their own right, these also point to increased hiring in the months ahead, yet another important travel driver. Exports have been a positive recovery story for well over a year. U.S. sales in overseas markets drives international travel and, specifically, premium travel. The U.S. dollar has been generally depreciating during 2010 and through the early part of this year,
1 Includes all U.S. domestic business travel plus outbound international trips
4
particularly once weighted against our key trading partners. This has made our goods and services less expensive overseas and driven the need for more international travel. The first quarter also brought some fresh challenges to our recovery. First, Middle East instability has quickly found its way into oil prices and, to a lesser extent, equity markets. A sustained condition of elevated oil prices runs the risk of reducing consumer incomes and constraining corporate profits. Moreover, rising oil prices quickly find their way into gasoline prices, air fares, and, eventually, hotel rates. There is currently about a $10 per bbl risk premium baked into the price. This equates to about a 0.2% reduction in GDP growth. The GBTA Foundation recently published a report covering three oil shock scenarios -$125, $150, $200/bbl and the likely impact on business travel2. Elevated oil prices were passed through the forecast process to analyze what might happen to business travel. The bottom line was that, while slowing growth in trips and spending, shocks of these magnitudes would not derail the economy or the expansion of business travel activity. The lower oil shock would trim about $5.8 billion, or 1.5%, out of travel spend and about 700,000 trips during 2012 & 2013. The $200/bbl scenario would take a greater toll, but the expected loss of $9 billion in spending and 2.7million trips is still not enough to reverse an upward overall trajectory. The earthquake, tsunami, and resulting nuclear power challenges faced in Japan have captivated world attention for a number of weeks. For the U.S. economy, the risk of supply interruptions of much-needed electronic and automotive parts is palpable. U.S. exports to Japanese markets may also slow. Add to these business risks the concern for employee safety and an interruption in outbound trips to Japan is to be expected. Still, the overall impact will be relatively small. There are some ongoing risks to the U.S. recovery worth noting. Housing markets have continued to be, in a word, abysmal. Conditions have actually deteriorated since our last Outlook report. Both existing and new home sales have continued to disappoint as nearly 40% of all sales still involve foreclosed or distressed properties. This has stalled any rebound in housing prices and virtually removes any incentive for builders to get back in the game. The answer is a sustained period of job growth coupled with low mortgage rates and this will take time. Unfortunately, housing market recovery is rapidly becoming a topic for 2012 and beyond. Unfolding conditions in the Middle East and Japan have taken attention away from another existing risk –European sovereign debt conditions. Greece, Ireland, and Portugal are not yet out of the woods. Moreover, Spain and Italy remain at the precipice. Debt crises and resulting bail out efforts will weaken the U.S. and European recoveries both through the effect on global equity prices and sharply reduced prospect for exports. The last existing risk of note is inflation. Monetary stimulus in the U.S. coupled with rising oil prices and increased consumer and business spending has rekindled fears of accelerating price inflation. Indeed, food and energy prices have been up sharply in
2 Oil Shock Scenarios: What Does Triple Digit Oil Mean for U.S. Business Travel?, Global Business Travel Association Foundation, March 2011.
5
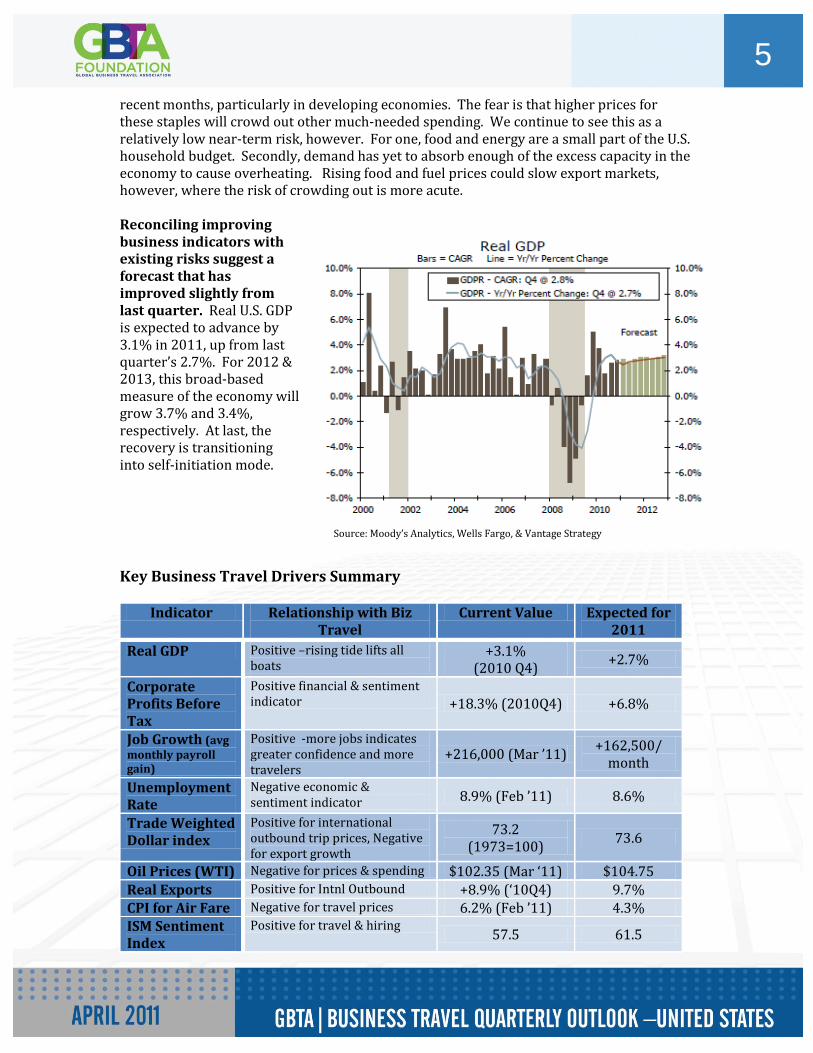
recent months, particularly in developing economies. The fear is that higher prices for these staples will crowd out other much-needed spending. We continue to see this as a relatively low near-term risk, however. For one, food and energy are a small part of the U.S. household budget. Secondly, demand has yet to absorb enough of the excess capacity in the economy to cause overheating. Rising food and fuel prices could slow export markets, however, where the risk of crowding out is more acute. Reconciling improving business indicators with existing risks suggest a forecast that has improved slightly from last quarter. Real U.S. GDP is expected to advance by 3.1% in 2011, up from last quarter’s 2.7%. For 2012 & 2013, this broad-based measure of the economy will grow 3.7% and 3.4%, respectively. At last, the recovery is transitioning into self-initiation mode.
Key Business Travel Drivers Summary
Indicator Relationship with Biz Travel
Current Value Expected for 2011
Real GDP Positive –rising tide lifts all boats
+3.1% (2010 Q4)
+2.7%
Corporate Profits Before Tax
Positive financial & sentiment indicator +18.3% (2010Q4) +6.8%
Job Growth (avg monthly payroll gain)
Positive -more jobs indicates greater confidence and more travelers
+216,000 (Mar ’11) +162,500/
month
Unemployment Rate
Negative economic & sentiment indicator 8.9% (Feb ’11) 8.6%
Trade Weighted Dollar index
Positive for international outbound trip prices, Negative for export growth
73.2 (1973=100)
73.6
Oil Prices (WTI) Negative for prices & spending $102.35 (Mar ‘11) $104.75 Real Exports Positive for Intnl Outbound +8.9% (‘10Q4) 9.7% CPI for Air Fare Negative for travel prices 6.2% (Feb ’11) 4.3% ISM Sentiment Index
Positive for travel & hiring 57.5 61.5
Source: Moody’s Analytics, Wells Fargo, & Vantage Strategy
6
Business Travel Performance
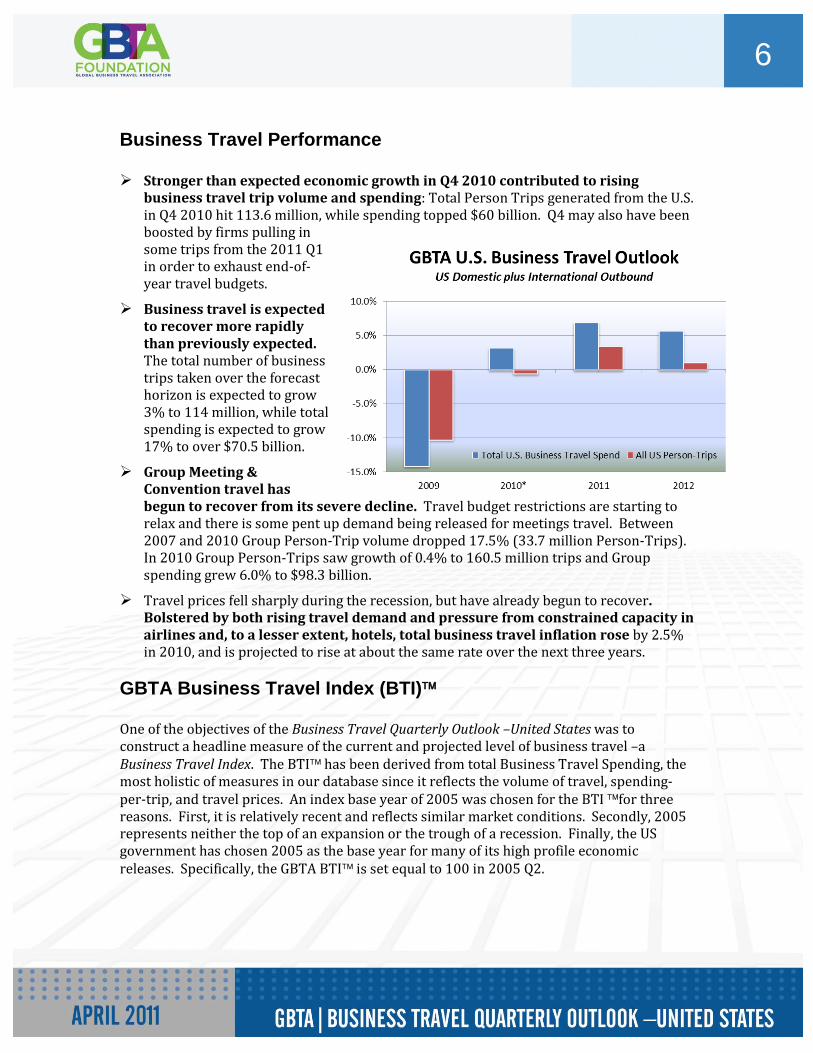
Stronger than expected economic growth in Q4 2010 contributed to rising
business travel trip volume and spending: Total Person Trips generated from the U.S. in Q4 2010 hit 113.6 million, while spending topped $60 billion. Q4 may also have been boosted by firms pulling in some trips from the 2011 Q1 in order to exhaust end-of-year travel budgets.
Business travel is expected to recover more rapidly than previously expected. The total number of business trips taken over the forecast horizon is expected to grow 3% to 114 million, while total spending is expected to grow 17% to over $70.5 billion.
Group Meeting & Convention travel has begun to recover from its severe decline. Travel budget restrictions are starting to relax and there is some pent up demand being released for meetings travel. Between 2007 and 2010 Group Person-Trip volume dropped 17.5% (33.7 million Person-Trips). In 2010 Group Person-Trips saw growth of 0.4% to 160.5 million trips and Group spending grew 6.0% to $98.3 billion.
Travel prices fell sharply during the recession, but have already begun to recover. Bolstered by both rising travel demand and pressure from constrained capacity in airlines and, to a lesser extent, hotels, total business travel inflation rose by 2.5% in 2010, and is projected to rise at about the same rate over the next three years.
GBTA Business Travel Index (BTI)
One of the objectives of the Business Travel Quarterly Outlook –United States was to construct a headline measure of the current and projected level of business travel –a Business Travel Index. The BTI has been derived from total Business Travel Spending, the most holistic of measures in our database since it reflects the volume of travel, spending-per-trip, and travel prices. An index base year of 2005 was chosen for the BTI for three reasons. First, it is relatively recent and reflects similar market conditions. Secondly, 2005 represents neither the top of an expansion or the trough of a recession. Finally, the US government has chosen 2005 as the base year for many of its high profile economic releases. Specifically, the GBTA BTI is set equal to 100 in 2005 Q2.
7
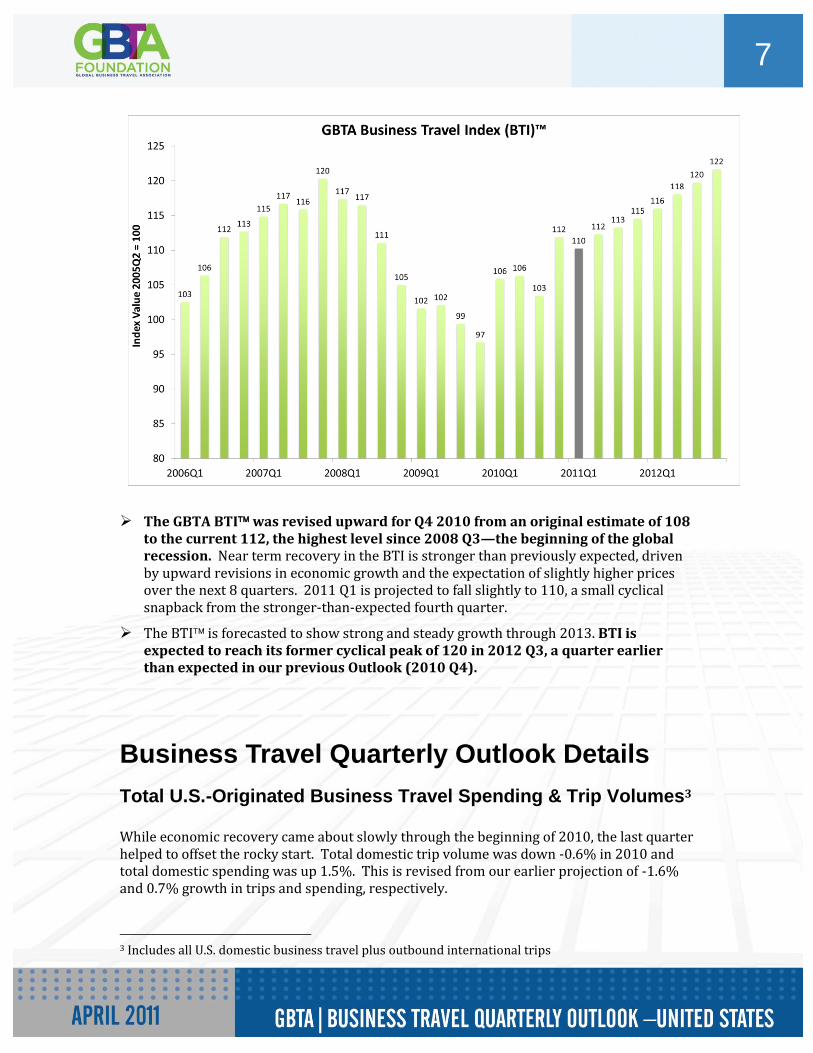
The GBTA BTI was revised upward for Q4 2010 from an original estimate of 108 to the current 112, the highest level since 2008 Q3—the beginning of the global recession. Near term recovery in the BTI is stronger than previously expected, driven by upward revisions in economic growth and the expectation of slightly higher prices over the next 8 quarters. 2011 Q1 is projected to fall slightly to 110, a small cyclical snapback from the stronger-than-expected fourth quarter.
The BTI is forecasted to show strong and steady growth through 2013. BTI is expected to reach its former cyclical peak of 120 in 2012 Q3, a quarter earlier than expected in our previous Outlook (2010 Q4).
Business Travel Quarterly Outlook Details
Total U.S.-Originated Business Travel Spending & Trip Volumes3 While economic recovery came about slowly through the beginning of 2010, the last quarter helped to offset the rocky start. Total domestic trip volume was down -0.6% in 2010 and total domestic spending was up 1.5%. This is revised from our earlier projection of -1.6% and 0.7% growth in trips and spending, respectively.
3 Includes all U.S. domestic business travel plus outbound international trips
8
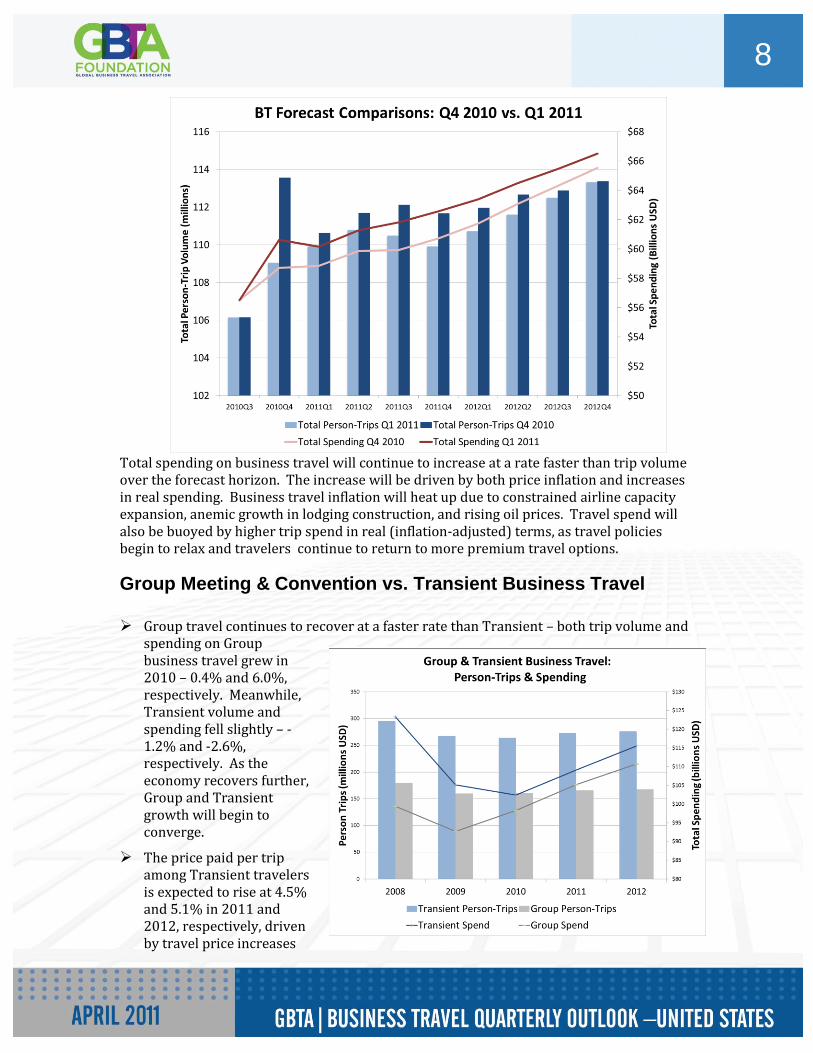
Total spending on business travel will continue to increase at a rate faster than trip volume over the forecast horizon. The increase will be driven by both price inflation and increases in real spending. Business travel inflation will heat up due to constrained airline capacity expansion, anemic growth in lodging construction, and rising oil prices. Travel spend will also be buoyed by higher trip spend in real (inflation-adjusted) terms, as travel policies begin to relax and travelers continue to return to more premium travel options.
Group Meeting & Convention vs. Transient Business Travel
Group travel continues to recover at a faster rate than Transient – both trip volume and
spending on Group business travel grew in 2010 – 0.4% and 6.0%, respectively. Meanwhile, Transient volume and spending fell slightly – -1.2% and -2.6%, respectively. As the economy recovers further, Group and Transient growth will begin to converge.
The price paid per trip among Transient travelers is expected to rise at 4.5% and 5.1% in 2011 and 2012, respectively, driven by travel price increases
9
and corporate premium travel restrictions being relaxed as the economy improves.
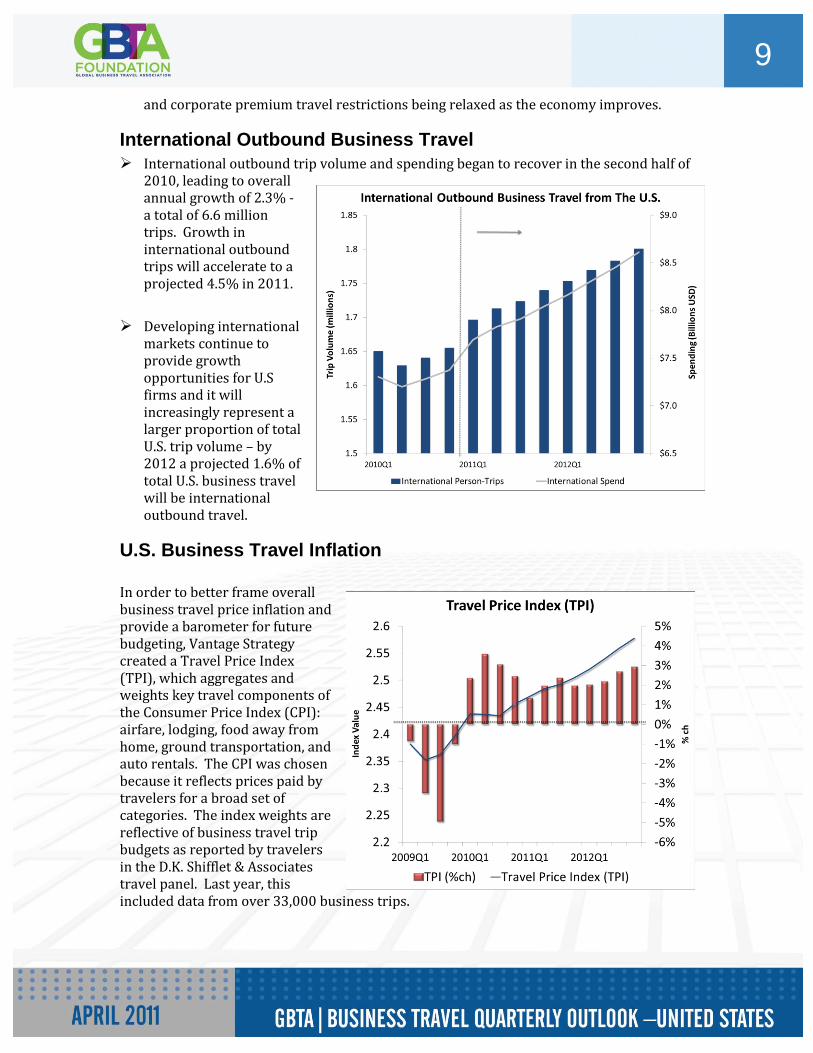
International Outbound Business Travel International outbound trip volume and spending began to recover in the second half of
2010, leading to overall annual growth of 2.3% - a total of 6.6 million trips. Growth in international outbound trips will accelerate to a projected 4.5% in 2011.
Developing international
markets continue to provide growth opportunities for U.S firms and it will increasingly represent a larger proportion of total U.S. trip volume – by 2012 a projected 1.6% of total U.S. business travel will be international outbound travel.
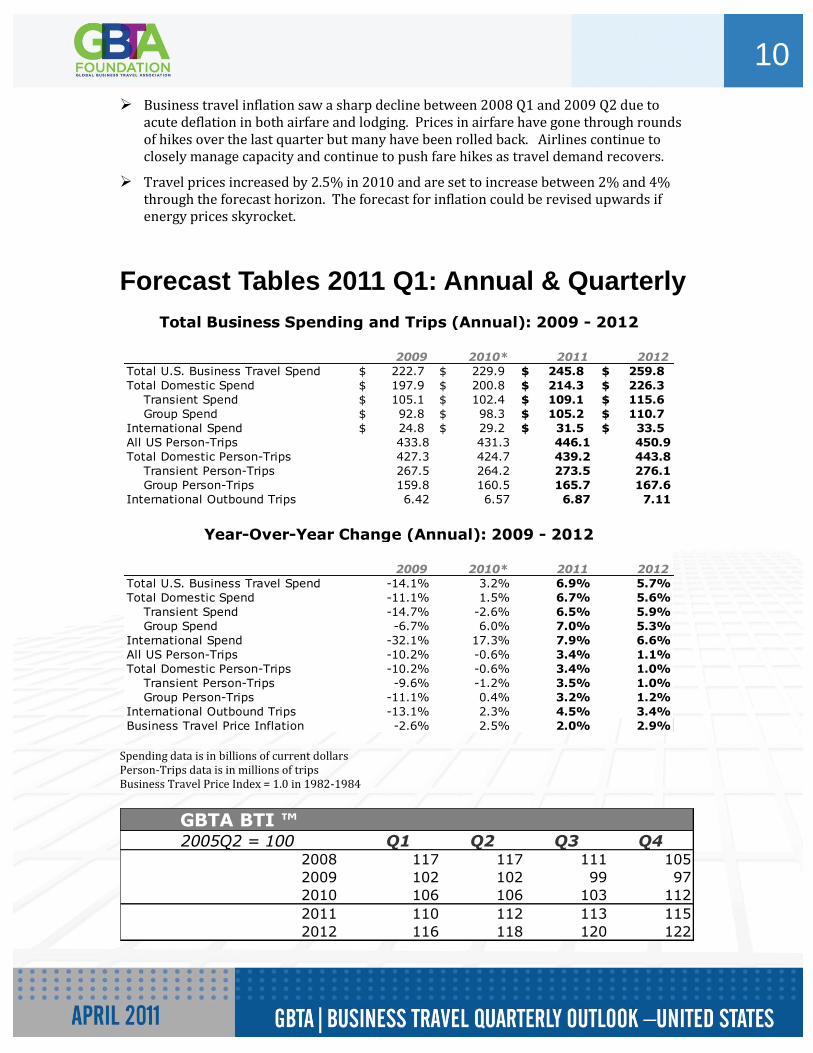
U.S. Business Travel Inflation
In order to better frame overall business travel price inflation and provide a barometer for future budgeting, Vantage Strategy created a Travel Price Index (TPI), which aggregates and weights key travel components of the Consumer Price Index (CPI): airfare, lodging, food away from home, ground transportation, and auto rentals. The CPI was chosen because it reflects prices paid by travelers for a broad set of categories. The index weights are reflective of business travel trip budgets as reported by travelers in the D.K. Shifflet & Associates travel panel. Last year, this included data from over 33,000 business trips.
10
Business travel inflation saw a sharp decline between 2008 Q1 and 2009 Q2 due to acute deflation in both airfare and lodging. Prices in airfare have gone through rounds of hikes over the last quarter but many have been rolled back. Airlines continue to closely manage capacity and continue to push fare hikes as travel demand recovers.
Travel prices increased by 2.5% in 2010 and are set to increase between 2% and 4% through the forecast horizon. The forecast for inflation could be revised upwards if energy prices skyrocket.
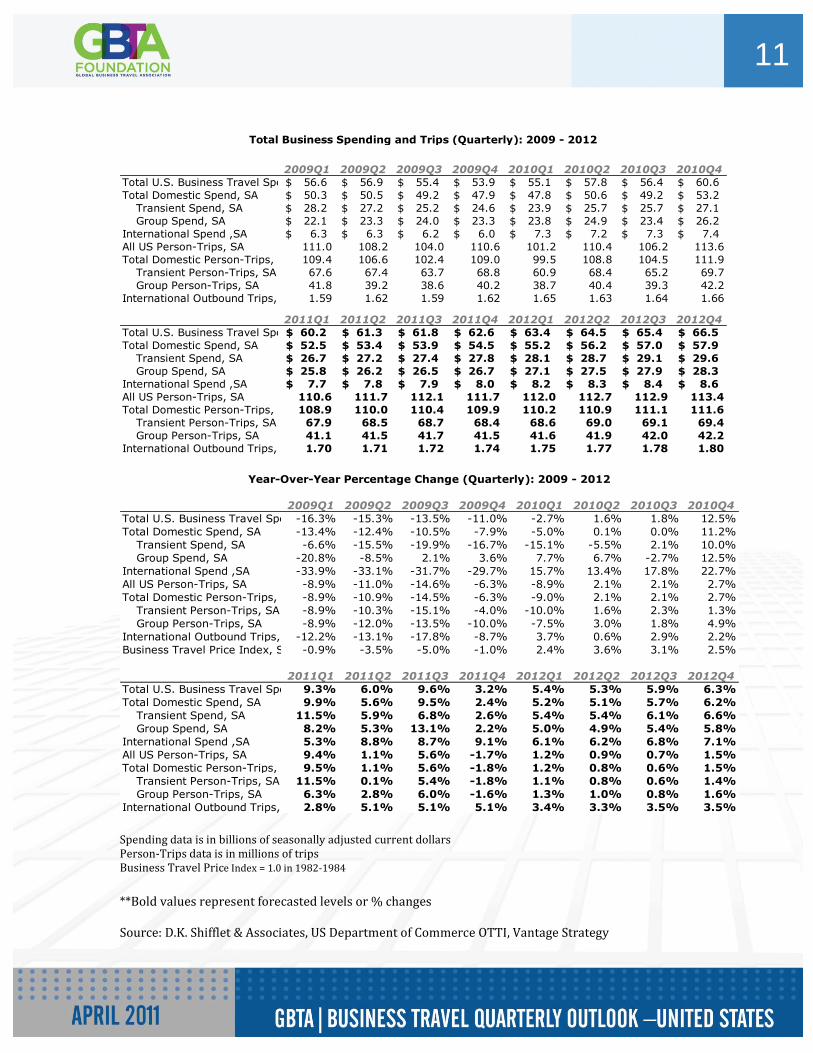
Forecast Tables 2011 Q1: Annual & Quarterly
2009 2010* 2011 2012
Total U.S. Business Travel Spend 222.7$ 229.9$ 245.8$ 259.8$
Total Domestic Spend 197.9$ 200.8$ 214.3$ 226.3$
Transient Spend 105.1$ 102.4$ 109.1$ 115.6$
Group Spend 92.8$ 98.3$ 105.2$ 110.7$
International Spend 24.8$ 29.2$ 31.5$ 33.5$
All US Person-Trips 433.8 431.3 446.1 450.9
Total Domestic Person-Trips 427.3 424.7 439.2 443.8
Transient Person-Trips 267.5 264.2 273.5 276.1
Group Person-Trips 159.8 160.5 165.7 167.6
International Outbound Trips 6.42 6.57 6.87 7.11
2009 2010* 2011 2012
Total U.S. Business Travel Spend -14.1% 3.2% 6.9% 5.7%
Total Domestic Spend -11.1% 1.5% 6.7% 5.6%
Transient Spend -14.7% -2.6% 6.5% 5.9%
Group Spend -6.7% 6.0% 7.0% 5.3%
International Spend -32.1% 17.3% 7.9% 6.6%
All US Person-Trips -10.2% -0.6% 3.4% 1.1%
Total Domestic Person-Trips -10.2% -0.6% 3.4% 1.0%
Transient Person-Trips -9.6% -1.2% 3.5% 1.0%
Group Person-Trips -11.1% 0.4% 3.2% 1.2%
International Outbound Trips -13.1% 2.3% 4.5% 3.4%
Business Travel Price Inflation -2.6% 2.5% 2.0% 2.9%
Year-Over-Year Change (Annual): 2009 - 2012
Total Business Spending and Trips (Annual): 2009 - 2012
Spending data is in billions of current dollars Person-Trips data is in millions of trips Business Travel Price Index = 1.0 in 1982-1984
GBTA BTI ™2005Q2 = 100 Q1 Q2 Q3 Q4
2008 117 117 111 105
2009 102 102 99 97
2010 106 106 103 112
2011 110 112 113 115
2012 116 118 120 122
11
2009Q1 2009Q2 2009Q3 2009Q4 2010Q1 2010Q2 2010Q3 2010Q4
Total U.S. Business Travel Spend, SA56.6$ 56.9$ 55.4$ 53.9$ 55.1$ 57.8$ 56.4$ 60.6$
Total Domestic Spend, SA 50.3$ 50.5$ 49.2$ 47.9$ 47.8$ 50.6$ 49.2$ 53.2$
Transient Spend, SA 28.2$ 27.2$ 25.2$ 24.6$ 23.9$ 25.7$ 25.7$ 27.1$
Group Spend, SA 22.1$ 23.3$ 24.0$ 23.3$ 23.8$ 24.9$ 23.4$ 26.2$
International Spend ,SA 6.3$ 6.3$ 6.2$ 6.0$ 7.3$ 7.2$ 7.3$ 7.4$
All US Person-Trips, SA 111.0 108.2 104.0 110.6 101.2 110.4 106.2 113.6
Total Domestic Person-Trips, SA 109.4 106.6 102.4 109.0 99.5 108.8 104.5 111.9
Transient Person-Trips, SA 67.6 67.4 63.7 68.8 60.9 68.4 65.2 69.7
Group Person-Trips, SA 41.8 39.2 38.6 40.2 38.7 40.4 39.3 42.2
International Outbound Trips, SA 1.59 1.62 1.59 1.62 1.65 1.63 1.64 1.66
2011Q1 2011Q2 2011Q3 2011Q4 2012Q1 2012Q2 2012Q3 2012Q4
Total U.S. Business Travel Spend, SA60.2$ 61.3$ 61.8$ 62.6$ 63.4$ 64.5$ 65.4$ 66.5$
Total Domestic Spend, SA 52.5$ 53.4$ 53.9$ 54.5$ 55.2$ 56.2$ 57.0$ 57.9$
Transient Spend, SA 26.7$ 27.2$ 27.4$ 27.8$ 28.1$ 28.7$ 29.1$ 29.6$
Group Spend, SA 25.8$ 26.2$ 26.5$ 26.7$ 27.1$ 27.5$ 27.9$ 28.3$
International Spend ,SA 7.7$ 7.8$ 7.9$ 8.0$ 8.2$ 8.3$ 8.4$ 8.6$
All US Person-Trips, SA 110.6 111.7 112.1 111.7 112.0 112.7 112.9 113.4
Total Domestic Person-Trips, SA 108.9 110.0 110.4 109.9 110.2 110.9 111.1 111.6
Transient Person-Trips, SA 67.9 68.5 68.7 68.4 68.6 69.0 69.1 69.4
Group Person-Trips, SA 41.1 41.5 41.7 41.5 41.6 41.9 42.0 42.2
International Outbound Trips, SA 1.70 1.71 1.72 1.74 1.75 1.77 1.78 1.80
Total Business Spending and Trips (Quarterly): 2009 - 2012
2009Q1 2009Q2 2009Q3 2009Q4 2010Q1 2010Q2 2010Q3 2010Q4
Total U.S. Business Travel Spend, SA-16.3% -15.3% -13.5% -11.0% -2.7% 1.6% 1.8% 12.5%
Total Domestic Spend, SA -13.4% -12.4% -10.5% -7.9% -5.0% 0.1% 0.0% 11.2%
Transient Spend, SA -6.6% -15.5% -19.9% -16.7% -15.1% -5.5% 2.1% 10.0%
Group Spend, SA -20.8% -8.5% 2.1% 3.6% 7.7% 6.7% -2.7% 12.5%
International Spend ,SA -33.9% -33.1% -31.7% -29.7% 15.7% 13.4% 17.8% 22.7%
All US Person-Trips, SA -8.9% -11.0% -14.6% -6.3% -8.9% 2.1% 2.1% 2.7%
Total Domestic Person-Trips, SA -8.9% -10.9% -14.5% -6.3% -9.0% 2.1% 2.1% 2.7%
Transient Person-Trips, SA -8.9% -10.3% -15.1% -4.0% -10.0% 1.6% 2.3% 1.3%
Group Person-Trips, SA -8.9% -12.0% -13.5% -10.0% -7.5% 3.0% 1.8% 4.9%
International Outbound Trips, SA-12.2% -13.1% -17.8% -8.7% 3.7% 0.6% 2.9% 2.2%
Business Travel Price Index, SA -0.9% -3.5% -5.0% -1.0% 2.4% 3.6% 3.1% 2.5%
2011Q1 2011Q2 2011Q3 2011Q4 2012Q1 2012Q2 2012Q3 2012Q4
Total U.S. Business Travel Spend, SA9.3% 6.0% 9.6% 3.2% 5.4% 5.3% 5.9% 6.3%
Total Domestic Spend, SA 9.9% 5.6% 9.5% 2.4% 5.2% 5.1% 5.7% 6.2%
Transient Spend, SA 11.5% 5.9% 6.8% 2.6% 5.4% 5.4% 6.1% 6.6%
Group Spend, SA 8.2% 5.3% 13.1% 2.2% 5.0% 4.9% 5.4% 5.8%
International Spend ,SA 5.3% 8.8% 8.7% 9.1% 6.1% 6.2% 6.8% 7.1%
All US Person-Trips, SA 9.4% 1.1% 5.6% -1.7% 1.2% 0.9% 0.7% 1.5%
Total Domestic Person-Trips, SA 9.5% 1.1% 5.6% -1.8% 1.2% 0.8% 0.6% 1.5%
Transient Person-Trips, SA 11.5% 0.1% 5.4% -1.8% 1.1% 0.8% 0.6% 1.4%
Group Person-Trips, SA 6.3% 2.8% 6.0% -1.6% 1.3% 1.0% 0.8% 1.6%
International Outbound Trips, SA 2.8% 5.1% 5.1% 5.1% 3.4% 3.3% 3.5% 3.5%
Year-Over-Year Percentage Change (Quarterly): 2009 - 2012
Spending data is in billions of seasonally adjusted current dollars Person-Trips data is in millions of trips Business Travel Price Index = 1.0 in 1982-1984
**Bold values represent forecasted levels or % changes Source: D.K. Shifflet & Associates, US Department of Commerce OTTI, Vantage Strategy