copyright © 2006, the geological society of america, inc ......in this model, material enters and...
TRANSCRIPT

Geological Society of America 3300 Penrose Place
P.O. Box 9140 Boulder, CO 80301
(303) 447-2020 • fax 303-357-1073 www.geosociety.org
This PDF file is subject to the following conditions and restrictions: Copyright © 2006, The Geological Society of America, Inc. (GSA). All rights reserved. Copyright not claimed on content prepared wholly by U.S. government employees within scope of their employment. Individual scientists are hereby granted permission, without fees or further requests to GSA, to use a single figure, a single table, and/or a brief paragraph of text in other subsequent works and to make unlimited copies for noncommercial use in classrooms to further education and science. For any other use, contact Copyright Permissions, GSA, P.O. Box 9140, Boulder, CO 80301-9140, USA, fax 303-357-1073, [email protected]. GSA provides this and other forums for the presentation of diverse opinions and positions by scientists worldwide, regardless of their race, citizenship, gender, religion, or political viewpoint. Opinions presented in this publication do not reflect official positions of the Society.

241
Stolar, D.B., Willett, S.D., and Roe, G.H., 2006, Climatic and tectonic forcing of a critical orogen, in Willett, S.D., Hovius, N., Brandon, M.T., and Fisher, D.M., eds., Tectonics, Climate, and Landscape Evolution: Geological Society of America Special Paper 398, Penrose Conference Series, p. 241–250, doi: 10.1130/2006.2398(14). For permission to copy, contact [email protected]. ©2006 Geological Society of America.
Geological Society of AmericaSpecial Paper 398
2006
Climatic and tectonic forcing of a critical orogenDrew B. Stolar†
Sean D. WillettGerard H. Roe
Department of Earth and Space Sciences, University of Washington, Seattle, Washington 98195, USA
ABSTRACT
Critical wedge theory provides a direct link between the form of an orogen, the rate of orogen evolution, and the accretionary and erosional fluxes that promote oro-gen growth and decay, respectively. We explore several fundamental characteristics of an eroding critical orogen: (1) the sensitivity of steady-state orogen size to tectonic and climatic forcing, (2) the response time of a critical orogen to perturbations in forc-ing, and (3) the behavior of surface topography and the rock uplift field in a system in which they are not prescribed. To do this, we develop a numerical model that couples a two-dimensional, planform surface erosion model with a two-dimensional, plane-strain finite element model of deformation. We first present a base model in which a critical orogen evolves to a steady-state under boundary conditions similar to those of analog sandbox experiments. We find that mean topography and tectonic uplift reach steady states, whereas planform topography remains dynamic throughout the simula-tion. From a suite of simulations, we determine the steady-state scaling relationship between orogen size and tectonic and climatic forcing and find good agreement with predictions from one-dimensional models. In addition, we examine the response of the steady-state orogen to climatic and tectonic perturbation with four simulations in which changes in tectonic and climatic conditions lead to either growth or contraction of the orogen to a new steady state. We show that the response time to perturbation agrees well with predictions from a one-dimensional semi-analytical model. We find that the transient evolution of erosion rate and erosional flux is potentially useful for distinguishing between tectonic and climatic forcing mechanisms.
Keywords: tectonics, erosion, critical wedge, numerical modeling.
†E-mail: [email protected].
INTRODUCTION
The evolution of convergent mountain belts has long been a topic of interest in tectonics. Increasingly over the last two decades, geomorphology has added to this study by investigat-ing how erosion of topography by surface processes can alter the form and rate of orogen evolution. In addition, linkages over a wide range of spatial and temporal scales have been proposed to exist between climate and tectonics, through the influence of sur-face topography, which is both product and player in the compe-
tition between climate and tectonics. The coupling among tecton-ics, erosion, and climate appears to be rich in complexity, and a broad community of scientists is now discovering and examining first-order linkages in the coupled system.
Coupling between tectonics and climate exists through various mechanisms that operate in both directions. That is, tec-tonics and climate both affect each other, resulting in feedback between processes. Tectonics influences local and regional cli-mate primarily by raising high mountains and plateaus leading to orographic enhancement of precipitation (Smith, 1979; Koons,

242 D.B. Stolar, S.D. Willett, and G.H. Roe
critical orogens. We use the model to (1) examine the time evolu-tion of a critical orogen to a steady state, (2) quantify the scaling relationship between steady-state orogen size and tectonic and erosional forcing, (3) examine the behavior of additional degrees of freedom allowed in our model, and (4) quantify the controls on the response time of a critical orogen to perturbations in forcing. Where appropriate, we make direct comparisons of the results from this model to equivalent analytical models.
COUPLED MODEL
The coupled model consists of a finite element mechanical model, which describes deformation of a plastic material in cross section, and a surface process model (SPM), which simulates flu-vial and hillslope erosion in planform.
The mechanical model is a variant of models presented in several studies of orogenic evolution (Beaumont et al. 1992, 2001; Willett, 1999a, 1999b); deformation of the crust occurs in response to convergence and accretion of new material. At oro-gen scale, this occurs under circumstances similar to Figure 1, in which accretion represents the transfer of crustal material from a downgoing or subducting plate to an overriding plate. In our numerical experiments, which match the basic design of ana-log sandbox experiments (Malavieille, 1993; Wang and Davis, 1996), accretion is driven by the side and basal velocity bound-ary conditions shown in Figure 2. Deformation of the subducted, downgoing plate is not considered further in this model. As in the analog experiments, deformation occurs first at the point S, where the basal velocity decreases from the convergence velocity V
c to zero, and later outboard of point S along shear zones that
propagate upwards from the basal surface.
1990; Molnar, 1997; Willett, 1999a; Beaumont et al., 2001; Roe et al., 2003). Climate affects tectonics through enhanced erosion of tectonic structures or entire mountain belts, altering the gravi-tational stresses and thus internal deformation (Beaumont et al., 1992, 2001; Willett, 1999a).
Active convergent orogens are particularly sensitive to mass redistribution by surface processes, as crustal thickening can result in orogens with critical topography, such that regional topographic gradients are in balance with the strength of the crustal rock. In the case where deformation is frictional plastic and crustal accretion occurs by shortening above a frictional detachment, topographic gradients attain a constant slope and the orogen takes the cross-sectional form of a wedge (Davis et al., 1983). This tectonic system, in spite of its seeming complexity, lends itself well to analytical treatment (e.g., Dahlen, 1984; Davis et al., 1983). If an orogenic wedge is in a critical state, any per-turbations to the cross-sectional form of the orogen, such as those that arise from surface erosion, lead to compensatory deforma-tion to restore the wedge to its critical state. Thus, there is a direct coupling between erosion and tectonic deformation.
The effect of erosion on a critical wedge, including feed-back to the erosion process, has also been treated extensively by analytical and numerical methods. Dahlen and Barr (1989) and Barr and Dahlen (1989) considered the effects of erosion on the internal kinematics and heat budget of a wedge with an assumed erosion rate, but did not incorporate any feedback from tectonics on erosion rates. Koons (1990) and Willett et al. (1993) also dis-cussed the effects of erosion on orogen structure and kinematics but did not address the strength of the feedback between topog-raphy and erosion rates. This feedback is included in a class of numerical models that couple plane-strain finite element models of crustal deformation to one-dimensional (1-D) erosion models (e.g., Batt and Braun, 1997; Willett, 1999a), but these models include complexities in the tectonic model, such as isostatic com-pensation and temperature-dependent viscous deformation, that obscure the connections with critical wedge theory.
The most explicit examination of the linkages between criti-cal wedge theory and erosional processes has been conducted in the studies of Hilley et al. (2004), Whipple and Meade (2004), Roe et al. (this volume), and K.X Whipple and B.J. Meade (2004, personal commun.)These models are based on the coupling of a critical taper angle, which defines the mean elevation profile, and a one-dimensional hillslope-fluvial channel profile. As a group, the studies examine how the coupling of tectonics and erosion inherent in a critical orogen affects the steady-state orogen size as a function of tectonic and erosional forcing and the response time of a critical orogen to climatic and tectonic perturbation. Because of the assumptions required for solution, these models do not address how several important degrees of freedom (e.g., spatial variability in rock uplift, spatial and temporal variability in the channel network) influence the behavior of a coupled orogen.
In this paper, we develop a numerical model that allows for these degrees of freedom and contains more complete descrip-tions of the tectonic and erosional processes relevant to eroding
FE
FA
pro-wedge
retro-wedge
Figure 1. Schematic diagram of a doubly vergent wedge (pro- and retro-wedges are labeled). In this model, material enters and exits the wedge via accretionary (F
A) and erosional fluxes (F
E), respectively. Large
black circle is equivalent to point S in Figure 2 and denotes where the upper crust detaches from the downgoing plate (after Yeh, 2003).

Climatic and tectonic forcing of a critical orogen 243
Decoupling of the incoming material from its base and accretion into the wedge is affected by the mechanically weak décollement. The physical interpretation of the basal surface is dependent on both the setting and scale of the specific applica-tion of the numerical model. In reference to orogenic, crustal-scale wedges, the basal surface represents a décollement either within the upper crust, at the upper-lower crust boundary, or at the Moho. In analog sandbox experiments, it represents the boundary between sand and an underlying material, typically Mylar (Davis et al., 1983; Wang and Davis, 1996). In the mod-els of this paper, we assume that the basal surface remains hor-izontal throughout the simulation, such that isostatic compen-sation of excess topography is not allowed. This permits more careful comparison with the analytical critical wedge theory.
The finite element formulation solves the quasi-static form of the Navier-Stokes equation to calculate deformation of a material obeying a nonlinear viscous flow law. Plastic behav-ior is simulated by requiring that (1) material behave rigidly (highly viscous) for stresses below the Mohr-Coulomb yield strength of the material and (2) that strain occur at a rate such that the stress never exceeds the yield strength (Willett, 1992). Numerical solution with this formulation yields horizontal and vertical velocities within the cross-sectional domain that, when linked to the SPM, provide one of the mechanisms by which the two models are coupled.
We simulate planform surface erosion with a variant of the Cascade surface process model (Braun and Sambridge, 1997). A particular strength of Cascade is its representation of topography by an irregular network of nodes. This grid allows for accurate tracking of material in systems with significant amounts of lateral strain, such as the wedge investigated in this study.
Erosion of the model topography occurs by fluvial inci-sion and bedrock landsliding. The rate of fluvial incision, E, is calculated by the stream power law:
E = KQmSn, (1)
where K is a measure of the substrate erodibility, Q is the dis-charge at a point along the channel network, S is the down-stream slope (e.g., Whipple and Tucker, 1999), and m and n are exponents related to the physical processes of bedrock erosion (e.g., Whipple et al., 2000). Here, we use the unit stream power law (m = 1/2, n = 1). The discharge is equal to the product of the precipitation rate, P, which is assumed to be constant over the landscape, and the upstream contributing area, A. Combin-ing equation 1 with tectonic forcing terms yields equations that describe the horizontal and vertical velocities of a representative channel node:
dxi/dt = v
i, (2a)
dzi/dt = u
i – KQ
imS
in, (2b)
where vi and u
i are the horizontal and vertical velocities at the
ith node, respectively. We assume completely detachment-lim-ited conditions, such that transported sediment and sediment eroded from the bed do not influence the rate of erosion (e.g., Howard, 1994). Water is allowed to exit the model domain only through the left and right boundaries (Fig. 2).
To simulate hillslope erosion, we use a simple threshold-slope model of bedrock landsliding, which is consistent with results from large-scale topographic analyses (e.g., Burbank et al., 1996; Montgomery, 2001). This is implemented, when nec-essary, by lowering nodal connections until all slopes are at or below the critical value, which is set in our models to 30°. The landslide mass is assumed to not influence fluvial incision.
The coupling of the mechanical and surface process models is achieved through a sequence of four steps: (1) the mechani-cal model calculates the velocity field within the entire cross-sectional domain, (2) the rates of uplift and lateral advection from the surface of the mechanical model are interpolated to each SPM node, (3) within the SPM and at much smaller time steps, the surface topography is uplifted, advected, and eroded for the length of the mechanical model time step, and (4) a mean elevation profile is calculated for the SPM topography and set to be the upper boundary of the mechanical model. This sequence is repeated for the length of the simulation.
Nondimensionalization of the coupled model follows nat-urally from the scale-independence of purely frictional critical wedges (Dahlen, 1984; Willett, 1999a). By using the height of the incoming material, H, and the convergence velocity, V
c, as characteristic length and rate scales, respectively, this
approach allows for generalization of the numerical results to both sandbox wedges, where H ~ 10−1 m and V
c ~ 104 m/yr,
and fold-and-thrust belts, where H ~ 103 m and Vc ~ 10−2 m/yr.
For instance, nondimensionalization of equations 2a and 2b yields:
dxi*/dt* = v
i*, (3a)
dzi*/dt* = u
i* – N
e(Q
i*)m S
in, (3b)
Figure 2. Numerical model with boundary conditions. Mechanical model is shown in the x-z plane, and the surface process model is shown in the x-y plane. Material to the left of point S moves laterally at a velocity V
c. To the right of point S, the velocity is zero. The upper
surface of the mechanical model (black line) is equivalent to the mean elevation profile of the planform topography and is assumed to be a stress-free surface. H is the thickness of the incoming material.
SV = Vc V = 0
H Z
Y
X

244 D.B. Stolar, S.D. Willett, and G.H. Roe
where Ne, the erosion number, is KH2mV
cm – 1.
All equations and model quantities presented in the fol-lowing sections are given in nondimensional form. The model dimensions (Fig. 2) are ∆X* = 1000, ∆Y* = 8, and ∆Z* = 1. The along-profile width, ∆X*, and strike-parallel width, ∆Y*, are large enough such that the boundaries do not influence the evolution of the mean elevation profile. Note that one unit of nondimensional time represents the amount of time required to accrete one crustal thickness of material into the domain. For example, if H = 103 m and V
c = 10−2 m/yr, T* = 1 would be equivalent to 0.1 m.y.
BASE MODEL EVOLUTION
We first examine the evolution of the coupled wedge as it grows to a steady-state and then characterize the topography and deformation field at steady state. The tectonic boundary condi-tions and the requirement of purely plastic deformation are cho-sen to imitate the analog sandbox experiments of Malavieille (1993) and Wang and Davis (1996) and the numerical experi-ments of Willett (1999b), noting that none of these included ero-sion. We present here the time evolution of the planform topog-raphy, strain rate field, mean elevation profile, erosional flux, and wedge volume.
Two of the most significant characteristics of a mountain belt are the spatial extent over which erosion and deformation occur. Within the coupled model, these can be measured with the planform topography and strain rate field, respectively (Fig. 3). In addition, because the mechanical model responds directly to the gravitational stresses imposed by the mean elevation profile, the surface evolution (Fig. 4) is intimately tied to the pattern and magnitude of deformation. Results from pre-steady-state stages are shown to illustrate the period of rapid change in the early evolution of the wedge.
Beginning from a flat initial topography, wedge growth ini-tiates as a single pop-up structure centered above the S point. Deformation occurs within conjugate shear zones; the width of each shear zone is dictated by the resolution of the mechanical model mesh. Growth of the pop-up structure continues until T* = 1/4. By T* = 1/2, shear zones form on either side of the pop-up structure, and deformation within these shear zones results in uplift and widening of the pro- and retro-wedges. This occurs until T* = 2, when the mean elevation of the divide reaches the approximate steady-state elevation. Between T* = 2 and T* = 4, the deforming region expands from three to five shear zones as the wedge widens and the flanks are uplifted. At T* = 4, both the deformation field and the mean elevation profile are very similar to those of T* = 20, indicating that the wedge has achieved a large-scale steady state.
T* = 2
T*=4
T* = 20
T* = 1/8
T* = 1/4
T* = 1/2
T* = 1
Figure 3. Planform topography and xx-component of strain rate through time for the base model. Warmer colors represent higher elevations and higher rates of strain.

Climatic and tectonic forcing of a critical orogen 245
At steady state, the mean elevation profile can be divided into three segments: (1) the pro-wedge segment, which has a slope of 1.5°, (2) the upper retro-wedge segment, which has a slope of 4.9°, and (3) the lower retro-wedge segment, which has a slope of 1.6° (Fig. 4). This compares well with critical wedge theory (Dahlen, 1984) and the analog sandbox experiments of Wang and Davis (1996), which reveal that the slopes of seg-ments 1 and 3 are equal to the minimum taper angle (1.5°), and that the slope of segment 2 is less than the maximum taper angle (6.0°).
Next, we examine predictions for the time evolution of ero-sional flux and wedge volume. These are important quantities in natural systems, because they can be related to observations from sedimentary basins such as provenance, deposition rates,
and sediment volumes. In Figure 5, we plot the evolution in time of the erosional flux, which is the integral of the erosion rate over the SPM domain, and wedge volume, which is defined as the volume of the excess topography above the original base level. Also plotted in Figure 5 is a line representing the volume of an equivalent noneroding wedge, which increases with a slope of HV
c.
Erosional flux increases rapidly from T* = 0 and asymptoti-cally approaches a steady value, which is achieved at T* ~ 4. We note that the volume of the noneroding wedge departs from the volume of the eroding wedge at a rate equal to the erosional flux. At T* = 4, the noneroding wedge is more than 2.5 times larger than the eroding wedge.
Steady-State Width Scaling Relationship
The size of the wedge at steady state is a fundamental mea-sure of the response of the coupled system to tectonic and cli-matic forcing. Roe et al. (this volume) analyzed the coupling between a one-dimensional river profile, which erodes according to equation 1, and a critical wedge in which the mean elevation profile is defined by a constant taper angle. A scaling relationship was derived between steady-state wedge width, W, accretionary flux, F
A, and precipitation rate, P:
W F PA
hmm
hm∝ +−
+1
1 1 , (4)
where h is the Hack’s Law exponent, which relates along-profile distance x to contributing area A (A ∝ xh). Equation 4 is very similar to the scaling relationship derived by Whipple and Meade (2004). As demonstrated by Roe et al. (this volume), equation 4 is valid for systems in which topography is advected laterally and in which rock uplift is allowed to be nonuniform but is constrained to change self-similarly. It can easily be shown that equation 4 also applies to doubly vergent wedges (i.e., wedges composed of pro- and retro-wedges) (Whipple and Meade, 2004). Thus, the remaining differences between the analytical and numeri-cal models are that a non-self-similar rock uplift pattern and an emergent and evolving two-dimensional (2-D) channel network are allowed for in the numerical model.
In comparing the steady-state predictions of the analytical and numerical models, we use results from a suite of simulations with different tectonic and climatic forcing for three different flu-vial erosion laws. Each erosion law has the general form of equa-tion 1 but with different exponents: the unit stream power law (m = 1/2, n = 1), the unit shear stress law (m = 1/3, n = 2/3), and the stream power law (m = 1, n = 1) (e.g., Whipple and Tucker, 1999). The ratio of the steady-state wedge widths and a refer-ence width are plotted versus the ratio of the climatic and tectonic forcing and reference forcing in Figure 6. Also plotted in Figure 6 are the predictions of equation 4 (Roe et al., this volume), using calculations of the Hack’s law exponent h from the model topog-raphy. There is very close agreement between the analytical and numerical predictions, indicating that the nonuniform rock uplift
40 45 50 55 60
0
0.05
0.1
0.15
0.2
0.25
X*
Z*
1/8 1/4 1/2 1 2 4
T*
Segment (i)
Segment (ii)
Segment (iii)
α = 1.5o
α = 1.6o
α = 4.9o
Figure 4. The mean elevation profile through time, from initiation of a pop-up structure to steady state. Regression lines and calculated slopes, α, also shown for segments of the steady-state profile.
0 2 4 6 8 100
4
8
12
16
T*
V*
0
0.5
1
1.5
2
F * E
VolumeVolume (no erosion)Erosional flux
Figure 5. Evolution of wedge volume and erosional flux of the base model. Also shown is the volume of a noneroding wedge forced by the same accretionary flux.

246 D.B. Stolar, S.D. Willett, and G.H. Roe
and evolving two-dimensional channel network do not change the basic relationship between wedge size and tectonic and cli-matic forcing.
Spatial Distribution of Exhumation Rates
A steady-state mean elevation profile requires a wedge-scale balance between accretionary and erosional fluxes and a local balance between rock uplift and erosion rates. For a steady-state tectonic system in which rock moves with vertical and horizontal velocities u*(x*) and v*(x*), respectively, the two scales can be related by an expression for the flux through the mean elevation profile z*(x*):
F u x v xdzdx
dx E x dA
W
* *( *) *( *)**
* *( *)= −
= −∫ xx FE
W
* *= −∫ , (5)
where E*(x*) is the erosion rate. The v*(x*) dz*/dx* term in equation 5 is included to account for vertical motion of the mean elevation profile caused by lateral advection of topography (e.g., Willett et al., 2001).
The steady-state profiles of selected terms from equation 5 are shown in Figure 7. The rock uplift rate u*(x*) is greater on the pro-wedge than on the retro-wedge. Because the topographic slope of the mean elevation profile switches sign at the divide, the lateral advection term is negative on the pro-wedge and posi-tive on the retro-wedge. The result is that the erosion rate is more uniform than the rock uplift rate. The most significant deviation from uniformity occurs near X* = 52.5, which coincides with the retro-wedge segment of the shear zone initiating at the S point, which is at X* = 50. The maximum erosion rate at X* = 49 is off-
set from the main divide at X* = 51.5. The segment of the mean elevation profile defined by the maximum taper angle lies above the region of lowest erosion. Overall, we find that the coupled tectonic-erosional system evolves to a steady-state in which non-uniform erosion exists without spatial gradients in precipitation rate and without temporal and spatial changes in the mechanism of erosion.
Planform Topography
Planform topography and the mean elevation profile both vary as the wedge evolves to a large-scale steady state. However, while the mean elevation profile eventually achieves a steady form (Fig. 4), planform topography never reaches a true steady state (Fig. 3). In the approach to a large-scale steady state, ero-sion progressively shapes the planform topography, resulting in creation of interfluvial relief and a change in the geometry of drainage basins. Initially, however, erosion does not significantly alter the planform topography. Not until outward propagation of deformation at T* = 1/2 does erosion in transverse rivers etch the sides of the wedge, thereby narrowing and roughening the divide. Distinct drainages develop at T* = 2 to form a series of narrow transverse drainages, and are deeply incised by T* = 4. Between T* = 4 and T* = 20, the main divide becomes more sinuous, and basins draining both the pro- and retro-wedges increase in along-strike width.
The reorganization of drainage basins at large-scale steady-state is driven by lateral advection of topography. As with the models of Willett et al. (2001), the incorporation of lateral advec-tion leads to a highly transient topography. Although the SPM used here has a simple representation of ridge migration by ero-sion (Tucker and Slingerland, 1994), it does allow for the gen-eration of new topographic features at the toe of the wedge and their progressive uplift and erosion as they are advected across
Figure 6. Comparison of the steady-state wedge width determined by numerical model with predictions from width-scaling law (equation 4) (see Roe et al. [this volume] and Whipple and Meade [2004]). Numeri-cal results are denoted by symbols, which indicate the particular ero-sion law used in the simulation. Analytical predictions from Roe et al. (this volume) for precipitation and accretionary flux scaling are shown with black and gray lines, respectively.
Change in P
Change in FAW
/ W
ref
P / Pref or FA / FA ref
4
2
1
0.5
0.25
4210.50.25
Unit stream powerUnit shear stressStream power
X*
Non
dim
ensi
onal
rat
e
-0.05
-0.025
0
0.025
0.05
0.075
0.1
0.125
40 45 50 55 60
u*-v* dz*/dx*-E*di
vide
Figure 7. Profiles of selected terms in equation 5. The erosion rate pro-file is the sum of the rock uplift rate and the contribution from the later-al advection of topography. Position of main drainage divide is noted.

Climatic and tectonic forcing of a critical orogen 247
the orogen. The direction of advection leads to an interesting asymmetry in the mechanisms that promote basin reorganization on the pro- and retro-wedges. On the pro-wedge, advection of river junctions from the toe toward the divide and truncation of basins at the divide lead to an increase in the along-strike width of basins over time. Reorganization of retro-wedge drainages occurs when the headwaters of pro-wedge rivers are advected over the divide and decapitated by retro-wedge rivers. Addition of drainage area (and thus discharge) by this process leads to growth of some retro-wedge basins at the expense of others. This also leads to changes in the pro-wedge channel network, because the decapitated basins, having less drainage area, are at a competitive disadvantage. Overall, these mechanisms favor a more sinuous main divide and drainage basins with larger along-strike widths.
Advection of topography and basin reorganization lead to a highly transient topography, even at large-scale steady state. We quantify the variability of the elevation field in a fixed reference frame by translating the planform topography at selected time steps to a regular grid and then calculating the standard deviation of the elevation over time at each grid point. In Figure 8, eleva-tion contours of the mean elevation surface are superimposed on the map of topographic variability. Both the mean elevation sur-face and topographic variability are calculated over a period of ∆T* = 86, during which the mean elevation profile and deforma-tion field are steady. Over most of the wedge, the standard devia-tion of elevation is a significant fraction of the mean elevation (1/5–1/3). The magnitude of the variability is much larger on the pro-wedge, where horizontal velocities are greater.
RESPONSE TO CLIMATIC AND TECTONIC PERTURBATION
Geologic time series, such as basin deposition rates and thermochronometric age series, testify to the time-dependent response of landscapes to unsteady tectonic and climatic forc-ing. By providing predictions for this response, theoretical mod-els are important tools for interpreting the geologic record. In the preceding section of this paper, we examined how several char-
acteristics of the coupled tectonic-erosional system (e.g., wedge volume, erosional flux, and exhumation rate) vary as functions of time and space under steady tectonic and climatic forcing. In this section, we impose perturbations in climatic and tectonic forcing on the steady-state base model and examine the time-dependent response as expressed by three important properties: wedge width, erosional flux, and mean erosion rate.
Because of the strong negative feedback between erosion rate and topographic slope, the perturbations in forcing are ulti-mately expected to lead to new equilibrium states. The relation-ship between the initial and final steady states can be determined for each of the three properties. The final steady value of the erosional flux is simply defined, because, at steady state, it must equal the accretionary flux. The sensitivity of wedge width and mean erosion rate to accretionary flux and precipitation rate fol-low from the results of the 1-D analyses of Whipple and Meade (2004) and Roe et al. (this volume). Equation 4 relates the steady-state wedge width to the accretionary flux and precipita-tion rate, and a similar expression can be written for the mean erosion rate, E , which is the erosional flux divided by the width of the wedge:
E F PA
hmhm
mhm∝ + +1 1
. (6)
Unlike the wedge width, the mean erosion rate is positively dependent on both accretionary flux and precipitation rate. What is not given from equations 4 and 6, however, is the time-depen-dent behavior of the coupled system following a change in tec-tonic or climatic forcing.
We present four simulations in which step-function tectonic and climatic perturbations are imposed on the steady-state base model presented in the previous section. We chose perturbations in accretionary flux and precipitation rate such that, for the four simulations, the wedge grows and contracts to only two differ-ent steady-state widths. For example, given m = 1/2, equation 4 implies that doubling the precipitation rate leads to the same, smaller steady-state width as a decrease in accretionary flux by a factor of 1 2/ ; halving the precipitation rate results in the same, larger steady-state width as an increase in accretionary flux by a factor of 2 . In the left and right panels of Figure 9, we plot the time series of wedge width, mean erosion rate, and erosional flux for growth and contraction of the wedge, respectively. Because time is nondimensionalized with the convergence rate, and the convergence rate is adjusted to change the accretionary flux, we use the initial convergence velocity to nondimensionalize time in simulations with variable accretionary flux.
Climatic Perturbation
The evolution of wedge width in response to perturbations in precipitation rate is shown in Figures 9A and 9B (black lines). An increase in precipitation rate leads to a decrease in wedge width until a new steady width is achieved (Fig. 9B); conversely, a decrease in precipitation rate leads to growth of the wedge to
0
2
4
6
8
0.00
0.01
0.02
0.03
0.04
45 50 55 60
0.05
X *
Y *
std(
Z *
)
0.05
0.20
0.15
0.10
0.20
0.15
0.10
0.05
Figure 8. Map of the standard deviation of elevation in a fixed refer-ence frame over a period (∆T* = 86) during which the mean elevation profile is at steady state. Labeled contours of the mean elevation field are also shown.
248 D.B. Stolar, S.D. Willett, and G.H. Roe
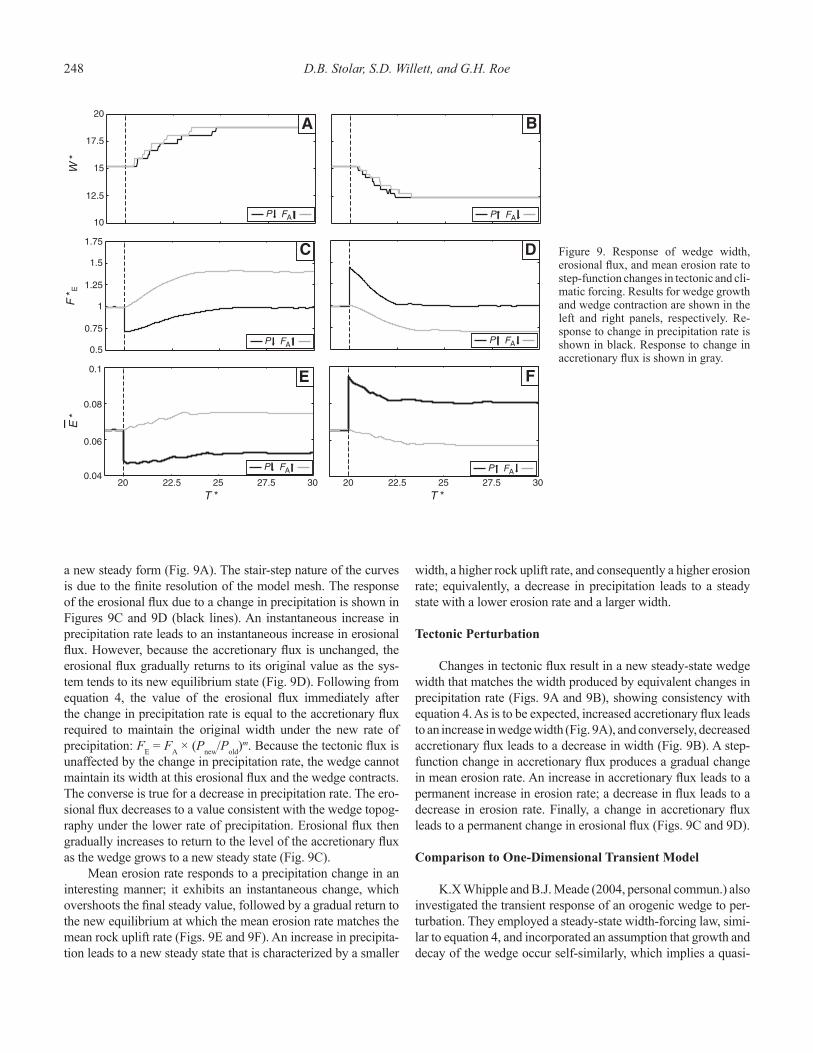
a new steady form (Fig. 9A). The stair-step nature of the curves is due to the finite resolution of the model mesh. The response of the erosional flux due to a change in precipitation is shown in Figures 9C and 9D (black lines). An instantaneous increase in precipitation rate leads to an instantaneous increase in erosional flux. However, because the accretionary flux is unchanged, the erosional flux gradually returns to its original value as the sys-tem tends to its new equilibrium state (Fig. 9D). Following from equation 4, the value of the erosional flux immediately after the change in precipitation rate is equal to the accretionary flux required to maintain the original width under the new rate of precipitation: F
E = F
A × (P
new/P
old)m. Because the tectonic flux is
unaffected by the change in precipitation rate, the wedge cannot maintain its width at this erosional flux and the wedge contracts. The converse is true for a decrease in precipitation rate. The ero-sional flux decreases to a value consistent with the wedge topog-raphy under the lower rate of precipitation. Erosional flux then gradually increases to return to the level of the accretionary flux as the wedge grows to a new steady state (Fig. 9C).
Mean erosion rate responds to a precipitation change in an interesting manner; it exhibits an instantaneous change, which overshoots the final steady value, followed by a gradual return to the new equilibrium at which the mean erosion rate matches the mean rock uplift rate (Figs. 9E and 9F). An increase in precipita-tion leads to a new steady state that is characterized by a smaller
width, a higher rock uplift rate, and consequently a higher erosion rate; equivalently, a decrease in precipitation leads to a steady state with a lower erosion rate and a larger width.
Tectonic Perturbation
Changes in tectonic flux result in a new steady-state wedge width that matches the width produced by equivalent changes in precipitation rate (Figs. 9A and 9B), showing consistency with equation 4. As is to be expected, increased accretionary flux leads to an increase in wedge width (Fig. 9A), and conversely, decreased accretionary flux leads to a decrease in width (Fig. 9B). A step-function change in accretionary flux produces a gradual change in mean erosion rate. An increase in accretionary flux leads to a permanent increase in erosion rate; a decrease in flux leads to a decrease in erosion rate. Finally, a change in accretionary flux leads to a permanent change in erosional flux (Figs. 9C and 9D).
Comparison to One-Dimensional Transient Model
K.X Whipple and B.J. Meade (2004, personal commun.) also investigated the transient response of an orogenic wedge to per-turbation. They employed a steady-state width-forcing law, simi-lar to equation 4, and incorporated an assumption that growth and decay of the wedge occur self-similarly, which implies a quasi-
Figure 9. Response of wedge width, erosional flux, and mean erosion rate to step-function changes in tectonic and cli-matic forcing. Results for wedge growth and wedge contraction are shown in the left and right panels, respectively. Re-sponse to change in precipitation rate is shown in black. Response to change in accretionary flux is shown in gray.
20 22.5 25 27.5 30 20 22.5 25 27.5 30
T * T *
W *
F *
EE
*
A B
C D
E F
P FA
P FA
P FA
P FA10
12.5
15
17.5
20
0.5
0.75
1
1.25
1.5
1.75
0.04
0.06
0.08
0.1
P FA
P FA
Climatic and tectonic forcing of a critical orogen 249
equilibrium throughout the response. The result is a differential equation for wedge width that can be solved analytically for cer-tain combinations of h and m, numerically in all cases.
In Table 1, we list the e-folding times predicted by our numer-ical model and the model of K.X Whipple and B.J. Meade (2004, personal commun.). There is a very close agreement between the predictions, indicating that the assumption of self-similar growth in the K.X Whipple and B.J. Meade (2004, personal commun.) model is also valid for the numerical model. In the numerical simulations, self-similarity of wedge growth is evident from the evolution of the mean elevation profile (Fig. 4) and follows from two assumptions of the mechanical model: existence of a quasi-equilibrium at each time step and maintenance of critical topog-raphy by plastic deformation.
The numerical results support an important implication of the K.X Whipple and B.J. Meade (2004, personal commun.) model: the orogen response time is more strongly dependent on the pre-cipitation rate than on the accretionary flux. In the climate change simulations, the ratio of the larger and smaller final precipitation rates is 4; the difference in response times is ∆T* = 1.4 (Table 1). In comparison, the ratio of larger and smaller accretionary fluxes is 2, but the response times are identical.
DISCUSSION AND CONCLUSIONS
Under steady forcing conditions, the coupled model pre-sented here evolves to a flux steady state in which the erosional flux balances the accretionary flux (Willett and Brandon, 2002). Associated with this balance are a steady deformation field, a steady mean elevation profile, and a planform topography in which temporal variability is driven by lateral advection. When perturbed by changes in climatic and tectonic forcing, the cou-pled model evolves to a new steady state via characteristic and, in some cases diagnostic, responses of orogen width, mean erosion rate, and erosional flux. These responses will be more compli-cated in natural orogenic systems in comparison to the simpli-fied numerical models shown here but can still be indicative of specific processes.
The width evolution in Figures 9A and 9B illustrates that perfect knowledge of wedge width through time is not sufficient to assign causation to changes in either tectonic or climatic forc-ing. Mean erosion rate and erosional flux, however, have diag-nostic responses to perturbations in forcing. Permanent changes
in accretionary flux lead to permanent changes in erosional flux, whereas changes in precipitation rate only temporarily influence the erosional flux (Figs. 9E and 9F) (Bonnet and Crave, 2003). This differs from the response of mean erosion rate, because the erosion rate is permanently changed by changes in either accre-tionary flux or precipitation rate (Figs. 9C and 9D). Mean ero-sion rate gradually achieves a new steady value in response to a change in accretionary flux, whereas it responds abruptly to a variation in precipitation rate. Given a step-function change in forcing, the utility of erosion rate as a diagnostic tool, however, is dependent on the time-resolution of the record. Coarse records might not resolve the difference between abrupt and gradual changes in erosion rate if the response time is short and may only show permanent changes in erosion rate, which would not be diagnostic.
Isostatic compensation has a significant influence on orogen size and, therefore, on the response time. Local isostasy requires formation of a crustal root and, for typical crustal and mantle densities, the thickness of the root is 4–6 times greater than the height of excess topography. Thus, the response time of a com-pensated orogen is much greater than that of an uncompensated orogen, such as the one presented in this study. However, iso-static compensation does not change the form of the response of wedge width, mean erosion rate, and erosional flux; hence, these records and the simulations in this paper characterize the response of both compensated and uncompensated wedges.
In addition to isostasy and the magnitude of the perturba-tion, the system response time is intimately tied to the rheology of the orogen. Frictional material is expected to respond locally and immediately to any perturbation to the mean elevation pro-file (Dahlen and Barr, 1989). However, in most orogenic wedges, for example, Taiwan, there is abundant evidence for nonfric-tional deformation (i.e., viscous flow), including ubiquitous duc-tile fabrics in the core of the range (Clark et al., 1993). Impor-tantly, because a viscous orogen has an inherent response time scale determined by the viscosity of the material, the response of a viscous orogen is expected to be longer than that of a purely frictional wedge.
The close agreement between the numerical model and 1-D steady-state models (Roe et al., this volume; Whipple and Meade, 2004) and transient models (K.X Whipple and B.J. Meade, 2004, personal commun.) indicates that many first-order aspects of the coupled system can be described by coupling of relatively simple erosional and tectonic models. One important degree of freedom not available in the simpler models is the ability of the spatial distribution of rock uplift and topographic slope to adjust, such that local and orogen-wide balances are achieved between tectonic and erosional forcing. Our results demonstrate that nonuniform rock uplift can exist in a system with uniform precipitation and a steady accretionary flux (Fig. 7). We are currently expanding upon these results by examining how the pattern of rock uplift is influenced by the distribution of precipitation, the erosion law, and the crustal rheology, and, more fundamentally, how the erosional and tectonic systems
398-14
TABLE 1. COMPARISON OF PREDICTED RESPONSE TIMESPerturbation !*
K.X. Whipple and B.J. Meade(2004, personal commun.)
This paper
Pf = 2Pi 1.3 1.4
Pf = (1/ 2)Pi 2.8 2.8
FAf = 1/ 2FAi 1.8 2.0
FAf = 2FAi 2.0 2.0

250 D.B. Stolar, S.D. Willett, and G.H. Roe
achieve a balance through adjustment of internal parameters, such as rock uplift rate and topographic slope.
In summary, we have presented a suite of numerical simula-tions that examine the steady-state and transient behavior of a coupled orogenic wedge. In this system, steady state implies a balance between accretionary and erosional fluxes and between uplift and erosion rates, but not a static planform topography. We find that the existence of nonuniform rock uplift does not require spatial variations in precipitation or erosional processes. Finally, we predict that records of erosion rate and erosional flux can be used to distinguish between tectonic and climatic perturbations.
ACKNOWLEDGMENTS
We thank Jon Tomkin and Nicole Gasparini for constructive reviews. This work was supported by a National Science Foun-dation (NSF) Graduate Research Fellowship to Stolar.
REFERENCES CITED
Barr, T.D., and Dahlen, F.A., 1989, Brittle frictional mountain building—2. Thermal structure and heat budget: Journal of Geophysical Research, v. 94, p. 3923–3947.
Batt, G. and Braun, J., 1997, On the thermo-mechanical evolution of compres-sional orogens: Geophysical Journal International, v. 128, p. 364–382.
Beaumont, C., Fullsack, P., and Hamilton, J., 1992, Erosional control of active compressional orogens, in McClay, K., ed., Thrust tectonics: London, Chapman and Hall, p. 1–18..
Beaumont, C., Jamieson, R.A., Nguyen, M.H., and Lee, B., 2001, Himala-yan tectonics explained by extrusion of a low-viscosity crustal channel coupled to focused surface denudation: Nature, v. 414, p. 738–742, doi: 10.1038/414738a.
Bonnet, S., and Crave, A., 2003, Landscape response to climate change: Insights from experimental modeling and implications for tectonic versus climatic uplift of topography: Geology, v. 31, p. 123–126.
Braun, J., and Sambridge, M., 1997, Modelling landscape evolution on geologi-cal time scales: A new method based on irregular spatial discretization: Basin Research, v. 9, p. 27–52, doi: 10.1046/j.1365-2117.1997.00030.x.
Burbank, D.W., Leland, J., Fielding, E., Anderson, R.S., Brozovic, N., Reid, M.R., and Duncan, C., 1996, Bedrock incision, rock uplift and threshold hillslopes in the northwestern Himalayas: Nature, v. 379, p. 505–510, doi: 10.1038/379505a0.
Clark, M.B., Fisher, D.M., Lu, C.Y., and Chen, C.H., 1993, Kinematic analyses of the Hsuehshan Range, Taiwan—A large-scale pop-up structure: Tec-tonics, v. 12, p. 205–217.
Dahlen, F.A., 1984, Noncohesive critical coulomb wedges—An exact solution: Journal of Geophysical Research, v. 89, p. 125–133.
Dahlen, F.A., and Barr, T.D., 1989, Brittle frictional mountain building. 1. Deformation and mechanical energy budget: Journal of Geophysical Research, v. 94, p. 3906–3922.
Davis, D., Suppe, J., and Dahlen, F.A., 1983, Mechanics of fold-and-thrust belts and accretionary wedges: Journal of Geophysical Research, v. 88, p. 1153–1172.
Hilley, G.E., Strecker, M.R., and Ramos, V.A., 2004, Growth and erosion of fold-and-thrust belts with an application to the Aconcagua fold-and-
thrust belt, Argentina: Journal of Geophysical Research, v. 109, doi: 10.1029/2002JB002282.
Howard, A.D., 1994, A detachment-limited model of drainage-basin evolution: Water Resources Research, v. 30, p. 2261–2285, doi: 10.1029/94WR00757.
Koons, P.O., 1990, A 2-sided orogen—Collision and erosion from the sand-box to the Southern Alps, New Zealand: Geology, v. 18, p. 679–682, doi: 10.1130/0091-7613(1990)0182.3.CO;2.
Malavieille, J., 1993, Late orogenic extension in mountain belts—Insights from the Basin and Range and the late Paleozoic Variscan Belt: Tectonics, v. 12, p. 1115–1130.
Molnar, P., 1997, The rise of the Tibetan Plateau: From mantle dynamics to the Indian monsoon: Astronomy & Geophysics, v. 38, p. 10–15.
Montgomery, D.R., 2001, Slope distributions, threshold hillslopes, and steady-state topography: American Journal of Science, v. 301, p. 432–454.
Roe, G.H., Montgomery, D.R., and Hallet, B., 2003, Orographic precipita-tion and the relief of mountain ranges: Journal of Geophysical Research, v. 108, doi: 10.1029/2001JB001521.
Smith, R.B., 1979, The influence of mountains on the atmosphere: Advances in Geophysics, v. 21, p. 132.
Tucker, G.E., and Slingerland, R.L., 1994, Erosional dynamics, flexural isostasy, and long-lived escarpments—A numerical modeling study: Journal of Geo-physical Research, v. 99, p. 12,229–12,243, doi: 10.1029/94JB00320.
Wang, W.H., and Davis, D.M., 1996, Sandbox model simulation of forearc evo-lution and noncritical wedges: Journal of Geophysical Research, v. 101, p. 11,329–11,339, doi: 10.1029/96JB00101.
Whipple, K.X, and Meade, B.J., 2004, Controls on the strength of coupling among climate, erosion, and deformation in two-sided, frictional oro-genic wedges at steady state: Journal of Geophysical Research, v. 109, doi: 10.1029/2003JF000065.
Whipple, K.X, and Tucker, G.E., 1999, Dynamics of the stream-power river incision model: Implications for height limits of mountain ranges, land-scape response timescales, and research needs: Journal of Geophysical Research, v. 104, p. 17,661–17,674, doi: 10.1029/1999JB900120.
Whipple, K.X, Hancock, G.S., and Anderson, R.S., 2000, River incision into bedrock: Mechanics and relative efficacy of plucking, abrasion, and cavi-tation: Geological Society of America Bulletin, v. 112, p. 490–503, doi: 10.1130/0016-7606(2000)1122.3.CO;2.
Willett, S.D., 1992, Kinematic and dynamic growth and change of a Coulomb wedge, in McClay, K., ed., Thrust tectonics: New York, Chapman and Hall, p. 19–31.
Willett, S.D., 1999a, Orogeny and orography: The effects of erosion on the structure of mountain belts: Journal of Geophysical Research, v. 104, p. 28,957–28,981, doi: 10.1029/1999JB900248.
Willett, S.D., 1999b, Rheological dependence of extension in wedge models of convergent orogens: Tectonophysics, v. 305, p. 419–435, doi: 10.1016/S0040-1951(99)00034-7.
Willett, S.D., and Brandon, M.T., 2002, On steady states in mountain belts: Geology, v. 30, p. 175–178, doi: 10.1130/0091-7613(2002)0302.0.CO;2.
Willett, S.D., Beaumont, C., and Fullsack, P., 1993, Mechanical model for the tectonics of doubly vergent compressional orogens: Geology, v. 21, p. 371–374, doi: 10.1130/0091-7613(1993)0212.3.CO;2.
Willett, S.D., Slingerland, R., and Hovius, N., 2001, Uplift, shortening, and steady-state topography in active mountain belts: American Journal of Science, v. 301, p. 455–485.
Yeh, E.-C., 2003, Structural evolution of slate belts: Examples from Taiwan and eastern Pennsylvania [Ph.D. thesis]: University Park, Pennsylvania, The Pennsylvania State University, 191 p.
Manuscript accepted by the society 23 June 2005
Printed in the USA