copyright © 2015, sas institute inc. all rights reserved. the use of sas visual analytics to...
TRANSCRIPT


Copyright © 2015, SAS Institute Inc. All rights reserved.
The Use of SAS Visual Analytics to Support a Data Culture for
Student Success
PANEL
Facilitated by Laurie Heacock, Acting National Director of Data Coaching and Analytics @Laurie_edu

INTRODUCING THE PANELISTS
Emily BaranelloSenior Director of Education Practice, SAS
Daryl DavisDirector of Institutional Research,Valencia College
Bill SchneiderAVP for Research and Performance ManagementThe North Carolina Community College System
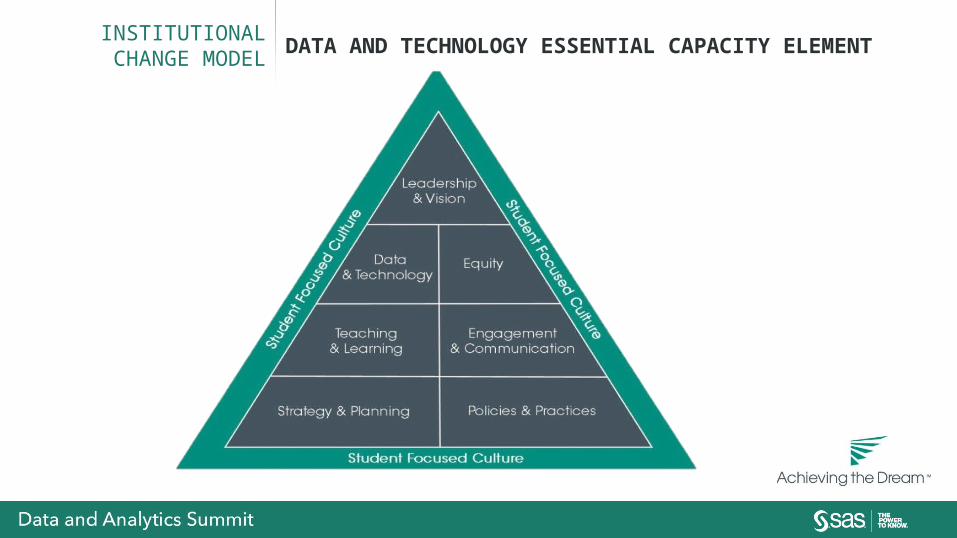
INSTITUTIONAL CHANGE MODEL
DATA AND TECHNOLOGY ESSENTIAL CAPACITY ELEMENT

MAKING SENSE OF DATA
FUNDAMENTAL CHALLENGE
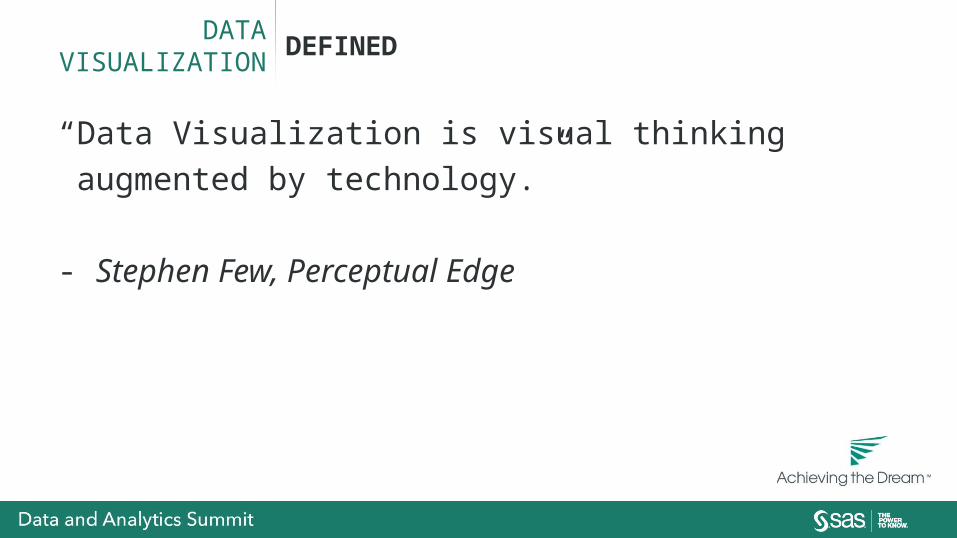
DATA VISUALIZATION
DEFINED
“Data Visualization is visual thinking augmented by
technology.”
- Stephen Few, Perceptual Edge

DATA VISUALIZATION WEAVES NUMBERS INTO PICTURES
Copyright © 2015, SAS Institute Inc. All rights reserved.
Senior Director of Education Practice, SAS
Emily Baranello
SAS Visual Analytics
Copyright © 2015, SAS Institute Inc. All rights reserved.
Director of Institutional Research
Valencia College
Daryl Davis
Managing Enrollment in SAS Visual Analytics
OVERVIEW
• Valencia College: Who we are• History of enrollment management• Needs of the Institution• Where we are today• Q & A

WHO WE ARE
• Location: Orlando, FL• 6 campuses• 121 programs (Degree and Certificate)• Annual Enrollment: 69K+ (59K credit)

ENROLLMENT MANAGEMENT HISTORY
• Credit Registration Report• Measured FTE and Headcount• Enrollment day this year compared to enrollment
day last year• Manually updated and maintained • Emailed to administrators

ENROLLMENT MANAGEMENT HISTORY

ENROLLMENT MANAGEMENT NEEDS OF THE INSTITUTION
• Easily accessible• Real time data• Automatically updated• Easy to navigate• Flexibility (Drill down, answers many questions etc..)• Solution : SAS Visual Analytics

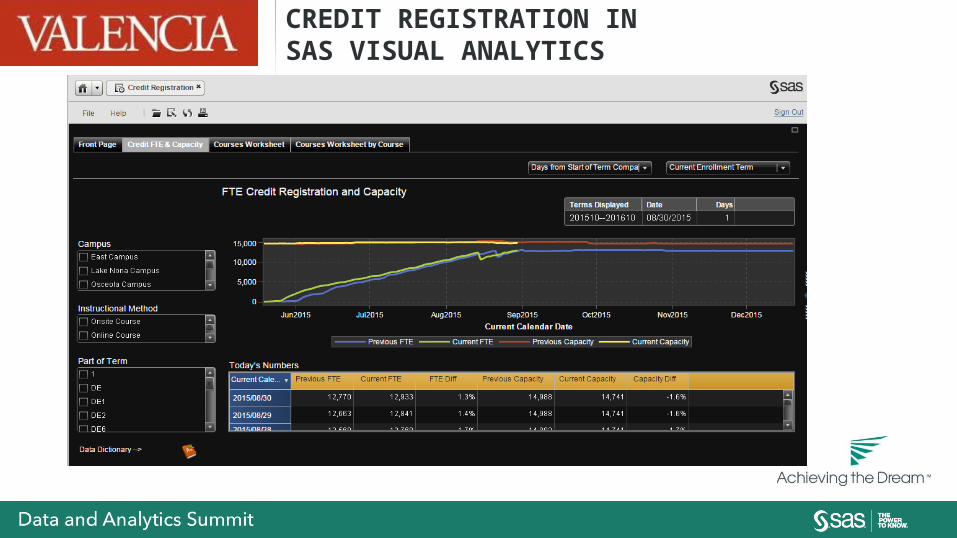
CREDIT REGISTRATION IN SAS VISUAL ANALYTICS

CREDIT REGISTRATION IN SAS VISUAL ANALYTICS
CREDIT REGISTRATION IN SAS VISUAL ANALYTICS

CREDIT REGISTRATION IN SAS VISUAL ANALYTICS

BENEFITS
• Ad hoc requests dropped by 75%• Administrators can interact with data in real time• Ability to Drill into reports to answer many questions• Easier to adjust the availability of classes and resources

Copyright © 2015, SAS Institute Inc. All rights reserved.
Associate Vice President for Research and
Performance Management at the North
Carolina Community College System
Bill Schneider
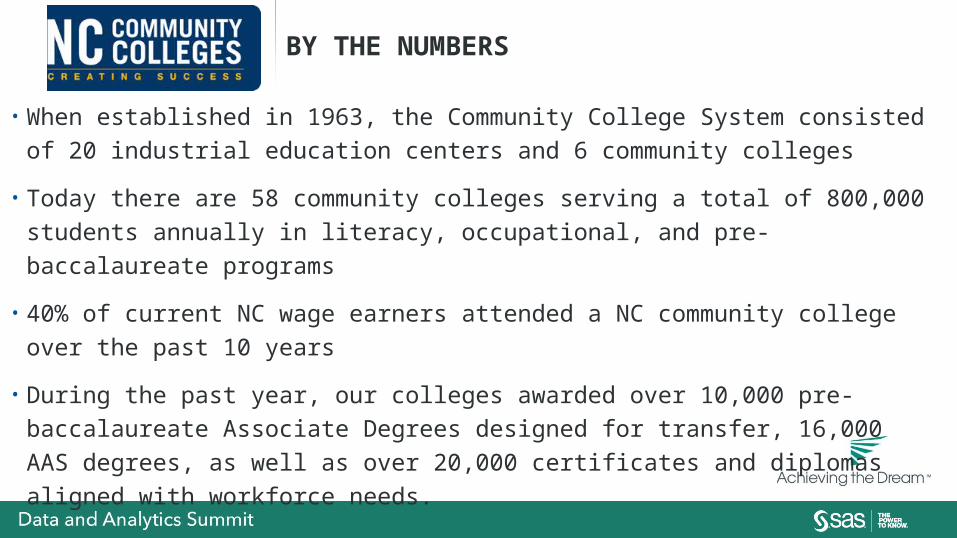
BY THE NUMBERS
• When established in 1963, the Community College System consisted of 20
industrial education centers and 6 community colleges
• Today there are 58 community colleges serving a total of 800,000 students
annually in literacy, occupational, and pre-baccalaureate programs
• 40% of current NC wage earners attended a NC community college over the
past 10 years
• During the past year, our colleges awarded over 10,000 pre-baccalaureate
Associate Degrees designed for transfer, 16,000 AAS degrees, as well as
over 20,000 certificates and diplomas aligned with workforce needs.

DATA INITIATIVE
• Goal is to establish a robust data system that provides accurate, holistic, and accessible information which fosters a culture of data-driven decision making, addresses research questions, and informs policies.
• Officially kicked off in 2012 and targeted for completion by the end of 2017.

DATA INITIATVE OBJECTIVES
• Expand the individual and collective inquisitiveness of stakeholders within the NC Community College System to ask research questions that inform decisions and policies. (Culture of Curiosity)
• Develop data definitions based on research needs and reporting requirements. (Data Dictionary)
• Ensure data accuracy and consistency through appropriate and uniform entering and collecting of information across the system so data extracted are valid and reliable. (Data Entry)
• Incorporate a data review process that ensures accountability through the validation of submitted data. (Validation)
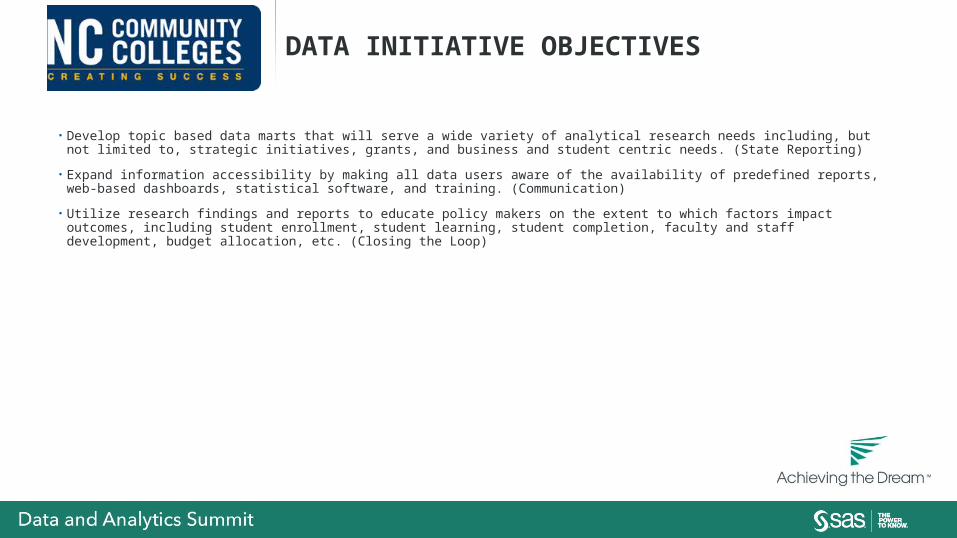
DATA INITIATIVE OBJECTIVES
• Develop topic based data marts that will serve a wide variety of analytical research needs including, but not limited to, strategic initiatives, grants, and business and student centric needs. (State Reporting)
• Expand information accessibility by making all data users aware of the availability of predefined reports, web-based dashboards, statistical software, and training. (Communication)
• Utilize research findings and reports to educate policy makers on the extent to which factors impact outcomes, including student enrollment, student learning, student completion, faculty and staff development, budget allocation, etc. (Closing the Loop)

PERFORMANCE MEASURES

DEMONSTRATION
VISUAL ANALYTICS
Performance Measures Dashboards

Copyright © 2015, SAS Institute Inc. All rights reserved.
The Use of SAS Visual Analytics to Support a Data Culture for
Student Success
PANEL
Facilitated by Laurie Heacock, Acting National Director of Data Coaching and Analytics @Laurie_edu
Q&A
Visualization and Teaching and Learning Showcase Area
See Program for Times
