core2 group: digital data & activity analytics for risk adjusted return models & strategies
TRANSCRIPT
DIGITAL DATA & ACTIVITY ANALYTICS TO
SUPPLEMENT, COMPLEMENT AND ENHANCE
COMPANY, INDUSTRY, SECTOR AND COUNTRY
RISK ADJUSTED RETURN STRATEGIES
DECEMBER, 2015

Core2 Group, Inc. Confidential and Proprietary. Do not copy or distribute. 2
Table of Contents Introduction ....................................................................................................................................................................... 3
1. Constructing a company specific Risk Rating (A seven step approach) ................................................ 3
2. Constructing Concentration Risk Measures across a Portfolio of Companies ................................... 3
3. Country Risk .............................................................................................................................................................. 5
4. Integrating Country Risk with Industry Risk ................................................................................................... 6
5. Industry Rating ......................................................................................................................................................... 8
6. Forward Measures of Risk .................................................................................................................................. 10
7. Integrating Industry Risk & Country Risk ...................................................................................................... 12
Case Study: Automobile company performance across multiple brands, companies and
countries .................................................................................................................................................................. 12
8. Default Correlations ............................................................................................................................................. 17
Conclusion ........................................................................................................................................................................ 18
Appendix .......................................................................................................................................................................... 20
1. Core2 Business Performance Measure Definitions and Applications: ................................................. 20
2. Author Biographies ............................................................................................................................................. 22
Dr. Robert Mark .................................................................................................................................................... 22
Hugh Lloyd-Thomas ........................................................................................................................................... 23
About Core2 Group ...................................................................................................................................................... 24
Note from the Authors:
Comments / Suggestions / Questions Encouraged & Appreciated
Hugh Lloyd-Thomas, Advisory Board Member, Executive VP, Financial Services, Core2
Group, Mobile: 917-716-5973 Email: [email protected]
Bob Mark, Board of Directors & Advisory Board Member, Core2 Group, Mobile: 925-
212-7348 Email: [email protected]

Core2 Group, Inc. Confidential and Proprietary. Do not copy or distribute. 3
Constructing a country risk score and an industry risk score are two key scores that are an essential
input to determine a company’s overall risk profile. A borrower’s absolute and relative position
within an industry is also a key component of constructing risk adjusted return measures. The
volume and sources of a company’s digital data and activity levels are highly correlated to direction
of revenues and growth.
Digital data activity measures, that include detailed breakdowns across web, mobile, e-mail and
machine-to-machine activity1, provide insight and support within the risk adjudication process.
These big data measures provide daily orthogonal data and analytics to augment the current
traditional measures used to develop optimal risk adjusted return strategies at the company,
industry, sector and country levels. The digital data activity measures are also particularly useful for
analyzing the risk adjusted returns for private companies since there is a significant lack of
consistent and reliable up-to-date public data,
Please refer to the appendix for specific definitions of the digital activity metrics referred to
throughout the whitepaper.
1. Constructing a company specific Risk Rating (A seven step approach)
A credit risk rating system is used to calculate the probability of default of a loan to an obligor. It
starts with a financial assessment of the borrower (step 1). The next step calls for analyzing country
risk (step 2) and industry risk (step 3). The risk rating also calls for analyzing the managerial
capability of the borrower and reviewing the quality of the financial information (steps 4 and 5).
A robust risk rating system also compares the preliminary obligor rating to default ratings provided
by external entities such as rating agencies and software firms (step 6). The process ensures that all
credits are objectively rated using a consistent process to arrive at accurate ratings. A loss given
default rating (LGDR) is derived in a final step (step 7) that is independent from the obligor rating.
2. Constructing Concentration Risk Measures across a Portfolio of Companies
Measuring concentration risk is an important aspect of risk management. A time series constructed
from digital activity data for firms, based on their industry and country groupings, can be used to
provide incremental insight to the asset return correlations between two firms. The correlations can
1 Machine-to-machine activity refers to automated inter-company communications (e.g. inventory ordering &
payments, machinery communication with maintenance services, etc.)

Core2 Group, Inc. Confidential and Proprietary. Do not copy or distribute. 4
be explained by the factors common to all firms such as Industry (or Sector) and Country (or
Region).
Major problems arise in any aggregating system when it is applied to factors that are non-linear,
and therefore “non-additive.” For example, systematic risk (or beta risk) is additive over securities
for any given portfolio, but specific risk, measured by the standard derivation of the residual return,
is non-additive. In other words, the standard deviation of a portfolio is not the sum of the standard
deviations of the securities in the portfolio. Therefore, risk aggregation can be quite complicated; it
requires the estimation of many parameters, and especially the degree of correlation between all
the possible pairs of securities in a portfolio.
A firm’s asset returns are generated by a set of common (systematic) risk factors and
idiosyncratic factors. The idiosyncratic factors do not contribute to asset return correlations (since
they are not correlated with each other and not correlated with the common factors). The risks
associated with the idiosyncratic risk factors can be diversified away through portfolio
diversification, while the risk contribution of the common factors is, on the contrary, non-
diversifiable. Multi-factor models of asset returns reduce the number of correlations that have to
be calculated to the limited number of correlations between the common factors that affect asset
returns (Reference Box 1).
Box 1: Correlation Analysis

Core2 Group, Inc. Confidential and Proprietary. Do not copy or distribute. 5
3. Country Risk
Country risk can be calculated from an aggregate of specific risks related to doing business in a
country, and it is a critical component of credit risk assessment. The measurement of a country’s
risk environment includes the legal, government and human development considerations (see
Table 1). Given the ever increasingly complex nature of global markets, there are few globally
consistent measures to capture country risk.
Table 1: S&P Capital IQ Critical Country Risk ‘Risk Dimensions’ and ‘Factors’ assessment criteria
Country risk may be mitigated by hard currency cash flows received/earned by the counterparty.
Hard currency cash flow refers to revenue in a major (i.e., readily exchanged) international currency
(primarily U.S. and Canadian dollars, sterling, euros and Japanese yen).
Country risk needs to be differentiated from sovereign risk. For ease of our discussion, we focus on
country risk and define country risk as the risk that a counterparty, or obligor, will not be able to
pay its obligations (e.g. say because of cross-border restrictions on the convertibility or availability
of a given currency). Country risk analysis calls for an assessment of risks that range from analyzing
political risk to analyzing the economic risk of a country. Country risk exists becomes material when
there is more than a prescribed percentage (say 25 %) of the obligor’s (gross) cash flow (or assets)
located outside of the local market.
Digital data activity and measures can be used to supplement, complement and enhance the
aforementioned traditional risk dimensions, factors and analysis. Digital activity data analysis across
a user-selected set of countries and/or groupings along with global totals, e.g., country roll-ups for
emerging, and frontier markets, can provide additional insight and analysis flexibility (see Box 2).
Core2 Group, Inc. Confidential and Proprietary. Do not copy or distribute. 6
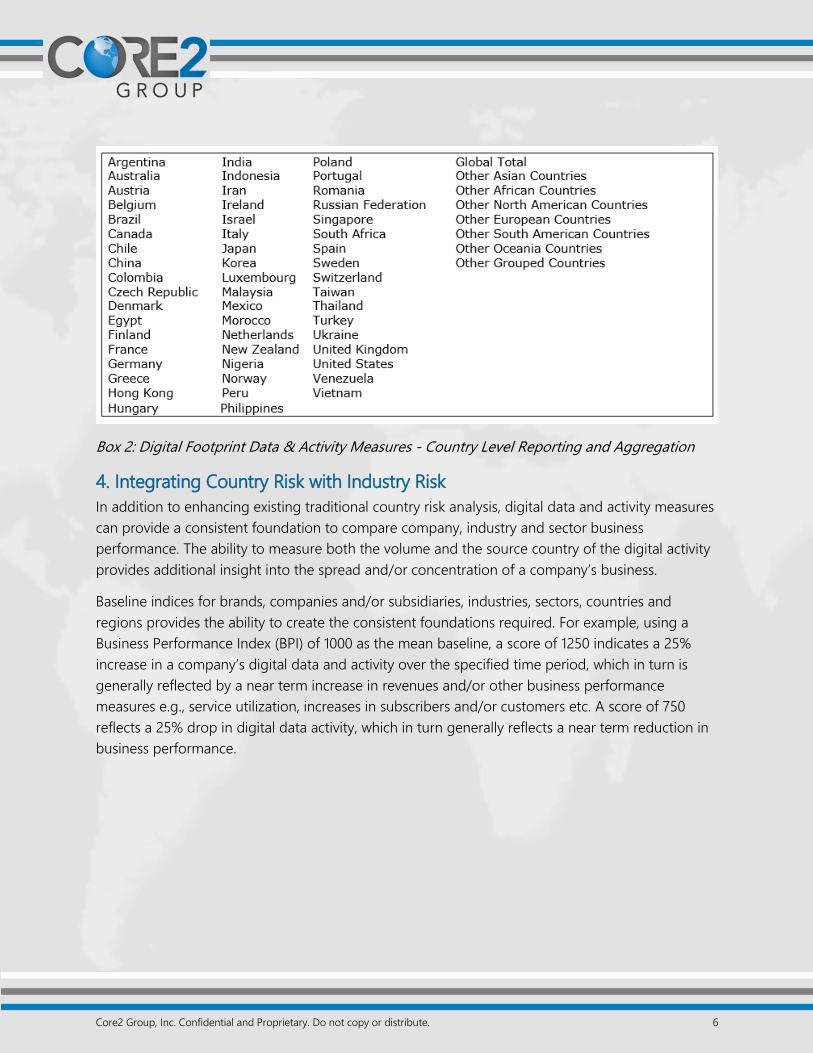
Box 2: Digital Footprint Data & Activity Measures - Country Level Reporting and Aggregation
4. Integrating Country Risk with Industry Risk
In addition to enhancing existing traditional country risk analysis, digital data and activity measures
can provide a consistent foundation to compare company, industry and sector business
performance. The ability to measure both the volume and the source country of the digital activity
provides additional insight into the spread and/or concentration of a company’s business.
Baseline indices for brands, companies and/or subsidiaries, industries, sectors, countries and
regions provides the ability to create the consistent foundations required. For example, using a
Business Performance Index (BPI) of 1000 as the mean baseline, a score of 1250 indicates a 25%
increase in a company’s digital data and activity over the specified time period, which in turn is
generally reflected by a near term increase in revenues and/or other business performance
measures e.g., service utilization, increases in subscribers and/or customers etc. A score of 750
reflects a 25% drop in digital data activity, which in turn generally reflects a near term reduction in
business performance.

Core2 Group, Inc. Confidential and Proprietary. Do not copy or distribute. 7
Additionally, detailed digital data activity measures (web, mobile, e-mail and machine-to-machine
activity), can be measured at the source (i.e. the country of origin), as well as relative levels of total
Digital Activity within a region and individual country over varying periods for all or any subset of
regions (see Table 2).
Table 2: Regional and Country Level Digital Data Activity Source Measurement (Country
Momentum Index – CMI (1, 2))
1. Please refer to the description of CMI noted in the appendix
2. Please note: Data included in this and other tables is illustrative and does not reflect specific measures and/or timeframes
The direction and color of the arrows in Table 2 identifies the strength of both the level and trend
of each country’s digital activity and performance. A green arrow indicates a 5% or greater increase
in activity over the period. The yellow upward arrow indicates an increase of up to 5% over the
period, while a yellow downward arrow indicates a decrease of up to 5% over the period. A red
downward arrow indicates a 5% or greater decrease in activity over the period.
As outlined in Table 2, Global and North American digital activity source levels have been relatively
flat over the last 12 months, while activity from Russia has grown. As the current regime of
economic sanctions and reduced oil prices is having a significant negative impact on the internal
Russian economy, the increased traffic levels from Russia may be indicative of internal sectors
seeking external market opportunities.

Core2 Group, Inc. Confidential and Proprietary. Do not copy or distribute. 8
5. Industry Rating
A common risk analysis approach is to assess industries using a ratings scheme, as example with a
1 (minimal risk) to 5 (very high risk) scale across a set of criteria for each industry. The criteria may
include, but not be limited to, ratings of competitiveness, trade environment, regulatory
framework, restructuring, technological change, financial performance, long-term trends affecting
performance and vulnerability to a macroeconomic environment.
Table 3 provides a subset of the various sectors and industries often included in industry based risk
analysis and ratings scheme approaches. Each sector and industry’s digital activity is be used to
provide additional insight and understanding of performance across industry, sectors and country
performance for an individual company credit adjudication process.
Table 3: Global Industry Classification Standard (GICS®) Industry & Sector Examples
Consumer Discretionary Health Care Industrials
Automobiles & Components Health Care Equipment & Service Capital Goods
Auto Components Health Care Equipment & Supplies Aerospace & Defense
Automobiles Health Care Providers & Service Building Products
Consumer Durables & Apparel Health Care Technology Construction & Engineering
Household Durables Pharmaceuticals, Biotechnology Electrical Equipment
Leisure Products Biotechnology Industrial Conglomerates
Textiles, Apparel & Luxury Pharmaceuticals Machinery
Consumer Services Life Sciences Tools & Services Trading Companies & Distributor
Hotels Restaurants & Leisure Information Technology Commercial & Professional Services
Diversified Consumer Services Software & Services Commercial Services & Supplies
Media Internet Software & Services Professional Services
Media IT Services Transportation
Retailing Software Air Freight & Logistics
Distributors Technology Hardware & Equipment Airlines
Internet & Catalog Retail Communications Equipment Marine
Multiline Retail Technology Hardware, Storage Road & Rail
Specialty Retail Electronic Equip., Instruments Transportation Infrastructure
Consumer Staples Semiconductors & Semiconductor Materials
Food & Staples Retailing Financials Chemicals
Food & Staples Retailing Banks Construction Materials
Food Beverage & Tobacco Banks Containers & Packaging
Beverages Thrifts & Mortgage Finance Metals & Mining
Food Products Diversified Financials Paper & Forest Products
Tobacco Diversified Financial Services Telecommunication Services
Household & Personal Products Consumer Finance Diversified Telecommunication
Household Products Capital Markets Wireless Telecommunication Services
Personal Products Insurance Utilities
Energy Insurance Electric Utilities
Energy Equipment & Services Real Estate Gas Utilities
Oil, Gas & Consumable Fuels Real Estate Investment Trusts Multi-Utilities
Real Estate Management & Development Water Utilities
Independent Power and Renewable

Core2 Group, Inc. Confidential and Proprietary. Do not copy or distribute. 9
As highlighted in Table 4 below, the core cyclical Retailing group, and the non-cyclical Software
and Services sectors have shown consistent growth over the last 12 months. While Semiconductors,
Telecommunication Services and Utilities have seen recent weakness. However, all sectors have
seen positive increases over their baseline performance metric of 1000.
Table 4: Digital Footprint Data & Activity Measures- Sector Level Reporting and Aggregation
level by industry category and group. (Sector Momentum Index – SMI (1, 2))
1. Please refer to the description of SMI noted in the appendix
2. Please note: Data included in this and other tables is illustrative and does not reflect specific measures and/or timeframes
As noted previously, the green arrow in Table 4 indicates a 5% or greater increase in activity over
the period. The yellow upward arrow indicates an increase of up to 5% over the period, while a
yellow downward arrow indicates a decrease of up to 5% over the period. The red downward
arrow indicates a 5% or greater decrease in activity over the period.

Core2 Group, Inc. Confidential and Proprietary. Do not copy or distribute. 10
6. Forward Measures of Risk
Forward measures of risk can be constructed by analyzing digital activity and business performance
measures. These digital measures augment traditional measures such as implied volatility. For
example, a forward measure of the cost of credit risk can be linked to estimating implied volatility
of a put since the value of a put is the cost of eliminating the credit risk associated with providing a
loan to a firm (reference Box 3). Implied volatility is a forward measure of risk.
Box 3: Put Cost of Credit Risk
We can write the value of the put as:
And is the standard deviation of the rate of return of the firm’s assets.2
2 The model illustrates that the credit risk, and its costs, is a function of the riskiness of the assets of the firm,
and this risk is also a function of the time interval until debt is paid back, T. The cost is also affected by the risk-free interest rate r: the higher r is, the less costly it is to reduce credit risk. The cost is a homogeneous function of
the leverage ratio, LR =

Core2 Group, Inc. Confidential and Proprietary. Do not copy or distribute. 11
Weighted digital performance measures can be integrated with sovereign and country risk
measures to provide supplementary insight into forward measures of risk.
Table 5: Illustrative Performance Measure / Timeframe Weighting Allocation Examples (1-4)
1. Both Performance Measure and Timeframe weighting allocations = 100%
2. Measured by Business Performance Index (BPI). Please refer to description noted in the appendix
3. Measured by Sector Momentum Index (SMI). Please refer to description noted in the appendix
4. Measured by Country Momentum Index (CMI). Please refer to description noted in the appendix
Based on the understanding of company and portfolio seasonality and volatility, digital activity and
performance measures within forward measure of credit risk calculations can be weighted over the
appropriate timeframes. Nearer term measurements may be given more weight as they are
stronger indicators of “yet to be released and/or available” business performance measures such as
sales, revenue and levels of business and/or exposure to sectors and/or countries with higher risk
and/or credit profiles.

Core2 Group, Inc. Confidential and Proprietary. Do not copy or distribute. 12
7. Integrating Industry Risk & Country Risk
Case Study: Automobile company performance across multiple brands,
companies and countries
The core cyclical Automobile & Components group (see Table 6) has shown consistent growth over
the last 12 months, driven by aging consumer owned vehicle years, “relaxed” credit and
underwriting strategies and aggressive marketing. While other sectors have reduced with the
recent slowing economic activity.
Table 6: Digital Data & Activity - Sector Level Reporting and Aggregation – Automobile &
Components (1)
1. Please note: Data included in this and other tables is illustrative and does not reflect specific measures and/or timeframes
7.1 Integrating Company Risk with Industry Risk
Fluctuations in digital data activity and volatility over time can provide further detailed insight and
additional lift to optimizing risk adjusted return strategies.
Table 7 compares the performance of a number of automobile companies, their associated brands
and competitors over a 12 month period. Digital Activity Momentum measures the percentage of
days over a 90 day period where activity increased over the preceding day. Activity Frequency
measures the volume of digital activity, while Activity Reach measures the “geographic spread” of
digital activity. The peer group total of both Activity Frequency and Activity Reach equals 100%.

Core2 Group, Inc. Confidential and Proprietary. Do not copy or distribute. 13
Company performance over the last 3 and 6 month and 1 year time periods is measured using the
Business Performance Index (BPI).
Table 7: Consumer Discretionary – Automobiles & Components – Automobiles Subset (Digital
Activity Momentum Business Performance Index – BPI (1, 2))
1. Please refer to the description of BPI noted in the appendix
2. Please note: Data included in this and other tables is illustrative and does not reflect specific measures and/or timeframes
The significant benefit of being able to compare company and sector digital activity growth and
performance measures, is that they are available on a far timelier and consistent basis than relying
upon historically reported and often “disguised” cash flow and balance sheet data and analysis.
Activity levels can be monitored and measured in percentage terms (sum of share columns =
100%) across multiple timeframes, competitive groups and/or portfolio exposures. Activity levels
Data as of 2/1/2015
% Up Days in Last
90 DaysCurrent
Share ∆ Vs 1
Year AgoCurrent
Share ∆ Vs 1
Year Ago
Last 3
Months
Last 6
Months
Over 1
Year
BMW 43% 5.9% 0.1% 12.7% (1.2%) -1% 2% 12%
Chrysler 42% 6.6% 19.9% 4.3% (7.0%) 1% 22% -2%
Dodge 45% 0.7% 14.8% 1.9% 16.3% -1% 7% 33%
Fiat 50% 4.0% (0.4%) 5.5% (47.5%) -41% -47% -36%
Hyundai 39% 4.2% 4.7% 4.8% 7.3% -8% -4% 9%
Infiniti 39% 0.6% (4.5%) 1.8% 3.2% -3% 7% 18%
Jaguar 52% 0.7% 6.1% 1.6% 8.5% 2% -6% 23%
Jeep 50% 1.0% 42.5% 2.8% 43.5% 17% 21% 60%
Kia 42% 0.9% 26.4% 2.1% 14.1% -11% -8% 27%
Land Rover 46% 1.5% 10.9% 2.1% 62.8% -8% 36% 76%
Mazda 55% 1.3% 24.0% 2.9% 27.0% 7% 26% 35%
Mini Cooper 48% 0.6% 0.9% 1.4% 7.4% 0% -2% 18%
Nissan 28% 3.8% 2.7% 7.7% (11.8%) -17% -13% -4%
Audi 47% 2.8% (2.3%) 3.9% (29.1%) -1% -4% -16%
Buick 42% 0.3% 12.8% 0.8% 11.3% 6% 2% 34%
Cadillac 44% 0.4% 5.5% 1.1% (31.2%) 3% 2% -16%
Chevrolet 45% 1.3% (1.7%) 2.5% 22.9% -22% 7% 40%
Ford 40% 26.9% (0.9%) 8.2% 17.0% 2% 9% 26%
GMC 53% 0.5% 25.1% 1.4% 46.2% 2% 27% 75%
Lexus 51% 1.3% 43.5% 3.0% 57.9% 10% 23% 73%
Lincoln 27% 2.4% 17.1% 2.2% (14.0%) -2% -7% 18%
Porsche 48% 1.3% 19.5% 2.8% 20.3% 10% 32% 44%
Toyota 42% 4.0% 17.3% 5.0% 11.1% -1% 4% 18%
VW 40% 2.8% 27.2% 3.5% 10.1% -2% -10% 19%
Acura 47% 2.5% 19.0% 1.3% 13.1% 9% 28% 25%
Dodge Ram 50% 0.6% 17.4% 1.6% 16.3% 11% 5% 34%
Honda 32% 7.1% (0.8%) 3.3% (5.3%) -11% -12% 4%
Mercedes-Benz 35% 11.4% (45.1%) 5.2% (33.4%) -50% -43% -27%
Rolls-Royce 44% 0.4% 20.3% 0.7% 62.5% 7% 41% 76%
Smart Car 40% 2.1% 24.3% 1.9% 81.5% -5% 22% 108%
Company / Brand
Overview of Company Performance - Global Total
Global Total
Company Share
of the Peer Group Digital
Activity Frequency
Company Current
Digital Activity
Momentum
Company Performance
Over the Period
Company Share
of the Peer Group Digital
Activity Reach
Frequency
Growth
Reach
Growth
Last 1 Year 3.5% 7.2%
Last 6 Months (11.2%) (4.3%)
Last 3 Months (15.8%) (8.2%)
Peer Group Snap Shot

Core2 Group, Inc. Confidential and Proprietary. Do not copy or distribute. 14
can also be monitored for a company’s competitors and customers, providing industry and
marketplace insights and identifying any significant short changes in activity levels that would not
be easily observed and/or available on a timely basis, particularly for privately owned
organizations.
Further examples of the correlation of Core2 data with the measurement of Probability of
Default (PD) and indication of credit score direction are outlined in S&P Capital IQ’s Credit
Market Pulse, Page 2, Issue 11, December 2015 (Click on link to view: http://www.spcapitaliq-
credit.com/cms/wp-content/uploads/Credit_Market_Pulse_Issue_11_Dec15.pdf?t=1450340632)
Additional analysis examples and insights are available on Core2’s “First Look” website (Click on
link to view: http://www.core2group.com/first-look/)
7.2 Tier Assessment
Digital activity is used to provide valuable orthogonal information about a company’s relative
position within an industry and industry tiers. Digital activity measures can also reveal additional
information about the health of the industry and the performance of a company in comparison to
its peers and the industry, beyond what is typically used in current analysis.
If a business is ranked against its competition then a company’s relative position within an industry
impacts it credit risk rating. If the company supplies a product/service that is subject to global
competition then it should be ranked into tiers on a global basis. If the company’s competitors are
by nature local or regional, as are many retail businesses, then it should be ranked on that basis.
An illustrative four-tier system is shown in Box 4.
Tier 1 players are major players with a dominant share of the relevant market (local, regional, domestic,
international or niche). They have a diversified and growing customer base with low production costs that are
based on sustainable factors (such as a diversified supplier base, economies of scale, location and resource
availability, continuous upgrading of technology, etc.). Such companies respond quickly and effectively to
changes in the regulatory framework, trading environment, technology, demand patterns and
macroeconomic environment.
Tier 2 players are important or above-average industry players with a meaningful share of the relevant
market (local, regional, domestic, international or niche).
Tier 3 players are average (or modestly below average) industry players, with a moderate share of the
relevant market (local, regional, domestic, international or niche).
Tier 4 players are weak industry players and have a declining customer base. They have a high cost of
production due to factors such as low leverage with suppliers, obsolete technologies, and so on.
Box 4: Four-Tier System
The analysis of a company’s historical performance from internal data sources and the correlation
of digital activity with those internal performance measures can be used to create dynamic
company and portfolio risk analysis and monitoring capabilities.

Core2 Group, Inc. Confidential and Proprietary. Do not copy or distribute. 15
The Activity Momentum measure is an index of the change in web based activity over the period,
while the Market / Sector Share Growth measure is an index of the change in market share of the
individual auto manufactures / brands included in the data set.
As an example, the capability to dynamically monitor the digital activity levels of the companies
within the Automobile Manufacturer sector can be used to realign risk exposure and/or
classifications of risk. Figures 1a and 1b show the comparison of digital activity levels and
momentum in comparison to industry participants as well as subsidiaries within an organization.
The change in the size of the “Bubble” is determined by the change in the volume of a company’s
digital activity. The position of the “Bubble” on each of the Performance / Risk Classification charts
axis’s is driven by the change in the level of the momentum of a company’s digital activity
(percentage of up days vs. down days over the time period) and change in the company’s Market /
Sector Share of the total peer group digital activity (company’s percentage share of the sector /
peer group’s total digital activity) over time. As an example, while the individual US based divisions
of Fiat (Chrysler, Jeep, Dodge), have performed well over the time period, the significant reduction
in performance of Fiat, as highlighted in Table 7, has reduced the overall market share and
momentum of the group. Observe the reduced size of the Fiat “Bubble” and the movement from
Risk Tier 2 (High Market Share Growth & Low Momentum) to Risk Tier 4 (Low Market Share Growth
& Low Momentum). For Fiat, Sector / Market Share Growth has declined significantly over the time
period, while Company Activity / Momentum has remained stagnant in comparison to other sector
/ peer group companies.
Figure 1a: Auto Manufacturers - Performance / Risk Classification by company Digital Activity growth and
sector share as at the beginning of a twelve month period (1)
1. Please note: Data included in this and other figures is illustrative and does not reflect specific measures and/or timeframes

Core2 Group, Inc. Confidential and Proprietary. Do not copy or distribute. 16
Figure 1b: Auto Manufacturers - Performance / Risk Classification by company Digital Activity
growth and sector share at the end of a twelve month period(1)
1. Please note: Data included in this and other figures is illustrative and does not reflect specific measures and/or timeframes
Additionally, the availability of digital activity data at the subsidiary, operating group levels and
broader company levels (e.g., from Jeep.com, to Chrysler to the Fiat holding company level), allows
for the comparison of market players to their competitors and to themselves over time, further
enhancing risk analysis insight and capability.
7.3 Integrating Country Exposure Risk with Company Risk
Knowing the variety of sources and varying strengths of a company’s digital activity across the
organization can provide further insight into the analysis of changes in performance and
consequent risk across a company, sector and/or country. For example, rather than simply applying
a company’s country of domicile and/or sovereign risk rating within the risk adjudication process,
knowing the country(ies) of origin of a company’s digital activity can be used to determine the
appropriate Digital Activity Source Country Risk weighting (Please refer to the weighting example
in Table 5).
Core2 Group, Inc. Confidential and Proprietary. Do not copy or distribute. 17
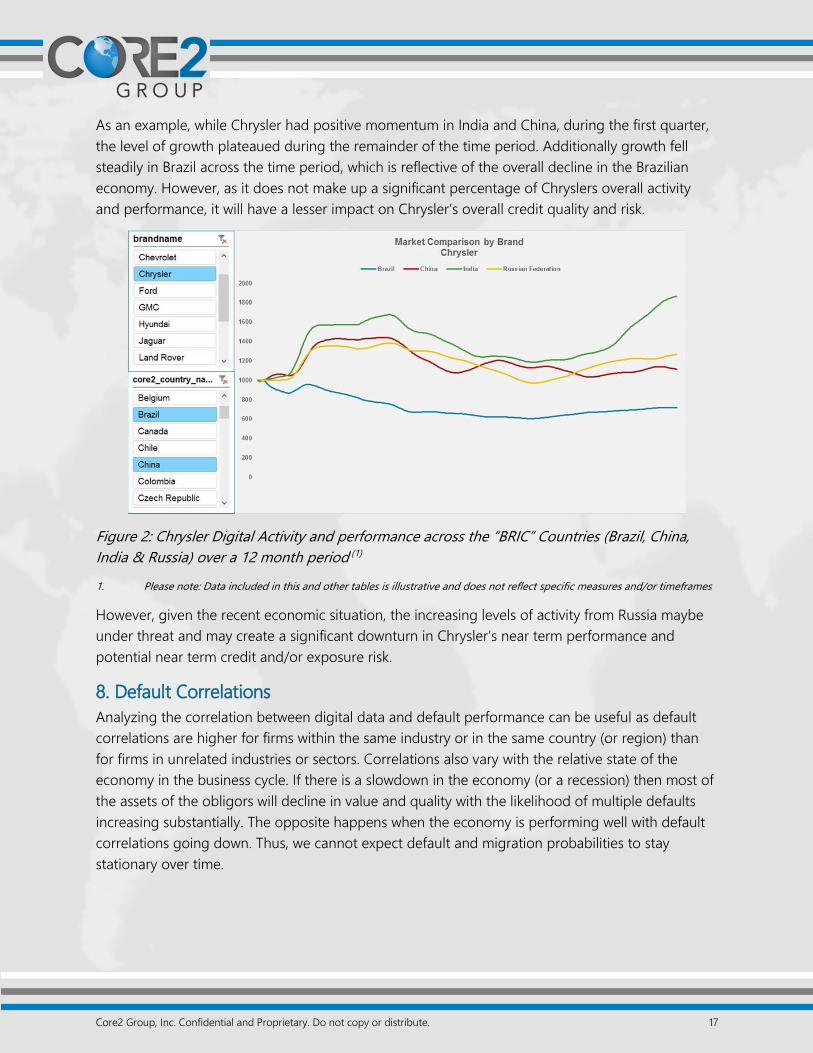
As an example, while Chrysler had positive momentum in India and China, during the first quarter,
the level of growth plateaued during the remainder of the time period. Additionally growth fell
steadily in Brazil across the time period, which is reflective of the overall decline in the Brazilian
economy. However, as it does not make up a significant percentage of Chryslers overall activity
and performance, it will have a lesser impact on Chrysler’s overall credit quality and risk.
Figure 2: Chrysler Digital Activity and performance across the “BRIC” Countries (Brazil, China,
India & Russia) over a 12 month period (1)
1. Please note: Data included in this and other tables is illustrative and does not reflect specific measures and/or timeframes
However, given the recent economic situation, the increasing levels of activity from Russia maybe
under threat and may create a significant downturn in Chrysler’s near term performance and
potential near term credit and/or exposure risk.
8. Default Correlations
Analyzing the correlation between digital data and default performance can be useful as default
correlations are higher for firms within the same industry or in the same country (or region) than
for firms in unrelated industries or sectors. Correlations also vary with the relative state of the
economy in the business cycle. If there is a slowdown in the economy (or a recession) then most of
the assets of the obligors will decline in value and quality with the likelihood of multiple defaults
increasing substantially. The opposite happens when the economy is performing well with default
correlations going down. Thus, we cannot expect default and migration probabilities to stay
stationary over time.

Core2 Group, Inc. Confidential and Proprietary. Do not copy or distribute. 18
The impact of correlations on risk is quite large. It is larger for portfolios with relatively low-grade
credit quality than it is for high-grade portfolios. Indeed, as the credit quality of the portfolio
deteriorates and the expected number of defaults increases, this number is magnified by an
increase in default correlations. Multi-factor analysis can be used to reduce the dimensionality of
estimation correlations. This approach maps each obligor to the countries and industries that are
most likely to determine its performance.
Default correlations can be derived from asset returns correlations. Asset return correlations are
not directly observable and therefore equity return correlations is used as a proxy. For example,
CreditMetrics makes use of equity returns as their proxy. CreditMetrics estimates the correlations
between the equity returns of various obligors. The correlations between changes in credit quality
can be inferred directly from the joint distribution of these equity returns. In a similar manner, we
can use the correlations between the digital activity measures and signals to support conclusions
about asset return correlations.
Equity returns are correlated to the extent that firms are exposed to the same industries and
countries. Yet using equity returns in this way is equivalent to assuming that all the firm’s activities
are financed by means of equity. This is a major drawback of the approach, especially when it is
being applied to highly leveraged companies. For those companies, equity returns are substantially
more volatile, and possibly less stationary, than the volatility of the firm’s assets.
This final step combines assessments of the health of the industry (i.e., industry rating) and the
position of a business within its industry (i.e., tier rating). The process reveals the vulnerability of a
company, particularly during recessions. Low quartile competitors within an industry class almost
always have higher risk (modified by the relative health of the industry).
Utilizing digital activity measures to supplement, complement and enhance traditional internal and
3rd party data sources and models within the risk adjudication process provides additional insight
into risk adjusted return performance as well as concentration risk measures such as correlations
when analyzing companies, industries and countries.
The traditional accounting approach is, in essence, backward looking. Past profits (or losses) are
calculated and analyzed, but future uncertainties are not measured at all. The end result is that
sometimes a major component of profitability does not appear in any consistent way in the
financial reports. Shareholders and financial analysts find it difficult to assess current and near term
performance, while regulators and rating agencies face problems when they try to determine the
riskiness of activities. Digital activity and its related indices are forward looking in contrast with
current historical accounting and performance data.

Core2 Group, Inc. Confidential and Proprietary. Do not copy or distribute. 19
There is always a compromise between accuracy and sophistication, on the one hand, and
applicability and aggregation on the other. Digital activity data provides a new forward-looking
dimension. The ability to analyze and understand both the frequency and market reach of digital
activity consistently across organizations, sectors and countries provides additional insight into
optimal risk adjusted return strategies.
For any questions or requests for further information and/or discussion, please contact the authors:
Hugh Lloyd-Thomas, Advisory Board Member, Executive Vice President, Financial Services, Core2
Group, Mobile: 917-716-5973 Email: [email protected]
Bob Mark, Board of Directors & Advisory Board Member, Core2 Group, Mobile: 925-212-7348
Email: [email protected]

Core2 Group, Inc. Confidential and Proprietary. Do not copy or distribute. 20
1. Core2 Business Performance Measure Definitions and Applications:
1.1 Core2 (C2) Frequency
Definition
An aggregate count of internet request queries to a company’s set of domains on a given day.
These queries include any devices (servers, tablets, mobile, refrigerators, cars etc.) that use DNS
routing to produce these requests. C2Frequency is derived from all digital activity and is made up
of mobile, web4, web6, email and machine queries.
1.2 Core2 (C2) Reach
Definition
The count of unique “Recursive Resolvers” querying a company’s set of domains in a given day.
This is done by determining the number of recursive resolvers from which a query originated and
adding it to a list. A “Recursive Resolver” is a server that queries the “Authoritative Name Server”
to resolve a domain/ address request i.e., the Recursive Resolver identifies and routes queries to
the end server(s) where the information being sought ultimately resides. “Recursive Resolvers” and
systems are used by Internet Service Providers (ISP’s) to improve their efficiency and processing
speed. Each day, the list is purged and restarted, resulting in the number of daily unique recursive
resolvers. The larger the number of “Recursive Resolvers” processing domain/ address requests,
the broader the geographic spread of user activity. Growth over time in the number of Recursive
Resolvers is also indicative of end user / account numbers and expansion.
1.3 Core2 (C2) Business Performance Index (BPI)*
Definition
The C2 BPI is derived from a measure of a company’s online business activity. The C2 BPI is an
index of relative performance of the company, acting like a score for performance. C2 BPI allows
for comparison of business health over time as well as easy comparisons between companies. This
index is highly correlated with stock price movement. This product is available by Country and
Sector.
Applications
Compare a company’s activity measures to identify drivers of positive or negative change.
Disparate patterns among the activity types provide an indication of performance. For example, a
consistent negative email signal paired with consistent positive web and machine signals indicates
negative future performance. Look at changes in C2BPI by Activity Type from different time
periods (28 days, 90 days, and 365 days) to identify growth or decline trends across time periods.

Core2 Group, Inc. Confidential and Proprietary. Do not copy or distribute. 21
1.4 Core2 (C2) Country Momentum Index (CMI and CMI.GPS)
Definition
C2CMI measures a country’s total outbound digital activity and momentum as an indicator of near
term and future economic direction. C2CMI.GPS is a directional indicator, highlighting short-term
trajectory changes in momentum that are predictive of longer-term trends. Both indices are
centered on 1,000 and available for all countries.
Applications
Use C2CMI to compare country growth and performance. Create a C2CMI.GPS to C2CMI ratio to
identify future growth or decline of C2CMI and its magnitude compared to previous changes. If
the ratio equals 1, there will be no change in C2CMI in the future. If the ratio is less than 1, it
indicates future decline, and if the ratio is greater than 1, it indicates future growth. Look at
changes in C2CMI.GPS to identify growth or decline trends across time periods. Additionally, both
measures can be used to compare against other countries.
1.5 Core2 (C2) Sector Momentum Index (SMI and SMI.GPS)
Definition
C2SMI provides insights into the inbound digital activity of key economic sectors and industries
based on the aggregate activity of listed equities. C2SMI.GPS is a directional indicator, highlighting
short-term trajectory changes in momentum that are predictive of longer-term trends. Both
indices are centered on 1,000, and providing insights into expanding and/or declining sectors
within a country as well as insights into near term and future sector direction.
Applications
Use C2SMI to compare sector performance within a specified country in order to understand
drivers of growth or decline within the economy. Create a C2SMI.GPS to C2SMI ratio in order to
identify future growth or decline of sectors and its magnitude compared to previous changes. If
the ratio equals 1, there will be no change in C2SMI in the future. If the ratio is less than 1, it
indicates future decline, and if the ratio is greater than 1, it indicates future growth. Look at
changes in C2SMI from different time periods (28 days, 90 days, and 365 days) to identify growth
or decline trends across time periods. Additionally, both measures can be used to compare
against other competitors or other countries.

Core2 Group, Inc. Confidential and Proprietary. Do not copy or distribute. 22
2. Author Biographies
Dr. Robert Mark
Board of Directors & Advisory Board Member, Core2 Group
Founding Managing Partner of Black Diamond Risk Enterprises
Dr. Robert M. Mark is the Founding Managing Partner of Black Diamond Risk
Enterprises, which provides corporate governance, risk management consulting,
risk software tools and transaction services. He has led Treasury/Trading activities as well as Risk
Management functions at Tier 1 banks. Dr. Mark is the Founding Executive Director of the Masters
of Financial Engineering (MFE) Program at the UCLA Anderson School of Management and served
as a Risk Advisory Director for the Entergy Koch energy trading company. He was awarded the
Financial Risk Manager of the Year by the Global Association of Risk Professionals (GARP). He is a
Cofounder of the Professional Risk Managers’ International Association (PRMIA).
Prior to his current position, he was the Corporate Treasurer and Chief Risk Officer (CRO) at the
Canadian Imperial Bank of Commerce (CIBC). He was a Senior Executive Vice President and
member of the Management Committee at CIBC. Dr. Mark’s global responsibility covered all credit,
market, and operating risks for all of CIBC as well as for its subsidiaries.
Prior to CIBC, he was the partner in charge of the Financial Risk Management Consulting practice
at C&L (now PwC) .The Risk Management Practice advised clients on risk management issues and
was directed toward financial institutions and multi-national corporations. Prior to his position at
C&L, he was a managing director at Chemical Bank (now JPMC). His responsibilities encompassed
risk management, asset/liability management, research (quantitative analysis), strategic planning
and analytical systems. He served on the Senior Credit Committee. Before he joined Chemical
Bank, he was a senior officer at HSBC where he headed the technical analysis trading group.
He earned his Ph.D., with a dissertation in options pricing, from NYU Graduate School of
Engineering and Science, graduating first in his class. Subsequently, he received an APC in
accounting from NYU’s Graduate School of Business, and graduated from the Harvard Business
School Advanced Management Program. He is an Adjunct Professor and co-author of Risk
Management -McGraw-Hill (2001), The Essentials of Risk Management – (EoRM) -McGraw Hill
(2006) and an updated 2nd version of the EoRM-McGraw Hill (2013). Dr. Mark served on the
boards of ISDA, Fields Institute for Research in Mathematical Sciences, IBM’s Deep Computing
Institute, PRMIA as well as Chairperson of National Asset/Liability Management Association
(NALMA).

Core2 Group, Inc. Confidential and Proprietary. Do not copy or distribute. 23
Hugh Lloyd-Thomas
Advisory Board Member, Core2 Group
Executive Vice President, Financial Services, Core2 Group
Hugh brings over 25 years of experience in US, European, and Asia Pacific
financial services markets, developing and delivering innovative and disruptive
credit risk and marketing data, predictive analytic solutions and strategies that
create competitive advantage and profitability for both clients and partners.
Prior to joining Core2 Group, Hugh was a Senior Partner at FICO through the acquisition of
InfoCentricity. Prior to InfoCentricity, Hugh was Group VP, Consumer & Small Business Credit at IXI
Services, (acquired by Equifax in 2009) and was responsible for the launch, development and
management of the Credit Sector and solutions. Previously, Hugh held domestic and international
strategic account management roles with FICO for major clients including Citibank, American
Express and JPMorgan Chase. Hugh also held senior manager positions in the financial services
consulting groups at Ernst & Young and Price Waterhouse. Hugh has a Commerce degree from
the University of Melbourne (Australia), Post Graduate studies in Finance from the University of
Technology Sydney (Australia), and is a Senior Associate with the Australian Institute of Bankers.

Core2 Group, Inc. Confidential and Proprietary. Do not copy or distribute. 24
Core2 Group, Inc. was formed to source new, breakthrough data to build proprietary, predictive
signals that provide early and insider insights into company, country and brand performance.
Core2 sources public, private and proprietary data to build these predictive signals of daily
business and brand performance. Core2 has conducted extensive research and development over
the last 3 years, testing and validating more than 100 signals to confirm they provide early
orthogonal insights of business performance. Core2’s comprehensive data and predictive science
teams had to build a new series of proprietary processes capable of filtering, aggregating and
modeling these data to extract the predictive insights to build our signal algorithms and confirm
they consistently delivered alpha over time.
Core2 Group, Inc.
7925 Jones Branch Drive, Suite 6400
McLean VA, 22102
www.core2group.com
Core2 Group, Inc. Copyright © 2015, Core2 Group, Inc.
All rights reserved.