cover story - youthincmag
TRANSCRIPT
_COVER STORY
21 Youth Incorporated ║ MARCH 2013
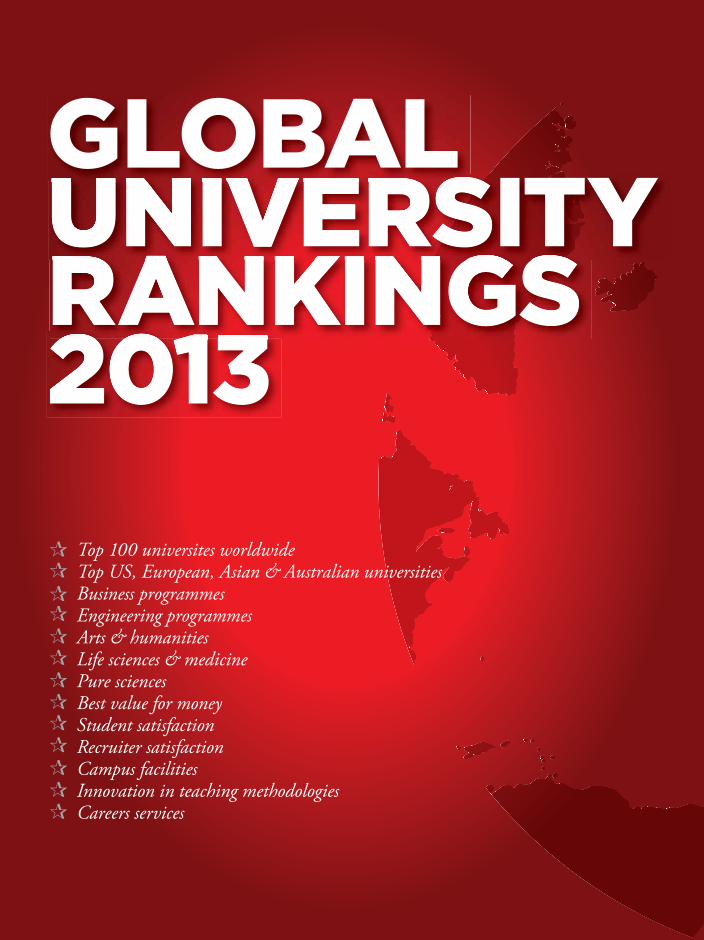
Top 100 universites worldwideTop US, European, Asian & Australian universitiesBusiness programmesEngineering programmesArts & humanitiesLife sciences & medicinePure sciencesBest value for moneyStudent satisfactionRecruiter satisfactionCampus facilitiesInnovation in teaching methodologiesCareers services
22MARCH 2013 ║ Youth Incorporated
An exercise in ranking the best higher education institutes of the world is no mean task. Information
gathering in itself is an exhaustive exercise, while number-crunching and analysing gives meaning to the massive raw data. The aim of the Youth Incorporated, Education Times and Rediff .com Global University Rankings 2013 through this sophisticated exercise is to identify and ascertain the universities in the world that are fulfi lling their commitment to provide quality education. Th e study was conducted over several months using research and survey inputs from thousands of people in more than 50 countries. We have brought together a large group of responses from not just institutes but also
from current students. Additionally, feedback from 6,500 known recruiters on their experience of recruiting graduates from the institutes has greatly enhanced the survey. Th us, the universities were ranked using the responses of three indigenous groups based on factors that include fi nancial aid, campus facilities, diversity of students, career prospects and more. Th e survey also allowed us to go one step further and provide you with more specialised rankings which take into account individual factors such as campus facilities, value for money and exchange programmes that come into play when picking a university. We have also ranked the best universities based on regional distribution and have provided separate rankings of the best institutes in study streams such as engineering, the arts, management and the sciences.
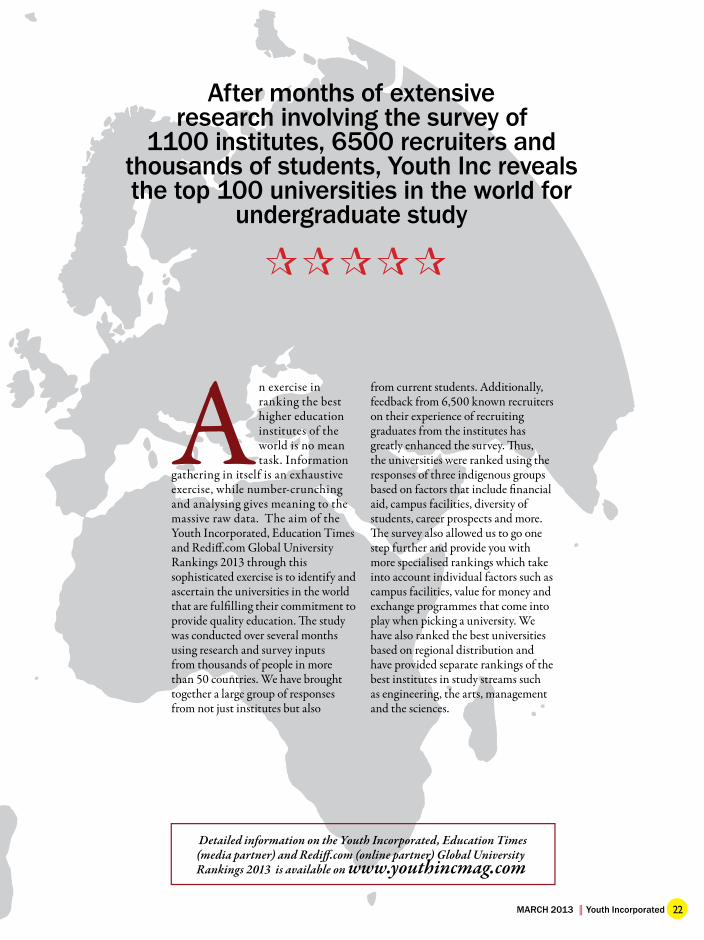
After months of extensive research involving the survey of
1100 institutes, 6500 recruiters and thousands of students, Youth Inc reveals the top 100 universities in the world for
undergraduate study
Detailed information on the Youth Incorporated, Education Times (media partner) and Rediff .com (online partner) Global University Rankings 2013 is available on www.youthincmag.com
_COVER STORY
23 Youth Incorporated ║ MARCH 2013
Media Partner Online Partner
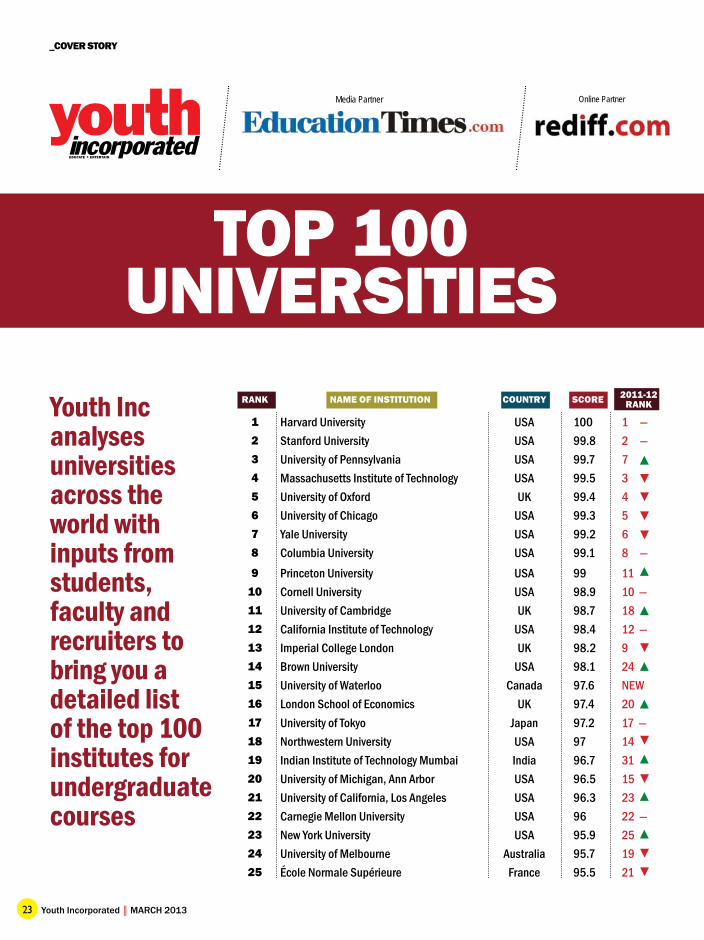
Youth Inc analyses universities across the world with inputs from students, faculty and recruiters to bring you a detailed list of the top 100 institutes for undergraduate courses
TOP 100 UNIVERSITIES
RANK NAME OF INSTITUTION COUNTRY SCORE 2011-12 RANK
1 Harvard University USA 100 1 —2 Stanford University USA 99.8 2 —3 University of Pennsylvania USA 99.7 7 4 Massachusetts Institute of Technology USA 99.5 35 University of Oxford UK 99.4 4 6 University of Chicago USA 99.3 57 Yale University USA 99.2 68 Columbia University USA 99.1 8 —9 Princeton University USA 99 11
10 Cornell University USA 98.9 10 — 11 University of Cambridge UK 98.7 18 12 California Institute of Technology USA 98.4 12 — 13 Imperial College London UK 98.2 9 14 Brown University USA 98.1 24 15 University of Waterloo Canada 97.6 NEW16 London School of Economics UK 97.4 2017 University of Tokyo Japan 97.2 17 —18 Northwestern University USA 97 1419 Indian Institute of Technology Mumbai India 96.7 3120 University of Michigan, Ann Arbor USA 96.5 1521 University of California, Los Angeles USA 96.3 2322 Carnegie Mellon University USA 96 22 —23 New York University USA 95.9 2524 University of Melbourne Australia 95.7 1925 École Normale Supérieure France 95.5 21
24MARCH 2013 ║ Youth Incorporated
RANK NAME OF INSTITUTION COUNTRY SCORE 2011-12 RANK
26 National University of Singapore Singapore 95.3 2927 Indian Institute of Technology Delhi India 95.2 NEW28 Duke University USA 95 28 —29 IE University Spain 94.9 3730 Chinese University of Hong Kong China 94.7 2731 University of California, Berkeley USA 94.6 3032 Ludwig-Maximilians-Universität München Germany 94.3 32 — 33 Hong Kong University of Science & Tech China 94.2 3534 Johns Hopkins University USA 94.1 34 —35 Emory University USA 94 33 36 École Polytechnique Fédérale de Lausanne Switzerland 93.9 36 —37 University College London UK 93.7 26 38 Dartmouth College USA 93.6 4139 University of Virginia USA 93.4 4340 University of Copenhagen Denmark 93.1 3841 Universidade de São Paulo Brazil 92.6 4742 University of Zürich Switzerland 92.5 3943 Kings College, London UK 92.3 40 44 Rice University USA 92 44 —45 University of Texas at Austin USA 91.5 45 —46 University of British Columbia Canada 91.1 4247 Peking University China 91 52 48 Pontifi cia Universidad Católica de Chile Chile 90.9 48 —49 Universität Heidelberg Germany 90.7 50 50 Technische Universität München Germany 90.5 53
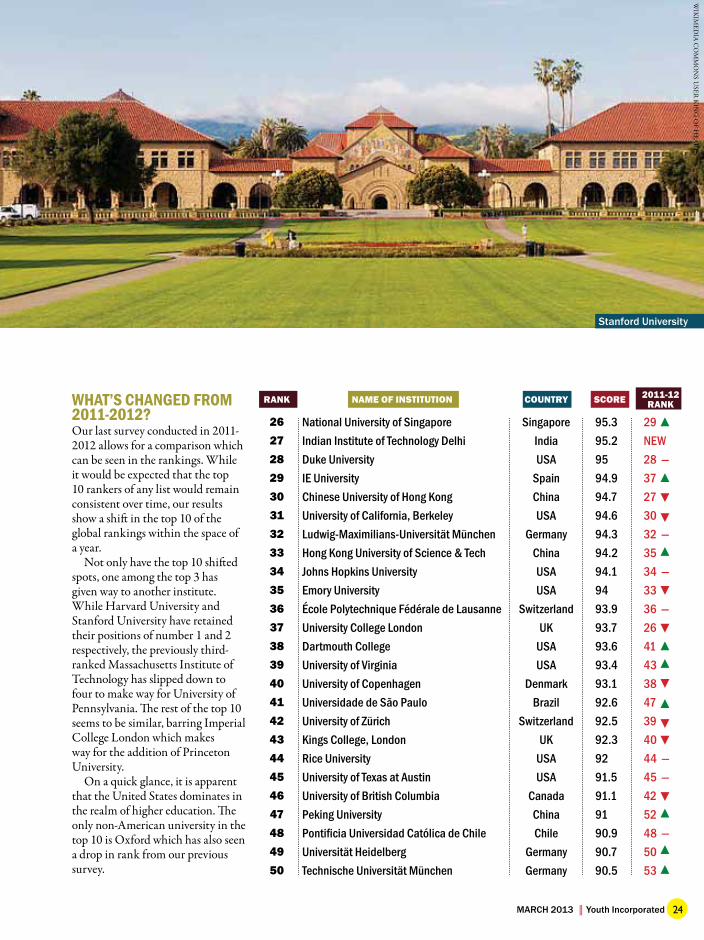
WHAT’S CHANGED FROM 2011-2012?Our last survey conducted in 2011-2012 allows for a comparison which can be seen in the rankings. While it would be expected that the top 10 rankers of any list would remain consistent over time, our results show a shift in the top 10 of the global rankings within the space of a year.
Not only have the top 10 shift ed spots, one among the top 3 has given way to another institute. While Harvard University and Stanford University have retained their positions of number 1 and 2 respectively, the previously third-ranked Massachusetts Institute of Technology has slipped down to four to make way for University of Pennsylvania. Th e rest of the top 10 seems to be similar, barring Imperial College London which makes way for the addition of Princeton University.
On a quick glance, it is apparent that the United States dominates in the realm of higher education. Th e only non-American university in the top 10 is Oxford which has also seen a drop in rank from our previous survey.
Stanford University
WIK
IMED
IA CO
MM
ON
S USER
KIN
G O
F HEA
RTS
_COVER STORY
25 Youth Incorporated ║ MARCH 2013
RANK NAME OF INSTITUTION COUNTRY SCORE 2011-12 RANK
51 University of Helsinki Finland 90.2 51 —52 University of Sydney Australia 90.1 46 53 HEC France 89 5554 Vanderbilt University USA 88.7 4955 Universidad de Buenos Aires Argentina 88.3 56 56 Nanyang Technological University Singapore 88.1 61 57 Fudan University China 87.9 6958 Australian National University Australia 87.6 58 —59 Tokyo Institute of Technology Japan 87.3 6660 Seoul National University South Korea 87.1 60 —61 University of Southern California USA 87 57 62 University of Warwick UK 86.6 7563 University of Wisconsin Madison USA 86.2 62 64 École Polytechnique France 86 71 65 Monash University Australia 85 67 66 University of Birmingham UK 84 NEW67 Erasmus University Rotterdam Netherlands 83 7068 Universidad Nacional Autónoma de México Mexico 82 68 —69 University of New South Wales Australia 81.5 59 70 University of Edinburgh UK 81 6471 University of North Carolina Chapel Hill USA 80 65 72 University of Auckland New Zealand 79.7 76 73 Tohoku University Japan 79.5 73 —74 Tsinghua University China 79 72 75 Uppsala University Sweden 78.6 74
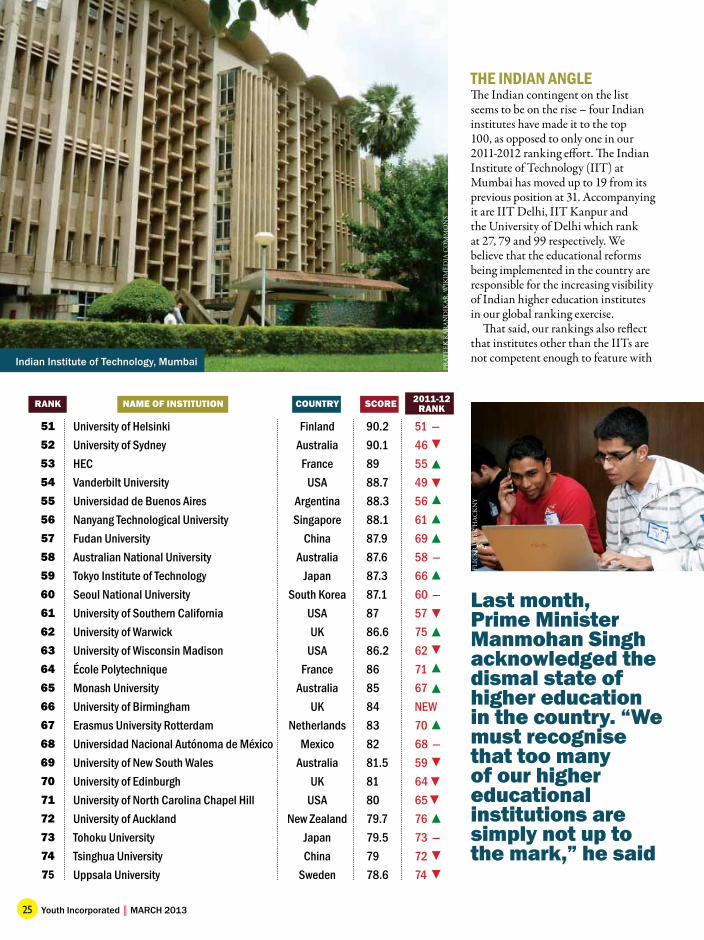
THE INDIAN ANGLETh e Indian contingent on the list seems to be on the rise – four Indian institutes have made it to the top 100, as opposed to only one in our 2011-2012 ranking eff ort. Th e Indian Institute of Technology (IIT) at Mumbai has moved up to 19 from its previous position at 31. Accompanying it are IIT Delhi, IIT Kanpur and the University of Delhi which rank at 27, 79 and 99 respectively. We believe that the educational reforms being implemented in the country are responsible for the increasing visibility of Indian higher education institutes in our global ranking exercise.
Th at said, our rankings also refl ect that institutes other than the IITs are not competent enough to feature with
Last month, Prime Minister Manmohan Singh acknowledged the dismal state of higher education in the country. “We must recognise that too many of our higher educational institutions are simply not up to the mark,” he said
Indian Institute of Technology, Mumbai
PRAT
EEK
KA
RA
ND
IKA
R, W
IKIM
EDIA
CO
MM
ON
S
FLIC
KR
USE
R H
ACK
NY
26MARCH 2013 ║ Youth Incorporated
RANK NAME OF INSTITUTION COUNTRY SCORE 2011-12 RANK
76 Georgia Institute of Technology USA 78.3 82 77 University of Queensland Australia 78 77 —78 National Taiwan University Taiwan 77.8 78 —79 Indian Institute of Technology Kanpur India 77.5 NEW80 University of Rochester USA 77 84 81 University of Groningen Netherlands 76.9 8082 University of Bern Switzerland 76.3 8183 University of Adelaide Australia 76 83 —84 University of Surrey UK 75 NEW85 Paris Dauphine University France 74.5 85 —86 Ecole Centrale de Paris France 74 88 87 Stockholm University Sweden 73 9188 Tel Aviv University Israel 72 10089 University of Washington USA 71 89 —90 University of Amsterdam Netherlands 70 8691 University of York UK 69 94 92 Washington University St.Louis USA 68.7 8793 University of Pittsburg Bradford USA 68.5 NEW94 Pompeu Fabra University Spain 68 98 95 University of Sciences Philadelphia USA 67.5 NEW96 Purdue University USA 67 9297 Heriot-Watt University UK 66 NEW98 Bradley University USA 65 NEW99 University of Delhi India 64.5 NEW
100 Grenoble Ecole de Management France 64 NEW
the world’s best institutes, a revelation that should be an impetus to take a long, hard look at the state of higher education in India.
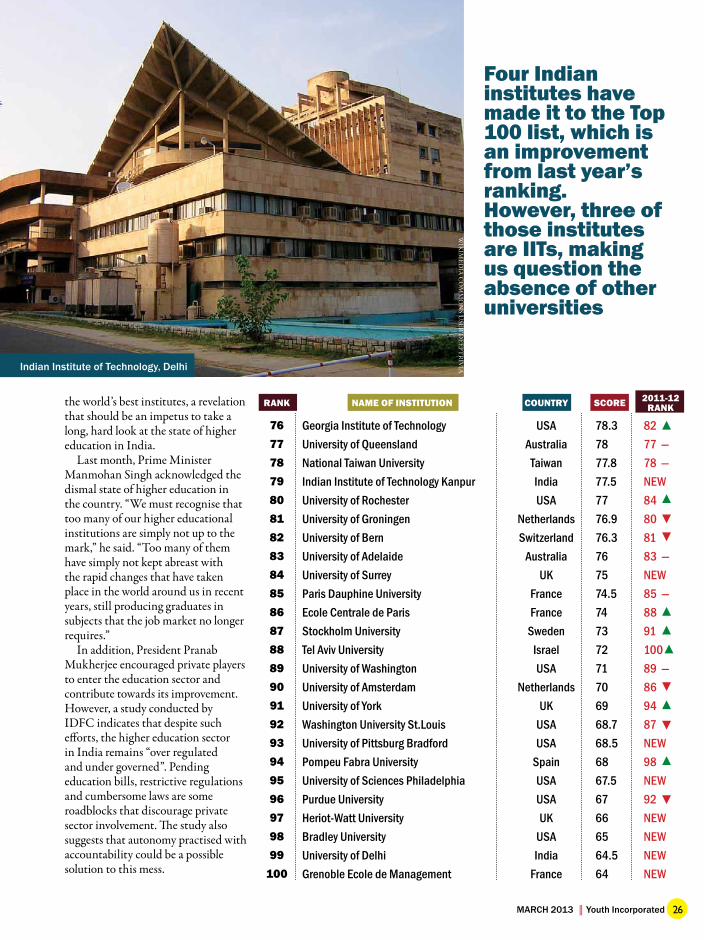
Last month, Prime Minister Manmohan Singh acknowledged the dismal state of higher education in the country. “We must recognise that too many of our higher educational institutions are simply not up to the mark,” he said. “Too many of them have simply not kept abreast with the rapid changes that have taken place in the world around us in recent years, still producing graduates in subjects that the job market no longer requires.”
In addition, President Pranab Mukherjee encouraged private players to enter the education sector and contribute towards its improvement. However, a study conducted by IDFC indicates that despite such eff orts, the higher education sector in India remains “over regulated and under governed”. Pending education bills, restrictive regulations and cumbersome laws are some roadblocks that discourage private sector involvement. Th e study also suggests that autonomy practised with accountability could be a possible solution to this mess.
Four Indian institutes have made it to the Top 100 list, which is an improvement from last year’s ranking. However, three of those institutes are IITs, making us question the absence of other universities
Indian Institute of Technology, Delhi
WIK
IMED
IA CO
MM
ON
S USER
DEEPT
RIV
IA
_COVER STORY
27 Youth Incorporated ║ MARCH 2013
RANK NAME OF INSTITUTION COUNTRY1 Harvard University USA2 Stanford University USA3 University of Pennsylvania USA4 Massachusetts Institute of
TechnologyUSA
5 University of Chicago USA6 Yale University USA7 Columbia University USA8 Princeton University USA9 Cornell University USA
10 California Institute of Technology USA
RANK NAME OF INSTITUTION COUNTRY1 University of Oxford UK2 University of Cambridge UK3 Imperial College London UK4 London School of Economics UK5 École Normale Supérieure France6 IE University Spain7 Ludwig-Maximilians-Universität
München Germany
8 École Polytechnique Fédérale de Lausanne
Switzerland
9 University College London UK10 University of Copenhagen Denmark
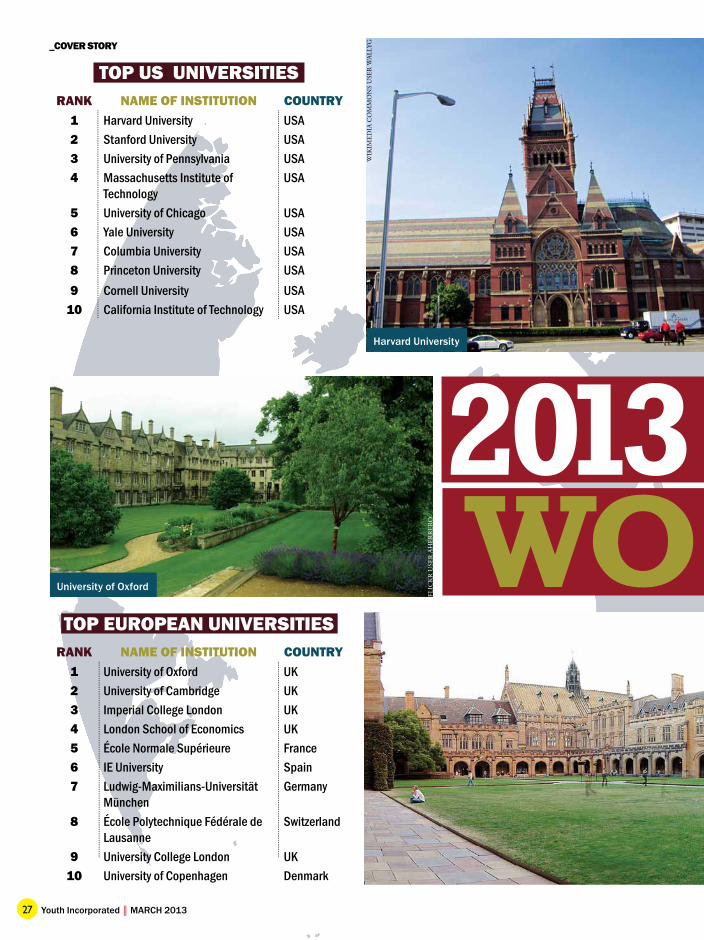
TOP US UNIVERSITIES
TOP EUROPEAN UNIVERSITIES
2013WO
FLIC
KR
USE
R A
HER
RER
O
WIK
IMED
IA C
OM
MO
NS
USE
R W
ALL
YG
Harvard University
University of Oxford
28MARCH 2013 ║ Youth Incorporated
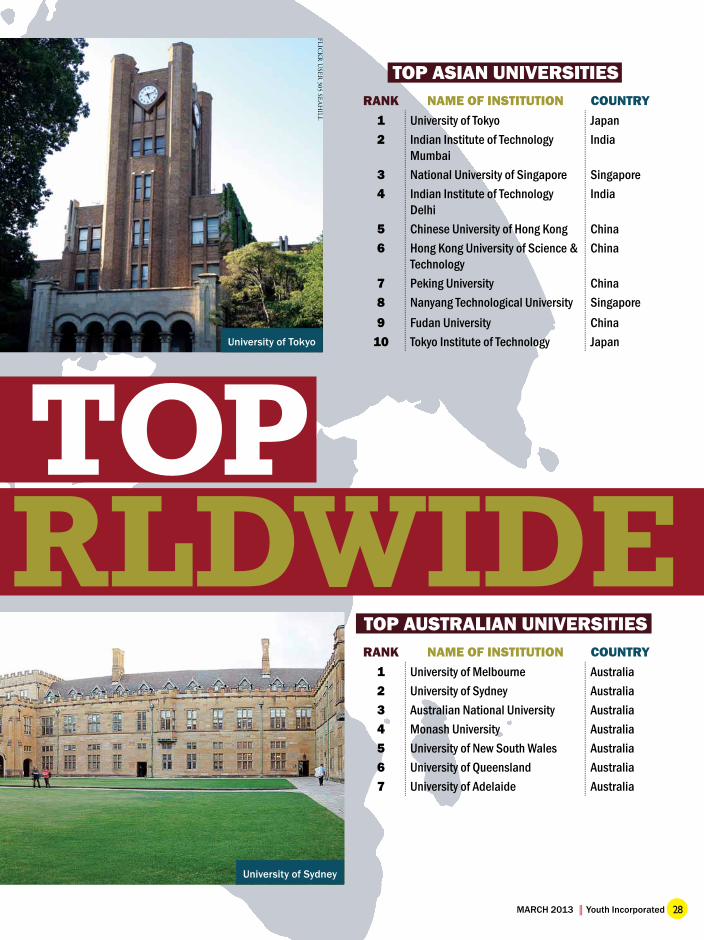
RANK NAME OF INSTITUTION COUNTRY1 University of Tokyo Japan2 Indian Institute of Technology
MumbaiIndia
3 National University of Singapore Singapore4 Indian Institute of Technology
DelhiIndia
5 Chinese University of Hong Kong China6 Hong Kong University of Science &
TechnologyChina
7 Peking University China8 Nanyang Technological University Singapore9 Fudan University China
10 Tokyo Institute of Technology Japan
RANK NAME OF INSTITUTION COUNTRY1 University of Melbourne Australia2 University of Sydney Australia3 Australian National University Australia4 Monash University Australia5 University of New South Wales Australia6 University of Queensland Australia7 University of Adelaide Australia
TOP ASIAN UNIVERSITIES
TOP AUSTRALIAN UNIVERSITIES
TOP O RLDWIDE
FLICK
R U
SER 305 SEA
HILL
University of Tokyo
University of Sydney
_COVER STORY
29 Youth Incorporated ║ MARCH 2013
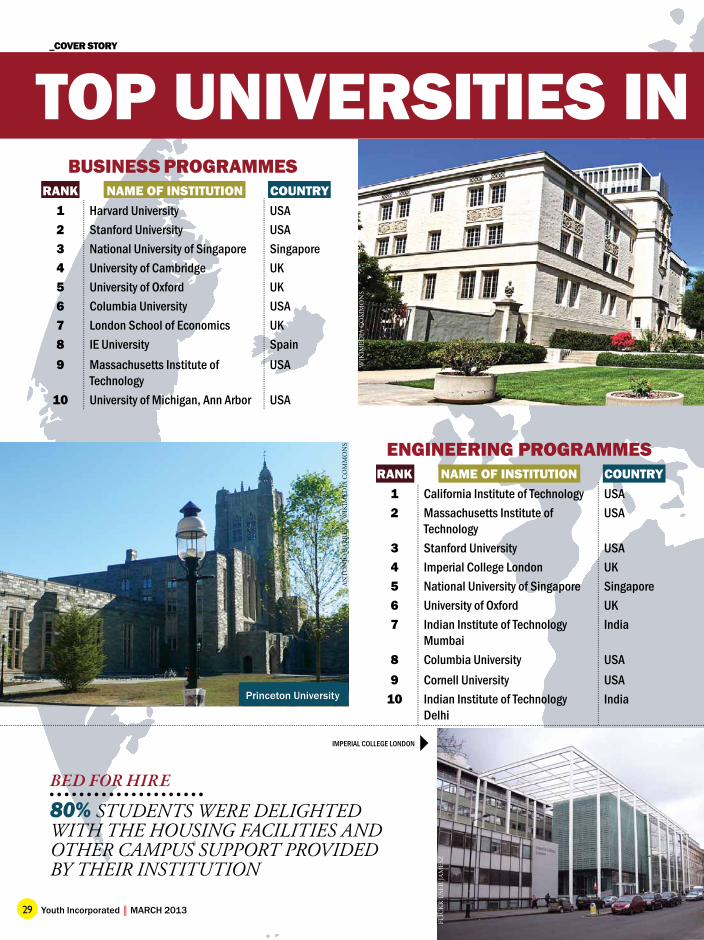
TOP UNIVERSITIES IN RANK NAME OF INSTITUTION COUNTRY
1 Harvard University USA2 Stanford University USA3 National University of Singapore Singapore4 University of Cambridge UK5 University of Oxford UK6 Columbia University USA7 London School of Economics UK8 IE University Spain9 Massachusetts Institute of
TechnologyUSA
10 University of Michigan, Ann Arbor USA
RANK NAME OF INSTITUTION COUNTRY1 California Institute of Technology USA2 Massachusetts Institute of
TechnologyUSA
3 Stanford University USA4 Imperial College London UK5 National University of Singapore Singapore6 University of Oxford UK7 Indian Institute of Technology
MumbaiIndia
8 Columbia University USA9 Cornell University USA
10 Indian Institute of Technology Delhi
India
BUSINESS PROGRAMMES
ENGINEERING PROGRAMMES
BED FOR HIRE
80% STUDENTS WERE DELIGHTED WITH THE HOUSING FACILITIES AND OTHER CAMPUS SUPPORT PROVIDED BY THEIR INSTITUTION
IMPERIAL COLLEGE LONDON
WIK
IMED
IA C
OM
MO
NS
AN
TO
NIO
BA
RR
ERA,
WIK
IMED
IA C
OM
MO
NS
FLIC
KR
USE
R JA
MES
Z
Princeton University
30MARCH 2013 ║ Youth Incorporated
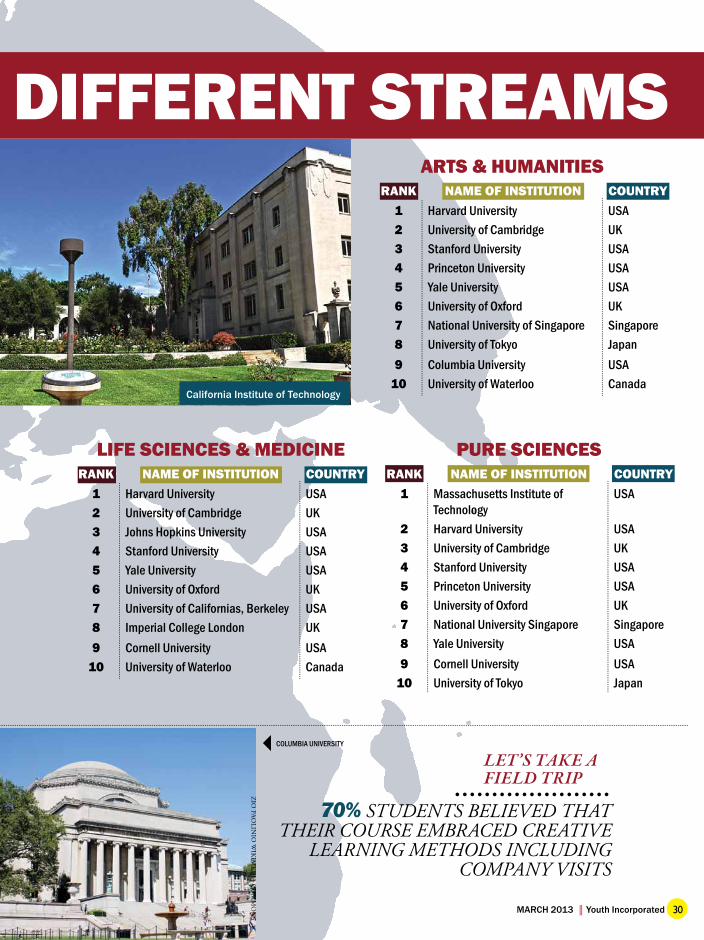
DIFFERENT STREAMSRANK NAME OF INSTITUTION COUNTRY
1 Harvard University USA2 University of Cambridge UK3 Stanford University USA4 Princeton University USA5 Yale University USA6 University of Oxford UK7 National University of Singapore Singapore8 University of Tokyo Japan9 Columbia University USA
10 University of Waterloo Canada
RANK NAME OF INSTITUTION COUNTRY1 Harvard University USA2 University of Cambridge UK3 Johns Hopkins University USA4 Stanford University USA5 Yale University USA6 University of Oxford UK7 University of Californias, Berkeley USA8 Imperial College London UK9 Cornell University USA
10 University of Waterloo Canada
RANK NAME OF INSTITUTION COUNTRY1 Massachusetts Institute of
TechnologyUSA
2 Harvard University USA3 University of Cambridge UK4 Stanford University USA5 Princeton University USA6 University of Oxford UK7 National University Singapore Singapore8 Yale University USA9 Cornell University USA
10 University of Tokyo Japan
ARTS & HUMANITIES
LIFE SCIENCES & MEDICINE PURE SCIENCES
70% STUDENTS BELIEVED THAT THEIR COURSE EMBRACED CREATIVE
LEARNING METHODS INCLUDING COMPANY VISITS
LET’S TAKE A FIELD TRIP
COLUMBIA UNIVERSITY
ZIO
PAOLIN
IO W
IKIM
EDIA C
OM
MO
NS
California Institute of Technology
_COVER STORY
31 Youth Incorporated ║ MARCH 2013
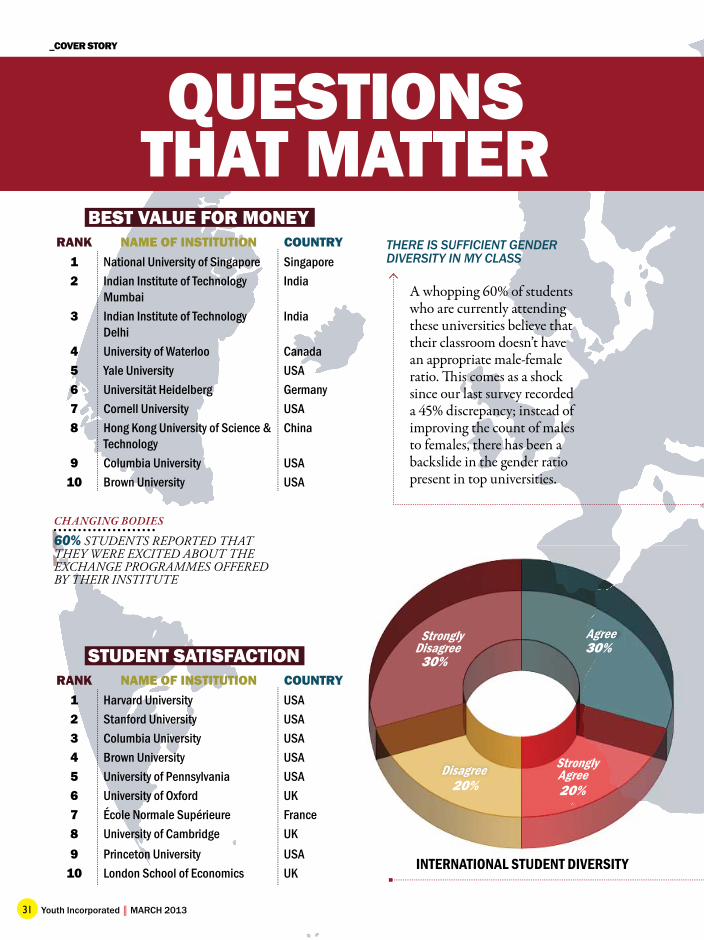
RANK NAME OF INSTITUTION COUNTRY1 National University of Singapore Singapore2 Indian Institute of Technology
MumbaiIndia
3 Indian Institute of Technology Delhi
India
4 University of Waterloo Canada5 Yale University USA6 Universität Heidelberg Germany7 Cornell University USA8 Hong Kong University of Science &
TechnologyChina
9 Columbia University USA10 Brown University USA
RANK NAME OF INSTITUTION COUNTRY1 Harvard University USA2 Stanford University USA3 Columbia University USA4 Brown University USA5 University of Pennsylvania USA6 University of Oxford UK7 École Normale Supérieure France8 University of Cambridge UK9 Princeton University USA
10 London School of Economics UK
BEST VALUE FOR MONEY
STUDENT SATISFACTION
A whopping 60% of students who are currently attending these universities believe that their classroom doesn’t have an appropriate male-female ratio. Th is comes as a shock since our last survey recorded a 45% discrepancy; instead of improving the count of males to females, there has been a backslide in the gender ratio present in top universities.
THERE IS SUFFICIENT GENDER DIVERSITY IN MY CLASS
QUESTIONS THAT MATTER
CHANGING BODIES
60% STUDENTS REPORTED THAT THEY WERE EXCITED ABOUT THE EXCHANGE PROGRAMMES OFFERED BY THEIR INSTITUTE
DisagreeDisagree
Agree30%
Strongly Agree20%20%
Strongly Disagree30%
INTERNATIONAL STUDENT DIVERSITY

32MARCH 2013 ║ Youth Incorporated
RANK NAME OF INSTITUTION COUNTRY1 Stanford University USA2 Harvard University USA3 University of Pennsylvania USA4 Carnegie Mellon University USA5 Brown University USA6 Indian Institute of Technology
MumbaiIndia
7 Hong Kong University of Science & Technology
China
8 University of Waterloo Canada9 University of Oxford UK
10 Indian Institute of Technology Delhi
India
RANK NAME OF INSTITUTION COUNTRY1 Massachusetts Institute of
TechnologyUSA
2 Columbia University USA3 Cornell University USA4 Princeton University USA5 University of Oxford UK6 University of Cambridge UK7 California Institute of Technology USA8 Duke University USA9 Dartmouth College USA
10 IE University Spain
RECRUITER SATISFACTION
CAMPUS FACILITIESTh e survey shows that students currently enrolled in these top universities are divided on the number of international students present in their classroom. Th ere is an even 50% that believe there are suffi cient international students enrolled in their university while the other 50% believe there aren’t enough international students. Our last survey showed that 60% students found a positive international diversity in their institutes.
THERE IS SUFFICIENT INTERNATIONAL DIVERSITY IN MY
CLASS
EXPRESSIVE EDUCATORS
70% STUDENTS REPORTED THAT THEIR TEACHERS ADOPTED
INNOVATIVE TEACHING METHODS IN THE CLASSROOM
THERE ARE MANY INDIVIDUAL FACTORS WHICH GO INTO THE MAKING OF A WORLD-CLASS INSTITUTE. TO FIND OUT HOW UNIVERSITIES FARE BEHIND THE SCENES, WE ASKED STUDENTS TO RATE THEIR EXPERIENCES WITHIN THE FOUR WALLS OF THEIR INSTITUTE
R
STUDENT GENDER DIVERSITY
Not Sure Strongly
Agree
Agree
Disagree
Strongly Disagree
10%15%
15%
30%
30%
_COVER STORY
33 Youth Incorporated ║ MARCH 2013
RANK NAME OF INSTITUTION COUNTRY1 Stanford University USA2 Harvard University USA3 London School of Economics UK4 Brown University USA5 Northwestern University USA6 Dartmouth College USA7 IE University Spain8 Columbia University USA9 École Normale Supérieure France
10 Ludwig-Maximilians-Universität München
Germany
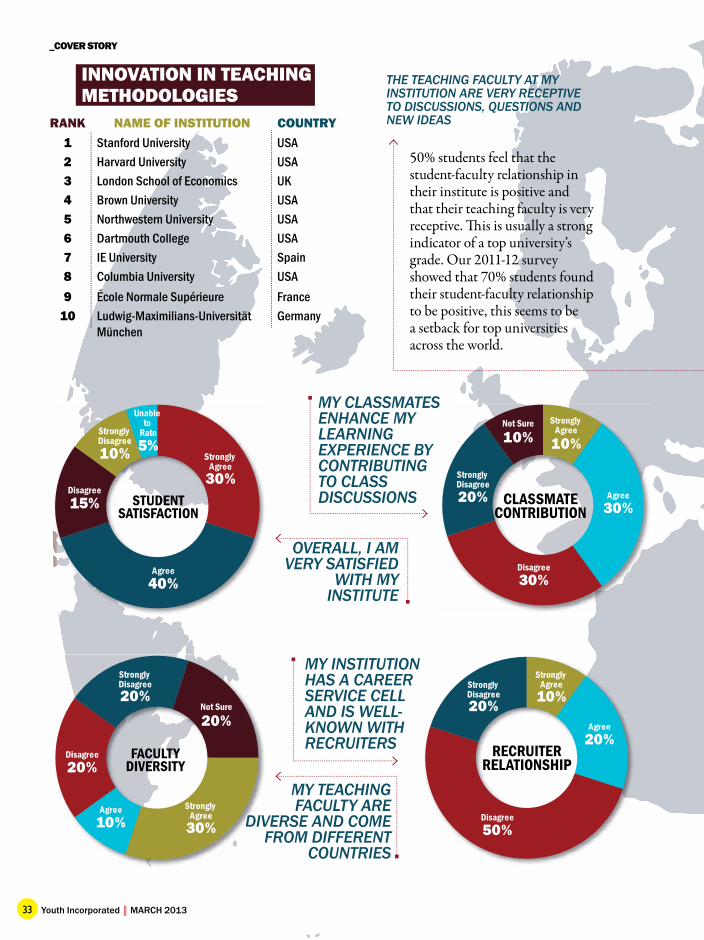
INNOVATION IN TEACHING METHODOLOGIES
50% students feel that the student-faculty relationship in their institute is positive and that their teaching faculty is very receptive. Th is is usually a strong indicator of a top university’s grade. Our 2011-12 survey showed that 70% students found their student-faculty relationship to be positive, this seems to be a setback for top universities across the world.
THE TEACHING FACULTY AT MY INSTITUTION ARE VERY RECEPTIVE TO DISCUSSIONS, QUESTIONS AND NEW IDEAS
MY CLASSMATES ENHANCE MY LEARNING EXPERIENCE BY CONTRIBUTING TO CLASS DISCUSSIONS
MY INSTITUTION HAS A CAREER SERVICE CELL AND IS WELL-KNOWN WITH RECRUITERS
OVERALL, I AM VERY SATISFIED
WITH MY INSTITUTE
MY TEACHING FACULTY ARE
DIVERSE AND COME FROM DIFFERENT
COUNTRIES
5%
Unable to
Rate
30%
Strongly Agree
40%Agree
15%Disagree
10%
Strongly Disagree
30%
30%
Agree
Disagree
20%
Strongly Disagree
10% 10%Not Sure Strongly
Agree
DDDIV30%
Strongly Agree10%
Agree
20%Disagree
Strongly Disagree20%
20%Not Sure
20%Agree
50%Disagree
Strongly Disagree20%
10%
Strongly Agree
STUDENT SATISFACTION
CLASSMATE CONTRIBUTION
FACULTY DIVERSITY
RECRUITER RELATIONSHIP
34MARCH 2013 ║ Youth Incorporated
RANK NAME OF INSTITUTION COUNTRY1 Harvard University USA2 Stanford University USA3 University of Pennsylvania USA4 Columbia University USA5 Indian Institute of Technology
MumbaiIndia
6 Indian Institute of Technology Delhi
India
7 Carnegie Mellon University USA8 National University of Singapore Singapore9 University of California, Berkeley USA
10 Dartmouth College USA
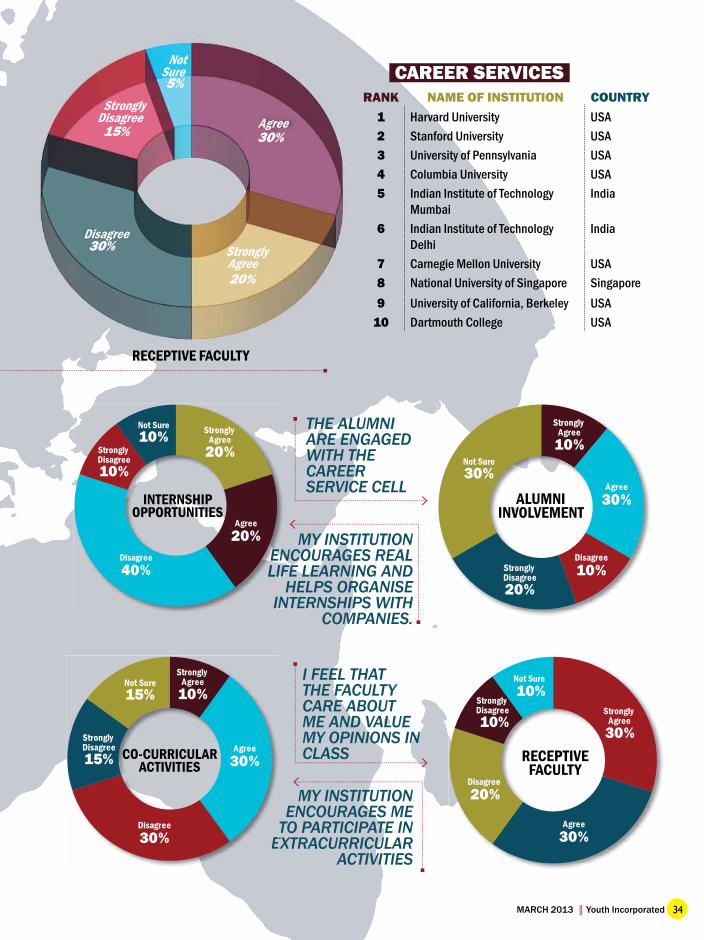
CAREER SERVICES
THE ALUMNI ARE ENGAGED WITH THE CAREER SERVICE CELL
I FEEL THAT THE FACULTY CARE ABOUT ME AND VALUE MY OPINIONS IN CLASS
MY INSTITUTION ENCOURAGES REAL LIFE LEARNING AND
HELPS ORGANISE INTERNSHIPS WITH
COMPANIES.
MY INSTITUTION ENCOURAGES ME
TO PARTICIPATE IN EXTRACURRICULAR
ACTIVITIES
EEEEENEENLIF
IN
20%
Strongly Agree
20%Agree
40%Disagree
Strongly Disagree10%
Not Sure10% 10%
Strongly Agree
30%Agree
10%Disagree
Strongly Disagree20%
Not Sure30%
E
10%
Strongly Agree
30%Agree
30%Disagree
Strongly Disagree15%
Not Sure15%
30%
Strongly Agree
30%Agree
20%Disagree
Strongly Disagree10%
Not Sure10%
RECEPTIVE FACULTY
INTERNSHIP OPPORTUNITIES
ALUMNI INVOLVEMENT
CO-CURRICULAR ACTIVITIES
RECEPTIVE FACULTY
RECEPTIVE FACULTY
Not Sure5%
Agree30%
Strongly Agree20%
Disagree30%
Strongly Disagree15%
_COVER STORY
35 Youth Incorporated ║ MARCH 2013
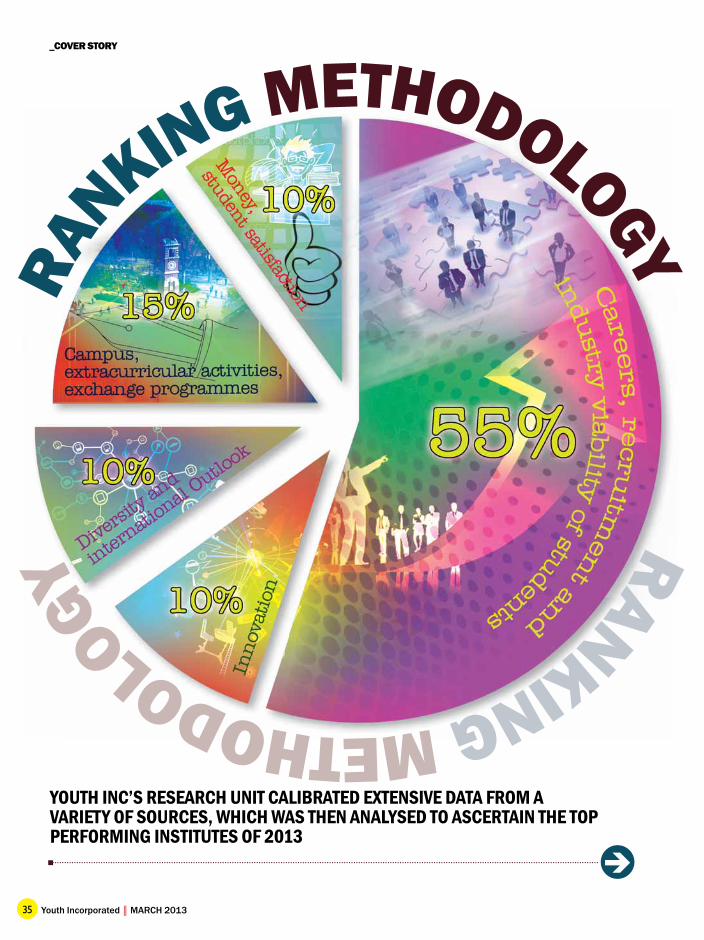
YOUTH INC’S RESEARCH UNIT CALIBRATED EXTENSIVE DATA FROM A VARIETY OF SOURCES, WHICH WAS THEN ANALYSED TO ASCERTAIN THE TOP PERFORMING INSTITUTES OF 2013
�
RAN
KING METHODOLOGY RANKING METHODOLOGY
36MARCH 2013 ║ Youth Incorporated
We chose institutes across the world aft er having discussions with thousands of
students, recruiters and faculty. Youth Inc’s Research Unit (YRU) also studied domestic rankings in various countries to fi nd the best institutes.
We sent survey links to 1,100 institutes and provided them with unique codes so that they could submit their responses online. Current students of the institutes were asked to specify the stream they were studying and then rate specifi c statements which were pertaining to the factors considered in this ranking. Several institutes directly contacted their current students and recruiters and asked them to take part in our survey.
Over 6,500 recruiters were sent emails with the survey link. Th e recruiter list was prepared from the responses of the institutes and also included internationally well-known recruiters.
Below are the factors we considered and the overall weightage assigned to them:
♦Careers, recruitment and industry viability of students – 55% ♦Diversity and international outlook – 10% ♦Innovation – 10% ♦Campus, extracurricular activities, exchange programmes – 15% ♦Money, student satisfaction – 10%
CAREERS, RECRUITMENT AND INDUSTRY VIABILITY OF STUDENTS – 55%Th is category signifi cantly impacts the overall score of an institute since it is the most weighted factor. One of the most important criteria to select institutes is the student’s industry viability aft er graduation.
Recruiters were asked to list and rate the institutes that they were most likely to recruit from. Th ey were asked the likelihood of recruiting again from the same institute and their satisfaction with the institute’s careers cell. Recruiters rated students
on various factors including analytical and problem solving skills, leadership potential, communication and interpersonal skills and so on.
Institutes and students were also asked about the availability and functioning of a career services cell on campus and how active such a service was. We also considered what percentage of students were actually placed, both domestically and internationally, through the institute’s career services cell. Students also reported the availability and ease of obtaining internships.
DIVERSITY AND INTERNATIONAL OUTLOOK – 10% Th is category looks not only at diversity of faculty but also at diversity of students in the classroom. Th e international outlook includes international students that are attracted and retained by the institute.
Institutes were asked to report the total number of students on campus and what percentage of the students were international and speak two or more languages. Gender diversity of the students was considered.
Institutes also reported the percentage of the faculty that were international, hold a doctorate degree and accredited with their own publishing material along with the
gender diversity of the faculty.Students were asked to rate the
student and faculty diversity in their class.
INNOVATION – 10%Th is category looks at how innovatively programmes are constructed and taught and how faculty engage the students – an important factor in the overall perception of an institute.
We considered the diff erent ways in which an institute constructs programmes. Institutes were asked to select from a list of diff erent teaching methodologies that we considered innovative – some of these included company visits, dual or multiple majors and course collaborations between diff erent departments at the institute. Our list was made aft er surveying students across diff erent campuses worldwide.
Students were asked to report how satisfi ed they are with faculty who use innovative ways to teach subjects.
CAMPUS, EXTRACURRICULAR ACTIVITIES, EXCHANGE PROGRAMMES – 15%Th is category considers the support students receive on campus and the availability of extracurricular activities. Th e exchange programmes
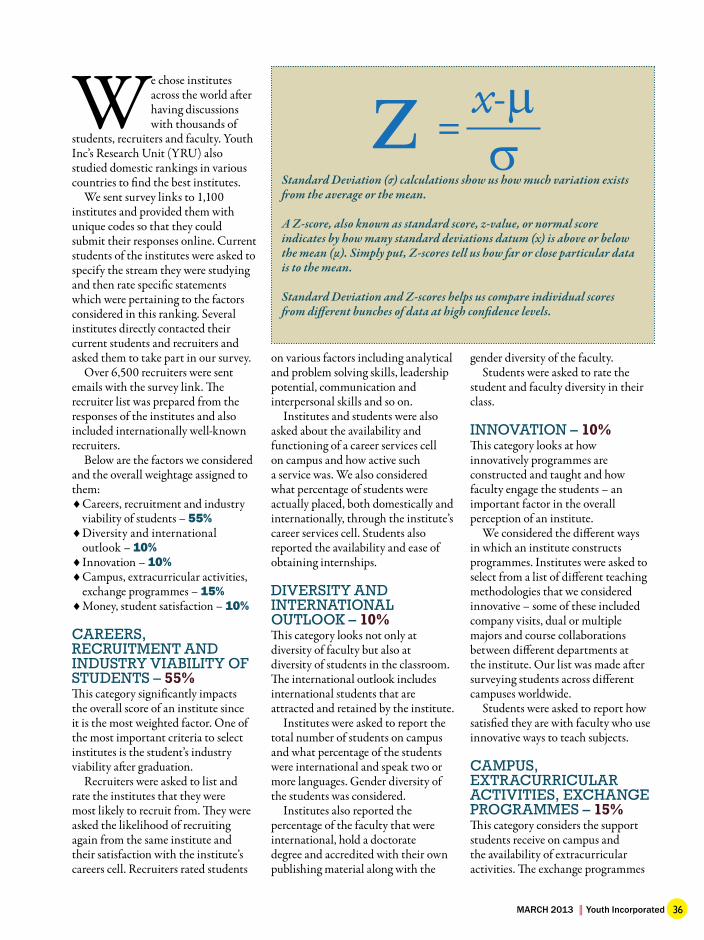
z =x-μσ
Standard Deviation (σ) calculations show us how much variation exists fr om the average or the mean.
A Z-score, also known as standard score, z-value, or normal score indicates by how many standard deviations datum (x) is above or below the mean (μ). Simply put, Z-scores tell us how far or close particular data is to the mean.
Standard Deviation and Z-scores helps us compare individual scores fr om diff erent bunches of data at high confi dence levels.
_COVER STORY
37 Youth Incorporated ║ MARCH 2013
off ered by the institute and how actively students are encouraged to opt for such programmes was also considered.
We asked institutes to indicate the diff erent types of assistance provided by the student offi ce or a similar body on campus. Our initial list was made aft er surveying students across diff erent campuses worldwide.
Students reported if they were encouraged by the institute to participate in diff erent extracurricular activities on campus.
Institutes were asked to report the percentage of students that opted for exchange programmes. We also considered the exchange students present on the institute’s campus.
MONEY, STUDENT SATISFACTION – 10%Th is category takes into account a critical part of education today – fi nances. And more importantly, how satisfi ed a student is with the institute.
We considered students’ opinions on whether a particular institute was perceived as ‘value for money’. We also asked institutes to state the percentage of students who received some sort of funding from the institutes.
Students were asked to rate their institutes on various factors including attitude of staff and professors, location, course content and so on and institutes were asked to report the graduation rate of students enrolled and what percentage of students transfer out of the institution.
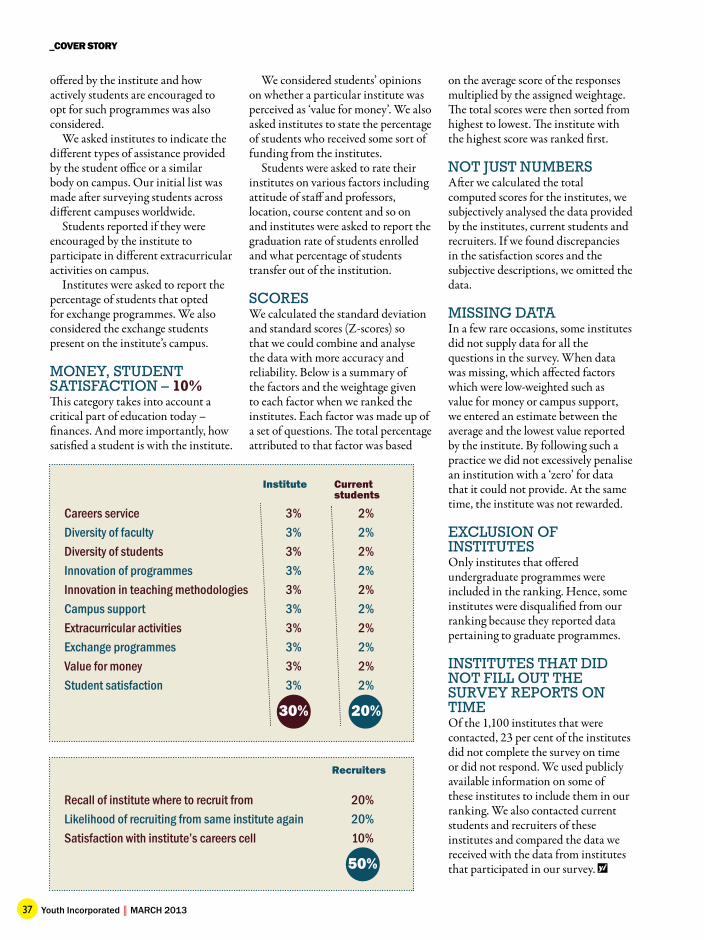
SCORESWe calculated the standard deviation and standard scores (Z-scores) so that we could combine and analyse the data with more accuracy and reliability. Below is a summary of the factors and the weightage given to each factor when we ranked the institutes. Each factor was made up of a set of questions. Th e total percentage attributed to that factor was based
on the average score of the responses multiplied by the assigned weightage. Th e total scores were then sorted from highest to lowest. Th e institute with the highest score was ranked fi rst.
NOT JUST NUMBERSAft er we calculated the total computed scores for the institutes, we subjectively analysed the data provided by the institutes, current students and recruiters. If we found discrepancies in the satisfaction scores and the subjective descriptions, we omitted the data.
MISSING DATAIn a few rare occasions, some institutes did not supply data for all the questions in the survey. When data was missing, which aff ected factors which were low-weighted such as value for money or campus support, we entered an estimate between the average and the lowest value reported by the institute. By following such a practice we did not excessively penalise an institution with a ‘zero’ for data that it could not provide. At the same time, the institute was not rewarded.
EXCLUSION OF INSTITUTESOnly institutes that off ered undergraduate programmes were included in the ranking. Hence, some institutes were disqualifi ed from our ranking because they reported data pertaining to graduate programmes.
INSTITUTES THAT DID NOT FILL OUT THE SURVEY REPORTS ON TIMEOf the 1,100 institutes that were contacted, 23 per cent of the institutes did not complete the survey on time or did not respond. We used publicly available information on some of these institutes to include them in our ranking. We also contacted current students and recruiters of these institutes and compared the data we received with the data from institutes that participated in our survey. yi
Institute Current students
Careers service 3% 2%Diversity of faculty 3% 2%Diversity of students 3% 2%Innovation of programmes 3% 2%Innovation in teaching methodologies 3% 2%Campus support 3% 2%Extracurricular activities 3% 2%Exchange programmes 3% 2%Value for money 3% 2%Student satisfaction 3% 2%
30% 20%
Recruiters
Recall of institute where to recruit from 20%Likelihood of recruiting from same institute again 20%Satisfaction with institute’s careers cell 10%
50%