csr port resilience report - mit ctl
TRANSCRIPT

The National Center for Secure and ResilientMaritime Commerce
CSR – A Department of Homeland Security National Center of Excellence for Port Security
CSR Port Resilience Report
James Rice – MIT CTLKai Trepte – MIT CTL
Matt Mattingley – The Mattingley Group

CSR Port Resilience Report
James RiceKai TrepteMatt Mattingley

Agenda
• Research timeline (How we got here)• Our latest work (Portmapper)• How it works• Scenarios of how it can be used (Today)
• Food and Farm• Explosives• Disruption at PoLA (containers)
• Possible Future Development• Scenarios integrating FAF
• Questions
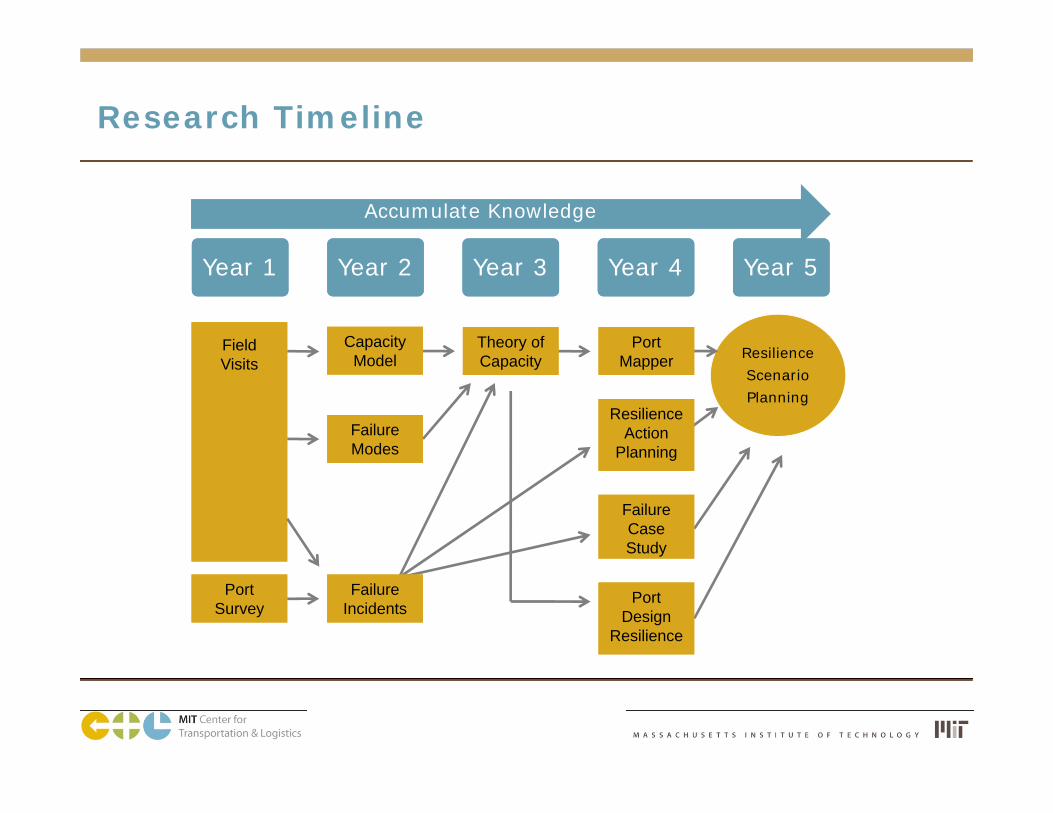
Research Timeline
Accumulate Knowledge
Year 1Year 1 Year 2Year 2 Year 3Year 3 Year 4Year 4 Year 5Year 5
FieldVisits
Resilience ScenarioPlanning
Port Survey
Capacity Model
Failure Modes
Failure Incidents
Theory of Capacity
Port Mapper
Resilience Action
Planning
Failure Case Study
Port Design
Resilience

Year 3 Summary and Year 4 Plans
• Year 3 Summary Highlights• Port Resilience Survey – Structural Equation Modeling• Port Capacity Study/Model updated with 2008-2009 data• Framework for Port Capacity Analysis• Ocean conveyance/Port Delay Study (contin thru Year 4)
• Year 4 Plan Highlights• Port Mapper & Capacity Study Scenarios• Port Resilience Action List• Provide critical data and input to modeling effort• Port Case Study Database – add Sendai disaster• Field visits to inland waterways (Port of Catoosa +)

Most recent developments• Capacity work very insightful
• But impact and insights not available without an analyst• No visceral feel for the magnitude of the data• E.g. Regional concentration of certain products lead to
vulnerabilities – Hurricane Katrina caused $800 MM in lost imports, raised food costs in the US by 3%*
• E.g. Disruptions at top ports require 16% (petroleum), 26% (container), 50% (food & farm) additional capacity
• It would be useful to visually illustrate where resilience and security issues exist
To address this need we created a tool to help visualize cargo handed at US ports
* Per Federal Reserve Bank

MIT Port Mapper
Located at http://portmap.mit.edu/ApplicationOverview.htm

We want feedback & input
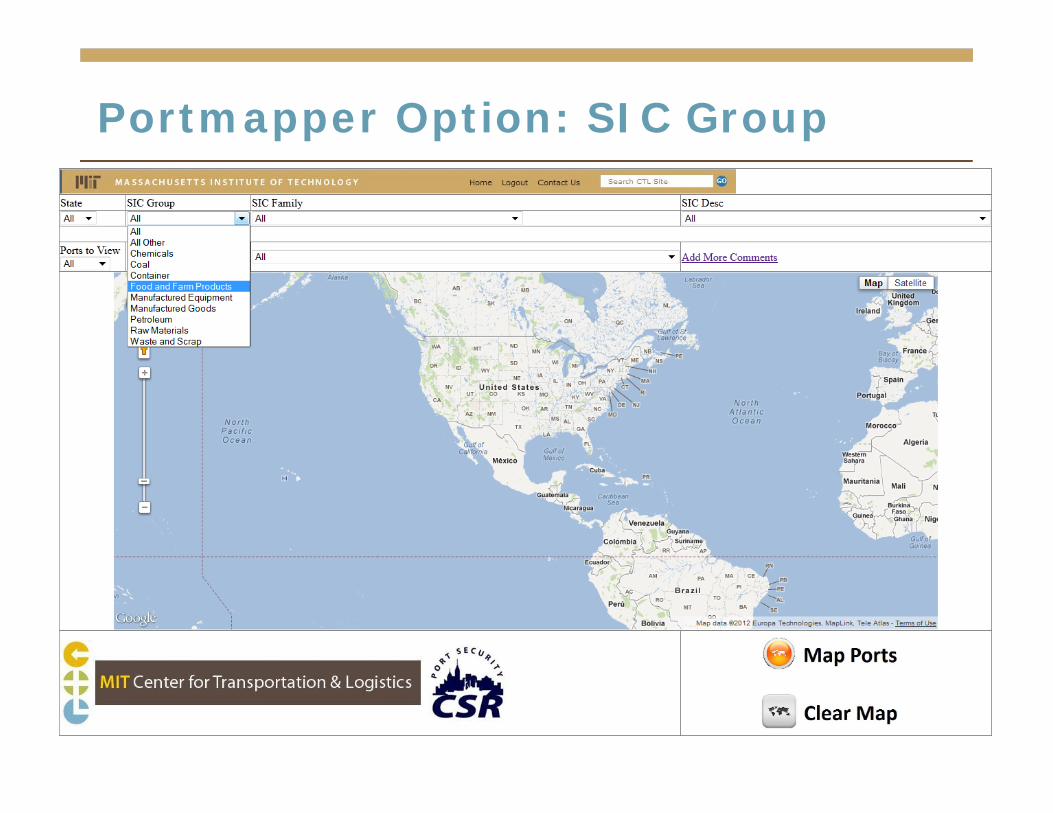
Portmapper Option: SIC Group

Portmapper Option: SIC Description

Portmapper Option: Port to Fail

Portmapper Option: All or Top 10 Ports

Use of Portmapper• Uses publicly available data coupled with data
collected through CSR project to plot ports on map• Allows for the selection of:
• States• Commodities• Ports
• Currently only considers data from ACoE, continental US (excluding islands, Alaska)
To demonstrate potential uses we offer several scenarios of possible application

Scenario: Food and Farm Ports

All Food and Farm ports

Choose only Top 10 F&F Ports

Top 10 F&F Ports

Observations
• High concentration of F&F ports in one region• List shows top three in NO/So La region
• Long distances to the other top 10 ports which have major F&F capacity• Five ports of the remaining top 10 require Panama Canal
crossing or cross-country rail/truck movements• Analysis:
• Significant vulnerability at PoNO/So La• Consider options to spread F&F cargo handling• Consider options for movement of F&F in the event of a
disruption

Scenario: Ports handling explosives

All ports handling explosives

Top 10 ports handling explosives

Top 10 ports handling explosives

Observations• Majority of ports handling explosive appear to be
on east coast• Somewhat balanced spread of the top 10; 6 on west
coach and 4 on east coast• Long distances to the other top 10 ports which
have major explosives capacity• Analysis:
• What is the tradeoff between constraints/investment in special explosives handling processes and need for cargo handling ports?
• Does it make sense to have explosives handled in ports that are otherwise already highly vulnerable? E.g. Port of New Orleans?

Food & Farm and Explosives vulnerability
• Top Food & Farm ports handle explosives• Amount of explosives in these ports is relatively
small• A port closure due to an explosives incident
closes 3 of the Top 10 Food & Farm ports causing damage to exports and the national economy

Scenario: Disruption at Port of LA

All Container Ports in US

Top 10 Container Ports in US

Top 10 Container Ports in US

Observations• Top container ports – LA, then LB, then NY/NJ,
then Savannah• Majority of larger ports handling containers are on
east coast• Long distances to the other top 10 ports which
have major container capacity• Analysis:
• Vessels rerouted to east coast may be too big for Panama Canal
• Possible and likely for cargo to offload in Mexico or Canada (Prince Rupert) – but at what cost to US economy in terms of lost port trade, additional delays and costs?

Possible Future Developments

Possible Future Developments• Integrate Port Mapper with other sources of data
for comprehensive assessment of cargo flows: specifically Freight Analysis Framework (FAF) data• Look at aggregate policy planning tool• Look at macro trends and issues• Look at overall port system resilience issue
• Focus application on ports (port-specific data)• Look at individual port planning tool• Look at marketing initiatives to capture
additional cargo volume• Look at individual port resilience issues

Scenario Integrating FAF: Impact of Disruption on Freight Flows

What is FAF data
• Freight analysis framework (FAF) compiled by Department of transportation (http://www.ops.fhwa.dot.gov/freight/freight_analysis/faf/faf3/netwkdbflow/index.htm)
• Model of commodity movements in United States
• Captures commodity, mode, state and use for 2007, 2009 with a forecast through 2040
• Provides the potential to link port data with transport data to develop scenario planning tool for policy makers and port managers

Linking port data with FAF data
• Develop mapping of commodity flows in the United States
• Understand interaction between ports and transportation
• Develop methodology to allocate resources among ports to maximize system resilience
• Create regional resilience plans and checklists for handling port failures when they occur

Inbound Container Flows into/out of Ports
Legend:Purple = waterBlack = rail
Seattle
Los Angeles
New York
Houston
Note: only rail and waterborne flows considered

A disruption changes flows at ports & between
Legend:Purple = waterBlack = rail
Seattle
Los Angeles
New York
Houston
Note: only rail and waterborne flows considered

FAF Data Enables Resilience Scenario Planning
• Consider change of flows with disruption at PoLA/LB
• Integrating FAF may highlight changes in flows:• Additional cargo flows via vessels into Seattle• Additional cargo flows via rail into LA/LB from Seattle,
Houston• Additional cargo flows via vessels into Houston, New York• Additional cargo flows via rail and vessel into Houston
• What infrastructure investments are necessary to accommodate potential shifts in flow?• Intermodal?• Infrastructure at ports?

Questions• Future development depends upon potential user
• Potential users: Planners, analysts charged with considering infrastructure investments, resilience analysis and planning for system resilience. Others?
• What are the most important developments to pursue?• Lots of potential enhancements
• Port capacity look up, distance calculation, integrate FAF….• Online tool solicits user feedback
• http://portmap.mit.edu/ApplicationOverview.htm• Would you be willing to speak with our developer about the
application?• Thank you – Jim Rice, Kai Trepte, Matt Mattingley
• [email protected], 617.258.8584