database design project: swim schools - home | uc ...ieor115/labs/dp-fa2013/team8-ieor...database...
TRANSCRIPT

Database Design Project: Swim Schools
Final Presentation
Susan Burtner Matthew Burke Sooyong Choi Sean Greene
Vishal Kapadia Rishabh Singhal
Brian Wong

Introduction
2

3
• Swim lessons for children and adults
• Private, Semi-private, and Group Lessons
• ~220 employees
• > 9,000 customers
• Locations in San Francisco, Half Moon Bay, San Bruno, Atherton
• www.swimlpb.com
La Petite Baleen Swim Schools

EER Diagram + Schema
4

5
EER Diagram

6
Schema
1. Member_Family (FamilyID, SignUpDate) 2. Member (MID, FamilyID1, Lname, Fname, PhoneNumber, Email, Refers, EmergencyContactID3) 3. Emergency_Contact (EmergencyContactID, Lname, Fname, PhoneNumber) 4. Monthly_Tuition (MID2, Amount, DiscountID6) 5. Swimmer (SwimmerID, Sibling5, SSN27, MID2) 6. Discount (DiscountID, DiscountType, Amount, FamilyID1) 7. Account_Balance (MID2, AccountNumber, Balance, DiscountID6) 8. Miscellaneous_Fee (AppliesTo, Amount) 9. Report (IndexNumber, Date, Progress, SwimmerID5, RibbonID16) 10. Parent (ParentID) 11. Coach (CoachID, Trainer11, TrainsCoach) 12. Coach_to_Class (CoachID11, SeriesID13, ClassID14)
13. Class_Series (SeriesID, RibbonID16, Day31, Time31) 14. Class (ClassID, SeriesID13) 15. Administrative_Request (RequestID, MID2, FamilyID1,
SwimformationID17) 16. Ribbon_Level (RibbonID, IndexNumber9) 17. Swimformation (StaffID21, SwimformationID) 18. Skill (Skill_ID, Skill_Description) 19. Coach_Qualified_To_Teach (RibbonID16, CoachID11) 20. Class_Specifies_Goal (SeriesID13, RibbonID16) 21. Staff (StaffID, SSN27, EmployeeID26, Department) 22. Executive (ExecutiveID, SSN27, EmployeeID26, StaffID21, IsLeaderOf) 23. Techie (TechieID, StaffID21, SSN27, EmployeeID26, Qualifications) 24. Deck (DeckID, SSN27, EmployeeID26, StaffID21)

7
Schema
25. DOD (DOD_ID, SSN27, EmployeeID26, StaffID21, Supervises) 26. Employee (EmployeeID, SSN27, DateOfHire, LocationID29) 27. Person (SSN, DateOfBirth, Fname, Lname, Address, Phone_number) 28. Technology (TechID, Type, DateOfPurchase) 29. Location (LocationID, State, City, Address, Zip, Size, NumberOfEmployees, NumberOfMembers, ClassID14) 30. Time_Slot_Instance (Day31, Time31) 31. Weekly_Time_Slot (Day, Time) 32. Group_Class (SeriesID13, NumOfInstructors, NumOfStudents, Location) 33. Semi_Private_Class (SeriesID13, NumOfInstructors, NumOfStudents, Location) 34. Private_Class (SeriesID13, Location) 35. Event (Date, Time, Location, LocationID29)
36. Customer_Appreciation_Day (Date35, Time35, Location35, NumOfAttendees, DOD_ID25) 37. Fundraiser (Date35, Time35, Location35, NumOfAttendees, MonetaryGoal) 38. Inventory (ItemID) 39. Inventory_Item (ItemID38, DatePurchased, ExpirationDate) 40. Item_for_Use (ItemID38, Usage) 41. Item_for_Sale (ItemID38, Price) 42. Pays_into(PaymentType, Amount, Date) 43. Executive_Manages_Employee(ExecutiveID22, EmployeeID26) 44. Executive_Organizes_Fundraiser(ExecutiveID22, EmployeeID26, Date35, Time35, Location35) 45. Techie_Manages_Technology(TechieID23, TechID28) 46. DOD_Manages_Deck(DeckID24, DOD_ID25)

8
Schema
47. DOD_Manages_Swimformation(DOD_ID25, SwimformationID17) 48. Deck_Keeps_Track_Of(DeckID24, ItemID38) 49. Customer_Appreciation_Day_Has_Fee (FeeAppliesTo8, FeeAmount8, EventDate35, EventTime35, EventLocation35) 50. Deck_Supports_Coach(CoachID11, DeckID24) 51. Coach_Runs_Customer_Appreciation_Day (CoachID11, EventDate35, EventTime35, EventLocation35) 52. Swimmer_RegistersFor_Customer_ Appreciation_Day (SwimmerID5, EventDate35, EventTime35, EventLocation35) 53. Monthly_Tuition_AddsTo_Acct_Balance (MID2) 54. Location_Contains_Inventory(LocationID29, ItemID38)
55. Member_Family_Generates_Monthly_Tuition (FamilyID1, MID2) 56. MiscellaneousFee_AddsTo_AcctBalance (FeeAppliesTo8, FeeAmount8, MID2) 57. Member_Requests_Report (MID2, ReportIndexNumber9) 58. Coach_Keeps_TrackOf_ItemForUse(CoachID11, ItemID38) 59. Coach_Creates_Report (CoachID11, ReportIndexNumber9) 60. Class_OccursDuring_TimeSlotInstance(ClassID14, Day31, Time31) 61. Swimmer_SwimsInClass (SwimmerID5, ClassID14, SeriesID13) 62. Ribbon_Level_Has_Skills(RibbonID16, Skill_ID18)

Query 1: Optimizing Class Schedule
How do we ensure an optimal ratio of swimmers to coaches within each ribbon level? Ribbon level + Class
type + Number of swimmers & coaches +
Time slots
Integer program minimizes time slots
subject to ratio
Satisfied ratios while minimizing time slots

Q1: Class Schedule Process
Gij <= 30 for all i and all j
Sij <= 30 for all i and all j
Gij <= 6Yij for all i that are group lessons
Sij <= 2Yij for all i that are semi-private lessons
Pij = 1 for all i that are private lessons
Aij <= 10 for all i that are advanced or adult lessons
Yij >= 1 for each lesson
Gij + Sij + Pij + Aij - Zj = 0, for all time slots i corresponding to each ribbon level j
Gij = number of students in group lesson at time slot i that is of ribbon level j
Sij = number of students in semi-private
lesson at time slot i that is of ribbon level j Pij = number of students in private lesson at
time slot i that is of ribbon level j Aij = number of students in advanced or adult
lesson at time slot i that is of ribbon level j Yij = number of coaches qualified to teach
class i in time slot i that is of ribbon level j
Objective Function: Max Number of Students in Each Class
max z = Σ(Gij) + Σ(Sij) + Σ(Pij) + Σ(Aij) for all i and all j
Constraints Decision Variables

11
Q1: Class Schedule SQL
/* Part 1: Determines number of swimmers in each ribbon level.*/ SELECT Swimmer_SwimsInClass.SeriesID13, Count(Swimmer.SwimmerID) AS Num_Of_Swimmers FROM Swimmer INNER JOIN Swimmer_SwimsInClass ON Swimmer.SwimmerID = Swimmer_SwimsInClass.SwimmerID5 GROUP BY Swimmer_SwimsInClass.SeriesID13; /* Part 2: Determines swimmers according to ribbon level who are of a particular class type. */ SELECT Swimmer_SwimsInClass.ClassID14 AS Time_Slot, Class.SeriesID13 AS Ribbon_Level, Class.ClassType AS Class_Type FROM Class INNER JOIN Swimmer_SwimsInClass ON Class.ClassID = Swimmer_SwimsInClass.ClassID14 GROUP BY Swimmer_SwimsInClass.ClassID14, Class.SeriesID13, Class.ClassType;

12
Q1: Class Schedule SQL
/* Part 3: Determines the number of coaches qualified to each ribbon level. */ SELECT Coach_Qualified_To_Teach.RibbonID16 AS Ribbon_Level, Count(Coach_Qualified_To_Teach.CoachID11) AS Num_Coaches_Qualified FROM Coach_Qualified_To_Teach GROUP BY Coach_Qualified_To_Teach.RibbonID16;
Use custom macro in Access to export to Excel. Excel organizes data and computes Integer Program.

13
Q1: Class Schedule Output Query 1a:
Query 1c:
Query 1b:
14
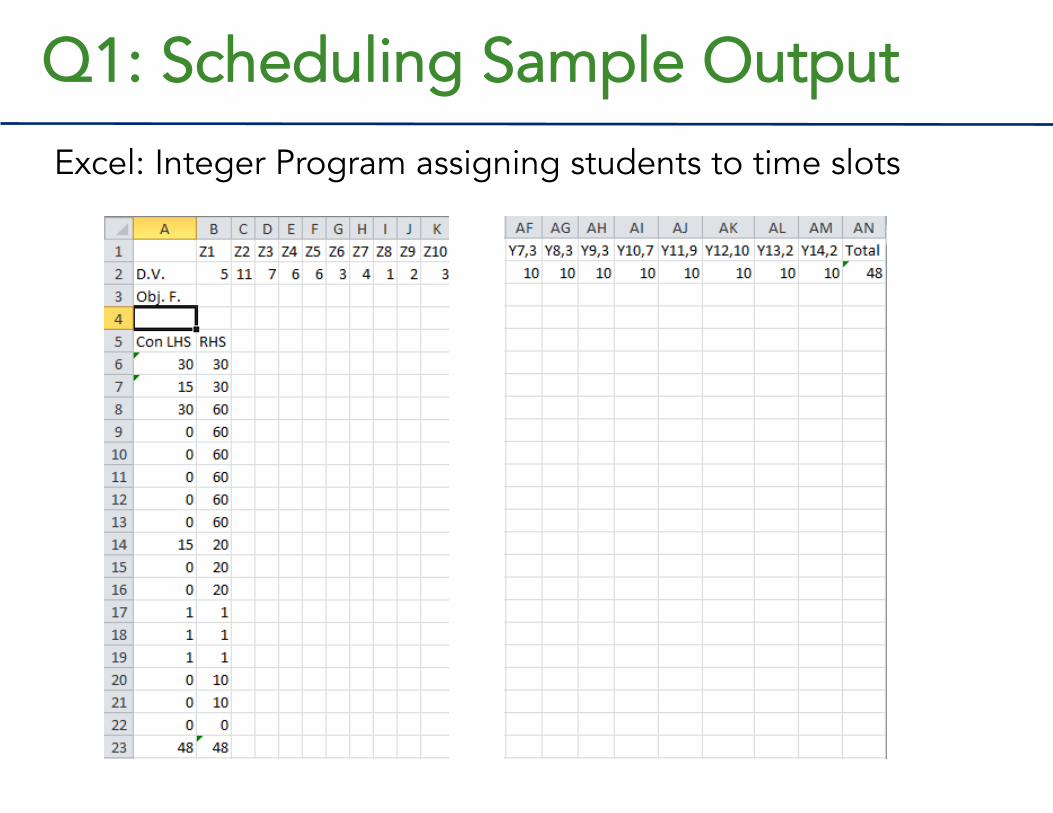
Q1: Scheduling Sample Output Excel: Integer Program assigning students to time slots

Query 2: Quantifying Coach Effectiveness
How can we quantify a coach’s effectiveness to objectively compare his performance with other coaches? Time to ribbon
advancement: Coaches + Swimmers
Normalize base value as coaches gain
experience
Assign performance metric utilizing
average statistics

Q2: Performance Metric Process
• Extract average completion times (Xi) for skill i of all swimmers and (Ci) for skill i of a coach’s swimmers.
• Calculate base value (BV) from the difference between all valid Xi and Ci and normalize:
Base Value
• Extract the coach’s total number of months on the job (T) and the number of classes he/she teaches (N).
• Calculate the performance as a metric (M):
M = BV * (0.1 + 0.1 * N) * (0.5 + 0.1 * N)
Metric

Q2: Performance Metric Process
• Extract average completion times (Xi) for skill i of all swimmers and (Ci) for skill i of a coach’s swimmers.
• Calculate base value (BV) from the difference between all valid Xi and Ci and normalize:
Base Value
• Extract the coach’s total number of months on the job (T) and the number of classes he/she teaches (N).
• Calculate the overall performance (M):
Metric

18
Q2: Performance Metric SQL
/* Extracts average skill completion times. */ SELECT Report.SkillID, Avg(DateDiff("d", [Report]![SkillStartDate], [Report]![SkillEndDate])) AS [Average Time] FROM Report GROUP BY Report.SkillID; /* Extracts average completion times of coach’s students. */ SELECT Coach_Creates_Report.CoachID11, Report.SkillID, Avg(DateDiff("d",[Report]![SkillStartDate],[Report]![SkillEndDate])) AS Average FROM Report INNER JOIN Coach_Creates_Report ON Report.[IndexNumber] = Coach_Creates_Report.[ReportIndexNumber9] GROUP BY Coach_Creates_Report.CoachID11, Report.SkillID; /* Extracts coach’s length of employment and number of classes taught. */
SELECT Coach.CoachID, Count(Coach_to_Class.ClassID14) AS Num_Classes, Avg(DateDiff("m",Employee.DateOfHire,Date())) AS Months FROM Employee, Coach INNER JOIN Coach_to_Class ON Coach.[CoachID] = Coach_to_Class.[CoachID11] WHERE Coach.[EmployeeID26] = Employee.[EmployeeID] GROUP BY Coach.CoachID;
19
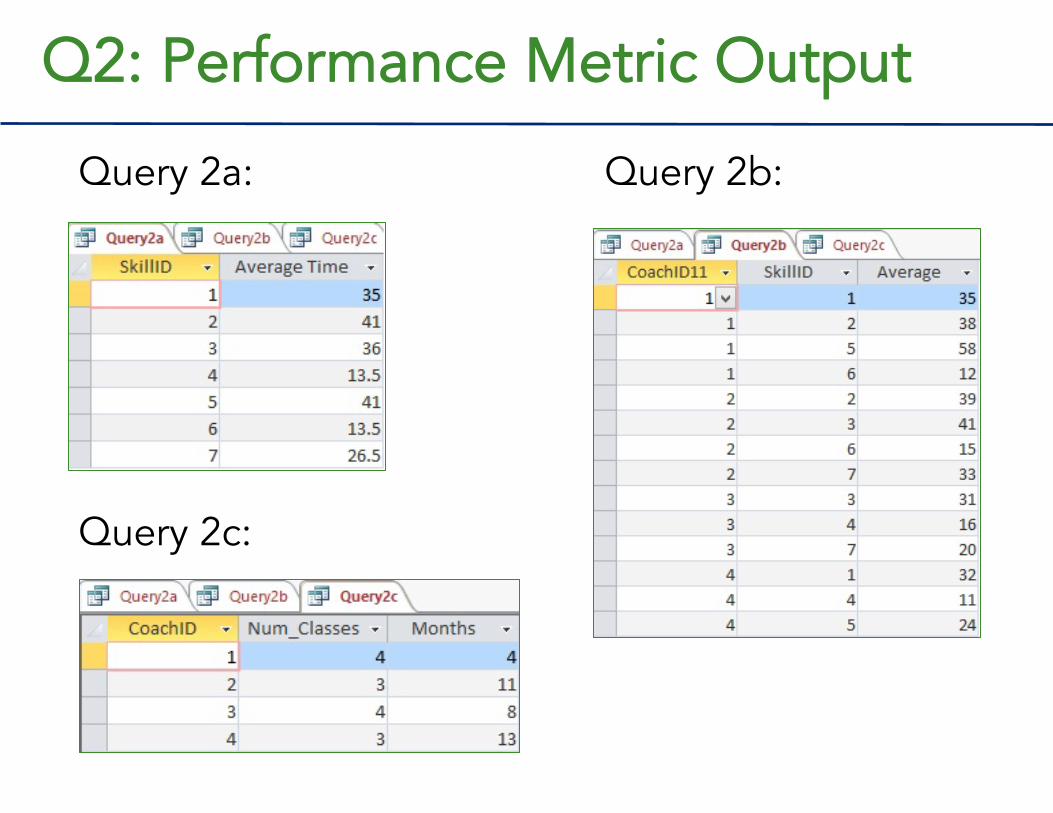
Q2: Performance Metric Output
Query 2a: Query 2b:
Query 2c:
20
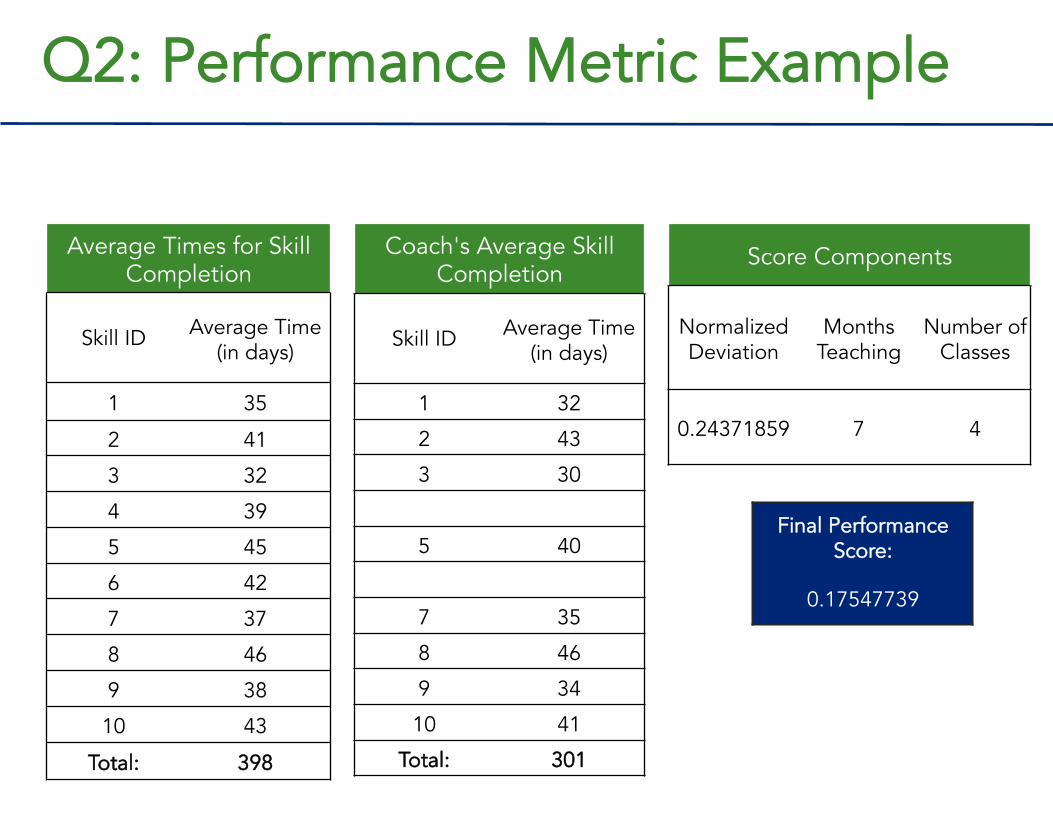
Q2: Performance Metric Example
Average Times for Skill Completion
Skill ID Average Time (in days)
1 35
2 41
3 32
4 39
5 45
6 42
7 37
8 46
9 38
10 43
Total: 398
Coach's Average Skill Completion
Skill ID Average Time (in days)
1 32
2 43
3 30
5 40
7 35
8 46
9 34
10 41
Total: 301
Score Components
Normalized Deviation
Months Teaching
Number of Classes
0.24371859 7 4
Final Performance Score:
0.17547739

Query 3: Managing Inventory
How do we determine the optimal frequency of inventory purchases?
Class days + Daily demand + Unit costs
+ Interest rates + Purchase date
Economic Order Quantity (EOQ) model
to minimize holding and ordering costs
Optimal frequency of inventory purchases

Q3: Inventory Management Process
Optimal Quantity (Q*) = Reorder Point (ROP) = Optimal Cycle Time (T*) x Lead Time Optimal Cycle Time (T*) =
Economic Order Quantity Formulas:

Q3: Inventory Management Process Assumptions
- Daily Demand is known and constant
- Delivery Lead Time is known and constant
as one day
- Ordering cost, unit cost, and interest rate
are known and constant
- 250 School days (5 days per a week, 10 federal
holidays)
- No quantity discounts
- Purchase date updated whenever new order
placed
- The annual interest rate is known as really small
Diagram

24
Q3: Inventory Management SQL /* Implements the EOQ model to return the optimal order quantity of our inventory items. */ SELECT ItemID, ItemName, IIF(AmountofItem<=DailyDemand, ‘Yes’, ‘No’) AS Stockout, round(sqr(2*[OrderingCost]*[DailyDemand *250]/(InterestRate*ItemPrice))) AS OptimalQuantityQ, IIF(LeadTime>0, round(LeadTime*sqr(2*[OrderingCost]/ (DailyDemand *250]*(InterestRate*ItemPrice)))) AS ReorderPoint, IIF([AmountofItem<=Daily Demand, Date(),([PurchaseDate]+round(((sqr(2*[orderingCost]*[Daily Demand]/([InterestRate]*[ItemPrice])))/[DailyDemand])*250))) AS NextOrderDate; FROM Inventory ORDER BY IIF([AmountofItem<=Daily Demand, Date(),([PurchaseDate]+round(((sqr(2*[orderingCost]*[Daily Demand]/([InterestRate]*[ItemPrice])))/[DailyDemand])*250)));

25
Q3: Inventory Management Output

Query 4: Customer Retention
Is there a correlation between customer retention and customer registration method?
Sort customers by registration method
Use ribbon levels completed as a
metric for customer loyalty
Plot ribbon levels completed by method
to determine most effective marketing
strategy

27
Q4: Customer Retention Process Plotting:
- x-axis: number of ribbon levels a swimmer has completed, where 1 means he/she only participated in a single ribbon level and 10 meaning he/she progressed through all levels.
- y-axis: number of registrations through various methods by customers.
upward slopes indicate that swimmers tend to stay for longer periods of time. downward slopes indicate more short-term swimmers.

28
Q4: Customer Retention SQL
SELECT Administrative_Request.MethodOfRegistration, [CurrentRibbonLevel]-‐[StartingRibbonLevel]+1 AS NumberOfRibbons FROM (Member INNER JOIN Swimmer ON Member.[MID] = Swimmer.[MID2]) INNER JOIN Administrative_Request ON Member.[MID] = Administrative_Request.[MID2] ORDER BY Administrative_Request.MethodOfRegistration;
NOTE: We added one to the difference between the starting ribbon and current ribbon levels because if students were still on their first ribbon level, using the number zero may have led the user to believe the student did not participate in any class.

29
Q4: Customer Retention Output

Q4: Customer Retention Example
Ribbon Levels Completed vs. Customer Registrations by Method

Query 5: Preventive Maintenance
How can we avoid costly unplanned maintenance fixes?
Cost of (un)planned maintenance
+ Inventory type + Number of failures
Determine probability of failure
using Prof. Leachman’s model
Optimal time to conduct planned
maintenance

Q5: Maintenance Process
• RODBC Package ‒ Download and install RODBC package to
read database files (.mdb) in R.
• Microsoft Access ‒ Write the query, and save the table.
• prevMaintenance.R Script ‒ Input frequency of maintenance checks.
‒ Time between maintenance, t, is in weeks.
• R ‒ Run script, calling myPMFfunction.
‒ Minimum time interval between planned maintenance checks will be outputted.

Q5: Maintenance Model The idea behind scheduled preventative maintenance is that planned maintenance has a cost, c2, that is less than an unplanned maintenance cost, c1. We assume that a component like filters is “new” or “like new” after a maintenance, and we want to choose the best time, t between the last completed maintenance and the next required maintenance (called a cycle). We assume that t is modeled by a cumulative probability distribution function F(t). The expected cost per unit time is:
E(cost per unit time) = E(cost per cycle) / E(length of a cycle)
E(cost per cycle) = c1 * Pr(Unplanned Maintenance) + c2 * Pr(Planned Maintenance) = c1 * F(t) + c2 * [1 – F(t)]
E(length of a cycle) =
The expected cost function G(t) is thus: However, the function f(x) is not usually known, so we approximate it using what we already know about when tools fail. So let pk denote the fraction of failures that occurred k periods after maintenance, k = 1, 2, 3, … We can then express G(t) as
c1 * F(t) + c2 * [1 – F(t)] G(t) =

34
Q5: Maintenance SQL
/* Determines the item type, costs of planned and unplanned maintenance, and computes the probability of failure by dividing the number of failures by the difference between the purchase date and the current date. Conditions on what specific item is being looked at. */ SELECT Inventory_Item.Type, Inventory_Item.CostOfUnplannedMaintenance, Inventory_Item.CostOfPlannedMaintenance, (Inventory_Item.NumberOfFailures/ DateDiff(“d”,Inventory_Item.DatePurchased,Date())) AS ProbabilityOfFailure FROM Inventory_Item WHERE (((Inventory_Item.Type)=‘Motorized Pump’));

35
Q5: Maintenance Analysis in R
##Before you can use the R package RODBC, make sure you have R and the RODBC package installed on your computer. You then need to create a new System DSN in the ODBC Data Source Administrator, found under Control Panel -‐-‐> System and Security -‐-‐> Administrative Tools in Windows 7. You will use this DSN, here “MyDSN”, to connect to the MS Access Database. library(RODBC) channel <-‐ odbcConnect("MyDSN") data <-‐ sqlFetch(channel, "Query5") c1 <-‐ data[1,2] c2 <-‐ data[1,3] p <-‐ data[1,4] myPMFfunction <-‐ function(c1, c2, t, p) { L <-‐ length(t) G <-‐ array(1, dim=c(1,L)) pf <-‐ p*t for (i in 1:L) { G[i] <-‐ (c1*pf[i] + c2*(1-‐pf[i]))/(sum(pf[1:i])+t[i]*(1-‐pf[i]))
} print(min(G)) }

36
Q5: Maintenance Output
Query Result:
R Script Result:

Normalization Analysis
37

Decomposing to 1NF and 3NF
Fundraiser (EventID, EventName, EventType, Location, StartTime, EndTime,
NumofAttendees, MonetaryGoal, NumRegistered, MoneyRaised)
3NF
1NF
Fundraiser (EventID, EventName, EventType, StreetAddress, City, Zip, StartTime, EndTime, NumOfAttendees, MonetaryGoal, NumRegistered, Money Raised)
Event_Info (EventID, EventName, EventType, StartTime, EndTime) Event_Location (EventID, StreetAddress, City) Event_Before (EventType, StreetAddress, City, NumRegistered, MonetaryGoal) Funds_After (EvenyType, StreetAddress, City, NumOfAttendees, MoneyRaised)

Decomposing to 3NF
Inventory_Item (ItemID, PurchaseDate, ExpectedExpirationDate, Type, CostOfPM, CostUPM, NumOfFailures)
3NF
Item_PM (ItemID, Type, CostOfPM, CostOfUPM, NumOfFailures) Item_Dates (ItemID, PurchaseDate, ExpectedExpirationDate)
Functional Dependency