dynamic(voltage(frequency(scaling - umu.sepeople.cs.umu.se/jakub/talks/2016-02-02_dvfsandcpu... ·...
TRANSCRIPT
Using Dynamic Voltage Frequency Scaling and CPU Pinning for Energy Efficiency in Cloud Compu1ng
Jakub Krzywda Umeå University

How to use DVFS and CPU Pinning to
• lower the power consump1on during periods of low traffic
• while fulfilling SLOs (throughput, response 1me)
Influence of various configura1ons on: – power consump1on (physical server) – performance (VM / applica1on)
2
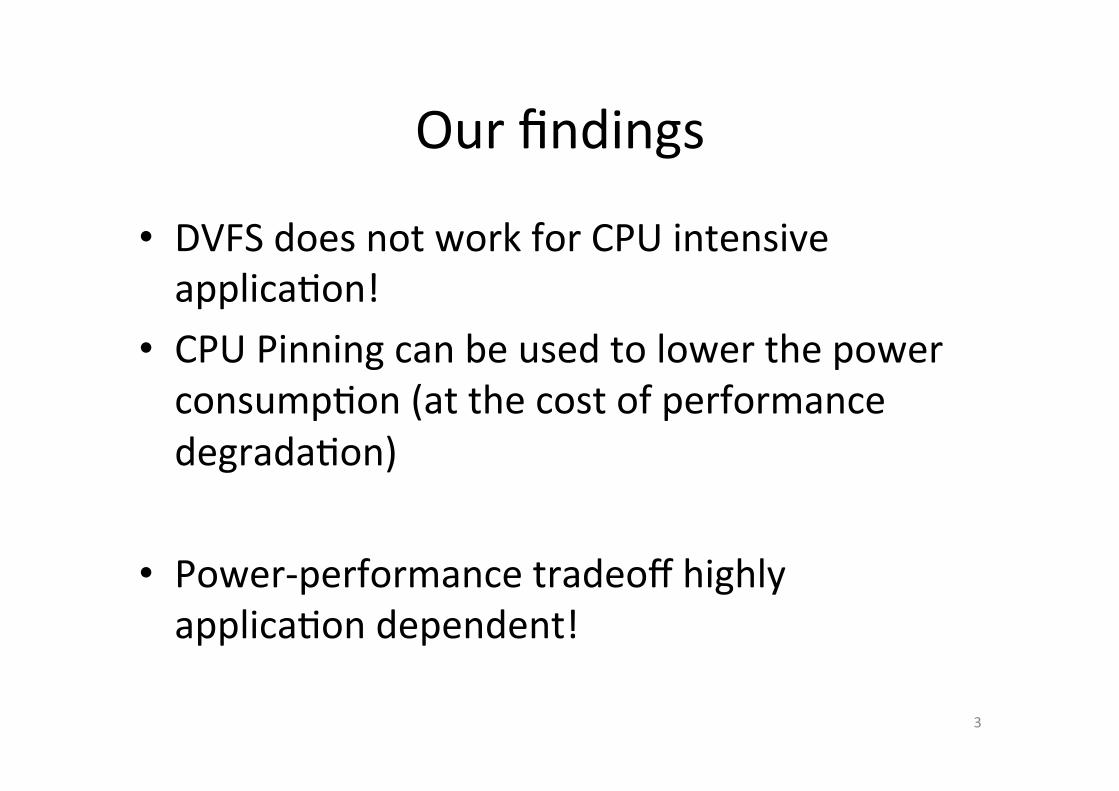
Our findings
• DVFS does not work for CPU intensive applica1on!
• CPU Pinning can be used to lower the power consump1on (at the cost of performance degrada1on)
• Power-‐performance tradeoff highly applica1on dependent!
3
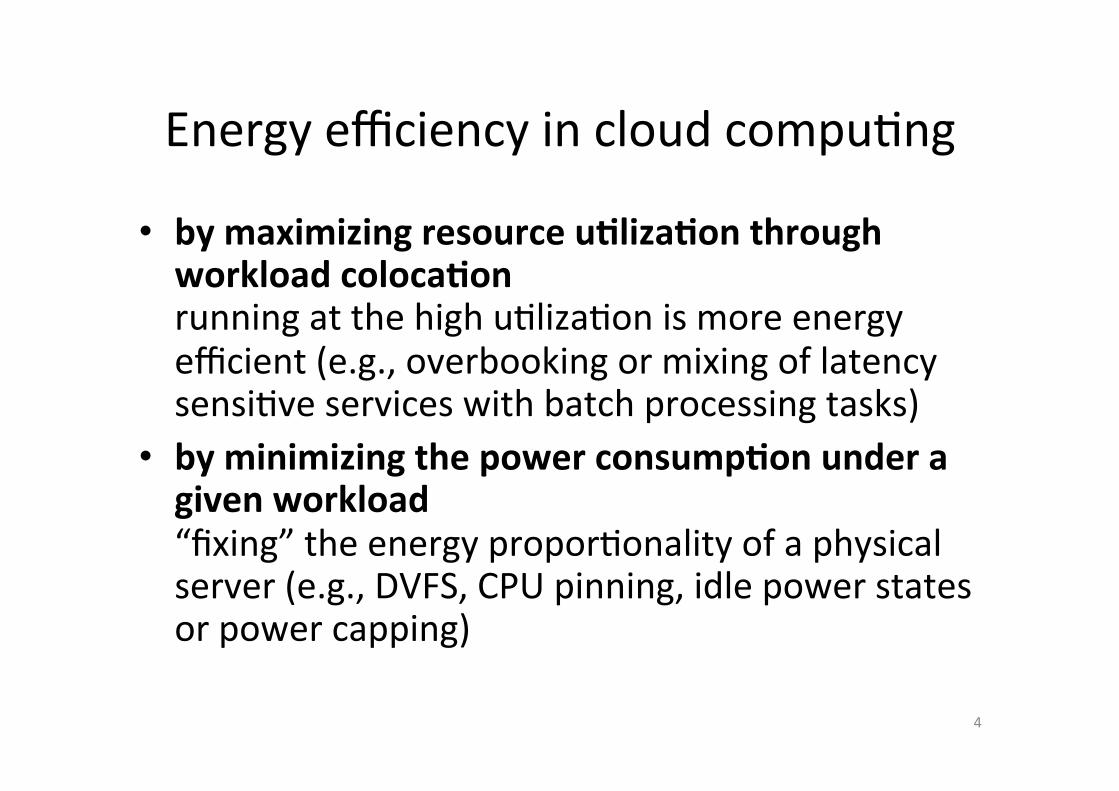
Energy efficiency in cloud compu1ng
• by maximizing resource u=liza=on through workload coloca=on running at the high u1liza1on is more energy efficient (e.g., overbooking or mixing of latency sensi1ve services with batch processing tasks)
• by minimizing the power consump=on under a given workload “fixing” the energy propor1onality of a physical server (e.g., DVFS, CPU pinning, idle power states or power capping)
4

Energy propor1onality
5
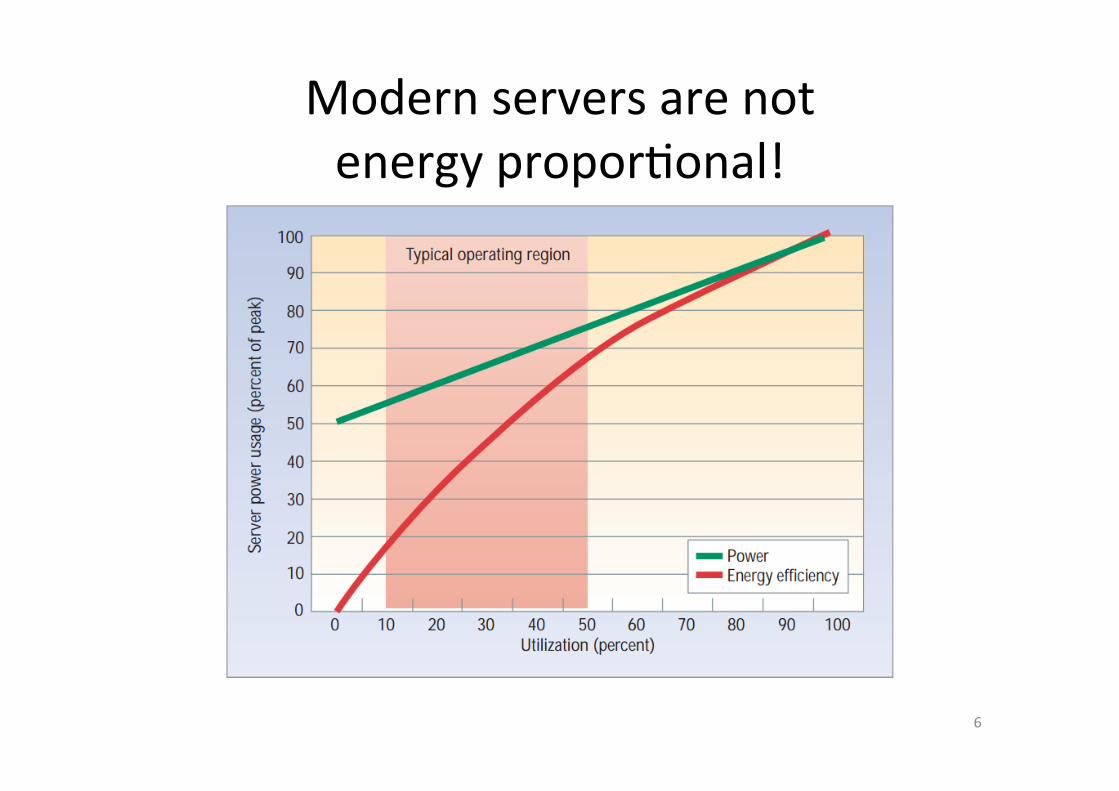
Modern servers are not energy propor1onal!
6
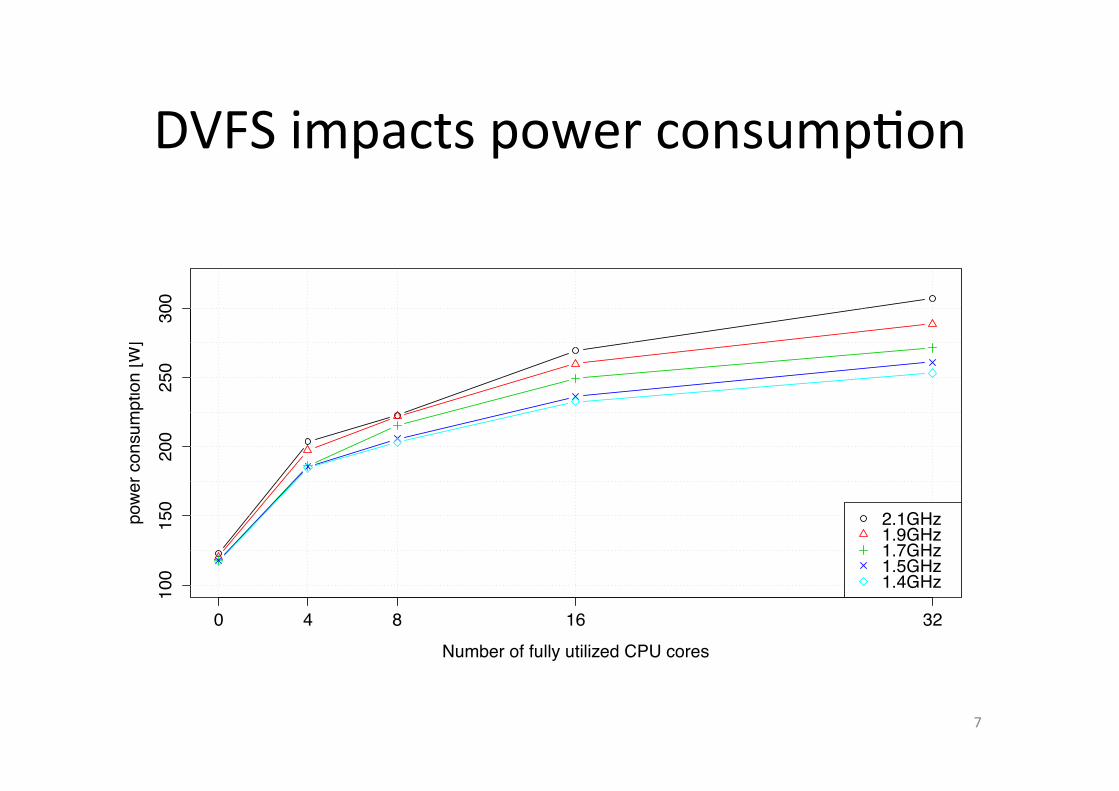
DVFS impacts power consump1on 10
015
020
025
030
0
Power consumption vs CPU utilization
Number of fully utilized CPU cores
powe
r con
sum
ptio
n [W
]
0 4 8 16 32
2.1GHz1.9GHz1.7GHz1.5GHz1.4GHz
7
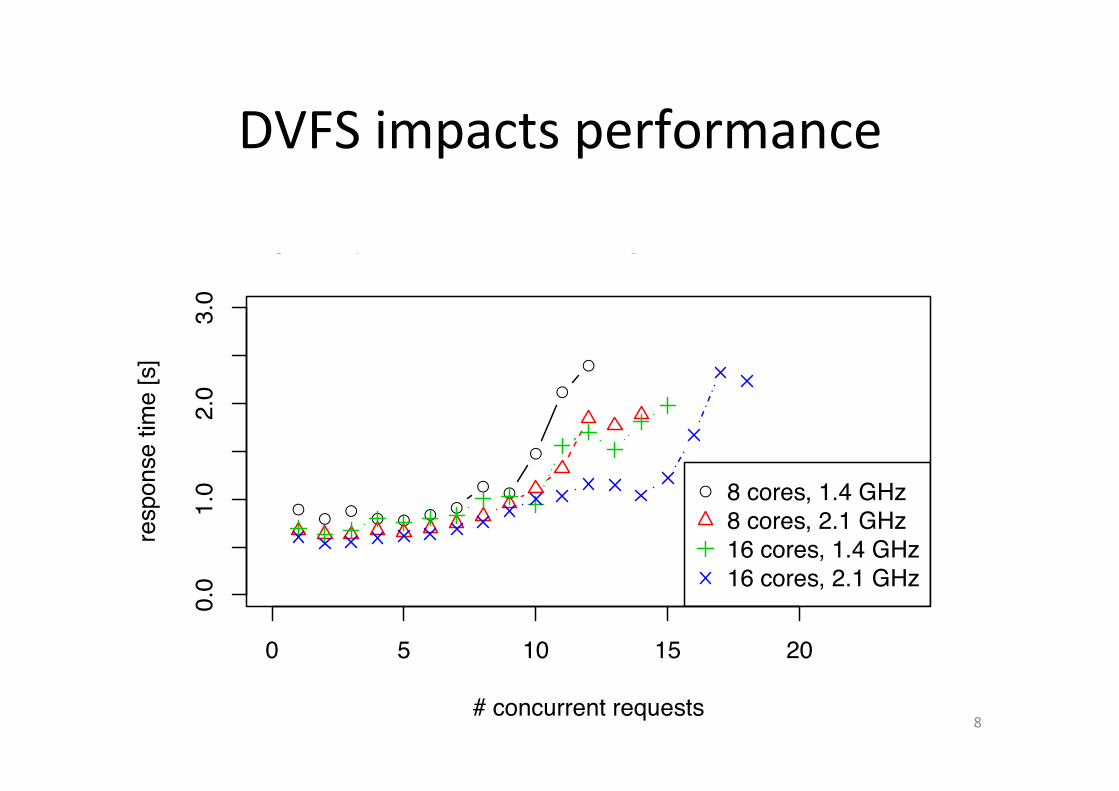
DVFS impacts performance
●●
●● ● ● ●
● ●
●
●
●
0 5 10 15 20
0.0
1.0
2.0
3.0
Average response time (200s only with success rate > 99%)
# concurrent requests
resp
onse
tim
e [s
]
● 8 cores, 1.4 GHz8 cores, 2.1 GHz16 cores, 1.4 GHz16 cores, 2.1 GHz
8
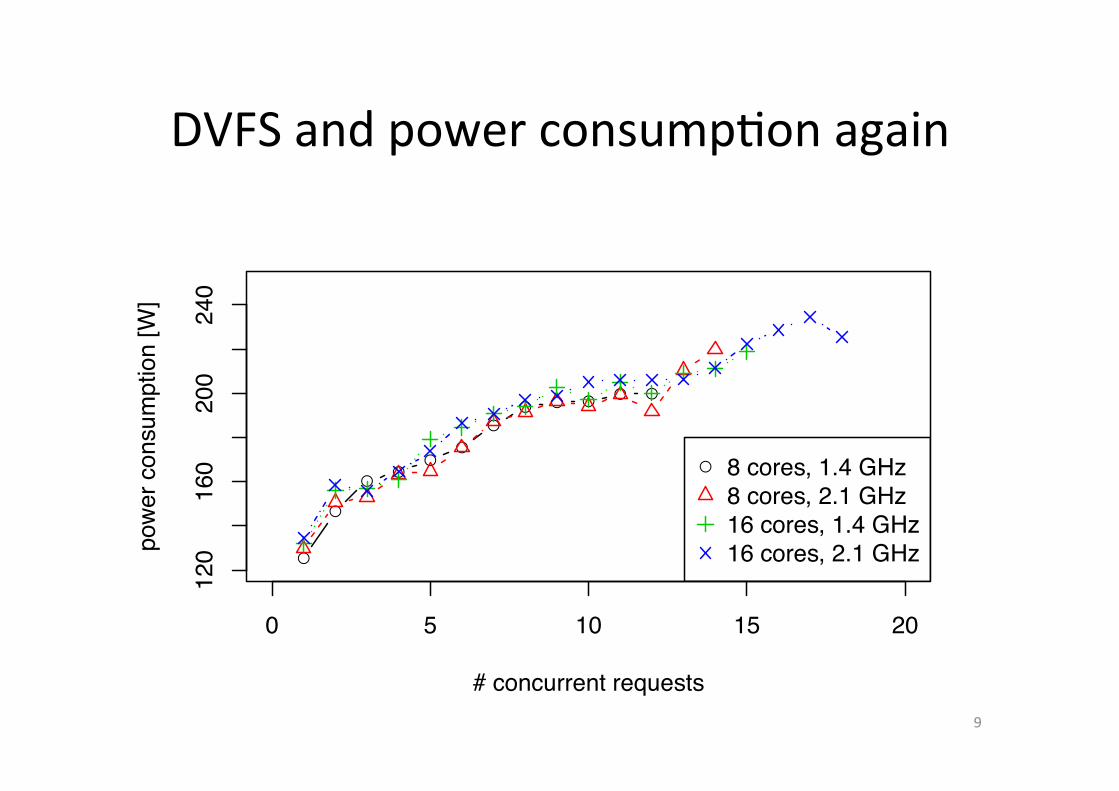
DVFS and power consump1on again
●
●
●●
●●
●
● ● ●● ●
0 5 10 15 20
120
160
200
240
Average power consumption
# concurrent requests
powe
r con
sum
ptio
n [W
]
● 8 cores, 1.4 GHz8 cores, 2.1 GHz16 cores, 1.4 GHz16 cores, 2.1 GHz
9
DVFS does not work for CPU intensive applica1on!
• Significant influence on performance
• Very small influence on power consump1on ~ 5-‐10 W (< 5%)
10

CPU Pinning Setting 2
Cores
Util
izat
ion
[%]
1 16 32
050
100
(a) Setting 1
Setting 2
Cores
Util
izat
ion
[%]
1 16 320
5010
0
(b) Setting 2
Setting 3
Cores
Util
izat
ion
[%]
1 16 32
050
100
(c) Setting 3
Setting 4
Cores
Util
izat
ion
[%]
1 16 32
050
100
(d) Setting 4Setting 5
Cores
Util
izat
ion
[%]
1 16 32
050
100
(e) Setting 5
Setting 6
Cores
Util
izat
ion
[%]
1 16 32
050
100
(f) Setting 6
Setting 7
Cores
Util
izat
ion
[%]
1 16 32
050
100
(g) Setting 7
Setting 8
Cores
Util
izat
ion
[%]
1 16 32
025
100
(h) Setting 8
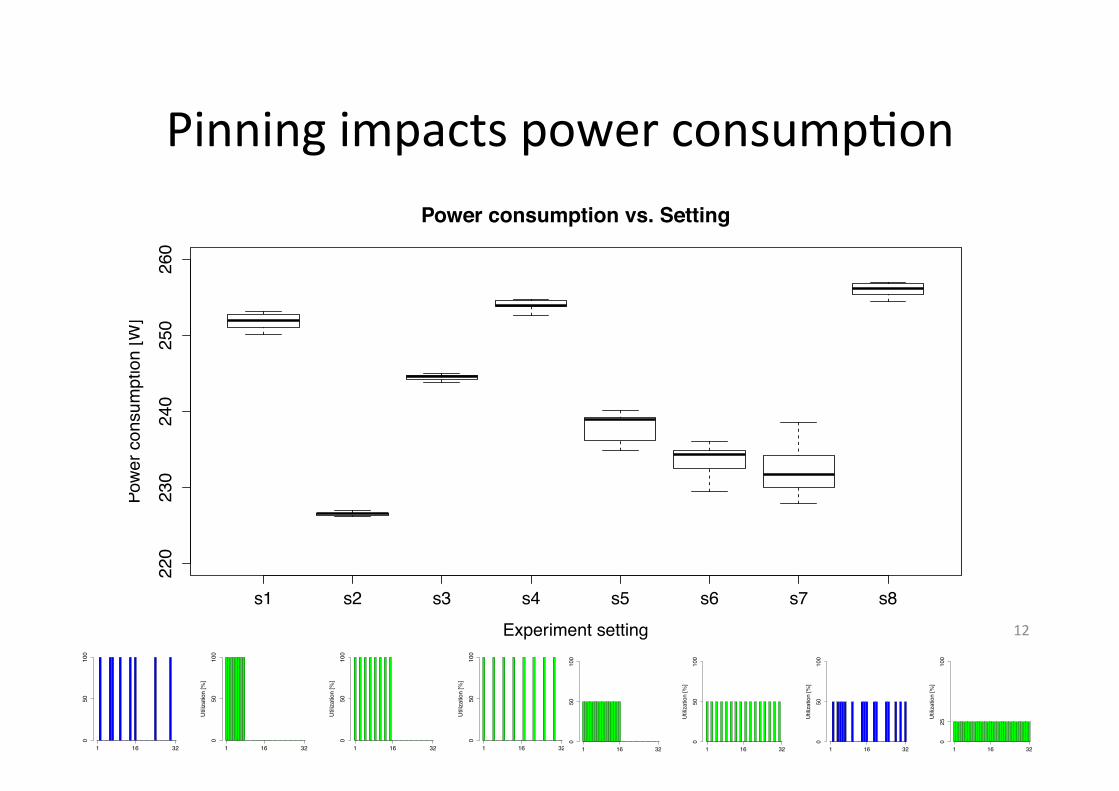
Figure 3: Experiment settings used for evaluation of the influence of CPU pinning and cores arrangement on power con-sumption. Blue color means a random assignment and changes during the experiment run, while green color means that theassignment is constant (processes are pinned to CPU cores).
s1 s2 s3 s4 s5 s6 s7 s8
220
230
240
250
260
Power consumption vs. Setting
Experiment setting
Powe
r con
sum
ptio
n [W
]
Figure 4: The workload arrangement over CPU cores has asignificant influence on the power consumption.
5.2 Power-performance tradeoffFigure 5 shows that pinning of VMs’ virtual cores to CPU
cores of host a↵ects both the power consumption of physicalmachine that hosts VMs (Figure 5a) and performance ofthe applications that are running inside the VMs. In mostcases pinning all VMs to the first n consecutive cores givesthe lowest power consumption but at the same time leadsto the the worse performance: increased latency and manyrequests dropped (especially for 16 VMs).
Pinning reduces power consumption significantly only incase when a small subset of cores is used (e.g. 8 out of 32).It doesn’t make much di↵erence if majority of cores is used[I will make some statistical tests here].
6. CONCLUSIONS
7. ACKNOWLEDGMENTSThis work is funded by the Swedish Research Council
(VR) project Cloud Control and the European Union’s Sev-enth Framework Programme under grant agreement 610711(CACTOS).
8. REFERENCES[1] Advanced Micro Devices, Inc. AMD OpteronTM6200
Linux Tuning Guide.http://www.naic.edu/˜phil/software/amd/51803AOpteronLinuxTuningGuide SCREEN.pdf, April 2012.Accessed: 2016-01-25.
[2] J. Arjona Aroca, A. Chatzipapas, A. Fernandez Anta,and V. Mancuso. A Measurement-based Analysis ofthe Energy Consumption of Data Center Servers. InProceedings of the 5th International Conference onFuture Energy Systems, e-Energy ’14, pages 63–74,New York, NY, USA, 2014. ACM.
[3] L. A. Barroso and U. Holzle. The Case forEnergy-Proportional Computing. Computer,40(12):33–37, 2007.
[4] R. Cochran, C. Hankendi, A. K. Coskun, and S. Reda.Pack & Cap: Adaptive DVFS and Thread PackingUnder Power Caps. In Proceedings of the 44th AnnualIEEE/ACM International Symposium onMicroarchitecture, MICRO-44, pages 175–185, NewYork, NY, USA, 2011. ACM.
[5] H. David, C. Fallin, E. Gorbatov, U. R. Hanebutte,and O. Mutlu. Memory Power Management viaDynamic Voltage/Frequency Scaling. In Proceedings ofthe 8th ACM International Conference on AutonomicComputing, ICAC ’11, pages 31–40, New York, NY,
11
Pinning impacts power consump1on
s1 s2 s3 s4 s5 s6 s7 s8
220
230
240
250
260
Power consumption vs. Setting
Experiment setting
Powe
r con
sum
ptio
n [W
]
Setting 2
Cores
Util
izat
ion
[%]
1 16 32
050
100
(a) Setting 1
Setting 2
Cores
Util
izat
ion
[%]
1 16 32
050
100
(b) Setting 2
Setting 3
Cores
Util
izat
ion
[%]
1 16 32
050
100
(c) Setting 3
Setting 4
Cores
Util
izat
ion
[%]
1 16 32
050
100
(d) Setting 4Setting 5
Cores
Util
izat
ion
[%]
1 16 32
050
100
(e) Setting 5
Setting 6
Cores
Util
izat
ion
[%]
1 16 32
050
100
(f) Setting 6
Setting 7
Cores
Util
izat
ion
[%]
1 16 32
050
100
(g) Setting 7
Setting 8
Cores
Util
izat
ion
[%]
1 16 32
025
100
(h) Setting 8
Figure 3: Experiment settings used for evaluation of the influence of CPU pinning and cores arrangement on power con-sumption. Blue color means a random assignment and changes during the experiment run, while green color means that theassignment is constant (processes are pinned to CPU cores).
s1 s2 s3 s4 s5 s6 s7 s8
220
230
240
250
260
Power consumption vs. Setting
Experiment setting
Powe
r con
sum
ptio
n [W
]
Figure 4: The workload arrangement over CPU cores has asignificant influence on the power consumption.
5.2 Power-performance tradeoffFigure 5 shows that pinning of VMs’ virtual cores to CPU
cores of host a↵ects both the power consumption of physicalmachine that hosts VMs (Figure 5a) and performance ofthe applications that are running inside the VMs. In mostcases pinning all VMs to the first n consecutive cores givesthe lowest power consumption but at the same time leadsto the the worse performance: increased latency and manyrequests dropped (especially for 16 VMs).
Pinning reduces power consumption significantly only incase when a small subset of cores is used (e.g. 8 out of 32).It doesn’t make much di↵erence if majority of cores is used[I will make some statistical tests here].
6. CONCLUSIONS
7. ACKNOWLEDGMENTSThis work is funded by the Swedish Research Council
(VR) project Cloud Control and the European Union’s Sev-enth Framework Programme under grant agreement 610711(CACTOS).
8. REFERENCES[1] Advanced Micro Devices, Inc. AMD OpteronTM6200
Linux Tuning Guide.http://www.naic.edu/˜phil/software/amd/51803AOpteronLinuxTuningGuide SCREEN.pdf, April 2012.Accessed: 2016-01-25.
[2] J. Arjona Aroca, A. Chatzipapas, A. Fernandez Anta,and V. Mancuso. A Measurement-based Analysis ofthe Energy Consumption of Data Center Servers. InProceedings of the 5th International Conference onFuture Energy Systems, e-Energy ’14, pages 63–74,New York, NY, USA, 2014. ACM.
[3] L. A. Barroso and U. Holzle. The Case forEnergy-Proportional Computing. Computer,40(12):33–37, 2007.
[4] R. Cochran, C. Hankendi, A. K. Coskun, and S. Reda.Pack & Cap: Adaptive DVFS and Thread PackingUnder Power Caps. In Proceedings of the 44th AnnualIEEE/ACM International Symposium onMicroarchitecture, MICRO-44, pages 175–185, NewYork, NY, USA, 2011. ACM.
[5] H. David, C. Fallin, E. Gorbatov, U. R. Hanebutte,and O. Mutlu. Memory Power Management viaDynamic Voltage/Frequency Scaling. In Proceedings ofthe 8th ACM International Conference on AutonomicComputing, ICAC ’11, pages 31–40, New York, NY,
Setting 2
Cores
Util
izat
ion
[%]
1 16 32
050
100
(a) Setting 1
Setting 2
Cores
Util
izat
ion
[%]
1 16 32
050
100
(b) Setting 2
Setting 3
Cores
Util
izat
ion
[%]
1 16 32
050
100
(c) Setting 3
Setting 4
Cores
Util
izat
ion
[%]
1 16 32
050
100
(d) Setting 4Setting 5
Cores
Util
izat
ion
[%]
1 16 32
050
100
(e) Setting 5
Setting 6
Cores
Util
izat
ion
[%]
1 16 32
050
100
(f) Setting 6
Setting 7
Cores
Util
izat
ion
[%]
1 16 32
050
100
(g) Setting 7
Setting 8
Cores
Util
izat
ion
[%]
1 16 32
025
100
(h) Setting 8
Figure 3: Experiment settings used for evaluation of the influence of CPU pinning and cores arrangement on power con-sumption. Blue color means a random assignment and changes during the experiment run, while green color means that theassignment is constant (processes are pinned to CPU cores).
s1 s2 s3 s4 s5 s6 s7 s8
220
230
240
250
260
Power consumption vs. Setting
Experiment setting
Powe
r con
sum
ptio
n [W
]
Figure 4: The workload arrangement over CPU cores has asignificant influence on the power consumption.
5.2 Power-performance tradeoffFigure 5 shows that pinning of VMs’ virtual cores to CPU
cores of host a↵ects both the power consumption of physicalmachine that hosts VMs (Figure 5a) and performance ofthe applications that are running inside the VMs. In mostcases pinning all VMs to the first n consecutive cores givesthe lowest power consumption but at the same time leadsto the the worse performance: increased latency and manyrequests dropped (especially for 16 VMs).
Pinning reduces power consumption significantly only incase when a small subset of cores is used (e.g. 8 out of 32).It doesn’t make much di↵erence if majority of cores is used[I will make some statistical tests here].
6. CONCLUSIONS
7. ACKNOWLEDGMENTSThis work is funded by the Swedish Research Council
(VR) project Cloud Control and the European Union’s Sev-enth Framework Programme under grant agreement 610711(CACTOS).
8. REFERENCES[1] Advanced Micro Devices, Inc. AMD OpteronTM6200
Linux Tuning Guide.http://www.naic.edu/˜phil/software/amd/51803AOpteronLinuxTuningGuide SCREEN.pdf, April 2012.Accessed: 2016-01-25.
[2] J. Arjona Aroca, A. Chatzipapas, A. Fernandez Anta,and V. Mancuso. A Measurement-based Analysis ofthe Energy Consumption of Data Center Servers. InProceedings of the 5th International Conference onFuture Energy Systems, e-Energy ’14, pages 63–74,New York, NY, USA, 2014. ACM.
[3] L. A. Barroso and U. Holzle. The Case forEnergy-Proportional Computing. Computer,40(12):33–37, 2007.
[4] R. Cochran, C. Hankendi, A. K. Coskun, and S. Reda.Pack & Cap: Adaptive DVFS and Thread PackingUnder Power Caps. In Proceedings of the 44th AnnualIEEE/ACM International Symposium onMicroarchitecture, MICRO-44, pages 175–185, NewYork, NY, USA, 2011. ACM.
[5] H. David, C. Fallin, E. Gorbatov, U. R. Hanebutte,and O. Mutlu. Memory Power Management viaDynamic Voltage/Frequency Scaling. In Proceedings ofthe 8th ACM International Conference on AutonomicComputing, ICAC ’11, pages 31–40, New York, NY,
12
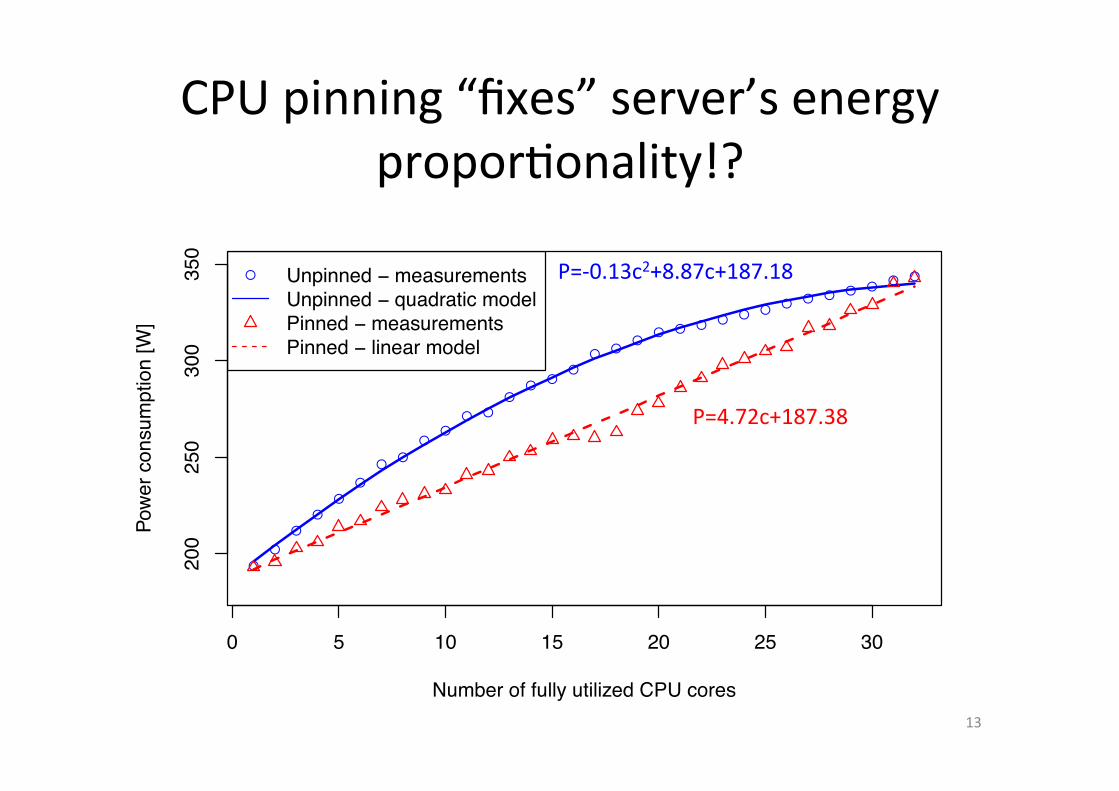
CPU pinning “fixes” server’s energy propor1onality!?
●
●
●
●
●
●
●●
●●
● ●
●●
●●
● ●●
● ● ● ● ● ●● ● ● ● ●
● ●
0 5 10 15 20 25 30
200
250
300
350
Average power consumption vs number of utilized CPU cores
Number of fully utilized CPU cores
Powe
r con
sum
ptio
n [W
]
● Unpinned − measurementsUnpinned − quadratic modelPinned − measurementsPinned − linear model
P=-‐0.13c2+8.87c+187.18
P=4.72c+187.38
13
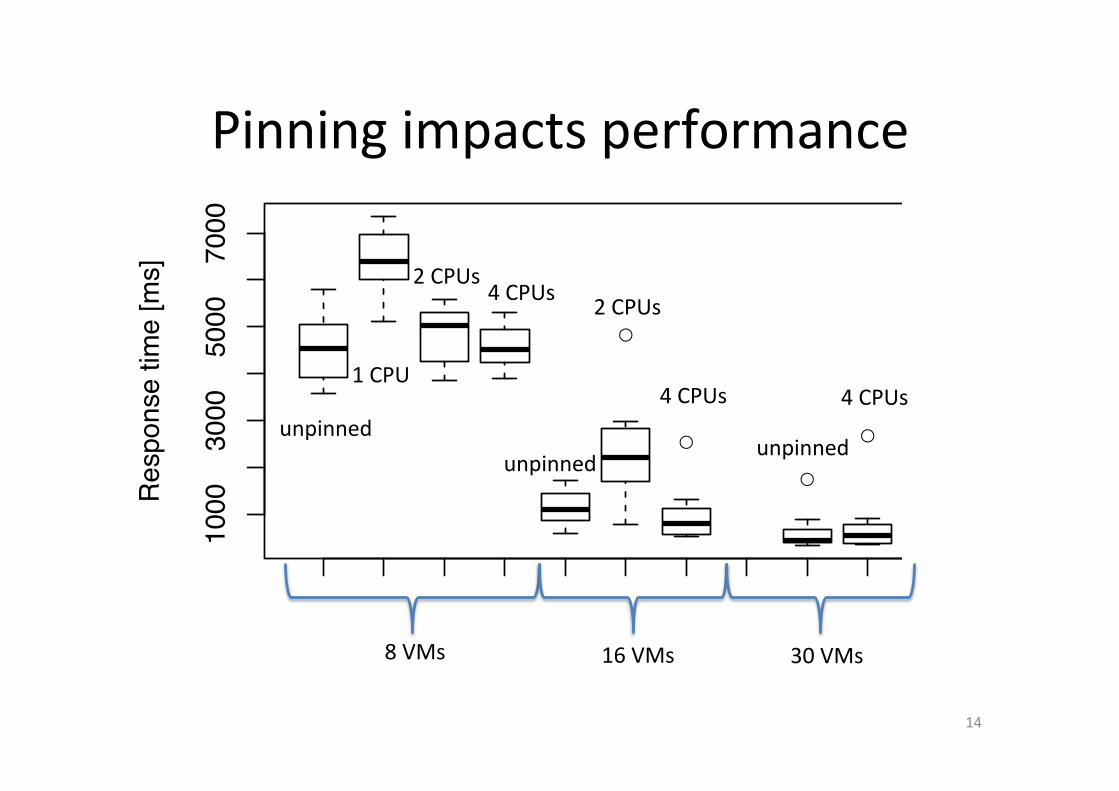
Pinning impacts performance
●
●
●
●
0.8 2.8 0.16 2.16 0.30 2.30
1000
3000
5000
7000
Average response time
Settings
Res
pons
e tim
e [m
s]
14
8 VMs 16 VMs 30 VMs
unpinned unpinned
unpinned
1 CPU
2 CPUs 4 CPUs 2 CPUs
4 CPUs 4 CPUs

CPU pinning and power consump1on
●
0.8 2.8 0.16 2.16 0.30 2.30
230
240
250
260
270
Power consumption
Settings
Powe
r con
sum
ptio
n [W
]
15
8 VMs 16 VMs 30 VMs
unpinned
unpinned unpinned
1 CPU 2 CPUs
4 CPUs
2 CPUs
4 CPUs
4 CPUs

CPU Pinning looks promising
• CPU Pinning can be used to lower the power consump1on (~20 W in case of 8 cores)
16

Future work
• Perform experiments using different applica1ons (e.g. memory bounded)
• Construct models of power-‐performance tradeoffs
• Use these models to op1mize the placement (inter and intra physical servers)
17

THANK YOU!
18
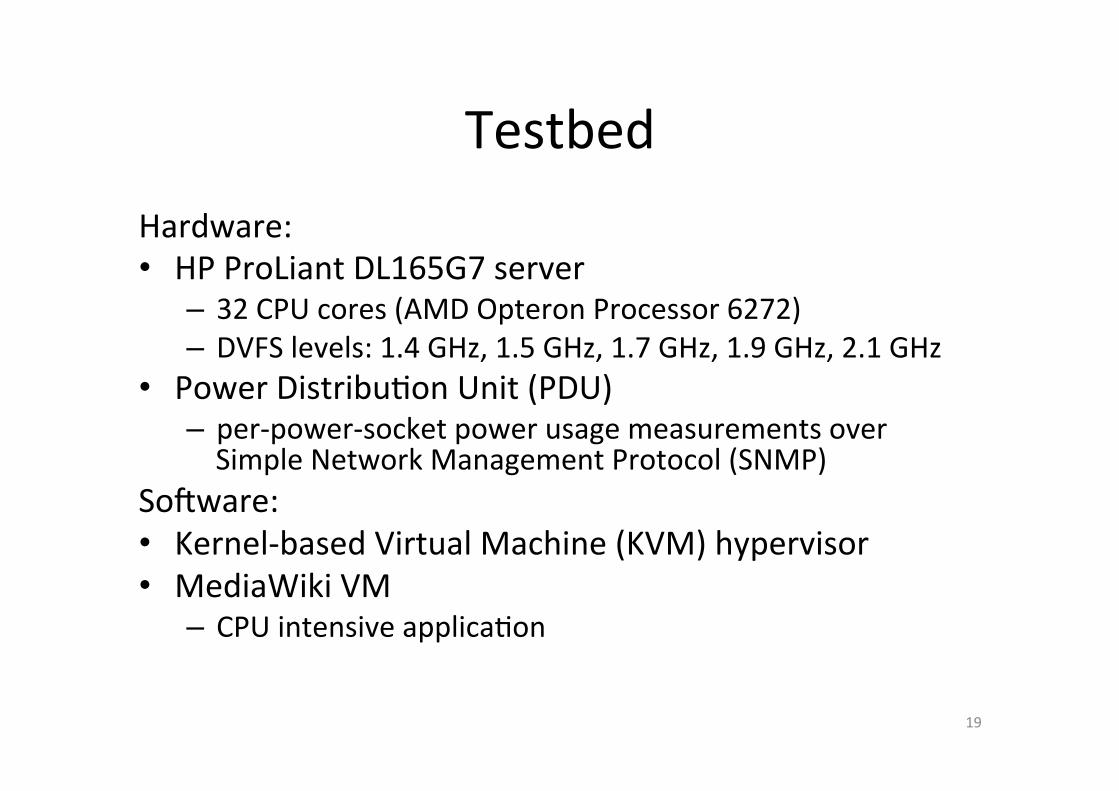
Testbed Hardware: • HP ProLiant DL165G7 server
– 32 CPU cores (AMD Opteron Processor 6272) – DVFS levels: 1.4 GHz, 1.5 GHz, 1.7 GHz, 1.9 GHz, 2.1 GHz
• Power Distribu1on Unit (PDU) – per-‐power-‐socket power usage measurements over Simple Network Management Protocol (SNMP)
Sooware: • Kernel-‐based Virtual Machine (KVM) hypervisor • MediaWiki VM
– CPU intensive applica1on
19