evaluationofchemotherapeuticagentsagainstavarietyofcancerres.aacrjournals.org/content/22/7_part_2/559.full.pdf560...
TRANSCRIPT

EVALUATIONOF CHEMOTHERAPEUTICAGENTSAGAINST A VARIETY OFMOUSEASCITES TUMORS. III.*
R. J. Rutman, F. S. Lewis, S. Buckner, C. C. Price,F. Llevellyn+ and E. Owen"*"
(University of Pennsylvania, College of Chemistry, Philadelphia, Pa.)
The selection of a procedure for the evaluation of potential anticancer drugsnecessarily represents compromises between a variety of theoretical and practical considerations. Procedures can be chosen which are based on the precise quantitative comparison of related drugs (1,2); in contrast, emphasis may be placed on the scope of theantitumor action in a wide variety of tumors (3). In either case, practical implementation often reflects limitations imposed by space and resource considerations.
In an effort to compromise among several of these considerations, we have adopteda procedure based on the use of a wide spectrum of ascites tumors which can be maintained as frozen stock and which require only a single murine host.
By selection of the C3HxDBA/2 hybrid mouse (or the reciprocal cross )•*•*/it is
possible to attain stable and reproducible performance with a majority of the twentyascites tumors tested. Presented in this paper are results from sixteen of the tumorstested. The use of a single host and a frozen tumor bank obviates the need for severalinbred strains of mice and for continuous in vivo maintenance of tumor stocks, reducingspace requirements accordingly.^/
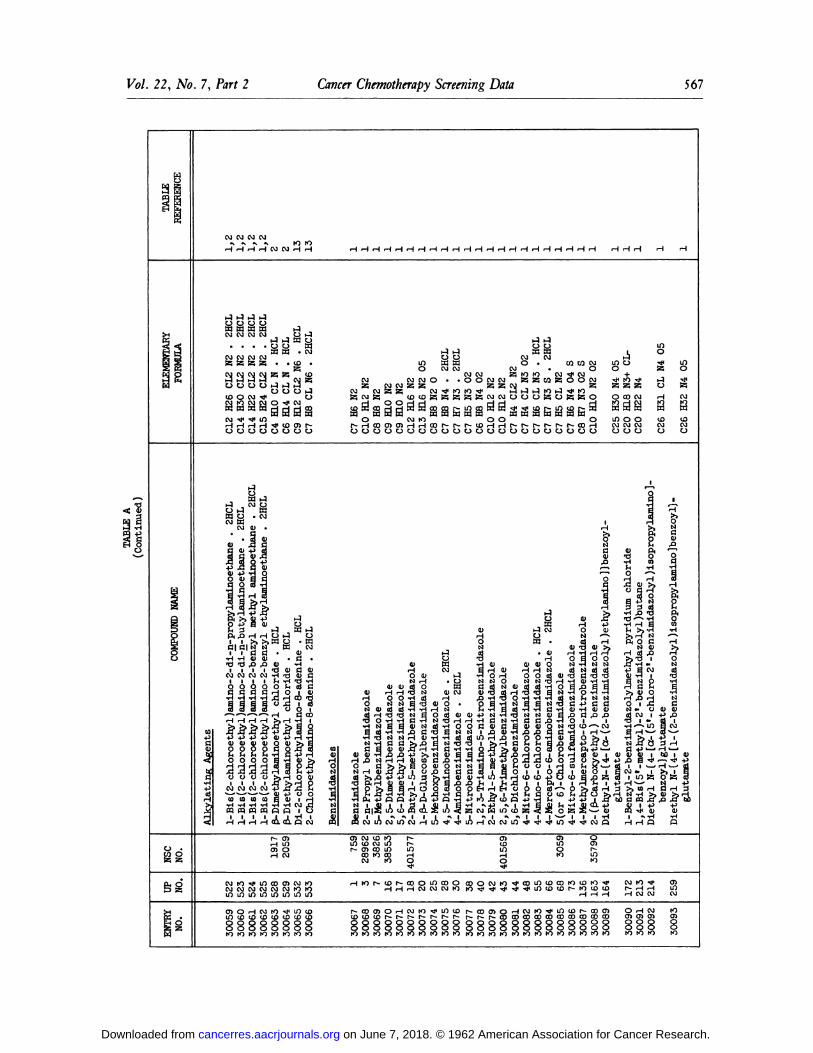
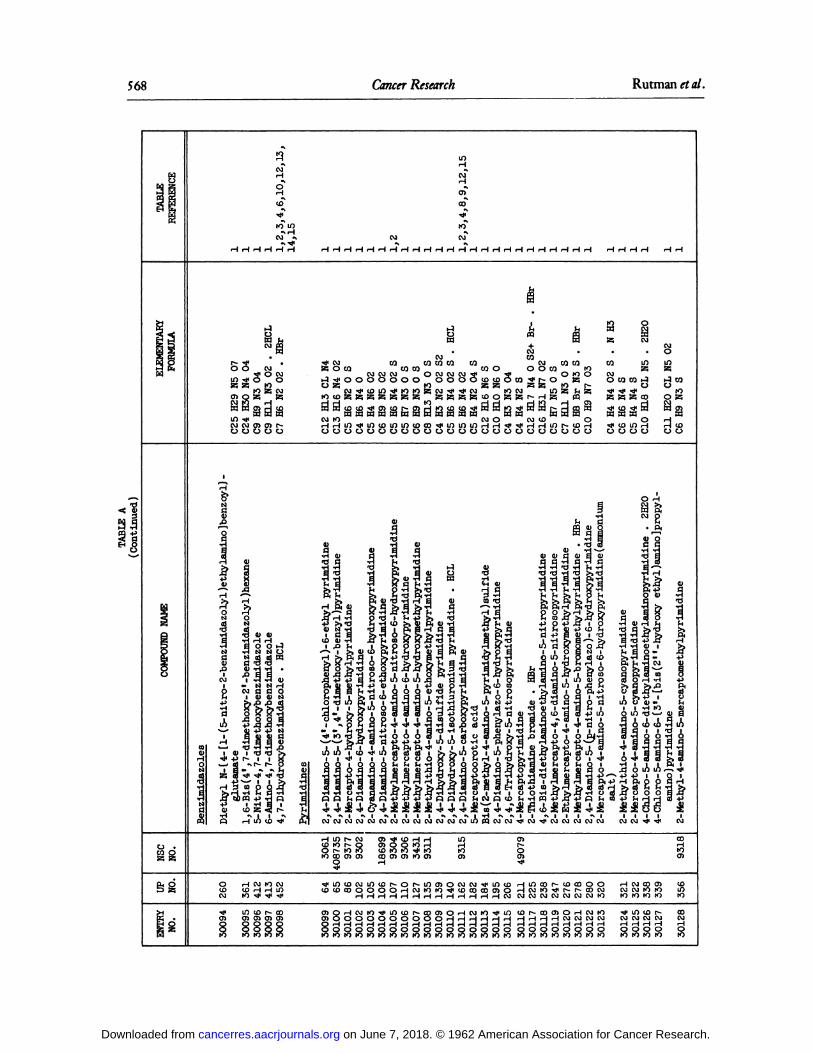
It is our purpose to report the results obtained in the standardization of thisprocedure, as well as the routine screening data obtained on the compounds listed inTable A. Table A lists the entry number, the University of Pennsylvania number and thetables in which the results appear.
MATERIALSAND METHODS
Animal Hosts: Male or female,^/ C3HxDBA/2 or DBA/2xC3H hosts, have been usedinterchangeably in the routine screening. Animals weighing 18 to 22 gr. are used, thevariation in weight in any given experimental or control group being confined to 2-3gr. The animals are housed in metal-topped plastic cages, given water and food§/ ad liband bedded on white pine shavings containing a small amount of an adsorbente/. Incominganimals are segregated for one week prior to use.
Frozen Tumor Bank: Following the design of Hauschka, et al. (4), the tumorslisted in Table B are maintained in a dry ice-alcohol bath at -75° to -78°C. Theprocedure for establishing the bank of frozen tumors is as follows: upon receipt of
* This work was supported by research grant CY-2189 from the National Cancer Institute,National Institutes of Health.
t Technicalassistants.\J Our appreciationis expressedto Dr. T. Hauschka,who recommendedthis host as
capableof supportinga very wide selectionof murineneoplasms.2J Animalshavebeen obtainedfromthe JacksonMemorialLaboratory,whoseassistance
is gratefullyacknowledged._3/ Usingthisprocedureit hasbeenpossibleto screenat the rateof 150 experimental
groupsper month (10mice/group)in a total facilitycomprising350 ft.2of floorspace. (Despitethe unavoidablecrowding,no epidemicshave been experienced.)
4/ In moreprecisestudiesof thealkylatingagents,to be reportedseparately,certainmale-femaledifferenceshavebeenobserved.
5/ Mousebreederchow,PurinaMillsor Purinacheckers.&/ Sterolite,Mineraland ChemicalCorporation,when used. (Thiswas laterdiscon
tinuedin favorof air purificationsystems.)
559
on June 7, 2018. © 1962 American Association for Cancer Research. cancerres.aacrjournals.org Downloaded from

560 CancerResearch Rutman etal.
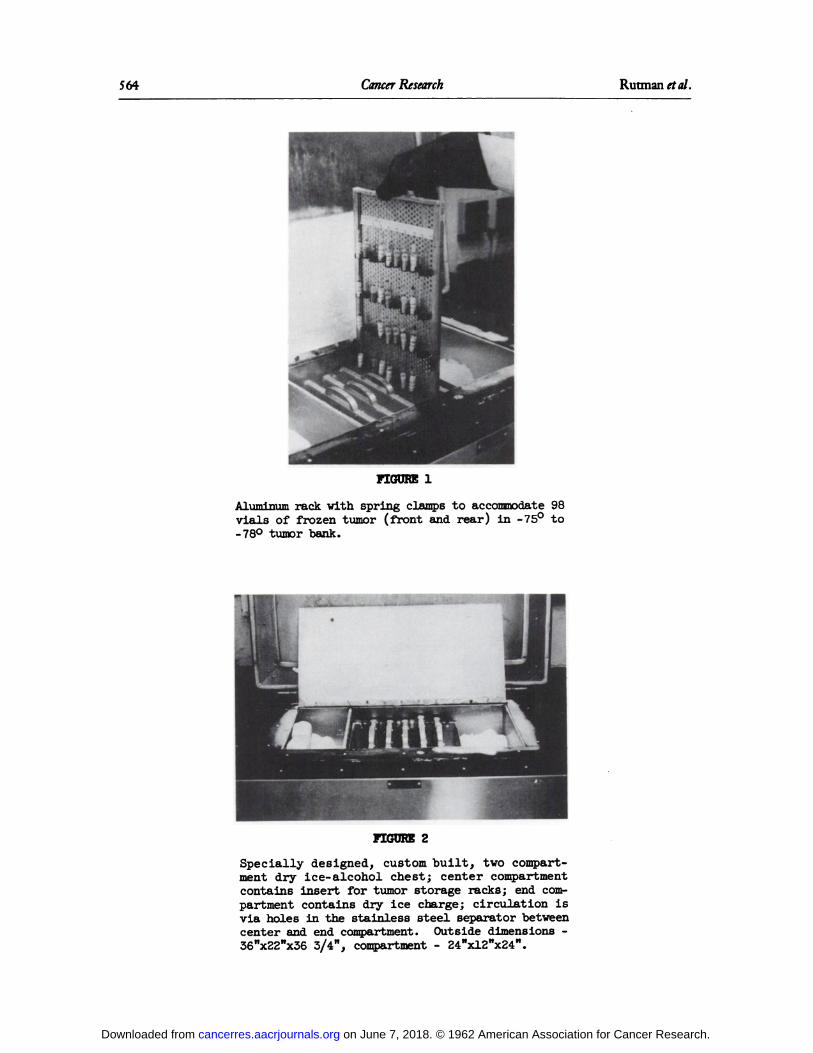
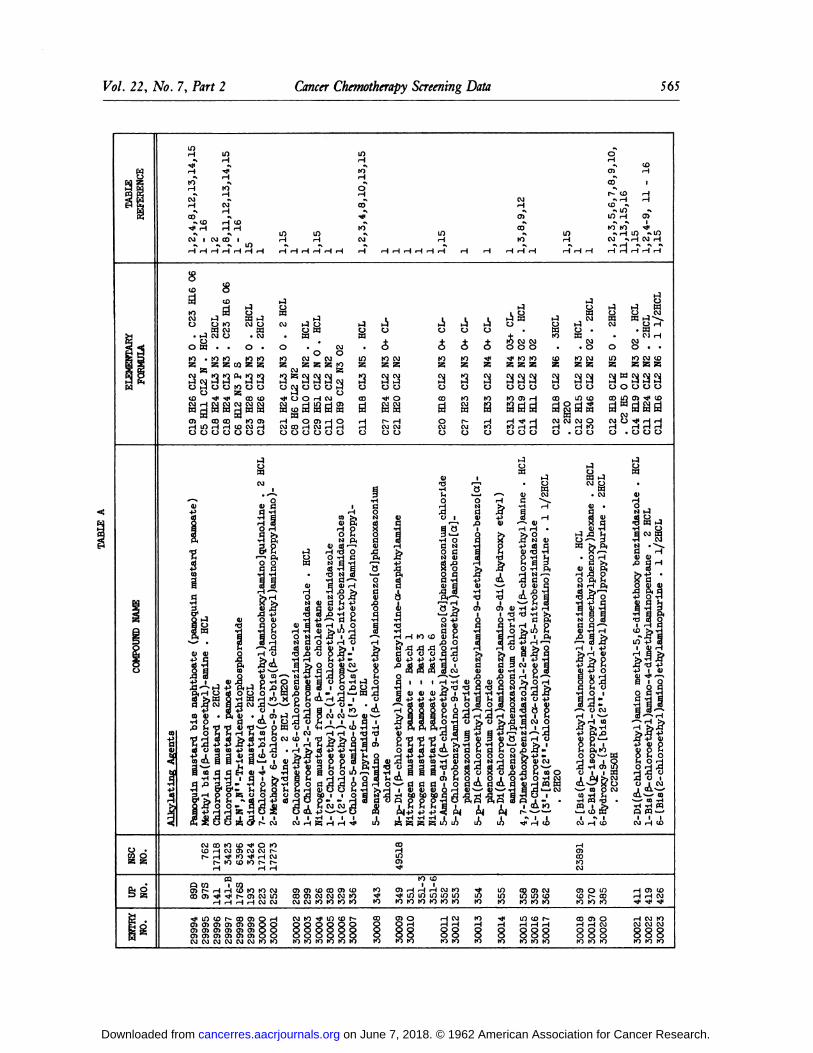
tumorbearingmicethe ascitestumorsare removed,pooledand transferredto the hybridhost. A secondtransferis then made to note the growth characteristicsin the newhost and to secure specimensfor storageand for establishingthe relationbetweeninoculumsize and mean survivaltime (MST). One to 1-1/2 ml. of undilutedascitesfluidis transferredto Wheatonvialscontaining0.1 ml. glycerol(reagentgrade)andsealedwith cautionas to overheating.The sealedvials are quicklyfrozenin a dryice-alcoholbath, placedin identifiedspringclipson a speciallydesignedaluminumrack (Fig.l) and insertedintoa custombuilt stainlesssteel-compartmenteddry icechest (Fig.2). The chestshownin the photographaccomodatesfive racks, each oneof which can hold 98 vials. Irrespectiveof the extentof the use of a giventumor,transfersto stock mice are made at approximatelysix month intervalsto checkthestabilityof the frozentumorsand to restockthe bank.
TestProcedure:To preparefor screeningwitha giventumor,the frozensampleis rapidlythawedina 37°waterbath,dilutedsuitablywith0.15MNaCl, and transferredto two to four host animals. The ascites fluid is harvestedand transferredto asufficientnumberof secondpassageanimalsto securethe amountof tumorneededforthe experiment. It has been our experiencethat a moderateamountof variabilityincontrolMST valuesis observedfollowingthe firstpassagefromthe frozenstate,butthis is eliminatedfollowinga secondtransfer. In each test,ten to twentyanimalsare includedas controls,each experimentalgroup (i.e.,givendrug at givendosage)comprisingten animals. Animalsare givena standardinoculumof 10? ascitescellsina volumeof 0.2-0.5ml. of dilutedascitesfluid,drugadministrationis begun 24 hourslaterand is continuedfor five days. The animalsare kept under observationfor 90days,which is, for allbut threeof the tumors,7x or >7x the controlsurvivaltime.
DrugAdministration:All agentsare administeredafter solutionor suspension(andneutralization,if necessary)in 0.5ml. of 0.9percentNaCl. (Routineincorporation of antibioticswas testedand foundto be unnecessary.)
The preparationof uniformsuspensionsof insolubledrugshas provena difficultproblem. In our experience,vehiclessuchas glycerol,gums,and cellosolves,have allproducedvariablebut significantchangesin controlMST values. Therefore,preparationof insolublecompoundshasbeen confinedto vigorousmechanicalhomogenizing(tefloninglass)in isotonicsaline. With the exceptionof waxymaterials(e.g.,compounds450and 451 whichare sterolderivatives)thisprocedurehas provensatisfactory.
RESULTS
The first point of concern in the development of the test procedure was thestability of the various tumors after transfer through the hybrid host and aftervariable periods of storage at -75° to -78°C. Table C summarizes our experience overthe past four years (1957-61) in this connection and shows that thirteen of the sixteentumors in use yield reproducible MST values following periods of up to 18 months storagein the frozen state. Three of the tumors (the Ehrlich, P388 and 70429) appear to showchanges in virulence. In the case of the Ehrlich this change, which has occurredrepeatedly, results in conversion to a highly hemorrhagic ascites, from which we areunable to recover a stable non-hemorrhagic line. In such cases, a fresh specimen ofthe tumor has been substituted for old stock.
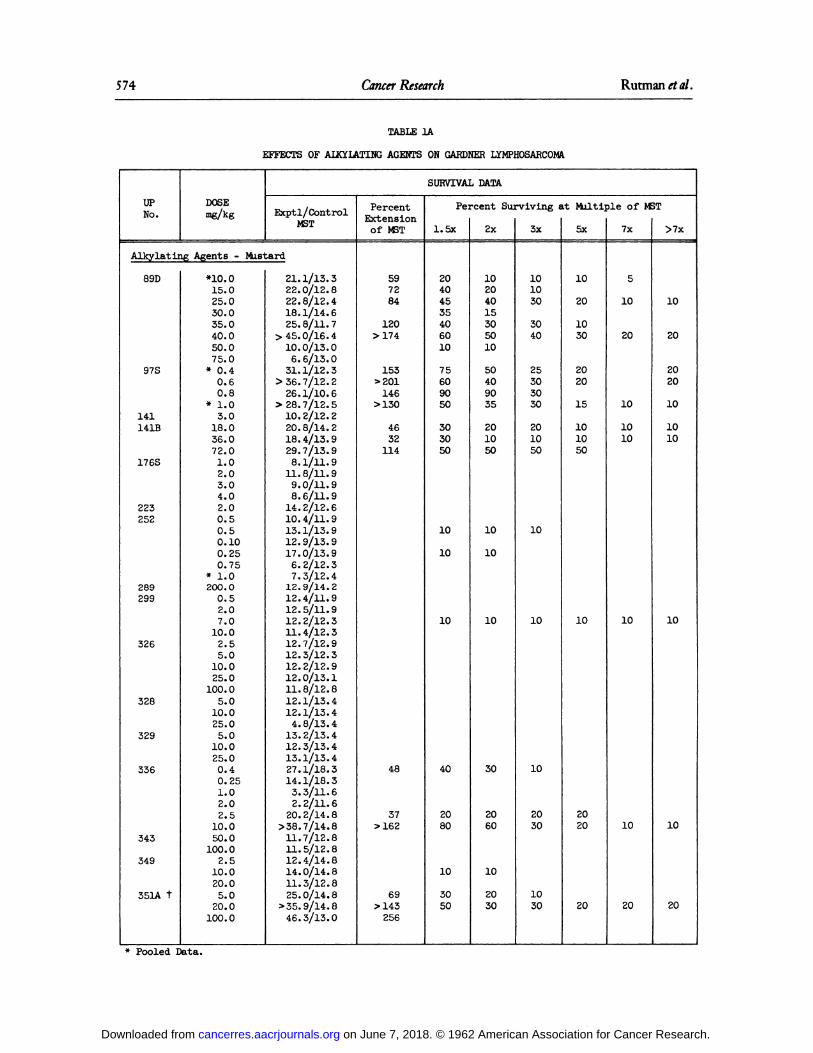
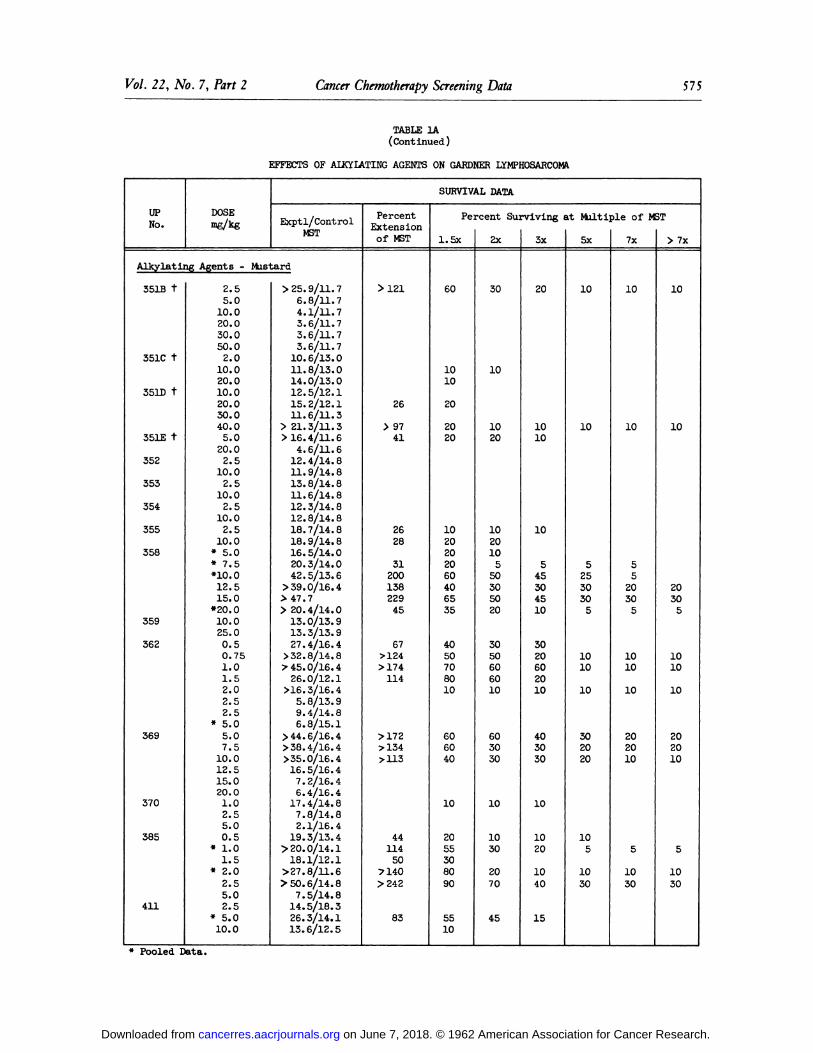
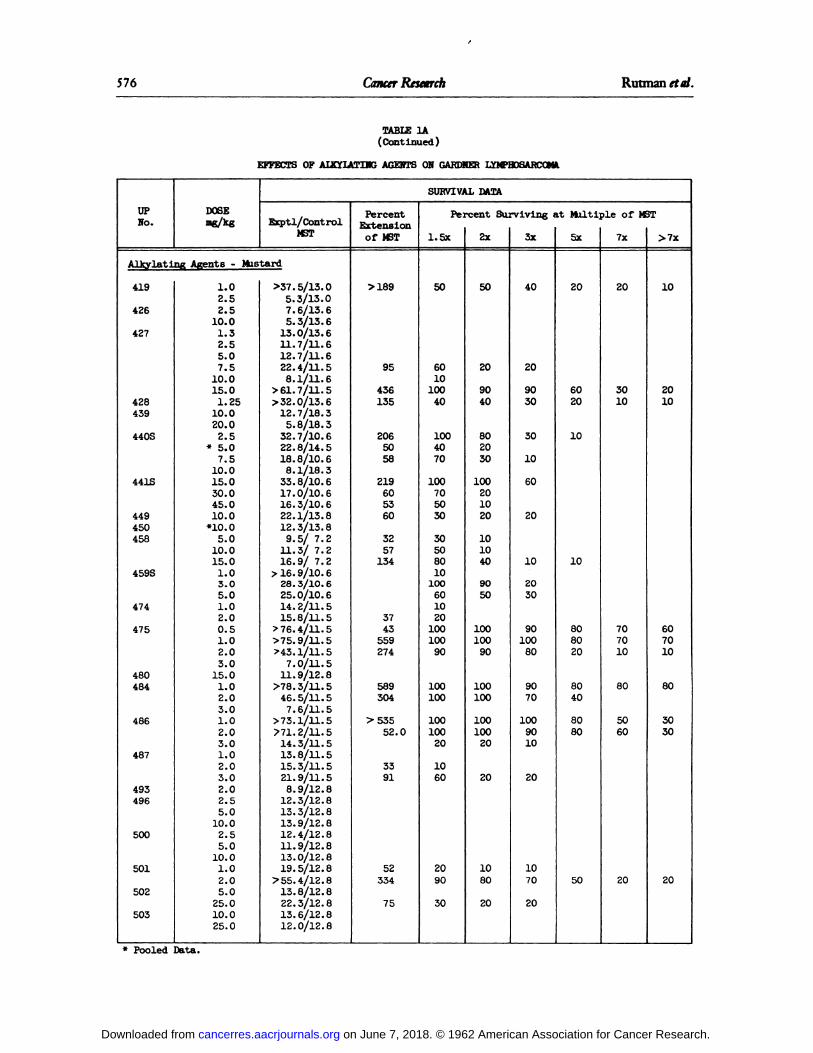
Tables 1 .through 16 present the raw data obtained with the various test andstandard compounds which have been screened through one or more of the ascites tumors.The results are classified by tumor. In the case of the Gardner lymphosarcoma, A#2Ljymphoma, the CM1Madenocarcinoma and the Ehrlich carcinoma (Tables 1,12,13,14 respectively), the tables are divided into sections, the A section covering alkylating agentsand using a "multiple of control survival" scale for the expression of cumulativeresults are expressed on a "cumulative mortality scale", as is also the case for alldata in Tables 2-11, 15 and 16. The separation into A and B sections was adopted forthe four alkylating-agent sensitive tumors (Tables 1,12,13,14) because data on longsurvivors is of particular importance in evaluating the relative performance of newalkylating agents.
on June 7, 2018. © 1962 American Association for Cancer Research. cancerres.aacrjournals.org Downloaded from

Vol. 22, No. 7, Part 2 CancerChemotherapyScreening Data 561
For all compoundsreportedin Tables1-16, inclusive,the standardregimenoffivedaysof intraperitonealtreatmentcommencingon the firstday aftertumor inoculation has been employed. Similarly,a uniform intraperitonealinoculumof 10? tumorcellshas been used in each test. The tabulateddata show the mean survivaltimes(MET)for the experimentaland controlanimalsfor each individualexperimentwhichare the basis for calculationof the percentExtensionof the MST. In addition,dataon cumulativemortalityor survivalare given for each test.
.Eachof the tumorsused has also been testedagainstnine establishedchemo-therapeuticagents (3) shown in Table D, which were selectedto covera rangeofalkylatingagentsand antimetabolitesof interestto the investigators.These resultsare also includedin Tables 1-16, but since they are intendedto providestandardswith whichnew agentsmightbe compared,they havebeen subjectedto furtheranalysisin TablesE to G. This analysisis based on two measuresof effectiveness,namely,the RankIndex(R.I.)and the PerformanceIndex(P.I.). The firstis simplythe numericalorderof effectivenessof the agenton a giventumor;the secondis the relativeeffectivenessof the agentas comparedto the most effectiveagenton the particulartumor,and is calculatedby the relation.
p ... MaximumPercentExtensionMST (TestCompound)MaximumPercentExtensionMST (StandardCompound)
If a test compoundresultsin no significantincreasein the MST, i.e.,the MST-MSTControlx 100/MSTControl= <25%, then the P.I. is recordedas "0".
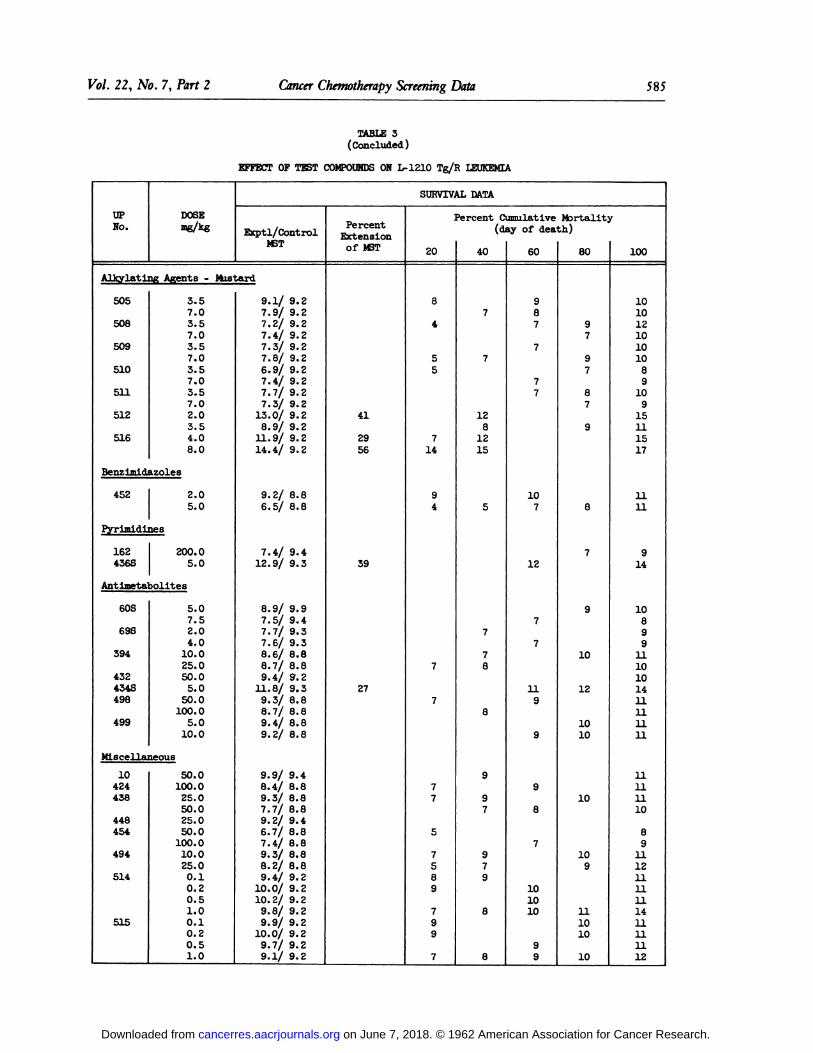
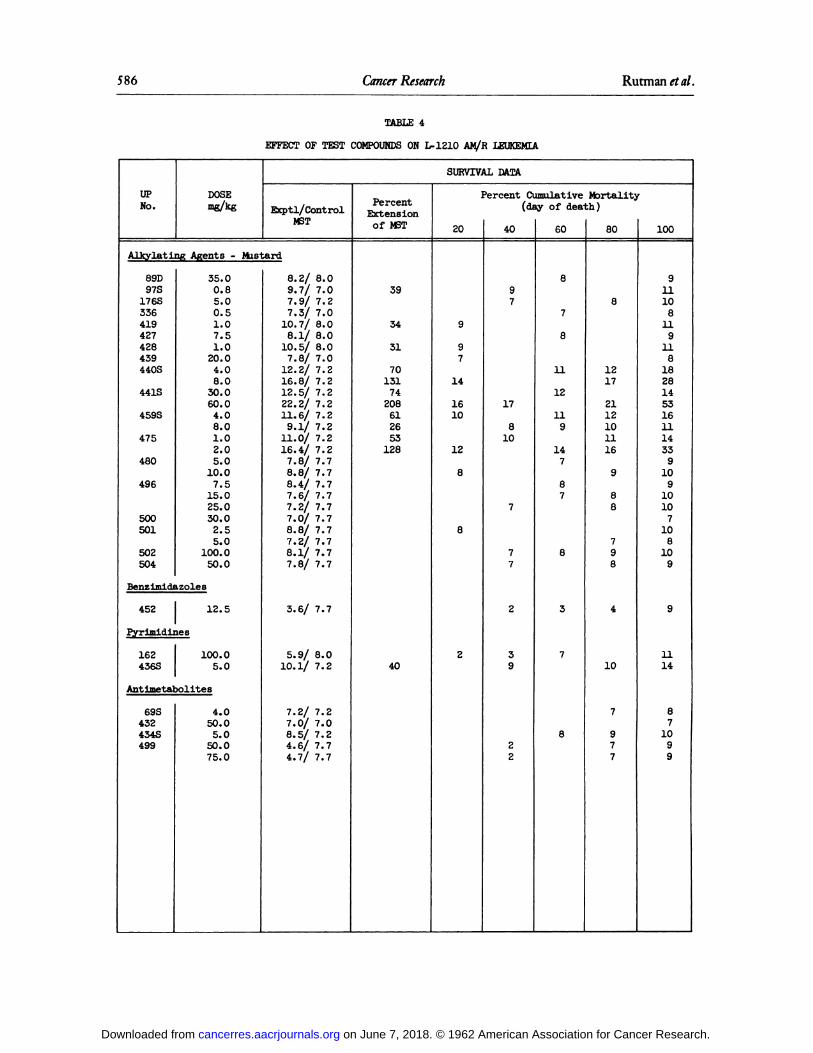
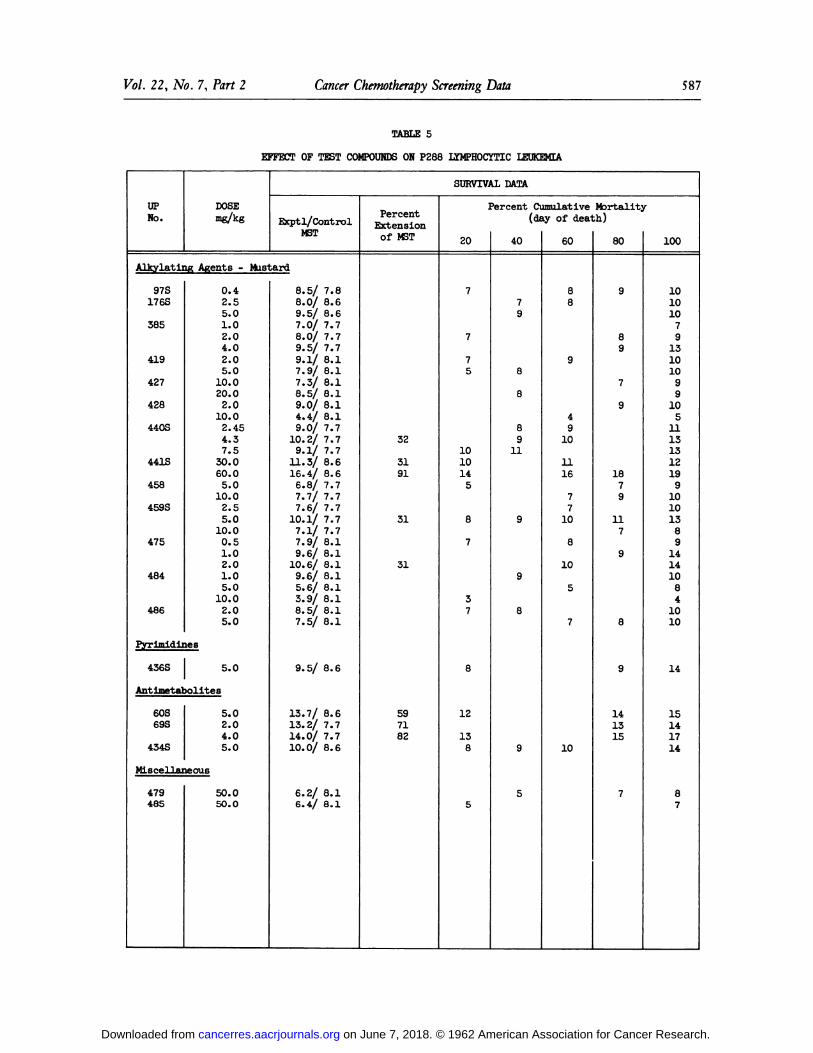
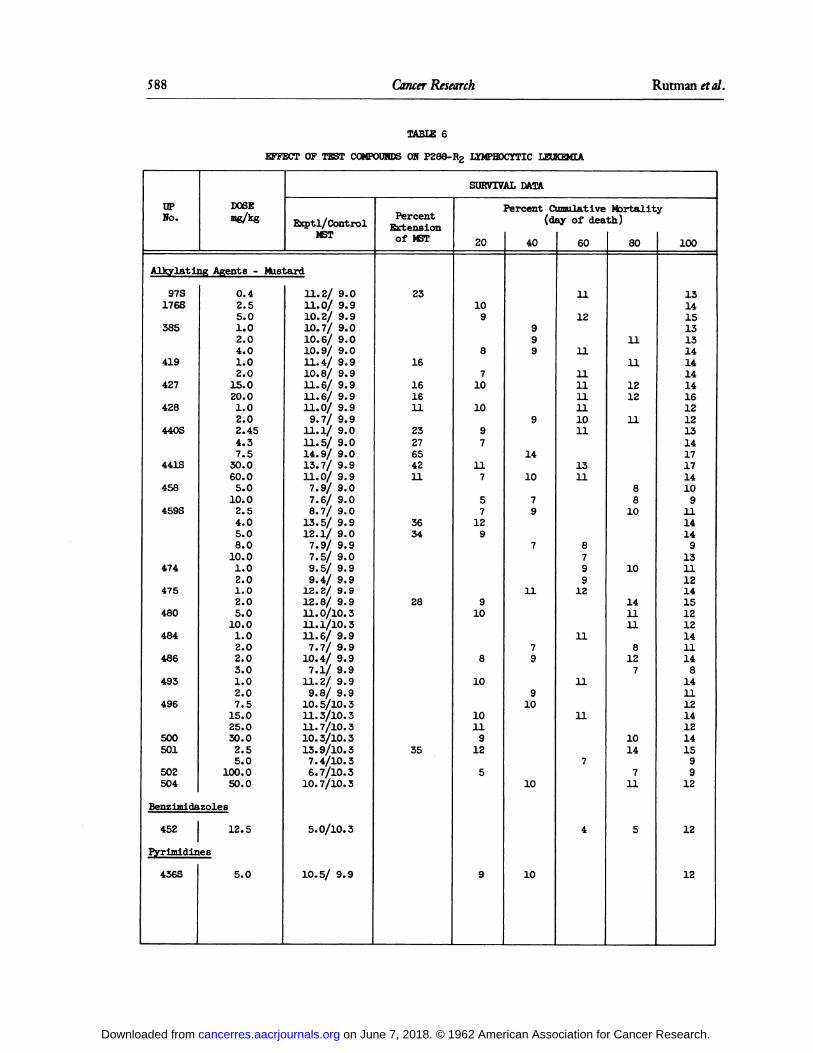
TableE summarizesour standardizationresultsfor severalmurinelymphocyticleukemias. It can be seenthat althoughamethopterinis the most effectiveagentonL-1210andP288,it isnot as effectiveon P388,a tetraploidline. Strikingcollateralincreasesin sensitivitytowards alkylating agents are noted in the L-1210anti-metaboliteresistantlines(L-ISIO^/R,L-1210TG/R),the sameresultbeingpresentbutlesspronouncedwith P288 R/2 (Amethopterinresistant).
The tumorscoveredin TableF are not onlyresistantto alkylatingagents,but,with the exceptionof 70429azaserineresistant(AZ/R),are refractoryto almostallof the agents. In particular,Hep 134 is not affectedby any standardagentexceptHN2 and this resultis only obtainedwith a considerabledegreeof variability. Inthe caseof 70429thedevelopmentof azaserineresistanceis accompaniedby a collateralchangein sensitivityto amethopterinand L-phenylalaninemustard.
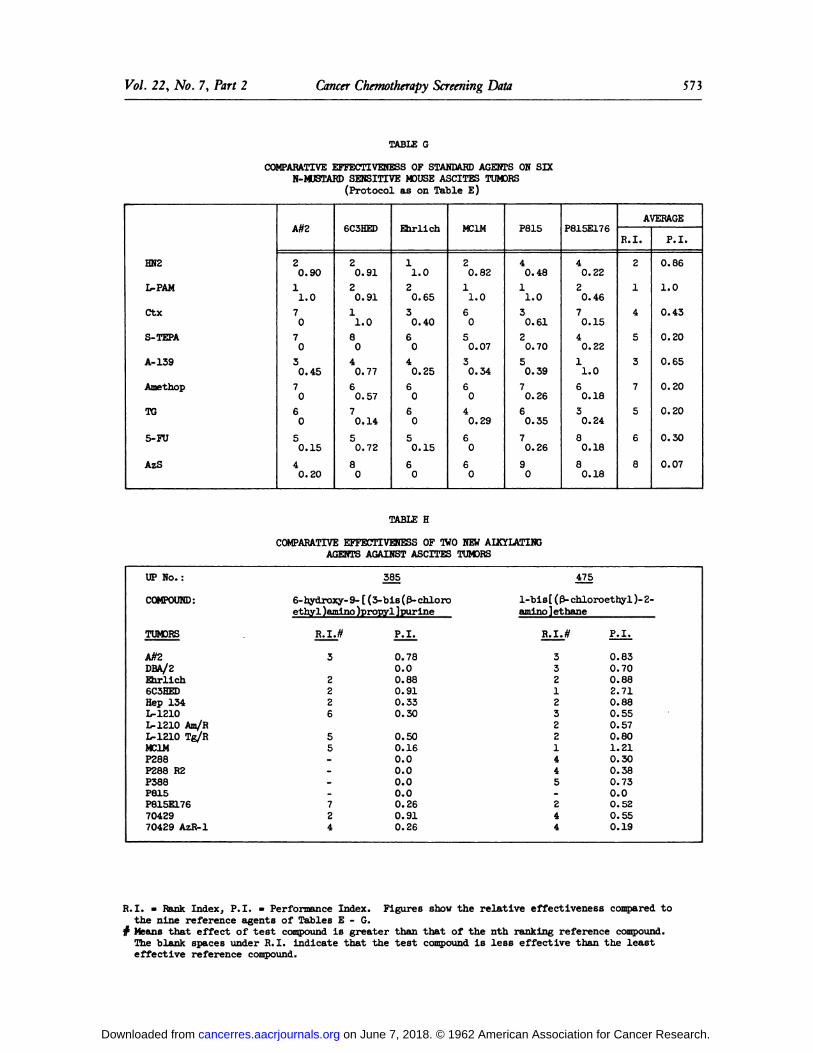
The comparativeresponsesof sixtumorswhichare sensitiveto alkylatingagentsare shownin TableG. Of particularinterestin theseresultsis the markedsensitivityof lymphomaA#2 to six out of nine of the agents, in contrastto its resistancetocytoxan.Forthealkylatingagentsensitivetumorsas a group,sensitivityto HN2 seemsto be accompaniedby sensitivityto L-PAMand to BayerA-139,but not necessarilytoS-TEPAor cytoxan.Althoughsignificanteffectsare seenwith certainantimetabolites(5-FU,AzS on A#2, TG on MC1M and 815E176),the effectivenessis inferiorto that ofthe alkylatingagents. P815E176,selectedfor resistanceto 5-FU,showsa strikingincreasein sensitivityto A-139.
DISCUSSION
In this report,we have describedthe standardizationof a routinescreeningprocedurebasedon a largevarietyof ascitestumors,yet compatiblewith sharplimitationson the spaceand the resourcesavailablefor screening. The problemhas beenresolvedby usinga singlehostcompatiblewithall of the tumors,and by satisfactorilyestablishingthe reliabilityand reproducibilityof the procedurefor freezingandmaintainingtumors at -75 to -78°C(4).
Nine standardchemotherapeuticagentshavebeenarbitrarilyselectedas a basisfor the comparativeevaluationof new agents. Each tumor has been ratedas to its
on June 7, 2018. © 1962 American Association for Cancer Research. cancerres.aacrjournals.org Downloaded from

562 CancerResearch Rutman rÃa/.
response to each one of the agents. Thus, the performance of a new agent can becompared with an overall profile of standard performance for a given tumor in order toassess its relative merit. With the development of the tumor bank, a routine procedureof screening new compounds against the Gardner or the A#2 (representing alkylating agentsensitive tumors), against Leukemia L-1210 and against Hep 134 or DBA/2 (representingthe highly refractory tumors of Table F) has gradually been adopted. In the case ofalkylating agents, a positive result is recorded if the resistant screens show asignificant effect (i.e. >25 percent increase over control M3T) or the sensitive screenshows a 100 percent increase over control survival. In the case of all other types ofagents, a significant result in any one of the three screens is considered a positiveresult. In general, a positive result is the basis for further screening and thisusually involves testing against the remaining tumors in each of the three groups.However, in the case of alkylating agents, a 100 percent increase in MST for A#2 orGardner is not an unusual result, so that for this group of agents, further testingis confined to the alkylating agent sensitive group unless unusual activity or chemo-therapeutic index is observed. In this connection, our accumulated data suggest thatthe A#2 lymphoma would be quite suitable for the quantitative determination of chemo-therapeutic indices.
Although the standardization program is empirical in nature, and not primarilyaimed at a systematic study of the tumors or agents, certain observations in thisdirection may be of significance. Referring to the data on the leukemias, Table E,it is noteworthy that amethopterin, while preserving its leading role against theoriginal lines of lymphocytic leukemias (L-1210 and P288), does not emerge as the mosteffective against leukemias as a class. Instead, cytoxan and L-phenylalanine mustard,by virtue of their effectiveness against the collateral sensitivity of the anti-metabolite resistant tumor lines, become the two most effective agents. An attempthas been made to exploit this collateral sensitivity to alkylating agents by followinga standard course of amethopterin treatment of L-1210 with single or multiple doses ofL-phenylalanine mustard. The combined therapy failed to show any advantage. This mayrelate to the recent report of Skipper, et al. (S) that the spread of ascites formleukemic cells to the cranial region has rendered the tumor refractory to furthertreatment. Again, in keeping with this same report (5), we have noted the loss ofeffectiveness against L-1210 if treatment with amethopterin or cytoxan is delayed tothe 5th day after inoculation of the tumor.
Of further interest is the pattern of results obtained with the alkylating agentson the L-1210 or P288 antimetabolite resistant lines. In the case of all three of thetumors employed, acquisition of sensitivity to one of the alkylating agents seems to beaccompanied by increased sensitivity to the rest of the agents; to be precise, four outof five of the agents are effective against each of the antimetabolite resistant tumors.We have shown separately that L-1210 TG/R cells are ten to fifty times more sensitiveto in vitro exposure to HN2 than are L-1210 cells. Taken in conjunction with thein vivo data, these results tend to support Schmidt's contention (6) that all alkylating
agents act by a common mechanism. It is not clear, however, whether the precisepatterns of collateral sensitivity for each of the tumors reflect the complexities ofthe host-tumor relation, variations in the uptake of specific agents by the cells ordifferences in the chemical details of alkylation (7,8,9).
Considering the screening procedure as a whole, it is clear that the choice ofthe ascites tumor form has biased the screen in favor of the alkylating agents. Thesummary results (Tables E,F,G) show that only amethopterin has effectiveness comparableto any of the alkylating agents, being approximately as effective as A-139 and much moreeffective than S-TEPA. It is likely that if a duplicate screen had been performed usingsolid versions of the same tumors, the bias towards alkylating agents would have beenreduced. Since, however, our major interest has been in the development of improvedalkylating agents, this has not appeared as a disadvantage. Furthermore, inclusion oftumors which are highly refractory to alkylating agents reduces the weight given toeffectiveness on sensitive tumors, if not accompanied by significant effects on theresistant ones.
on June 7, 2018. © 1962 American Association for Cancer Research. cancerres.aacrjournals.org Downloaded from

Vol. 22, No. 7, Part 2 CancerChemotherapyScreeningData 563
The use of this procedure in evaluation of new agents is illustrated by thesummary data of Table H. Two alkylating agents (UP#385-hypoxanthine mustard andUP#475 - an aminoalkyl nitrogen mustard) appeared quite active and were therefore carefully screened through all sixteen tumors. Prom this screening it became obvious thatUP#385 maintained its high effectiveness only for the alkylating agent sensitive tumors.On the other hand, UP#475, which had previously been prepared by Creech (l), and wasindependently synthesized by us as part of a study of amino alkyl substitution,/ provedto be a highly active compound, more effective in some cases than the reference compounds. On the basis of the overall performance of UP#475, it would be rated to be asactive as any one of the reference compounds.
REFERENCES
1. Creech, H. J.; Brenninger, E.; Hankwitz, R. E., Jr.; Polsky, G. and Wilson, M. L.Quantitative Studies of the Effect of Nitrogen Mustard Analogs and Other AlkylatingAgents on Ascites Tumors in Mice. Can. Res., 20, Pt 2, 471, 1960.
2. Schmidt, L. H. Personal communication.
3. Gellhorn, A. and Hirschberg, E. Investigation of Diverse Systems for Cancer Chemotherapy Screening. Can. Res., Suppl. 3, 1, 1955.
4. Hauschka, S. ; Mitchell, J. T. and Wiederpruem, R. J. A Reliable Frozen Tissue Bank:Viability and Stability of 82 Neoplastia and Normal Cell Types after ProlongedStorage at -78OC. Can. Res., 19, 643, 1959.
5. Skipper, H. E. ; Schabel, F. M., Jr. ; Trader, M. W. and Thomson, J. R. ExperimentalEvaluation of Potential Anticancer Agents. VI. Anatomical Distribution of LeukemicCells and Failure of Chemotherapy. Can. Res., 21, 1154, 1961.
6. Schmidt, L. H. In Press, Cancer Chemotherapy Reports.
7. Strauss, B. S. Specificity of Mutagenic Effects of Alkylating Agents, Nature 191,730, 1961.
8. Fahmy, 0. G. and Fahmy, M. J. Cytogenetic Analysis of Carcinogens and Tumor Inhibitors in D. melanogoster XI. Gen., 46, 1111, 1961.
9. Alexander, P. and Mikulski, B. Effects of Radiomimetic Alkylating Agents onLjrmphoma Cells In Tissue Culture. Biochem. Pharmacol. 8, 51, 1961.
2/ Unpublished results - Rutman, R. J.; Lewis, F. S. ; Price, C. C.
on June 7, 2018. © 1962 American Association for Cancer Research. cancerres.aacrjournals.org Downloaded from
564 CancerResearch Rutmanrta/.
FIGURE1
Aluminum rack with spring clamps to accommodate 98vials of frozen tumor (front and rear) in -75°to
-78°tumor bank.
FIGURE 2
Specially designed, custom built, two compartment dry ice-alcohol chest; center compartmentcontains insert for tumor storage racks; end compartment contains dry ice charge; circulation isvia holes in the stainless steel separator betweencenter and end compartment. Outside dimensions -36"x22"x36 3/4", compartment - 24"xl2"x24".
on June 7, 2018. © 1962 American Association for Cancer Research. cancerres.aacrjournals.org Downloaded from
on June 7, 2018. © 1962 American Association for Cancer Research. cancerres.aacrjournals.org Downloaded from

566 CancerResearch Rutman et al.
to -M-r1
00 -H O in
toto - to to in o inHH tOHHHHH
oo i i to to to in iHHHHHH HH
to —o - H o in in ' in HH en H H H i H -
l - - - -O
-to LO -H H -H -
-tO - - - - -0000 -00 -tOHtOtOintOtOHHtOH-*
inco I
oH
«T
inH
IO
i«O H to
oo -in in in m mH 00 H H H H H
- -- to H - - - - ••* «J<to IO H -^ -* -sf ^< •*
- --H -OHHHHHtomtom - co H -----
--rH --- -- -H--O--OOOOOOOOOOl 10000 -lOOOOtOitOOO 00 -00 lOH-^tOHHHHH
- -to - - - - -in --^ ----------HHHHHHHHOOHOOHHHHrHHHHHtOtOlOtOtO
inH^iH
K?
00 00 00
H i-Tr-T
S
OHO
O O •w a00 00 00
o" IO
ge«338O O
CO O OJäsäco
co en Hooo
Su j-5 1-5 1-5
Säg
O OJo
cooodSM«aSo1 £
oooBB B
333000
I[^ (O tO
'Saw
to to u)co co coo u o
»4
eoBg
M 00O B
to ooS 00
»
to to00 Ho o
i IJ! O
J W MO 00 00
A • •^gtOB1
00 CO.>4 oo ooo 1-5to 1-5O 1-5 O
to o00 ^ tOwd«doH to to r-o o o o
.s s
,333333l Ü O O U O O(
t*- O CO CO ^ COi CO tO tO CO IO COi mmn mmn
co to ^ o ißcoS i-H CO CO H CO H
O U O O U O
3CJ
N
o
ijg
oIO i
0°
inet*
Saco co e
ij I-} t^J
OOO
co co co
i inl r- H' O O
o olI to r^i H .H
lëê-B1
¡oddI
H IO i
ofi ooo
00 00ooa B
N33QO OO
OOOOOÃœOÃœO
•o< o
a oCM
t-5 00
a .I
o c t. 3 a DEl y Pi iD v A il•He PH aB HT»*;»9—-eu
IO I I I •I O H HO tà >> ,»>
.o o 3 o -pt* f~i*~* S~t V
»OOHOO
_ jo-acp-pHwoHMPQ*HQraV St(j o o o JH g o Jav
ApQ^M tJro Odi*OÃœCJOCSHCUHB.
-<I>OII<UIAo ^ cu.cu. o ai u^Ol IÕHI1OH-HTHO-HCU.
^M-H-HtHH-Hp<'HCQPQP^>>pq
l i l l B! J-»O O -I tO CO 00 B
IMU>EH
oaj.H —'p4ui ^
l •*"—' —' t -^-^—^wcytooa-Ltoto—'•—' -H -H —' -H -H
co a pQ fp w PQ pq
thy
oio
AI
•H•d
nM
—H
i i o 3 !>,>>>,„ . . .. „ C^~ H CJ |Nf if if
>>HJ3Hfe>l I —-OOÓC^CUCU¿f>>-p j3 x! oo•*i ^-"—•eu p o-P ¿f Cu CJ -p B •* I I I ti rHeu-p o i v i i B-* •*to o o2 <U in ea O-* H i B B -H H
-HO~-',HB!>>H l I0o33OTÕHtoo i p^^,-!,-!.— o CJ
3 tooFCt3 fe^-S^g^H000^-ei. i N ¿JaLö ¿l¿l¿l«-' -H -HV^LO^'--/--' i i i i i •*ce>m
Bi
tO HO t-00 00co to s
CQOl^i*¿Or-
HCOtO^m COOìOHi
lOUOlOlOu) l-OLOlOlOi
Ë .ö̂TÕ«in to r-cooor-tooNNCM OOWCOK>tOK)8OO O O O O O O
oo ooorOtOrO
O Oo orO (Ot
COtO
OTOHNK>^ Hooto^intotoin) tO r^ 00
ooooo ooooooooooooo ooooooootOtOtOIOtO tOtOtOtOfOtOtOrO
on June 7, 2018. © 1962 American Association for Cancer Research. cancerres.aacrjournals.org Downloaded from
Vol. 22, No. 7, Part 2 CancerChemotherapyScreening Data 567
ES'
co co co co., ., - - io ioH^HHCOPOHrH IHHHHHrHHHH
-KiKiao•ää.s
ooo o o o i-) i-l 1-3O O O iJ
(O O 00 * O
PO•*•*inrHÃ-IHrH'*<DCnt~ooooooou
O
ino
JÄWÄOO
m o o usPOPOco coooo o
i-I 00
Q gsu
CI
gr- ÖlH lOOà O
co io to r-i tu co L/Ì r-
oÃco m mco 10 CD HPO io o
Ol
soom
rHlOr-tOr-CDOiOCOO COOCOtO^CDin^ÛCOtOCÛtO^ co io TÕ« o>.. r- H rH mrH H H rH CO CO CO
80 o o o o o oo o o o o o o
tOKirotototo^to
C-COC7)OrHCOtO^L/)U3 r*-COOii
§OOOOOOOOO OOO'OOOOOOOOO OOO1tOtO^OK5tOrO(O(OtO tOtOtOi
§O O O O 'O O O O (_
i to to to (O to (O i
on June 7, 2018. © 1962 American Association for Cancer Research. cancerres.aacrjournals.org Downloaded from
568 Cmcer Research Rutman et al.
3IO
PO •>
H H H H .-ÕH
CM
l r-Tr-l H .
en•*co•iH?
•.M
I rÌH H ( i-I ¡H H H H
o o W•*O 00(fi ^f O Oa a to
oo oo en en r^CJ CJ O O CJ
•*00a O CO,
^•*oooo a
NCO CO W W
CO CO00 00 00 00000
oootOcoBBBSBBB1
CO O... ii evi 4 *OOOOiQUJOCO:*
CO CO COo o co ioo to o
.i. i—° Ba a to t^in a ti a[^ H a M
SB
00O CO CO 1-5
a B a co
g
00 IO
O O Ü O U OintOtOOCJO OOOOO
«rH-^^f-IOOOO o o o o o
l V 01l H rH
O O 1-5l N S O
a os w3 'O ^3
DHoa
!NC
- Õ5ST3A lili^^ -O fl -fl ^1
I V I -O Ti >>-* +J r~ i i!?.—-id -.t^ r- o
3 n OH. -H i-»^ älPQ-P -
•H •*l L •»p H in U3•* 00 00 00 00 00
H in r- ooto to f~-oO 1^ IO tOto co en oÃ
oCO (T) O> tO CTl
LO
en
sg H CNÎtO COtO rH ^ LO(O ^f T* TÕ
^t LO tu r-- coCT) O> O) O> C3Õ
H CO CO Oï (OCO CO CO (O tOto to to to (O
^ LOtu r-CM (M CO COr-t rH rH M
on June 7, 2018. © 1962 American Association for Cancer Research. cancerres.aacrjournals.org Downloaded from

Fo/. 22, A/o. 7, Pari 2 CancerChemotherapyScreening Data 569
"dCM «
IO
-i(O
•»N -vH •<*
N U) -* •* O,_)•<* H (OtOLOrH
•v ••« O •»̂ rH «\<T>H PO N -*N
IO LO
IO" IO I m H N N i N IO (O CM N
I H N'N'H ce?r-T<-TH"H H~H N~N H i-l
ss
•%CO
K?
HrHHiHiHHrHHHrHMrH
OWa
8
CMCOH«
~^
CV1CVJCQcQtooo
-^OCVJmo totooB rossa,tos iJr-ÃŒB HtOO
Sr-lr-COH OrHOr-irHr-l<i)r-lintûHHi
OUOOUOOOUOCJ
M Mco
++NomcQOO N -^BBKOCOHK5B
rHHtoOOO
J)O
totoS5S5
OJCQOONO oo ioO«P OtOK
eoo cuocvjoo ^(MB B B ÎS.Îr'«B1* cviintoB^o
B OB NS5OBB O)
r-IIOr^HHlûOOOO
tOU>HrOOO
imi Fluo
5- An
^-^ oi o
lOOOOClNlOlOio-^H^^cûr*-r^t^or-to
ro r- ••*H
CDLO
SOO> r-rHr-^*CO-^LOr-- tûr-r-COtû
OO«HrHCOLOLOLOIOIO
OîOLOrHLOOHOJClf-iLOlOtDHiOr-H^ûr-HrHtÛtûr^co
HHi-ICOWNCaWCJ
OtO
rHCJtO-^LOCDr-COiD
rOrOtOtOr
rr
tOfOtOtOtO tO
^tniOlOLOLOLOLOLOlOtOCÛtOrHrHHrHHHHHHrHrHHH
tOtOtOtOK)tOiOK)tOïO(OtO[O
on June 7, 2018. © 1962 American Association for Cancer Research. cancerres.aacrjournals.org Downloaded from

570 CancerResearch Rutmanrta/.
io oo co in •> co'*-*H iHHHlO r-IrHH
00 lOtOIOOOr-l— ÃOIOtOOOIH H rH H oo*oTH"i-Tin"in"oó"cvToo"i-Too
too
¡s 88
rooIOK 00, OJ B(-ÕO
i
S.
IO -A ¡B O •*IH i
o oSI-) 1-3
O O 00 +B 00
coO M
; s ooo
to r- O r~ oo oo cuooco oo oor-Hu)Hr-Hu)coioou u uuuooouuuu
êg
on June 7, 2018. © 1962 American Association for Cancer Research. cancerres.aacrjournals.org Downloaded from

Vol. 22, No. 7, Part 2 CancerChemotherapyScreening Data 571
TABLE B
ASCITES TUMORS USED IN SCREENING PROGRAM
TUMOR TYPE SOURCE
A#2DBA/2Ehrlich
Gardner(6C3HED)Hep 134L-1210L-1210-AM/RL-1210-TG/R
MC1MP288P288-R/2
P388P815P815E1767042970429 AzR-1
LymphomaThymomaCarcinoma
LymphosarcomaParenchyma!CellLymphocyticLeukemia-diploidLymphocyticLeukemia-amethopterinresistantLymphocyticLeukemia-thioguanineresistantMammaryadenocarcinomaLymphocyticLeukemia-diploldLymphocyticLeukemia-amethopterinresistantLymphocyticLeukemia-tetraploidMast CellMast Cell-fluorouracilresistantPlasma CellPlasmaCell-azaserineresistant
RoswellParkRoswellParkInstitutefor CancerResearch,Fox Chase
Universityof PennsylvaniaNationalInstitutesof HealthNationalInstitutesof HealthNationalInstitutesof HealthNationalInstitutesof HealthRoswellParkNationalInstitutesof HealthNationalInstitutesof HealthNationalInstitutesof HealthNationalInstitutesof HealthNationalInstitutesof HealthNationalInstitutesof HealthNationalInstitutesof Health
TABLE C
THE REPRODUCIBILITY OF MEAN SURVIVAL TIMESFOR 16 FROZEIJASCITES TUMORS
(IO7cellsinoculatedintraperitoneallyintoC3D2mice after removalfrom-75°storageaccordingto protocolunder "Methods")
TUMORA#2DBA/2EhrlichGardnerHep
134L-1210L-1210-AM/RL-1210-TG/RMC1MP288P288-R/2P388P815P815E1767042970429
AzR-1NO.
TESTS*6573362250875555355No.MICE1201001407201204405016014010010010010060100100MEAN
SURVIVALTIMES(days)195810.016.110.612.516.37.27.59.616.19.77.89.511.110.830.631.919597.814.512.512.216.07.07.29.515.98.29.411.512.611.330.922.319609.0-14.612.413.47.47.79.114.9_10.312.4-_36.6-19618.214.215.912.4-8.0---_9.5---34.125.4AVERAGE
±<T8.2
±0.8314.3±0.6512.2
±2.912.7±1.8114.7±2.287.3±0.577.4±0.479.3i0.3015.5±1.678.1i0.459.7±0.4212.0±2.5512.1±1.0511.2±0.8333.8±4.8425.4±4.55
* Refersto the numberof separatewithdrawalsfromthe frozentumorbank, exceptin the caseofthe L-1210and the Gardnertumors,each of which involve>12 separatewithdrawals.
on June 7, 2018. © 1962 American Association for Cancer Research. cancerres.aacrjournals.org Downloaded from

572 CancerResearch Rutmanrtfl/.
TABLE D
LIST OF SELECTED REFERENCE COMPOUNDS
UPNO.97440441176456SYMBOLHN2L-PAMCtxS-TEPAA-
139NAMENitrogen
mustardL-phenylalanlnemustardCytoxanThio
tri-ethylenephosphorand.deEthylimino-benzoquinoneUP
NO.6960436434SYMBOLAmethopTO5-
FUAzSNAMEAmethopterin
(Methotrexate)2-Thioguanine5-
FluorouracilAzaserine
TABLEE
COMPARATIVE EFFECTIVENESS OF STANDARD AGENTS ONSIX ASCITES FORM MURINE LYMPHOCYTIC LEUKEMIAS
(Datagivenas: Bank Indexperformnce
see text,page 561.;
HN2L-PAMCtxS-TEPAA-
139AmethopTG5-
FUAzSL-1210Orig.8
04
0.404
0.408
06
0.301**
~1.020.603
0.506
0.30Tg/R1
~1.03
0.552
0.594
0.456
06
06
05
0.366
0Am/R4
0.192
0.651
"1.06
03
0.39606
04
0.496
0P288Orig.6
04
0.302
0.90604
0.301
~1.03
0.606
06
0R/26
01-i.o2
0.604
0.423
0.596
06
06
06
0P3881
1.05
0.691"1.07
03
0.824
0.757
060.447
0ALL
LEUK.»R.I.521743668P.I.0.470.791.00.200.530.600.260.330.07
TABLE F
COMPARATIVE EFFECTIVENESS OF STANDARD AGENTS
ON FOUR RESISTANT ASCITES TUMORS OF MICE(Protocol as in Table E)
HN2L-PAMCtxS-TEPAA-
139AmethopTG5-
FUAzSDBA/25011.030.5050503
0.5020.905050Hep
13411.0202020202
02020207042911.040.6750.557020.90705070.5520.9070429AZ/R30.2911.0.-505020.425040.1650R.I.213644454P.I..841.0.550.34.36.34.27.34
* Average for the 6 leukemias. P.I. normalized by letting highest average value »1.** Underline indicates best performance, i.e., maximum extension MST.
on June 7, 2018. © 1962 American Association for Cancer Research. cancerres.aacrjournals.org Downloaded from
Vol. 22, No. 7, Part 2 CancerChemotherapyScreening Data 573
TABLE G
COMPARATIVE EFFECTIVENESS OF STANDARD AGENTS ON SIXN-MUSTARD SENSITIVE MOUSE ASCITES TUMORS
(Protocol as on Table E)
HN2L-PAMCtxS-TEPAA-
139AmethopTG5-
FUAzSA#220.9011.0707030.45706050.1540.206C3HED20.9120.9111.08040.7760.5770.1450.7280Ehrlich11.020.6530.406040.25606050.1560MC1M20.8211.06050.0730.346040.296060P81540.4811.030.6120.7050.3970.2660.3570.2690P815E17640.2220.4670.1540.2211.060.1830.2480.1880.18AVERAGER.I.214537568P.I.0.861.00.430.200.650.200.200.300.07
TABLE H
COMPARATIVE EFFECTIVENESS OF TWO NEW ALKYLATINGAGENTS AGAINST ASCITES TUMORS
UP No.:COMPOUND:TUMORSA#2
DBA/2Ehrlich6C3HEDHep
134L-1210L-1210 Am/RL-1210 Tg/R
MC1MP288P288
R2P388P815P815E1767042970429
AzR-15856-hydroxy-9-
[(3-bis(ß-chloro
ethyl )amino )propyl]purineR.I.tf322265
5__.„724P.I.0.78
0.00.880.910.33
0.300.50
0.160.00.00.00.00.260.910.26475l-bis[(ß-chloroethyl)-2-
amino]ethaneR.I.»33
212
3221445_244P.I.0.83
0.700.882.710.88
0.550.570.801.210.300.380.730.0O.SZ0.550.19
R.I. »Rank Index,P.I. «PerformanceIndex. Figuresshowthe relativeeffectivenesscomparedtothe nine referenceagentsof TablesE - G.
# Meansthat effectof test compoundis greaterthan that of the nth rankingreferencecompound.The blank spacesunderR.I. indicatethat the test compoundis less effectivethan the leasteffectivereferencecompound.
on June 7, 2018. © 1962 American Association for Cancer Research. cancerres.aacrjournals.org Downloaded from
574 CancerResearch Rutmanrta/.
TABLE 1A
EFFECTS OF ALKYLATING AGENTS ON GARDNER LYMPHOSARCOMA
UPNo.DOSE mg/kgSURVIVAL
DATAExptl/Control
MSTAlkylating
Agents-htistard89D97S141141B17
6S223252289299326328329336343349351A
t*10.015.025.030.035.040.050.075.0*
0.40.60.8*
1.03.018.036.072.01.02.03.04.02.00.50.50.100.250.75«
1.0200.00.52.07.010.02.55.010.025.0100.05.010.025.05.010.025.00.40.251.02.02.510.050.0100.02.510.020.05.020.0100.021.1/13.322.0/12.822.8/12.418.1/14.625.
8/11.7>45. 0/16.410.0/13.06.6/13.031.1/12.3>
36. 7/12.226.1/10.6>
28.7/12.510.2/12.220.8/14.218.4/13.929.7/13.98.
1/11.911.8/11.99.0/11.98.6/11.914.2/12.610.4/11.913.
1/13.912.9/13.917.0/13.96.2/12.37.3/12.412.9/14.212.4/11.912.5/11.912.2/12.311.
4/12.312.7/12.912.3/12.312.2/12.912.0/13.111.8/12.812.1/13.412.1/13.44.8/13.413.2/13.412.3/13.413.1/13.427.1/18.314.1/18.33.
3/11.62.2/11.620.2/14.8>
38. 7/14.811.7/12.811.5/12.812.4/14.814.0/14.811.3/12.825.0/14.8>
35.9/14.846.3/13.0Percent
ExtensionofVB1597284120>174153>201146>13046321144837>16269>143256Pe:l.Sx2040453540601075609050303050101010402080103050•cent
Sui
2x1020401530501050409035201050101010302060102030-vivlng
£
3x10103030402530303020105010101020301030it
Multi]
5x1020103020201510105010202020>le
of M
7x510201010101010203T>7x10202020101010101020
* PooledData.
on June 7, 2018. © 1962 American Association for Cancer Research. cancerres.aacrjournals.org Downloaded from
Vol. 22, No. 7, Part 2 CancerChemotherapyScreening Data 575
TABLE 1A(Continued)
EFFECTS OF ALKYIATING AGENTS ON GARDNER LYMPHOSARCOMA
UP
No.DOSE mg/kgSURVIVAL
DATAExptl/Control
MSTAlkylating
Agents -Mustard351B
t351C
t351D
t351E
t3523533543553583593623693703854112.55.010.020.030.050.02.010.020.010.020.030.040.05.020.02.510.02.510.02.510.02.510.0*
5.0*7.5«10.012.515.0«20.010.025.00.50.751.01.52.02.52.5*
5.05.07.510.012.515.020.01.02.55.00.5*
1.01.5*
2.02.55.02.5*
5.010.0>
25. 9/11.76.8/11.74.1/11.73.6/11.73.6/11.73.6/11.710.
6/13.011.8/13.014.0/13.012.5/12.115.2/12.111.6/11.3>
21.3/11.3>16. 4/11.64.6/11.612.4/14.811.9/14.813.8/14.811.6/14.812.
3/14.812.8/14.818.
7/14.818.9/14.816.5/14.020.3/14.042.5/13.6>
39. 0/16.4>47.7>
20.4/14.013.0/13.913.3/13.927.4/16.4>
32. 8/14.8>45. 0/16.426.0/12.1>16.3/16.45.8/13.99.4/14.86.8/15.1>
44. 6/16.4>38. 4/16.4>35.0/16.416.5/16.47.2/16.46.4/16.417.4/14.87.8/14.82.1/16.419.3/13.4>
20.0/14.118.1/12.1>27.8/11.6>
50. 6/14.87.5/14.814.5/18.326.3/14.113.6/12.5Percent
ExtensionofMST>12126>
97412628312001382294567>124>174114>172>134>11344114507140>24283Pe
1.5x601010202020102020206040653540507080106060401020553080905510rcent
Sui
2x301010201020105503050203050606010603030101030207045-viving3x201010105453045103020602010403030101020104015it
Multi
5x1010525303051010103020201051030pie
of M
7x10105520305101010202010510303T>7x10102030510101020201051030
* Pooled Data.
on June 7, 2018. © 1962 American Association for Cancer Research. cancerres.aacrjournals.org Downloaded from
576 CancerResearch Rutman et al.
TABLE1A(Continued)
EFFECTS OF ALKYLATING AGENTS ON GARDNER LÕMPHOSARCOMA
UPNo.DOSE mg/fcgSURVIVAL
DATAExptl/Control
MSTAlkylating
AgentE -»astard419426427428439440S441S449450458459S4744754804844864874934965005015025031.02.52.510.01.32.55.07.510.015.01.2510.020.02.5*
5.07.510.015.030.045.010.0«10.05.010.015.01.03.05.01.02.00.51.02.03.015.01.02.03.01.02.03.01.02.03.02.02.55.010.02.55.010.01.02.05.025.010.025.0>37.
5/13.05.3/13.07.6/13.65.3/13.613.0/13.611.7/11.612.7/11.622.4/11.58.1/11.6>
61. 7/11.5>32. 0/13.612.7/18.35.8/18.332.7/10.622.8/14.518.8/10.68.1/18.333.8/10.617.0/10.616.3/10.622.1/13.812.3/13.89.5/
7.211.3/7.216.9/7.2>
16. 9/10.628.3/10.625.0/10.614.2/11.515.8/11.5>
76. 4/11.5>75.9/11.5>43.1/11.57.0/11.511.9/12.8>78.3/11.546.5/11.57.6/11.5>
73. 1/11.5>71.2/11.514.3/11.513.8/11.515.3/11.521.9/11.58.9/12.812.3/12.813.3/12.813.9/12.812.4/12.811.9/12.813.0/12.819.5/12.8>55.4/12.813.8/12.822.3/12.813.6/12.812.0/12.8Percent
Extensionof16T>18995436135206505821960536032571343743559274589304>53552.033915233475Pe]l.Sx5060101004010040701007050303050801010060102010010090100100100100201060209030-cent
Su]
2x502090408020301002010201010409050100100901001001001002020108020-viving
i
3x402090303010602010203090100809070100901020107020It
»liti]5x20602010108080208040808050xLeof M
7x203010707010805060205T>7x10201060701080303020
* Pooled Data.
on June 7, 2018. © 1962 American Association for Cancer Research. cancerres.aacrjournals.org Downloaded from

Vol. 22, No. 7, Part 2 CancerChemotherapyScreening Data 577
TABLE 1A(Concluded)
EFFECTS OF ALKYLATING AGENTS ON GARDNER LYMPHOSARCOMA
UPNo.DOSEmg/k6SURVIVAL
DATAExptl/Control
NETAlky
lating Agents-Mjstard5045055165205215225235245255.010.025.02.55.010.010.015.020.01.03.05.010.01.03.05.010.01.03.05.010.01.03.05.010.01.03.05.010.01.03.05.010.013.2/12.813.8/12.813.5/12.812.3/12.812.8/12.813.7/12.89.4/
8.59.2/8.56.6/
8.516.2/12.116.1/12.139.2/12.16.6/12.112.3/12.140.0/12.124.0/12.112.9/12.112.0/12.1>
21.6/12.1>38.5/12.1>30.4/12.111.7/12.18.4/12.19.3/12.111.3/12.19.5/12.110.7/12.18.7/12.19.2/12.111.2/12.113.5/12.110.6/12.111.8/12.1PercentExt
ensionofMST343310PeÃ1.5x20601001080301020605010•cent
Sui
2x7060301010504010•viving
t
3x5050205030it
Multll
5x30202020ile
of «
7x10>T >7x102020
on June 7, 2018. © 1962 American Association for Cancer Research. cancerres.aacrjournals.org Downloaded from
578 CancerResearch Rutmanrfa/.
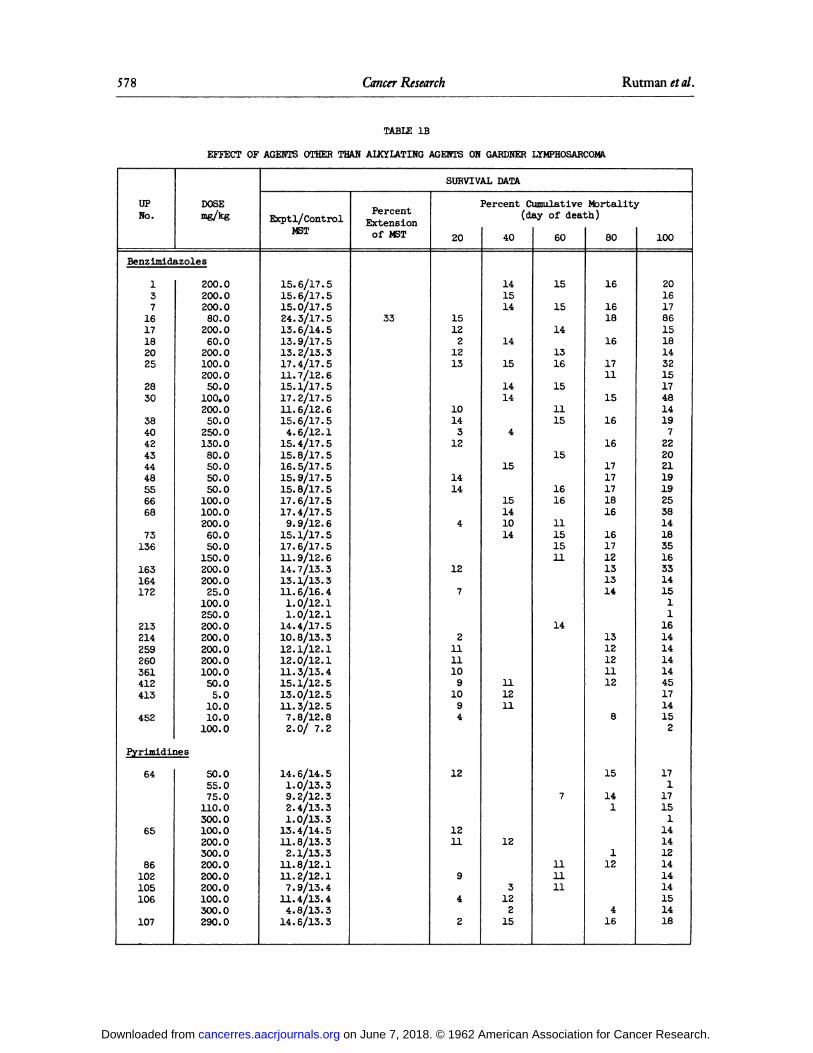
TABLE IB
EFFECT OF AGENTS OTHER THAN ALKYIATING AGENTS ON GARDNER LYMPHOSARCOMA
UPNo.DOSEmg/kgBenzimidazoles1371617182025283038404243444855666873136163164172213214259260361412413452200.0200.0200.080.0200.060.0200.0100.0200.050.0100.0200.050.0250.0130.080.050.050.050.0100.0100.0200.060.050.0150.0200.0200.025.0100.0250.0200.0200.0200.0200.0100.050.05.010.010.0100.0Pyrimidines64658610210510610750.055.075.0110.0300.0100.0200.0300.0200.0200.0200.0100.0300.0290.0SURVIVAL
DATAExptl/ControlMST15.6/17.515.6/17.515.0/17.524.3/17.513.6/14.513.9/17.513.2/13.317.4/17.511.7/12.615.1/17.517.2/17.511.6/12.615.6/17.54.6/12.115.4/17.515.8/17.516.5/17.515.9/17.515.8/17.517.6/17.517.4/17.59.9/12.615.1/17.517.6/17.511.9/12.614.7/13.313.1/13.311.6/16.41.0/12.11.0/12.114.4/17.510.8/13.312.1/12.112.0/12.111.3/13.415.1/12.513.0/12.511.3/12.57.8/12.82.0/
7.214.6/14.51.0/13.39.2/12.32.4/13.31.0/13.313.4/14.511.8/13.32.1/13.311.8/12.111.2/12.17.9/13.411.4/13.44.8/13.314.6/13.3PercentExtensionof
MST33Percent
Cumulative Mortality(day ofdeath)201512212131014312141441272111110910941212n94240141514141514144151514101411121112312215601515141316151115151616111515111471111118016161816171115161617171718161617121313141312121112815141112416100201617861518143215174814197222021191925381418351633141511161414141445171415217117151141412141414151418
on June 7, 2018. © 1962 American Association for Cancer Research. cancerres.aacrjournals.org Downloaded from

Vol. 22, No. 7, Part 2 Cancer Chemotherapy Screening Data 579
TABLE IB(Continued
EFFECT OF AGENTS OTHER THAN ALKYIATING AGENTS ON GARDNER LYMPHOSARCOMA
UPNo.DOSEmg/kgPyrimidines110127135139140162182184195206211225A-2238-1247276278280320321322338339356436S100.0300.0200.0200.0100.0250.0100.0200.025.050.0100.060.0200.0300.0200.050.0200.050.0100.0250.0200.0200.0250.050.0100.0200.0200.050.0200.0100.0100.0100.05.0Antimetabolites60S69S237-2271337434S497499506»1.02.03.755.07.515.02.0100.0100.02.5*
5.010.025.0100.0*
5.0100.015.025.015.030.0SURVIVAL
DATAExptl/ControlMST14.1/16.411.0/13.313.6/13.311.0/12.113.6/14.29.1/13.310.9/12.34.6/14.214.7/18.320.9/18.311.3/13.313.8/13.310.8/13.32.1/13.32.9/13.413.0/12.912.7/12.913.3/13.414.1/13.012.0/12.112.0/12.113.0/13.311.6/12.113.0/13.49.7/13.97.1/12.911.4/12.912.6/13.47.2/12.913.8/13.012.8/13.014.2/13.422.1/12.518.1/14.113.7/11.719.1/17.58.6/10.620.4/17.510.3/12.615.
3/11.713.5/13.011.
5/13.013.8/13.914.3/15.110.1/12.82.6/12.81.0/13.015.0/14.413.4/12.813.2/12.813.0/12.811.0/12.112.2/12.1Percent
ExtensionofMST76Percent
CumulativeMortality(dayofdeath)2012712513573621112117114311113111217171887127111195121281140117111141812121111115441112111081412121271211601213113211212117127142117141918141081212801414152913132141412121411121423201721921111914151191001814151415141414164214201334151522201814141414351214141428192235432228122314211514242413111231414141414
* PooledData.
on June 7, 2018. © 1962 American Association for Cancer Research. cancerres.aacrjournals.org Downloaded from
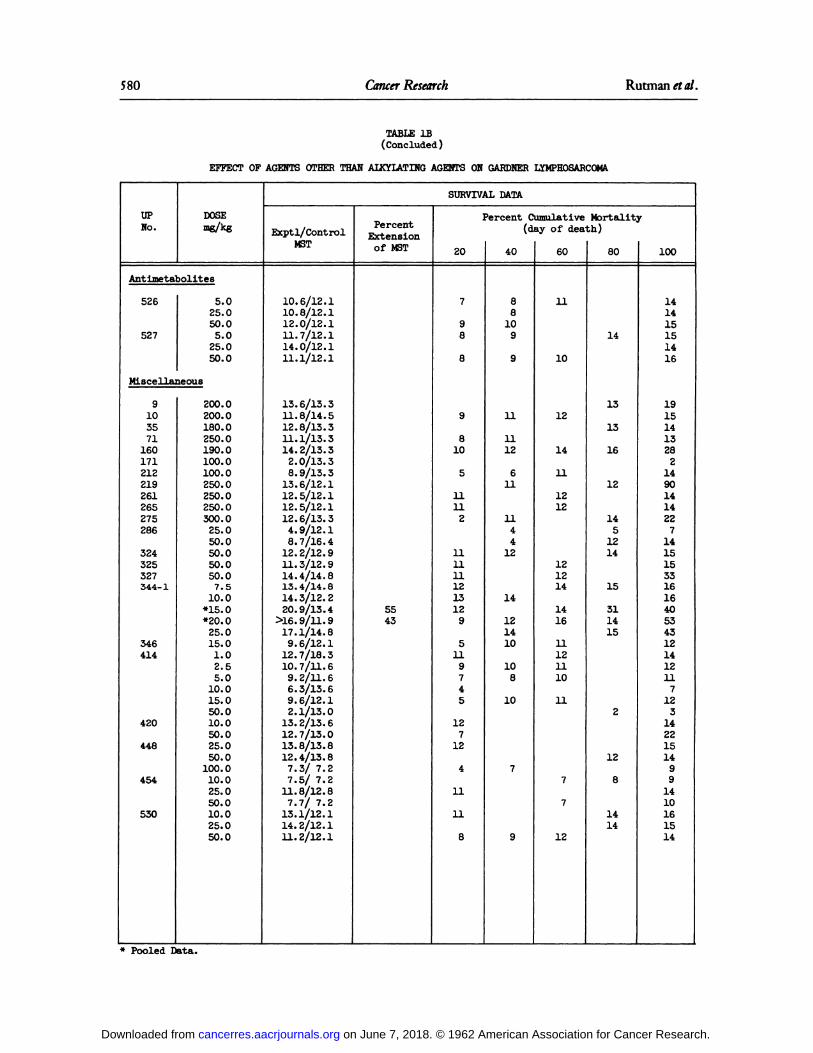
580 CancerResearch Rutmanrta/.
TABLE IB(Concluded)
EFFECT OF AGENTS OTHER THAN ALKYIATING AGENTS ON GARDNER LYMPHOSARCOMA
UPNo.DOSEmg/kgAntimetabolites5265275.025.050.05.025.050.0Miscellaneous9103571160171212219261265275286324325327344-1346414420448454530200.0200.0180.0250.0190.0100.0100.0250.0250.0250.0300.025.050.050.050.050.07.510.0*15.0«20.025.015.01.02.55.010.015.050.010.050.025.050.0100.010.025.050.010.025.050.0SURVIVAL
DATAExptl/ControlMST10.6/12.110.8/12.112.0/12.111.7/12.114.0/12.111.1/12.113.6/13.311.
8/14.512.8/13.311.1/13.314.2/13.32.0/13.38.9/13.313.6/12.112.5/12.112.5/12.112.6/13.34.9/12.18.7/16.412.2/12.911.3/12.914.4/14.813.4/14.814.3/12.220.9/13.4>16.9/11.917.1/14.89.6/12.112.7/18.310.7/11.69.2/11.66.3/13.69.6/12.12.1/13.013.2/13.612.7/13.013.8/13.812.4/13.87.3/
7.27.5/7.211.8/12.87.7/
7.213.1/12.114.2/12.111.2/12.1Percent
ExtensionofMST5543Percent
CumulativeMortality(dayofdeath)207988981051111211111112131295119745127124111184088109911111261111441214121410108107960111012141112121212141416n12111011771280141313161214512141531141521281414100141415151416191514132821490141422714151533161640534312141211712314221514991410161514
* Pooled Data.
on June 7, 2018. © 1962 American Association for Cancer Research. cancerres.aacrjournals.org Downloaded from

Vol. 22, No. 7, Part 2 CancerChemotherapyScreening Data 581
TABLE 2
EFFECT OF TEST COMPOUNDS ON L-1210 ORIGINAL LYMPHOCYTIC LEUKEMIA
UPNo.DOSEmg/kgSURVIVAL
DATAExptl/ControlMSTAlky
lating Agents -Mustard89D97S141176S336385419427428439440S441S459S47447548048448648749149249335.00.81.01.51.251.752.02.52.253.02.55.010.025.01.53.00.52.04.01.07.515.01.020.05.0«
7.510.015.020.025.030.060.04.08.01.02.00.5*
1.0*2.0«3.010.025.02.03.02.03.01.02.03.050.0100.050.0100.01.02.03.050.07.8/
7.38.2/7.010.
O/8.08.6/8.09.3/8.08.6/8.07.4/8.07.3/8.07.9/8.07.2/8.08.2/7.26.0/7.24.0/7.2O/
7.27.I/7.07.6/
7.07.4/7.09.1/7.09.0/7.08.4/7.37.9/7.28.I/7.08.9/
7.37.8/7.010.
2/7.910.2/9.57.8/
9.56.0/9.55.9/9.55.9/9.58.3/
7.010.I/7.09.2/
7.09.0/7.07.I/7.07.2/
7.08.4/7.08.7/
7.210.7/7.29.5/
7.27.2/7.27.0/7.29.9/7.07.2/
7.010.5/7.09.4/
7.07.2/7.07.6/7.07.0/7.06.5/7.07.7/9.25.8/7.05.0/7.08.3/7.08.5/7.06.5/7.02.0/
7.0Percent
ExtensionofMST30283041443129344337415034Percent
Cumulative Mortality(day ofdeath)207797855565797a89774408897652810789955488601098777779878898n810101075801088579881012107791097778559100891211121088981078081081010111091181213966691410118810111312971281211897877799112
* Pooled Data.
on June 7, 2018. © 1962 American Association for Cancer Research. cancerres.aacrjournals.org Downloaded from

582 CancerResearch Rutmanrta/.
TABLE 2(Continued)
EFFECT OF TEST COMPOUNDS ON L-1210 ORIGINAL LYMPHOCYTIC LEUKEMIA
UPNo.DOSE mg/kgSURVIVAL
DATAExptl/ControlMSTAlkylating
Agents -Mustard49549650050151652052152252352452552852950.0100.050.075.0100.050.0100.0«
1.0*2.02.5*
3.05.05.0«10.0<15.020.01.03.05.010.01.03.05.010.01.03.05.010.01.03.05.010.01.03.05.010.01.03.05.010.0100.0300.0400.0500.0750.05.010.025.0Benzimidazoles4522.05.05.7/
7.04.7/7.07.3/7.08.3/7.07.4/7.06.9/7.07.3/7.08.3/7.18.0/7.08.7/7.28.2/7.07.1/7.010.7/7.010.2/7.810.6/7.86.6/
8.58.3/8.57.8/8.57.7/
8.55.3/8.58.4/8.58.4/8.58.2/8.55.6/8.57.4/8.57.9/8.59.0/8.58.I/8.57.7/
8.57.9/8.58.6/8.59.4/8.57.9/8.58.0/8.57.4/8.57.7/8.59.0/8.58.2/8.58.0/8.58.5/8.57.0/7.27.0/7.27.I/7.27.I/7.26.8/
7.27.I/7.27.2/
7.27.2/7.27.0/
7.27.1/ 7.2Percent
ExtensionofMST533236Percent
Cumulative Mortality(day ofdeath)205577877577555575775404810974487777787786058779899758998897880588778971111898891097777771007799989991098251414710997101111791010101410101111101012111010107788789978
* Pooled Data.
on June 7, 2018. © 1962 American Association for Cancer Research. cancerres.aacrjournals.org Downloaded from
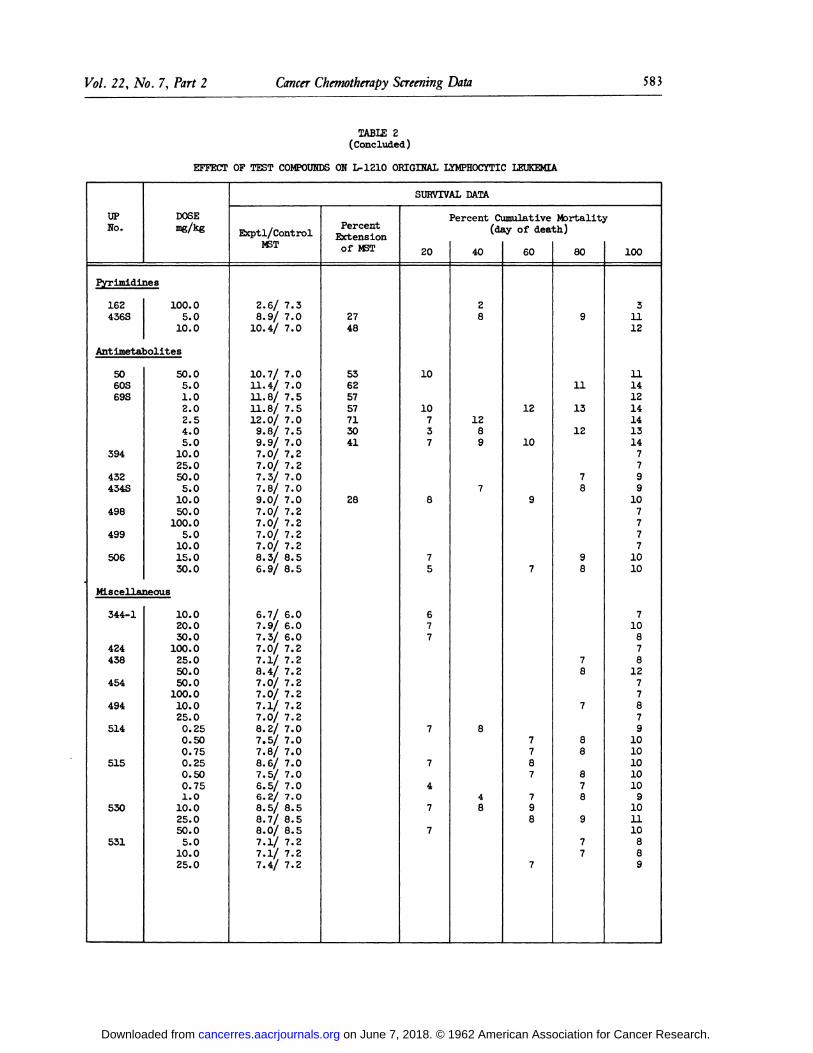
Vol. 22, No. 7, Part 2 CancerChemotherapyScreening Data 583
TABLE Z(Concluded)
EFFECT OF TEST COMPOUNDS ON L-1210 ORIGIHAL LYMPHOCYTIC LEUKEMIA
UPNo.DOSEng/fcgPyrimidines162436S100.05.010.0Antimetabolites5060S69S394432434S49849950650.05.01.02.02.54.05.010.025.050.05.010.050.0100.05.010.015.030.0Miscellaneous344-142443845449451451553053110.020.030.0100.025.050.050.0100.010.025.00.250.500.750.250.500.751.010.025.050.05.010.025.0SURVIVAL
DATAExptl/ControlVË12.6/
7.38.9/7.010.4/7.010.
7/7.011.4/7.011.8/7.511.8/7.512.O/7.09.8/
7.59.9/7.07.0/7.27.0/7.27.3/7.07.8/7.09.0/7.07.0/7.27.0/7.27.0/7.27.0/7.28.3/8.56.9/8.56.7/
6.07.9/6.07.3/6.07.0/7.27.I/7.28.4/
7.27.0/7.27.0/7.27.1/7.27.0/
7.28.2/7.07.5/7.07.8/7.08.6/7.07.5/7.06.5/7.06.2/7.08.5/8.58.7/8.58.0/8.57.I/7.27.I/7.27.4/
7.2Percent
ExtensionofMST27485362575771304128Percent
CumulativeMortality(dayofdeath)201010737875677774774028128978486012109777677987809111312789878788878977100311121114121414131477991077771010710878127787910101010109101110889
on June 7, 2018. © 1962 American Association for Cancer Research. cancerres.aacrjournals.org Downloaded from
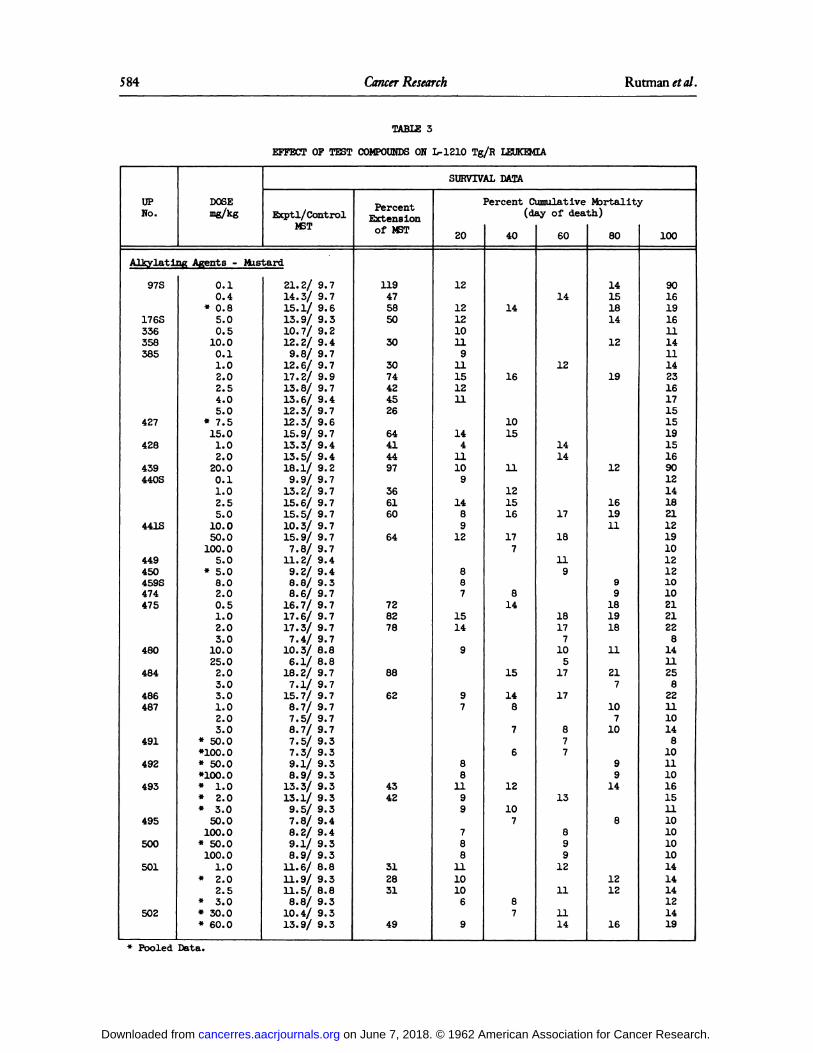
584 CancerResearch
TABLE 3
EFFECT OF TEST COMPOUNDS ON L-1210 Tg/R LEUKEMIA
UPNo.DOSE mg/fcgSURVIVAL
DATAExptl/ControlM3TAlkylating
Agents -Mustard97S176S336358385427428439440S441S449450459S4744754804844864874914924934955005015020.10.4*
0.85.00.510.00.11.02.02.54.05.0*
7.515.01.02.020.00.11.02.55.010.050.0100.05.0«
5.0S.O2.00.51.02.03.010.025.02.03.03.01.02.03.0*
50.0»100.0*
50.0»100.0*
1.0«2.0*3.050.0100.0*
50.0100.01.0»
2.02.5*
3.0*30.0*
60.021.
2/9.714.3/9.715.I/9.613.9/9.310.7/9.212.2/9.49.8/
9.712.6/9.717.2/9.913.8/9.713.6/9.412.3/9.712.3/9.615.9/9.713.3/9.413.5/9.418.I/9.29.9/
9.713.2/9.715.6/9.715.5/9.710.3/9.715.9/9.77.8/
9.711.2/9.49.2/
9.48.8/9.38.6/
9.716.7/9.717.6/9.717.3/9.77.4/
9.710.3/8.86.I/8.818.2/9.77.I/9.715.7/9.78.7/
9.77.5/9.78.7/9.77.5/9.37.3/9.39.I/9.3B.9/
9.313.3/9.313.I/9.39.5/
9.37.8/9.48.2/9.49.I/9.38.9/
9.311.6/8.811.9/9.311.5/8.88.8/
9.310.4/9.313.9/ 9.3Percent
ExtensionofMST11947585030307442452664414497366160647282788862434231283149Percent
Cumulative Martality(day ofdeath)2012121210119111512111441110914891288715149978811997881110106940141610151112151617781415148761210787601412141417181191817710517178771389912111114801415181412191216191199181918112171071099148121216100901619161114111423161715151915169012141821121910121210102121228141125822111014810111016151110101010141414121419
* Pooled Data.
on June 7, 2018. © 1962 American Association for Cancer Research. cancerres.aacrjournals.org Downloaded from
Vol. 22, No. 7, Part 2 CancerChemotherapyScreening Data 585
TABLE 3(Concluded)
EFFECT OF TEST COMPOUNDS ON L-1210 Tg/R LEUKEMIA
UPNo.DOSE ag/kgSURVIVAL
DATAExptl/ControlM3TAlkylating
Agents-Mustard5055085095105115125163.57.03.57.03.57.03.57.03.57.02.03.54.08.0Benzlmidazoles4522.05.0Pyrimidlnes162436S200.05.0Antimetabolites60S69S394432434S4984995.07.52.04.010.025.050.05.050.0100.05.010.0Miscellaneous1042443844845449451451550.0100.025.050.025.050.0100.010.025.00.10.20.51.00.10.20.51.09.
I/9.27.9/9.27.2/9.27.4/9.27.3/9.27.8/9.26.9/9.27.4/9.27.7/9.27.3/
9.213.O/9.28.9/
9.211.9/9.214.4/9.29.2/
8.86.5/8.87.4/
9.412.9/9.38.9/
9.97.5/9.47.7/9.37.6/9.38.6/8.88.7/8.89.4/
9.211.8/9.39.3/
8.88.7/8.89.4/8.89.2/8.89.9/
9.48.4/8.89.3/8.87.7/8.89.2/9.46.7/8.87.4/8.89.3/8.88.2/8.89.4/
9.210.O/9.210.2/9.29.8/
9.29.9/9.210.
O/9.29.7/9.29.I/ 9.2Percent
ExtensionofMST4129563927Percent
Cumulative Mortality(day ofdeath)208455714947777575897997407712812155778899797988609877771071277119998710101099809797879879101210101010911101010100101012101010891091511151711119141089911101014n111111111111108911121111111411111112
on June 7, 2018. © 1962 American Association for Cancer Research. cancerres.aacrjournals.org Downloaded from
586 CancerResearch Rutmanrta/.
TABLE 4
EFFECT OF TEST COMPOUNDS ON L-1210 AM/R LEUKEMIA
UPNo.DOSE mg/kgSURVIVAL
DATAExptl/ControlMSTAlkylating
Agents -Mustard89D97S176S336419427428439440S441S459S47548049650050150250435.00.85.00.51.07.51.020.04.08.030.060.04.08.01.02.05.010.07.515.025.030.02.55.0100.050.0Benz
imidazoles45212.5Pyrimidines162436S100.05.0Antimetabolites69S432434S4994.050.05.050.075.08.2/
8.09.7/7.07.9/7.27.3/
7.010.7/8.08.I/8.010.5/8.07.8/
7.012.2/7.216.8/7.212.5/7.222.2/7.211.6/7.29.I/7.211.O/7.216.4/7.27.8/
7.78.8/7.78.4/7.77.6/7.77.2/7.77.0/7.78.8/7.77.2/7.7S.I/7.77.8/7.73.6/
7.75.9/
8.010.1/7.27.2/
7.27.0/7.08.5/7.24.6/7.74.7/
7.7Percent
ExtensionofMST393431701317420861265312840Percent
Cumulative Mortality(day ofdeath)209971416101288240971781077723922608781112119147878378808121721121011169887984107977100911108119118182814531611143391091010710810991114871099
on June 7, 2018. © 1962 American Association for Cancer Research. cancerres.aacrjournals.org Downloaded from
Vol. 22, No. 7, Part 2 CancerChemotherapyScreening Data 587
TABLE 5
EFFECTOF TEST COMPOUNDSON P288 LYMPHOCYTICLEUKEMIA
UPNo.DOSE mg/kgSURVIVAL
DATAExptl/ControlMSTAlkylating
Agents-Mustard97S17
6S385419427428440S441S458459S4754844860.42.55.01.02.04.02.05.010.020.02.010.02.454.37.530.060.05.010.02.55.010.00.51.02.01.05.010.02.05.0Pyrimidlnes436S5.0Antimetabolltes60S69S434S5.02.04.05.0Miscellaneous47948550.050.08.5/7.88.0/8.69.5/8.67.0/7.78.0/7.79.5/7.79.I/8.17.9/
8.17.3/8.18.5/8.19.0/8.14.4/8.19.0/
7.710.2/7.79.1/
7.711.3/8.616.4/8.66.8/
7.77.7/7.77.6/
7.710.1/7.77.I/7.77.9/
8.19.6/8.110.
6/8.19.6/8.15.6/8.13.9/8.18.5/8.17.5/8.19.5/
8.613.
7/8.613.2/7.714.0/
7.710.O/8.66.2/
8.16.4/8.1Percent
ExtensionofMST3231913131597182Percent
Cumulative Mortality(day ofdeath)20777510101458737812138540798889119989560889491011167710810571080989791879117989141315710010101079131010991051113131219910101389141410841010141514171487
on June 7, 2018. © 1962 American Association for Cancer Research. cancerres.aacrjournals.org Downloaded from
588 CancerResearch Rutman et al.
TABLE 6
EFFECT OF TEST COMPOUNDS ON P288-R2 LYMPHOCYTIC LEUKEMIA
UPNo.DOSEmg/kgSURVIVAL
DATAExptl/ControlMSTAUcylating
Agents-Mustard97S176S385419427428440S441S458459S4744754804844864934965005015025040.42.55.01.02.04.01.02.015.020.01.02.02.454.37.530.060.05.010.02.54.05.08.010.01.02.01.02.05.010.01.02.02.03.01.02.07.515.025.030.02.55.0100.050.0Benzimi
¿Lazóles45212.5Pyrimidines436S5.011.
2/9.011.O/9.910.2/9.910.7/9.010.6/9.010.9/9.011.4/9.910.8/9.911.6/9.911.6/9.911.O/9.99.7/
9.911.I/9.011.5/9.014.9/9.013.7/9.911.O/9.97.9/
9.07.6/9.08.7/
9.013.5/9.912.I/9.07.9/
9.97.5/9.09.5/9.99.4/
9.912.2/9.912.8/9.911.0/10.311.1/10.311.
6/9.97.7/9.910.
4/9.97.I/9.911.2/9.99.8/
9.910.5/10.311.3/10.311.
7/10.310.3/10.313.9/10.37.4/10.36.7/10.310.
7/10.35.0/10.310.
5/ 9.9Percent
ExtensionofMST23161616U232765421136342835Percent
CumulativeMortality(dayofdeath)20109871010971175712991081010119125940999914107971179910101060111211111111111011131187991211111174801111121211881010141111812710147115100131415131314141414161212131417171410911141491311121415121214111481411121412141599121212
on June 7, 2018. © 1962 American Association for Cancer Research. cancerres.aacrjournals.org Downloaded from

Vol. 22, No. 7, Part 2 Cmcer Chemotherapy Screening Data 589
TABLE 6(Concluded)
EFFECT OF TEST COMPOUNDS ON P288-R2 LYMPHOCYTIC LEUKEMIA
UPNo.DOSEAntimetabolites60S69S434S4992.04.06.02.04.05.050.075.0SURVIVAL
DATAExptl/Control10.
9/9.59.9/9.510.
3/9.59.5/9.010.
I/9.011.O/9.99.7/10.36.8/10.3Percent
ExtensionofNET11Percent
CumulativeMortality(dayofdeath)209991082401010996011780111111101001313111113141111
on June 7, 2018. © 1962 American Association for Cancer Research. cancerres.aacrjournals.org Downloaded from

590 Cmcer Research Rutman et al.
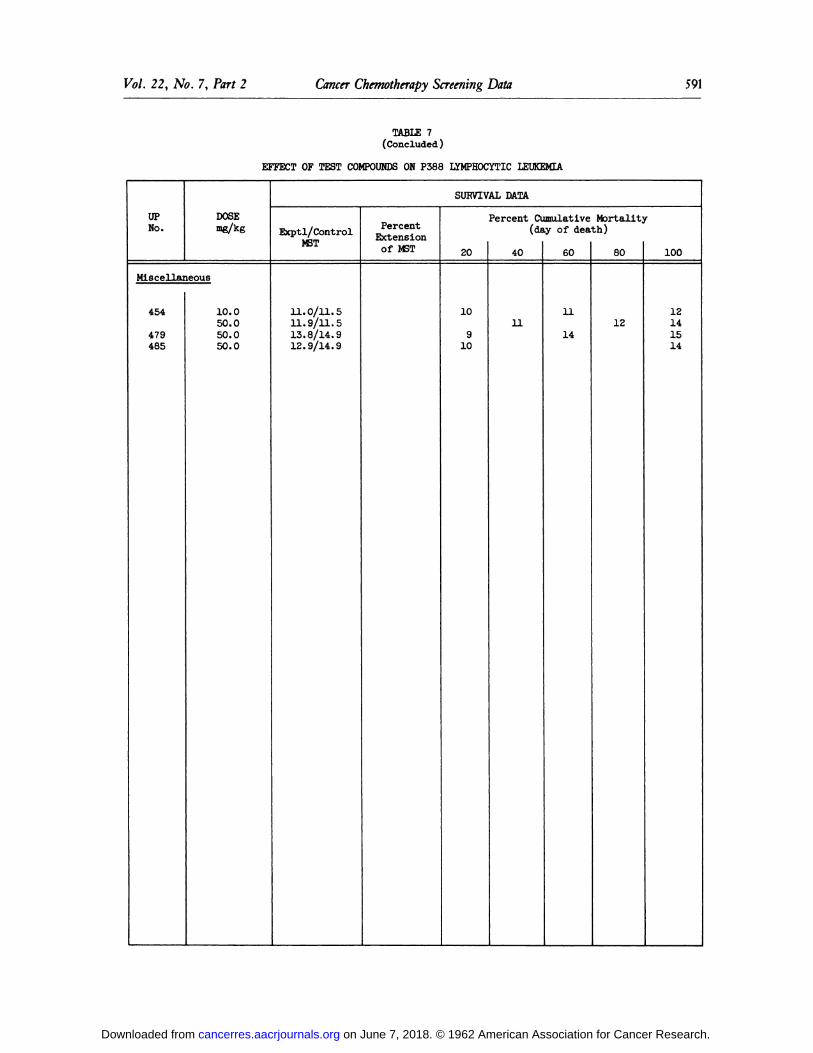
TABLE 7
EFFECT OF TEST COMPOUNDS ON P388 LYMPHOCYTIC LEUKEMIA
UPNo.DOSE mg/kgSURVIVAL
DATAExptl/ControlNETAlkylating
Agents-Mustard97S176S385419427428440S441S459S4744754844864870.2*
0.40.81.22.55.00.51.02.04.01.0*
2.05.010.015.020.00.5*
1.0*2.010.01.02.05.07.510.010.020.030.040.060.00.51.05.01.02.00.5*
1.0*2.0*
1.02.05.010.02.03.01.02.0Pyrimidines436S5.05.0Ant
imetabolites60S69S434S5.02.55.0*
5.015.0/11.519.8/13.216.7/11.520.4/11.511.
4/9.911.6/9.912.2/11.512.9/11.513.8/11.513.0/11.514.
5/8.911.2/12.47.6/14.916.
2/4.912.3/9.914.2/12.413.6/11.513.8/10.719.3/12.14.0/14.913.0/11.514.9/11.515.8/11.517.3/11.517.4/11.514.0/11.515.5/11.514.
0/9.920.5/11.515.O/9.911.6/11.511.
7/11.519.2/11.59.5/
9.911.4/9.918.0/14.917.5/12.418.4/12.418.0/12.412.
9/9.95.7/14.93.6/14.914.
2/9.911.8/9.912.9/9.910.4/9.914.5/11.513.
8/9.912.8/11.516.
I/9.915.1/9.913.3/10.7Percent
ExtensionofMST3053457732323037505135417852674138463044302639635324Percent
CumulativeMortality(dayofdeath)20101271275111112731415121412189101117916141412101010874014101112871214121415171611189101615123121217601517161115141381612151516171911181717175141110148016111216151491441618141614171419191912141115181310018221886141414141617191810191518161717514171821231618162219141222101621232322147421181512172315192116
»PooledData.
on June 7, 2018. © 1962 American Association for Cancer Research. cancerres.aacrjournals.org Downloaded from
Vol. 22, No. 7, Part 2 CancerChemotherapyScreening Data 591
TABLE 7(Concluded)
EFFECTOF TEST COMPOUNDSON P388 LYMPHOCYTICLEUKEMIA
OPNo.DOSEmg/kgMiscellaneous45447948510.050.050.050.0SURVIVAL
DATAExptl/Control
MST11.0/11.511.9/11.513.8/14.912.9/14.9PercentExtensionof MST2010910Percent
d(de4011unulativelyofdea601114Mortalitith)8012r10012141514
on June 7, 2018. © 1962 American Association for Cancer Research. cancerres.aacrjournals.org Downloaded from
592 CancerResearch Rutmanrta/.
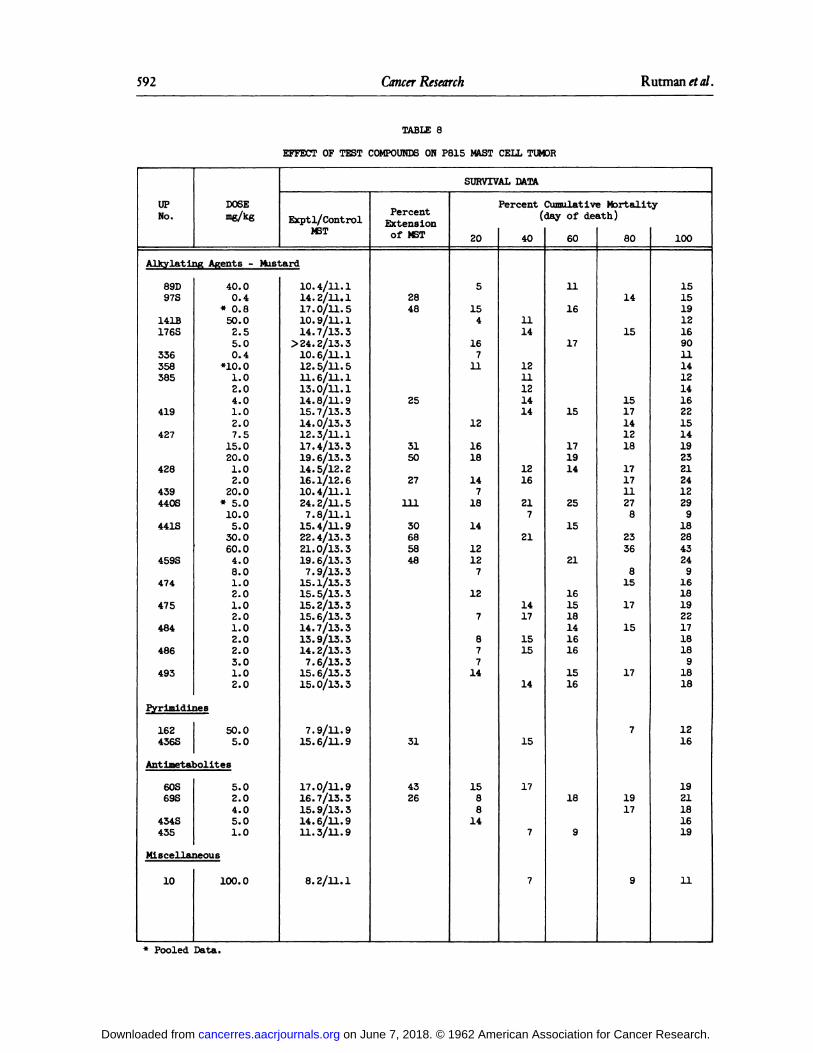
TABLE 8
EFFECT OF TEST COMPOUNDS ON P815 MAST CELL TUMOR
UPNo.DOSE mg/kgSURVIVAL
DATAExptl/ControlMSTAlkylating
Agents -Mustard89D97S141B176S336358385419427438439440S441S459S47447548448649340.00.4*
0.850.02.55.00.4*10.01.02.04.01.02.07.515.020.01.02.020.0*
5.010.05.030.060.04.08.01.02.01.02.01.02.02.03.01.02.0Pyrimidines162436S50.05.0Antimetabolites60S69S434S4355.02.04.05.01.0Miscellaneous10100.010.4/11.114.2/11.117.0/11.510.9/11.114.
7/13.3>24.2/13.310.6/11.112.5/11.511.6/11.113.0/11.114.8/11.915.7/13.314.0/13.312.3/11.117.4/13.319.6/13.314.5/12.216.1/12.610.4/11.124.2/11.57.8/11.115.4/11.922.4/13.321.0/13.319.6/13.37.9/13.315.
1/13.315.5/13.315.2/13.315.6/13.314.7/13.313.9/13.314.2/13.37.6/13.315.6/13.315.0/13.37.9/11.915.6/11.917.0/11.916.7/13.315.9/13.314.6/11.911.3/11.98.2/n.iPercent
ExtensionofMST28482531502711130685848314326Percent
CumulativeMortality(dayofdeath)20515416711121618147181412127127877141588144011141211121414121621721141715151415177760111617151719142515211615181416161516189801415151714121817171127823368151715177191791001515191216901114121416221514192321241229918284324916181922171818918181216192118161911
* Pooled Data.
on June 7, 2018. © 1962 American Association for Cancer Research. cancerres.aacrjournals.org Downloaded from
Vol. 22, No. 7, Part 2 CancerChemotherapy Screening Data 593
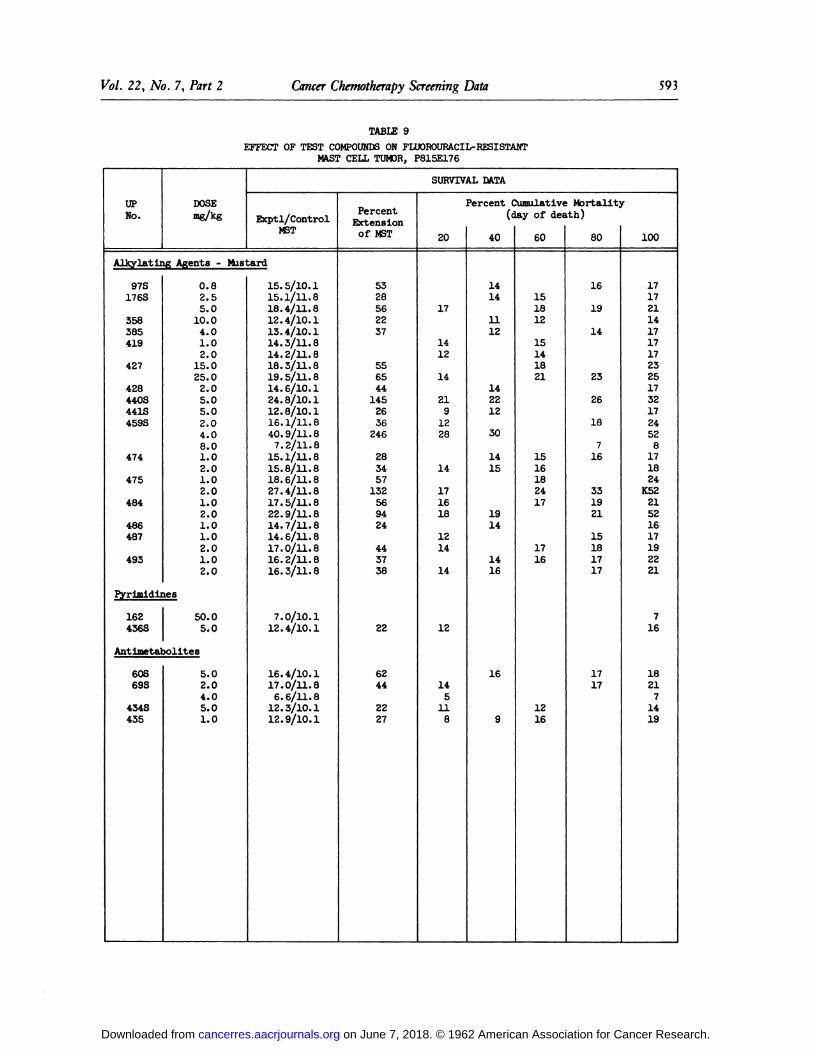
TABLE 9
EFFECT OF TEST COMPOUNDS ON FLUOROURACIL-RESISTANT
MAST CELL TUMOR, P815E176
UPNo.DOSE Å“g/kgSURVIVAL
DATAExptl/ControlMSTAlky
lating Agents -Mustard97S176S358385419427428440S441S459S4744754844864874930.82.55.010.04.01.02.015.025.02.05.05.02.04.08.01.02.01.02.01.02.01.01.02.01.02.0Pyrimidines162436S50.05.0Antijnetabolites60S69S434S4355.02.04.05.01.015.
5/10.115.1/11.818.4/11.812.4/10.113.4/10.114.3/11.814.2/11.818.3/11.819.5/11.814.6/10.124.8/10.112.8/10.116.1/11.840.9/11.87.2/11.815.1/11.815.8/11.818.6/11.827.4/11.817.5/11.822.9/11.814.7/11.814.6/11.817.0/11.816.2/11.816.3/11.87.0/10.112.4/10.116.4/10.117.0/11.86.6/11.812.3/10.112.9/10.1Percent
ExtensionofMST532856223755654414526362462834571325694244437382262442227Percent
CumulativeMortality(dayofdeath)201714121421912281417161812141412145118401414n121422123014151914141616960151812151418211516182417171612168016191423261871633192115181717171710017172114171717232517321724528171824K5221521617192221716182171419
on June 7, 2018. © 1962 American Association for Cancer Research. cancerres.aacrjournals.org Downloaded from
594 CancerResearch Rutman et al.
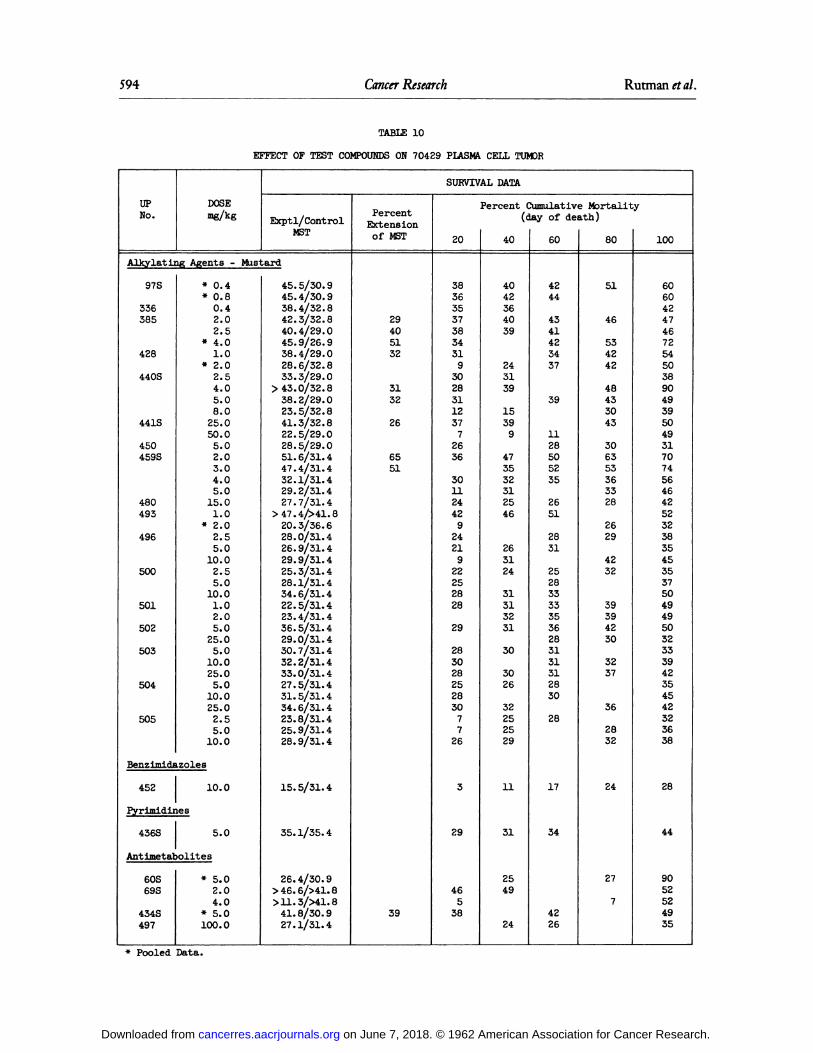
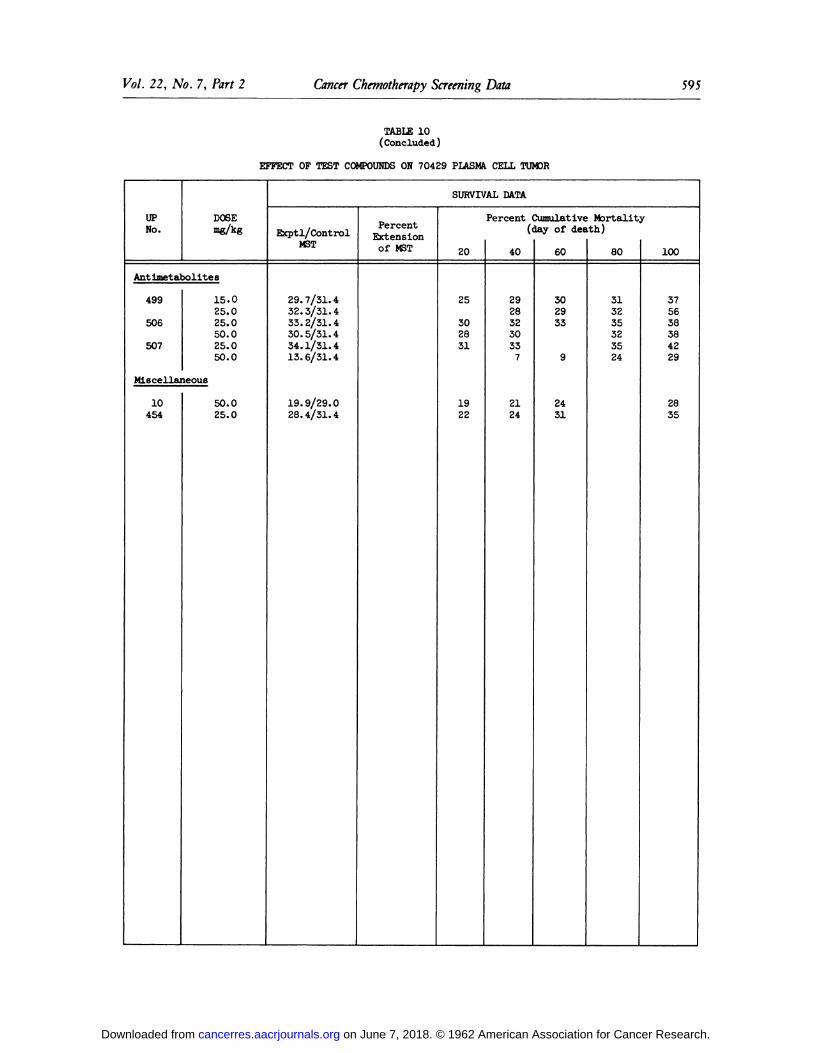
TABLE 10
EFFECT OF TEST COMPOUMDS ON 70429 PLASMA CELL TUMOR
UPNo.DOSEmgAeSURVIVAL
DATAExptl/ControlMSTAlkylating
Agents -Mustard97S336385428440S441S450459S480493496500501502503504505*
0.4*0.80.42.02.5*
4.01.0*
2.02.54.05.08.025.050.05.02.03.04.05.015.01.0*
2.02.55.010.02.55.010.01.02.05.025.05.010.025.05.010.025.02.55.010.0Benzimldazoles45210.0Pyri
midines436S5.0Ant
imetabolites60S69S434S497*
5.02.04.0*
5.0100.045.5/30.945.4/30.938.4/32.842.3/32.840.4/29.045.9/26.938.4/29.028.6/32.833.3/29.0>
43.0/32.838.2/29.023.5/32.841.3/32.822.5/29.028.5/29.051.6/31.447.4/31.432.1/31.429.2/31.427.7/31.4>47.4/>41.820.3/36.628.0/31.426.9/31.429.9/31.425.3/31.428.1/31.434.6/31.422.5/31.423.4/31.436.5/31.429.0/31.430.7/31.432.2/31.433.0/31.427.5/31.431.5/31.434.6/31.423.8/31.425.9/31.428.9/31.415.5/31.435.1/35.426.4/30.9>46.6/>41.8>11.3/M1.841.8/30.927.1/31.4Percent
ExtensionofMST29405132313226655139Percent
CumulativeMortality(dayofdeath)2038363537383431930283112377263630112442924219222528282928302825283077263294653840404236403924313915399473532312546263124313132313030263225252911312549246042444341423437391128505235265128312528333335362831313128302817344226805146534242484330433063533633282629423239394230323736283224277100606042474672545038904939504931707456464252323835453537504949503233394235454232363828449052524935
* Pooled Data.
on June 7, 2018. © 1962 American Association for Cancer Research. cancerres.aacrjournals.org Downloaded from
Vol. 22, No. 7, Part 2 CancerChemotherapy Screening Data 595
TABLE 10(Concluded)
EFFECT OF TEST COMPOUNDS ON 70439 PLASMA CELL TUMOR
UPNo.DOSEmg/kgAnt
imetabolites49950650715.025.025.050.025.050.0Miscellaneous1045450.025.0SURVIVAL
DATAKxptl/ControlMST29.7/31.432.3/31.433.2/31.430.5/31.434.1/31.413.6/31.419.9/29.028.4/31.4Percent
ExtensionofMSTPercent
CumulativeMortality(dayofdeath)20253028311922402928323033721246030293392431803132353235241003756383842292835
on June 7, 2018. © 1962 American Association for Cancer Research. cancerres.aacrjournals.org Downloaded from
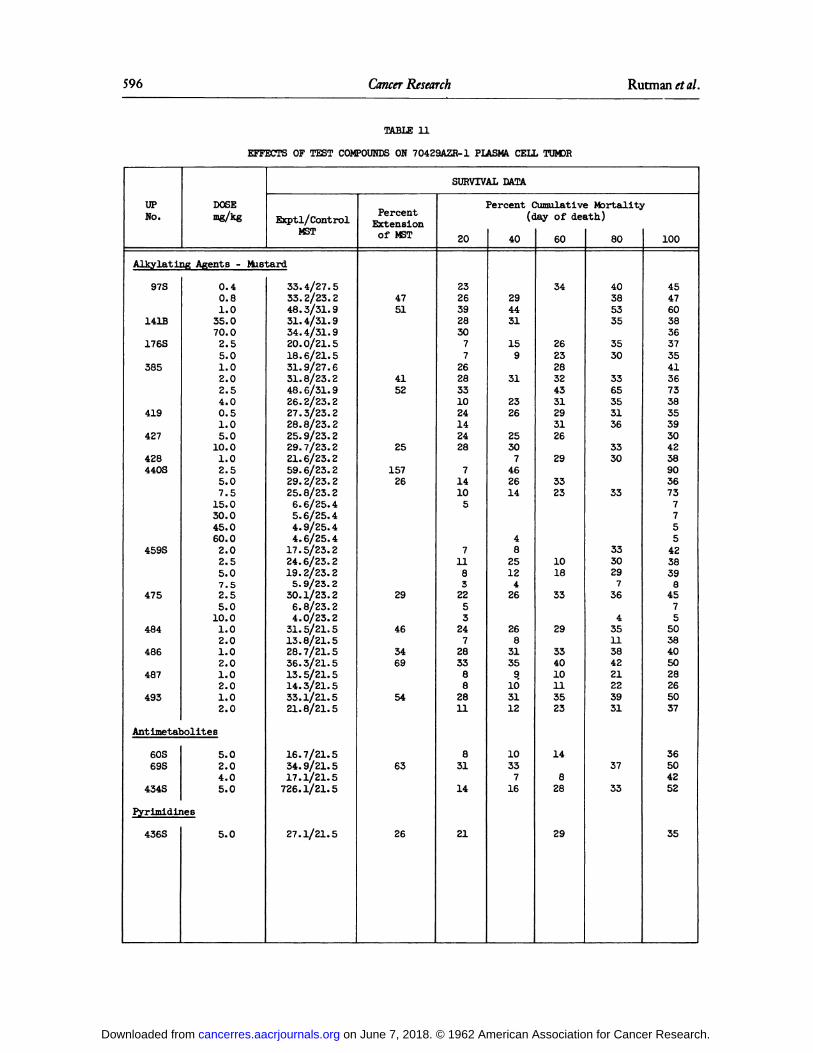
596 CancerResearch Rutman et al.
TABLE 11
EFFECTS OF TEST COMPOUNDS ON 70429AZR-1 PLASMA CELL TUMOR
UPNo.DOSE ingAsSURVIVAL
DATAExptl/ControlMSTAlky
lating Agents -Mustard97S141B176S385419427428440S459S4754844864874930.40.81.035.070.02.55.01.02.02.54.00.51.05.010.01.02.55.07.515.030.045.060.02.02.55.07.52.55.010.01.02.01.02.01.02.01.02.0Antimetabolites60S69S434S5.02.04.05.0Pyrlmldlnes436S5.033.4/27.533.2/23.248.3/31.931.4/31.934.4/31.920.0/21.518.6/21.531.9/27.631.8/23.248.6/31.926.2/23.227.3/23.228.8/23.225.9/23.229.7/23.221.6/23.259.6/23.229.2/23.225.8/23.26.6/25.45.6/25.44.9/25.44.6/25.417.5/23.224.6/23.219.2/23.25.9/23.230.1/23.26.8/23.24.0/23.231.5/21.513.8/21.528.7/21.536.3/21.513.5/21.514.3/21.533.1/21.521.8/21.516.7/21.534.9/21.517.1/21.5726.1/21.527.1/21.5Percent
ExtensionofMST47514152251572629463469546326Percent
Cumulative Mortality(day ofdeath)20232639283077262833102414242871410571183225324728338828118311421402944311593123262530746261448251242626831359,10'3112103371660342623283243312931262933231018332933401011352314828298040385335353033653531363330333330297364351138422122393137331004547603836373541367338353930423890367377554238398457550384050282650373650425235
on June 7, 2018. © 1962 American Association for Cancer Research. cancerres.aacrjournals.org Downloaded from
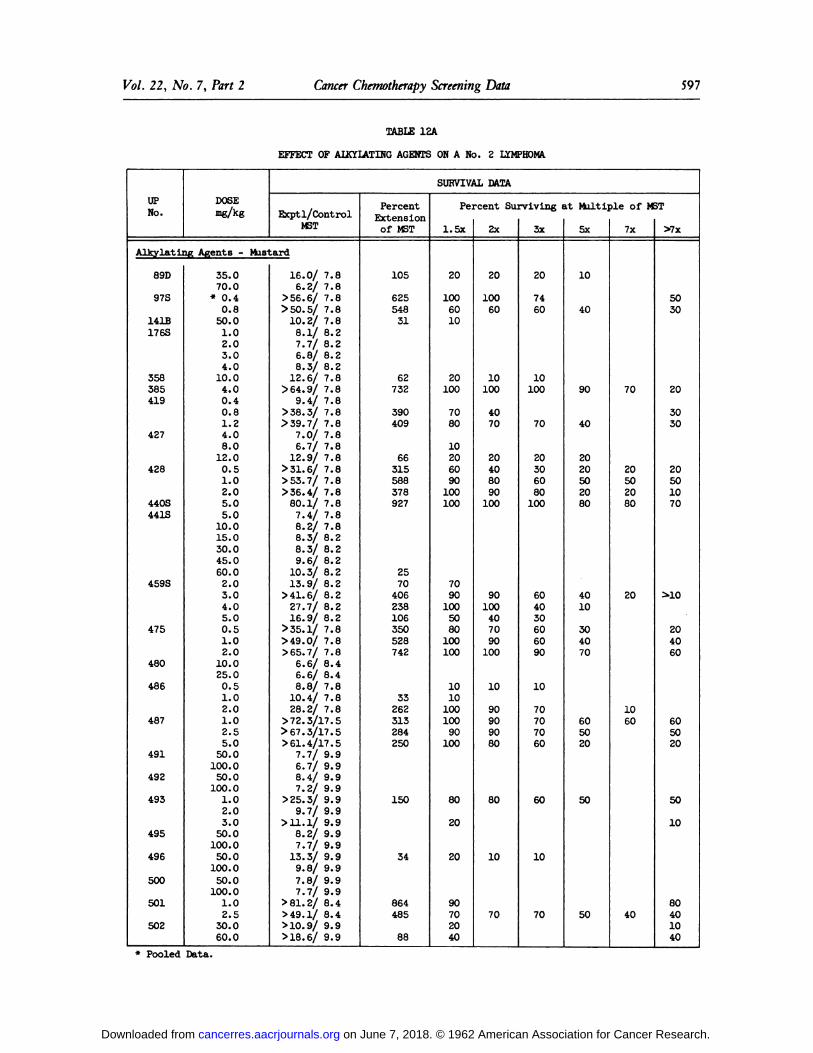
Vol. 22, No. 7, Part 2 Cmcer Chemotherapy Screening Data 597
TABLE 12A
EFFECT OF ALKYLATINGAGENTS ON A No. 2 LÕMPHOMA
UPNo.DOSEn«AeSURVIVAL
DATAExptl/ControlMSTAlky
lating Agents -Mustard89D973141B17
63358385419427438440S441S459S47548048648749149349349549650050150335.070.0*
0.40.850.01.03.03.04.010.04.00.40.81.34.08.012.00.51.03.05.05.010.015.030.045.060.03.03.04.05.00.51.02.010.035.00.51.03.01.03.55.050.0100.050.0100.01.02.03.050.0100.050.0100.050.0100.01.02.530.060.016.
O/7.86.3/7.8>56.6/7.8>50.5/
7.810.3/7.88.I/8.27.7/
8.36.8/8.28.3/
8.212.6/7.8>64.9/
7.89.4/7.8>38.3/7.8>39.7/
7.87.0/7.86.7/
7.812.9/7.8>31.6/
7.8>53.7/7.8>36.4/
7.880.I/7.87.4/
7.88.2/7.88.3/8.28.3/8.29.6/
8.210.3/8.213.9/8.2>41.6/
8.237.7/8.216.9/8.3>35.1/
7.8>49.0/7.8>65.7/
7.86.6/8.46.6/8.48.8/
7.810.4/7.828.3/7.8>
73. 3/17.5>67. 3/17.5>61. 4/17.57.7/
9.96.7/9.98.4/9.97.2/
9.9>35.3/9.99.7/
9.9>11.1/9.98.2/9.97.7/
9.913.3/9.99.8/
9.97.8/9.97.7/
9.9>81.2/8.4>49.1/8.4>10.9/9.9>18.6/
9.9Percent
ExtensionofMST1056255483162732390409663155883789272570406238106350528743332633132843501503486448588Percent
Surviving at Multiple ofMST1.5x2010060102010070801020609010010070901005080100100101010010090100802020907020402x2010060101004070204080901009010040709010010909090808010703x20746010100702030608010060403060609010707070606010705x104090402020502080401030407060502050507x702050208020106040>7x5030203030205010702»10204060605020501080401040
* Pooled Data.
on June 7, 2018. © 1962 American Association for Cancer Research. cancerres.aacrjournals.org Downloaded from

598 CancerResearch Rutman et al.
TABLE 12A(Concluded)
EFFECT OF ALKYLATING AGENTS ON A No. Z LYMPHOMA
UPNo.DOSESURVIVAL
DATAExptl/Control
MSTAlky
lating Agents-Mustard5055085095105115127.515.025.07.515.025.07.515.025.07.515.025.07.515.025.07.515.025.07.2/
9.97.2/9.96.6/9.98.0/9.98.5/9.97.8/9.97.5/9.97.I/9.97.0/
9.97.2/9.97.0/9.97.2/9.97.4/9.98.0/9.9Q.I/9.97.8/9.97.5/9.98.3/
9.9Percent
Extensionof MSTPej 1.5x•cent
Sui
2x•viving
i
3xit
Multi]
5x>le
ofM£7x>T
>7x
on June 7, 2018. © 1962 American Association for Cancer Research. cancerres.aacrjournals.org Downloaded from
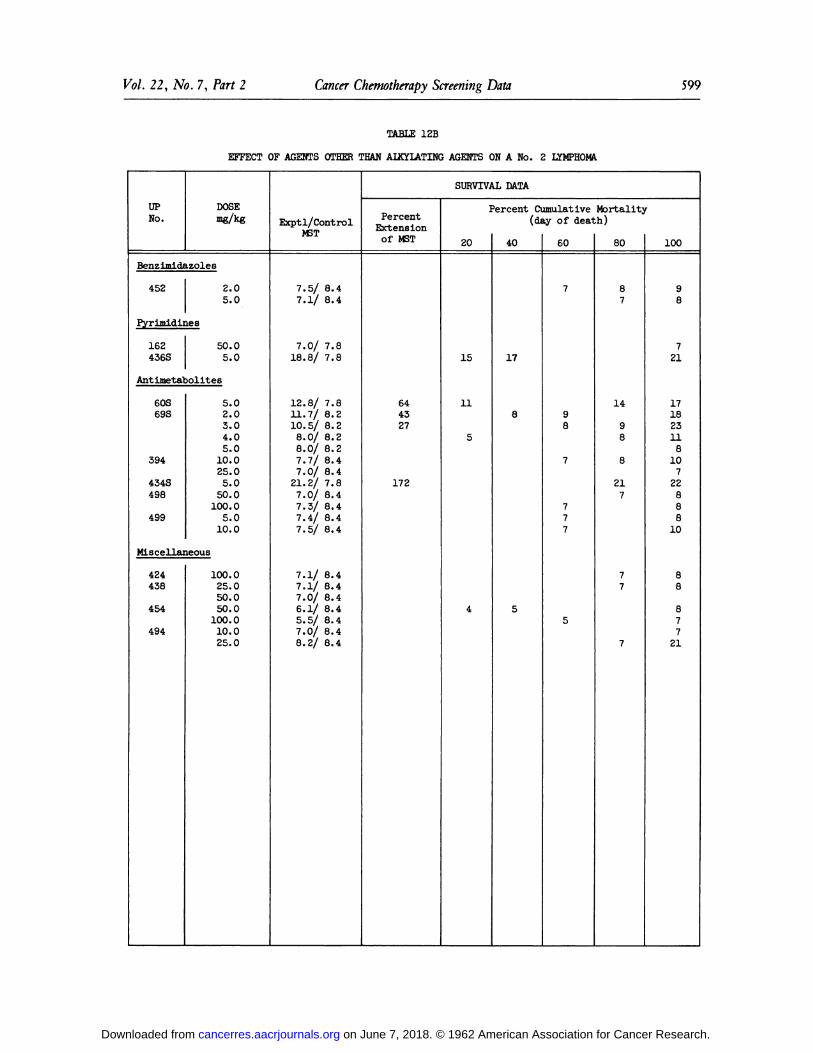
Vol. 22, No. 7, Part 2 CancerChemotherapy Screening Data 599
TABLE 12B
EFFECT OF AGENTS OTHER THAN ALKYLATING AGENTS ON A No. 2 LYMPHOMA
UPNo.DOSEmg/kgBenzimldazoles4522.05.0Pyrimidines162436S50.05.0Ant
imetaboulés60S69S394434S4984995.02.03.04.05.010.025.05.050.0100.05.010.0Miscellaneous424438454494100.025.050.050.0100.010.025.0Exptl/Control
NET7.5/
8.47.1/8.47.0/
7.818.8/7.812.
8/7.811.7/8.210.5/8.28.0/
8.28.0/8.27.7/8.47.0/8.421.
2/7.87.0/8.47.3/8.47.4/8.47.5/8.47.
I/8.47.I/8.47.0/
8.46.1/8.45.5/
8.47.0/8.48.2/
8.4SURVIVAL
DATAPercent
ExtensionofMST644327172I20151154"ercent
Ci(di401785imulativelyofdeat6079877775Mortalityh)808714988217777r
1009872117182311810722888108887721
on June 7, 2018. © 1962 American Association for Cancer Research. cancerres.aacrjournals.org Downloaded from

600 CancerResearch Rutman et al.
TABLE 13A
EFFECT OF AUCYIATING AGENTS ON EHRLICH CARCINOMA
UPNo.DOSE mg/fcgSURVIVAL
DATAExptl/Control
MSTAlkylating
Agents -Mustard89D97S141B176S336358385419427428440S441S459S47447548048448648749349650050135.0*
0.40.835.01.01.52.0»
3.04.00.410.02.54.01.02.07.515.025.0*
1.0*2.02.55.07.525.050.02.03.0*
4.05.08.01.02.00.51.02.02.55.07.51.02.02.03.01.02.00.51.02.07.510.015.025.07.512.525.01.02.55.049.3/15.645.4/13.177.8/15.664.8/10.68.2/
8.27.6/8.68.4/8.27.3/8.48.0/
8.22.7/15.612.
2/9.4^64.0/10.6>40.
5/15.6>51.4/9.311.
9/9.37.6/9.38.4/9.36.9/
9.340.4/12.428.0/12.4>44.0/15.6>51.9/15.6>40.6/15.617.1/15.637.6/15.616.
9/15.722.9/15.720.2/12.112.5/15.76.4/
8.66.4/9.37.4/
9.337.2/9.340.6/9.39.9/
9.313.0/13.58.0/13.58.4/13.538.
2/9.38.3/9.324.
6/9.37.1/9.37.7/
9.37.5/9.324.4/13.547.8/13.547.5/13.59.3/13.510.5/13.510.2/13.512.5/13.57.2/13.56.5/13.56.5/13.512.5/13.524.3/13.57.9/13.5Percent
Extensionof MST152240400510305001604502820813318223216014046673003373101658125425280PeÃl.Sx60658070708090100201070354080506070552060602080106040708070•cent
Sui
2x5050707060604080206535407030502010605010703030708040•viving
!
3x403070705050208050254040304040507020207050it
Multi]
5x3030707030502050301530203040404020104040sie
ofK7x30257070305020301530202020202010104040ÃŽT
>7x3025707030502020153020202020104040
* PooledData.
on June 7, 2018. © 1962 American Association for Cancer Research. cancerres.aacrjournals.org Downloaded from

Vol. 22, No. 7, Part 2 Cancer Chemotherapy Screening Data 601
TABLE 13A(Concluded)
EFFECT OF ALKYLATING AGENTS ON EHRLICH CARCINOMA
UPNo.DOSE Å“g/k8SURVIVAL
DATAExptl/ControlMSTAlkylating
Agents -Mustard50250350450550.0100.050.0100.050.025.050.075.0100.031.7/13.55.9/13.510.
5/13.513.1/13.512.6/13.57.8/13.55.0/13.54.9/13.54.4/13.5Percent
Extensionof ÕCT135PeÃl.Sx70•cent
Svu
2x70-viving
E
3x20it
Mjlti
Sxpie
ofH7x3T
>7x
on June 7, 2018. © 1962 American Association for Cancer Research. cancerres.aacrjournals.org Downloaded from
602 CancerResearch Rutman et al.
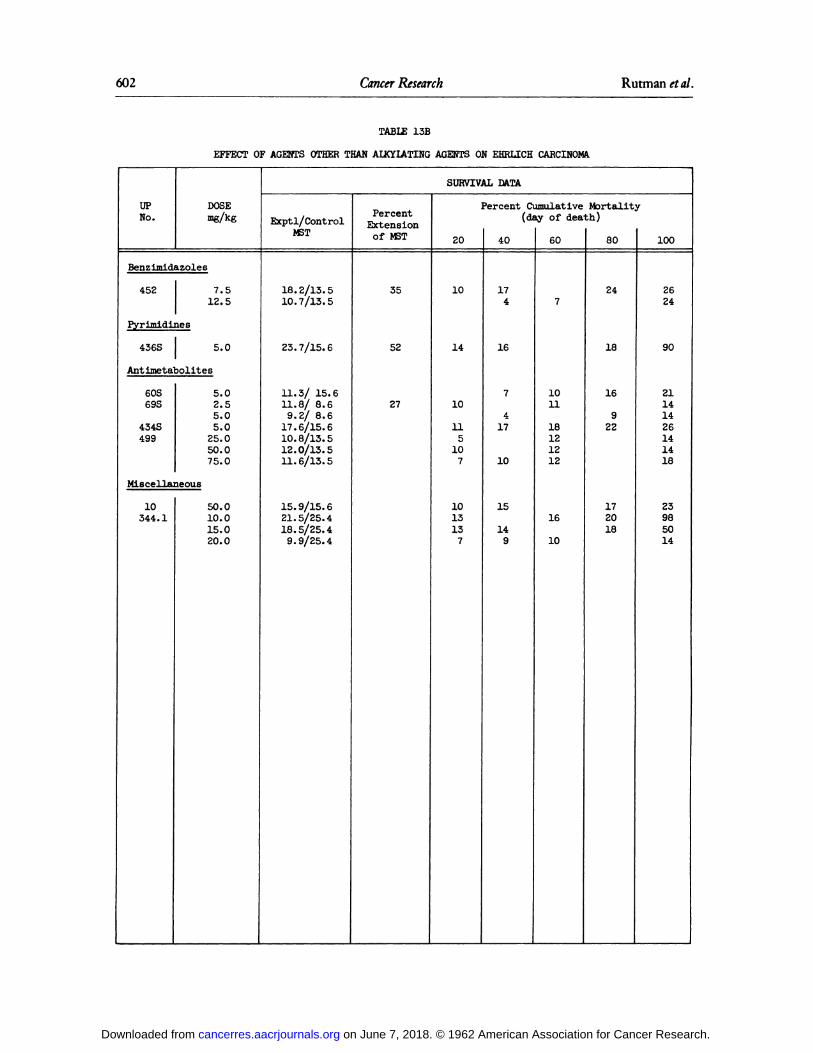
TABLE 13B
EFFECT OF AGENTS OTHER THAN ALKYIATING AGENTS ON EHRLICH CARCINOMA
UPNo.DOSEmg/kgBenzimidazoles4527.512.5Pyrimldines436S5.0Antlmetabolites60S69S434S4995.02.55.05.025.050.075.0Miscellaneous10344.150.010.015.020.0SURVIVAL
DATAExptl/ControlMST18.2/13.510.7/13.523.7/15.611.
3/15.611.8/8.69.2/
8.617.6/15.610.8/13.512.0/13.511.6/13.515.9/15.621.5/25.418.5/25.49.9/25.4Percent
ExtensionofMST355227Percent
CumulativeMortality(dayofdeath)2010141011510710131374017416741710151496071011181212121610802418169221720181002624902114142614141823985014
on June 7, 2018. © 1962 American Association for Cancer Research. cancerres.aacrjournals.org Downloaded from
Vol. 22, No. 7, Part 2 CancerChemotherapyScreening Data 603
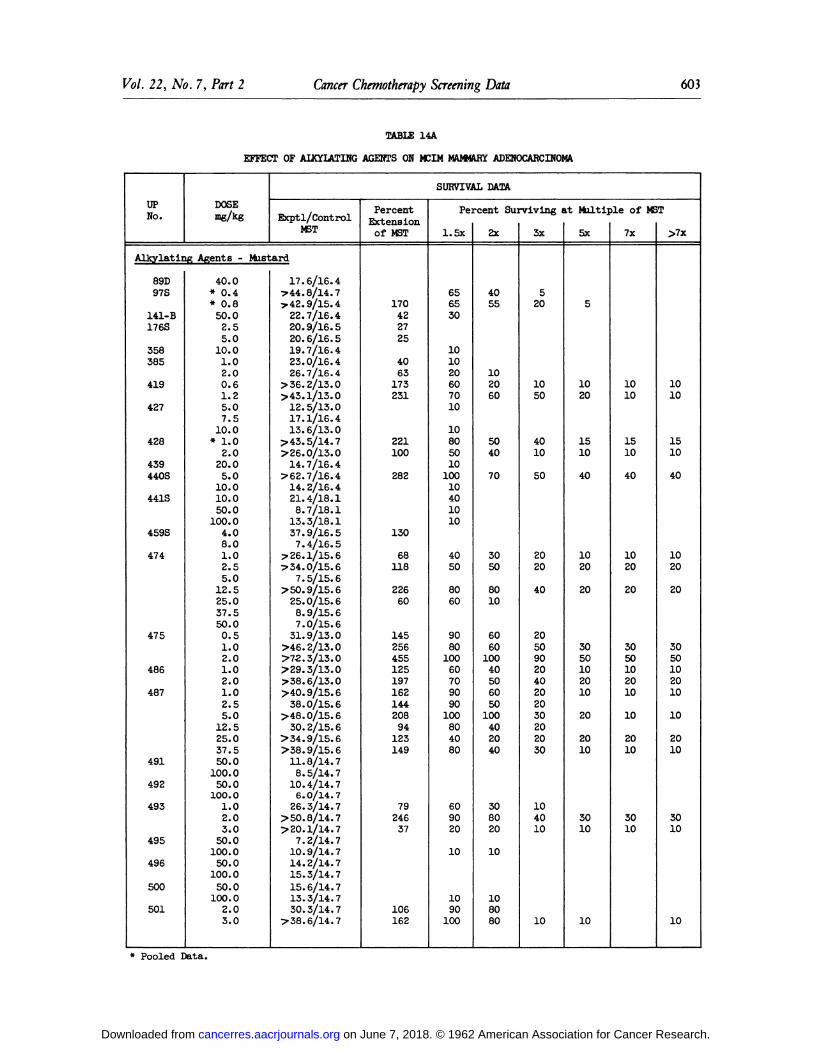
TABLE 14A
EFFECT OF AIKYLATING AGENTS OH MCIM MAMMARY ADENOCARCINOMA
UPNo.DOSE "«AßSURVIVAL
DATAExptl/ControlMSTAlkylating
Agents -Mustard89D97S141-
B176S358385419427428439440S441S459S47447548648749149249349549650050140.0*
0.4*0.850.02.55.010.01.02.00.61.25.07.510.0*
1.02.020.05.010.010.050.0100.04.08.01.02.55.012.525.037.550.00.51.02.01.02.01.02.55.012.525.037.550.0100.050.0100.01.02.03.050.0100.050.0100.050.0100.02.03.017.6/16.4>44.8/14.7>42.9/15.422.7/16.420.9/16.520.6/16.519.7/16.423.0/16.426.7/16.4>
36.2/13.0>43.1/13.012.5/13.017.1/16.413.6/13.0>43.5/14.7>26.
0/13.014.7/16.4>62.7/16.414.2/16.421.4/18.18.7/18.113.3/18.137.9/16.57.4/16.5y
26. 1/15.6?34. 0/15.67.5/15.6>
50. 9/15.625.0/15.68.9/15.67.0/15.631.9/13.0>46.
2/13.0>72.3/13.0>29.3/13.0>38.6/13.0>40.9/15.638.0/15.6>48.0/15.630.2/15.6>34.9/15.6>38.9/15.611.8/14.78.5/14.710.4/14.76.0/14.726.3/14.7>
50. 8/14.7>20.1/14.77.2/14.710.9/14.714.2/14.715.3/14.715.6/14.713.3/14.730.3/14.7>38.6/14.7Percent
ExtensionofMST17042272540631732312211002821306811822660145256455125197162144208941231497924637106162Percent
Surviving at Multiple ofMST1.5x6565301010206070101080501010010401010405080609080100607090901008040806090201010901002x405510206050407030508010606010040506050100402040308020101080803x52010504010502020402050902040202030202030104010105x5102015104010202030501020102020103010107x101015104010202030501020101020103010>7x10101510401020203050102010102010301010
* PooledData.
on June 7, 2018. © 1962 American Association for Cancer Research. cancerres.aacrjournals.org Downloaded from
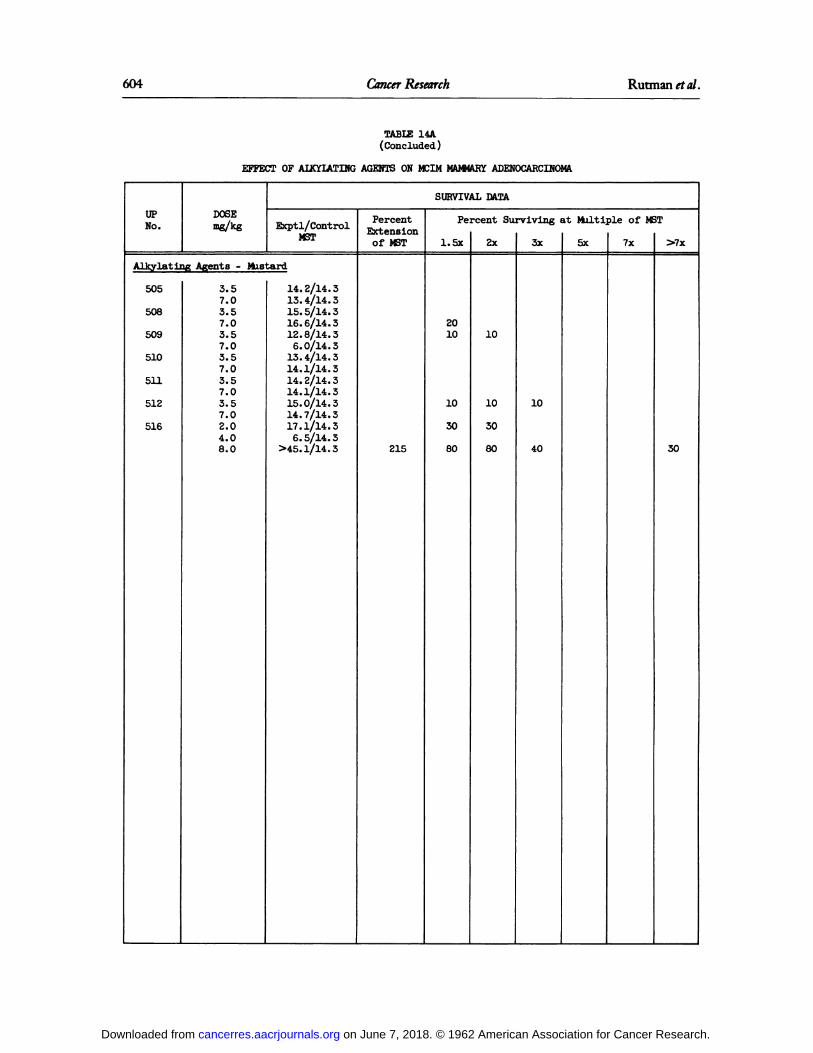
604 CancerResearch
TABLE 14A(Concluded)
EFFECT OF ALKYIATING AGENTS ON MCIM MAMMARY ADENOCARCINOMA
UPNo.DOSE mg/kgSURVIVAL
DATAExptl/Control
MSTAlkylating
Agents -Mustard5055085095105115125163.57.03.57.03.57.0
3.57.03.57.03.57.0
3.04.08.014.2/14.313.4/14.315.5/14.316.6/14.312.8/14.36.0/14.3
13.4/14.314.1/14.314.
2/14.314.1/14.315.0/14.314.7/14.3
17.1/14.36.5/14.3
>45.1/14.3Percent
Extensionof MST215Pe1.5x20101030
80rcent
Su.
2x101030
80rviving
i
3x1040it
Multi.
5xale
of M
7x;T>7x30
on June 7, 2018. © 1962 American Association for Cancer Research. cancerres.aacrjournals.org Downloaded from

Vol. 22, No. 7, Part 2 CancerChemotherapyScreening Data 605
TABLE 14B
EFFECT OF AGENTS OTHER THAN AIKYLATING AGENTS ON MCIM MAMMARY ADENOCARCINOMA
UPNo.DOSEmg/kgBenzimidazoles458Pyrimidir436SAntimetat60S69S434S499Miscellar105145156.09.0Ães5.0olites5.02.04.05.040.0leous50.0100.00.10.20.50.10.20.5SURVIVAL
DATAExptl/ControlMST13.8/14.711.0/14.719.0/16.534.3/16.57.8/16.5.6.0/16.519.2/16.59.5/14.716.0/18.17.2/16.415.0/14.312.0/14.314.1/14.312.5/14.316.2/14.324.7/14.3Percent
ExtensionofMST10874Percent
Cumulative Mortality(day ofdeath)20742616767166204010153075188131314236016916151613248015358211817202710019163056972315212025162530
on June 7, 2018. © 1962 American Association for Cancer Research. cancerres.aacrjournals.org Downloaded from

606 CancerResearch Rutmanrta/.
TABLE 15
EFFECT OF TEST COMPOUNDS ON Hep 134 PARENCHYMA! CELL TUMOR
UPNo.DOSE mg/kgSURVIVAL
DATAExptl/ControlMSTAlkylating
Agents -Mustard89D973141B176S193252326336352358362385411419426427428440S441S449450459S47447548448648749125.050.0*
0.4*0.835.070.01.53.01.00.550.01.02.010.050.07.515.01.02.0*
1.02.54.05.0*
1.02.01.02.55.015.025.0«
1.0*2.04.08.030.060.05.010.05.010.04.08.01.02.01.02.01.02.01.02.00.5*
1.0»2.03.050.0100.016.0/18.518.0/18.522.7/21.818.6/21.820.1/18.510.8/18.59.3/15.58.2/15.515.5/15.111.2/18.513.8/15.19.0/15.13.3/15.11.0/18.515.8/18.513.8/18.515.5/18.510.1/18.57.1/18.517.2/15.913.7/18.59.5/13.317.5/15.113.4/15.311.6/15.513.0/15.111.6/15.114.8/15.19.0/15.56.3/15.520.7/14.612.6/14.417.7/15.512.4/15.512.8/15.57.1/15.510.3/13.313.
6/13.39.8/13.312.3/13.37.7/15.57.0/15.511.3/15.57.6/15.525.6/15.513.2/15.512.9/15.57.0/15.520.2/15.57.0/15.58.2/11.711.3/13.629.3/13.98.6/14.07.6/14.46.8/14.4Percent
ExtensionofMST5729706530Percent
CumulativeMortality(dayofdeath)2081214127814122149713881110167991058877710789175540718871610911141214751781411129911725714523601419159761431517718101911711712982510802524232721121782214716211391226162319982918161077100293850394021111418211721711921251882324122222351514171683131241615815211114107158312936729713133925157
* PooledData.
on June 7, 2018. © 1962 American Association for Cancer Research. cancerres.aacrjournals.org Downloaded from
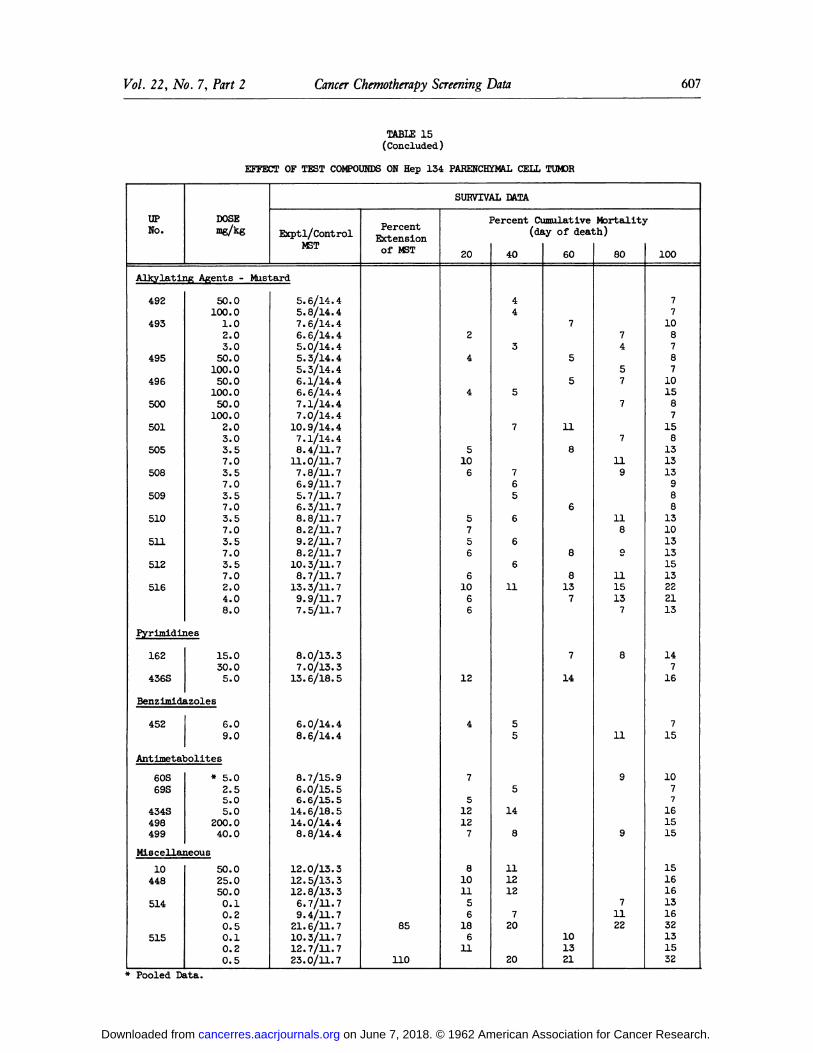
Vol. 22, No. 7, Part 2 CancerChemotherapyScreening Data 607
TABLE15(Concluded)
EFFECT OF TEST COMPOUNDS ON Hep 134 PARENCHYMAL CELL TUMOR
UPNo.DOSE mg/kgSURVIVAL
DATAExptl/ControlMSTAlkylating
Agents-Mustard49249349549650050150550850951051151251650.0100.01.02.03.050.0100.050.0100.050.0100.02.03.03.57.03.57.03.57.03.57.03.57.03.57.02.04.08.0Pyrimidines162436S15.030.05.0Benzimidazoles4526.09.0Antimetabolites60S69S434S498499*
5.02.55.05.0200.040.0Miscellaneous1044851451550.025.050.00.10.20.50.10.20.55.6/14.45.8/14.47.6/14.46.6/14.45.0/14.45.3/14.45.3/14.46.1/14.46.6/14.47.1/14.47.0/14.410.9/14.47.1/14.48.4/11.711.0/11.77.8/11.76.9/11.75.7/11.76.3/11.78.8/11.78.2/11.79.2/11.78.2/11.710.3/11.78.7/11.713.3/11.79.9/11.77.5/11.78.0/13.37.0/13.313.6/18.56.0/14.48.6/14.48.7/15.96.0/15.56.6/15.514.6/18.514.0/14.48.8/14.412.0/13.312.5/13.312.8/13.36.7/11.79.4/11.721.6/11.710.3/11.712.7/11.723.0/11.7Percent
ExtensionofMST85110Percent
CumulativeMortality(dayofdeath)2024451065756610661247512127810115618611404435776566611555148111212720206075511868813771410132180745777119118O1115137811997112210077108787101587158131313988131013131513222113147167151077161515151616131632131532
* PooledData.
on June 7, 2018. © 1962 American Association for Cancer Research. cancerres.aacrjournals.org Downloaded from

608 CancerResearch Rutmanrta/.
TABLE16
EFFECTOF TEST COMPOUNDSON DBA/2THYMOMA
UPNo.DOSE mg/kgSURVIVAL
DATAExptl/Control
unirE>-LAlkylating
Agents-Mustard97S176S385419427428440S441S458459S4744754844864870.42.55.00.51.02.04.01.02.015.020.01.02.02.454.3*
7.5»15.030.045.060.030.060.05.010.020.02.54.05.08.010.01.02.01.02.01.02.02.03.01.02.0Pyrlmidines436S5.0Antimetabolites60S69S434S5.02.02.54.05.05.015.
5/14.615.6/14.416.3/14.414.1/14.615.9/14.614.7/14.617.1/14.623.3/14.413.3/14.417.4/14.415.5/14.418.1/14.417.0/14.416.0/14.619.0/14.621.
7/14.26.6/13.66.4/13.45.1/13.44.1/13.417.3/15.318.3/15.39.7/14.69.4/14.66.0/14.69.6/14.619.5/14.415.9/14.613.
7/14.47.1/14.615.9/14.418.4/14.419.4/14.419.7/14.420.3/14.418.4/14.415.3/14.48.0/14.419.5/14.419.7/14.417.3/14.420.8/14.418.3/14.617.9/14.413.6/14.611.0/14.416.1/14.4Percent
ExtensionofÃŽ6T6226305335283537412835374525Percent
CumulativeMortality(dayofdeath)201314159161471511171613173161278715171418199771716111612771440141516151715161851813818181019219156015171615172217198841019171219212119817198801816171818181825111111187192222161610021171816181819901821192119182130777518231515181422212381721252421282211212118242123211922
* PooledData.
on June 7, 2018. © 1962 American Association for Cancer Research. cancerres.aacrjournals.org Downloaded from

1962;22:559-608. Cancer Res R. J. Rutman, F. S. Lewis, S. Buckner, et al. Mouse Ascites Tumors. IIIEvaluation of Chemotherapeutic Agents against a Variety of
Updated version
http://cancerres.aacrjournals.org/content/22/7_Part_2/559.citation
Access the most recent version of this article at:
E-mail alerts related to this article or journal.Sign up to receive free email-alerts
Subscriptions
Reprints and
To order reprints of this article or to subscribe to the journal, contact the AACR Publications
Permissions
Rightslink site. Click on "Request Permissions" which will take you to the Copyright Clearance Center's (CCC)
.http://cancerres.aacrjournals.org/content/22/7_Part_2/559.citationTo request permission to re-use all or part of this article, use this link
on June 7, 2018. © 1962 American Association for Cancer Research. cancerres.aacrjournals.org Downloaded from