experimental study on wave interactions with a fixed ... · experimental study on wave interactions...
TRANSCRIPT
Proceedings of The Twelfth (2002) International Offshore and Polar Engineering Conference Kitakyushu, Japan, May 26-31, 2002 Copyright 0 2002 by The International Society of Offshore and Polar Engineers ISBN l-880653-58-3 (Set); ISSN 1098-6189 (Set)
Experimental Study on Wave Interactions with a Fixed Rectangular Barge in a Beam Sea
Kwang Hyo Jung, Kuang-An Chang, and Hamn-Ching Chen Erick T. Huang
Ocean Engineering Program, Department of Civil Engineering Naval Facilities Engineering Service Center
Texas A&M University, College Station, Texas, U.S.A. Amphibious System Division, Port Hueneme, California, U. S.A
ABSTRACT
This paper presents an experimental study on wave interactions with a rectangular barge in a beam sea condition. Regular waves with a wave period the same as the natural frequency of the barge were used in the experiments due to the fact that the barge is prone to capsizing under such waves. The barge was fixed on the free surface and no wave overtopping was assumed. Particle Image Velocimetry (PIV) was employed to measure the full-field two-dimensional velocity. Since the
flow is highly turbulent, the phase-averaging technique was used to the extract the mean flow and turbulence properties. The mean flow pattern, including velocity, vorticity, and streamline, was analyzed to quantify the mechanism of the interactions. The generation and evolution of vorticity and turbulence kinetic energy were demonstrated. The turbulent kinetic energy is found to highly correlate with the vorticity field
KEY WORDS: Rectangular barge; particle image velocimetry; turbulence; water waves; ocean engineering
vorticity is straightforward. This helps the understanding of vortex generation and evolution in the problem. Dong et al. (1997) studied the flow and wave structures near the bow of a ship model were studied using PIV. Moreover, the origination of vorticity within the wave and its relationship to the flow near the surface and shape of the wave were addressed by Rood (1994, 1995) and Dabiri and Gharib (1997). On the other hand, Chen et al. (2001) developed a Reynolds-Averaged Navier- Stokes (RANS) numerical model to investigate the barge roll responses under large amplitude waves. Subsequently, Chen et al. (2002) simulated vortex structures and flow separation patterns when a pontoon barge is partially submerged with the RANS method employed in conjunction with a domain decomposition approach.
The purpose of this study is a preliminary investigation of the flow structure around a fixed rectangular barge interacting with regular waves. This is the fist step in the study of interactions between the waves and the rectangular barge motion for better understanding of the capsizing mechanism. The present study can be extended to the analysis of the flow characteristics in the vicinity of a floating breakwater.
EXPERIMENTAL SET-UP AND CONDITION INTRODUCTION
Particle image Velocimetry (PIV) is a non-intrusive velocity measurement technique that allows one to acquire images from a flow and to extract the velocity information out of these images. The technique generally provides full field instantaneous spatial quantitative velocity information. The technique has been applied in a variety of fluid mechanics problems, including kinematics in the crest region in the water wave study.
It is known that a rectangular barge model is prone to capsize in a beam sea under regular waves with a wave period the same as the natural period of the barge roll motion when the barge freely floats in a 2D wave tank. The general trend to study ship motion forced by waves is to measure the corresponding motion of ship against incident waves. Measurements of detailed flow kinematics are rare. With the help of PIV, the quantitative flow information and flow pattern as well as the ship motion can all be captured. Therefore, PIV can play a role in the prediction of ship motion and the design for better stability. In addition, through spatial velocity measurement, computation of
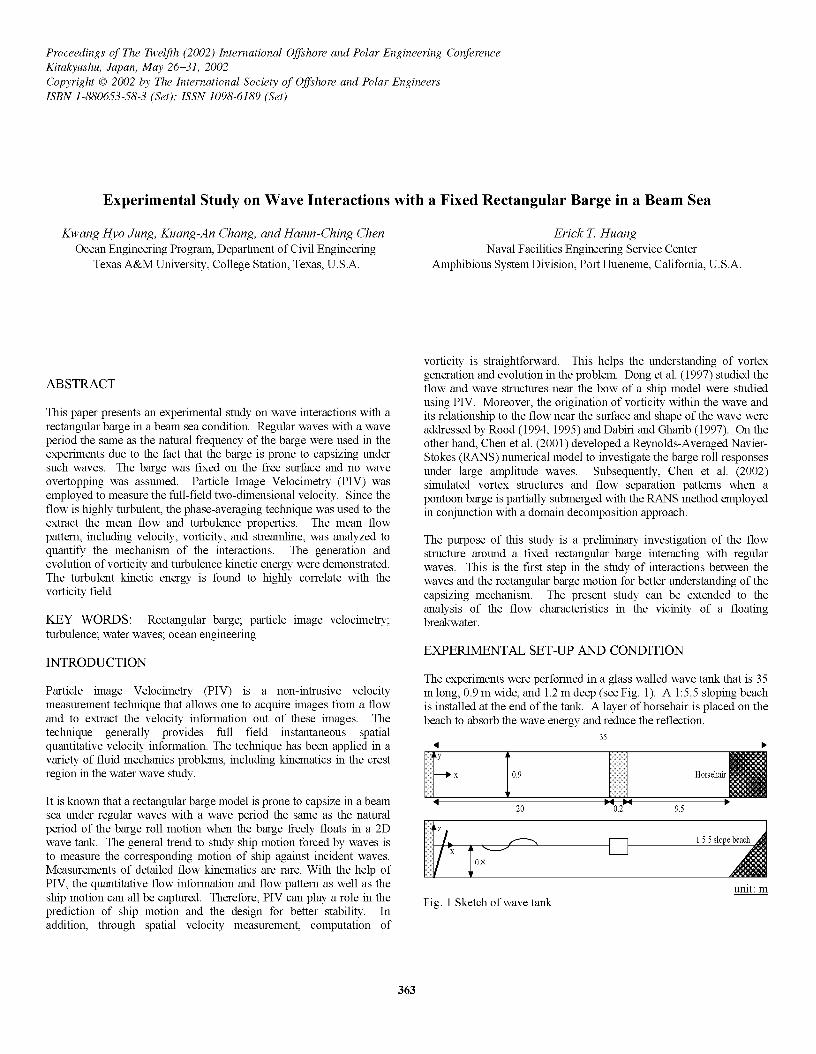
The experiments were performed in a glass walled wave tank that is 35 m long, 0.9 m wide, and 1.2 m deep (see Fig. 1). A 1:5.5 sloping beach is installed at the end of the tank. A layer of horsehair is placed on the beach to absorb the wave energy and reduce the reflection.
35 4
4 20 -oo.2- 9.5
unit: m Fig. 1 Sketch of wave tank
363
The wavemaker is of dry back flap type. The flap is driven by a synchronous servo-motor controlled by a computer, and hydrostatically balanced using an automatic near constant force and a pneumatic control system. Two double-wired resistant-type wave gauges were used to measure the free surface elevation at 100 Hz. The signal from the wave gauges was converted to voltage and sent to a data acquisition board housed in a computer. The wave gauges were located at 4 cm in front and behind the barge to measure the wave elevation within the PIV field of views at both the weather side and lee side.
The barge model was made of wood and built in the Froude number similarity of a scale factor of l/38.1, which is 0.9 m long (L), 0.2 m wide (B), and 0.064 m high (TB) with a 0.032 m draft (0) of one-half of its height. The barge model was fixed at the position 20 m from the wavemaker. The wavemaker generated regular waves of 1.0 second wave period (r) and 0.04 m wave height (H) at the 0.8 m water depth, giving a wave length (1) of 1.56m. The experiments were conducted
close to the deep-water condition of (h/1 > 0.5) and in the quasi-
steady state, which was achieved after running the wavemaker for about 15 minutes.
The Reynolds number (Re) is believed to be the important parameter for the generation and evolution of vortices in the wake around a bottom mounted body in oscillatory flows (Chang, 1999). It is defined as
where U,,, is the maximum water particle velocity, B is the barge
width, and v is the kinematic viscosity. The present experiment has a
Reynolds number of 1 .92x104. It is known that the flow pattern for a steady flow around a circular cylinder is not strongly dependent on Reynolds number if Reynolds number is between 300 and 3~10~ (Sarpkaya and Isaacson, 1981; Sumer and Fredsoe, 1997). However, Reynolds number has significant influence on the vortex strength in the flow in the case of wave interactions with a rectangular obstacle fixed on the bottom (Chang, 1999). It is expected that the similar effect applies to the present study.
PIV IMAGING TECHNIQUE
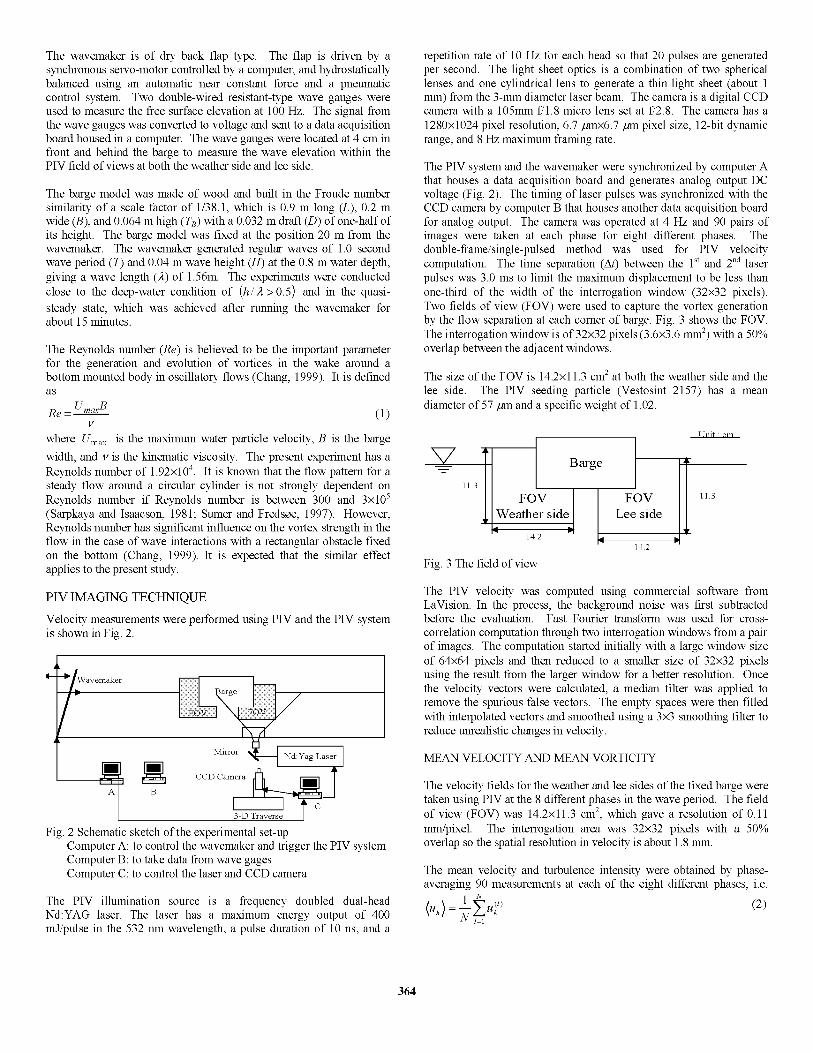
Velocity measurements were performed using PIV and the PIV system is shown in Fig. 2.
Fig. 2 Schematic sketch of the experimental set-up Computer A: to control the wavemaker and trigger the PIV system Computer B: to take data from wave gages Computer C: to control the laser and CCD camera
The PIV illumination source is a frequency doubled dual-head Nd:YAG laser. The laser has a maximum energy output of 400 mJ/pulse in the 532 nm wavelength, a pulse duration of 10 ns, and a
repetition rate of 10 Hz for each head so that 20 pulses are generated per second. The light sheet optics is a combination of two spherical lenses and one cylindrical lens to generate a thin light sheet (about 1 mm) from the 3-mm diameter laser beam. The camera is a digital CCD camera with a 105mm f/1.8 micro lens set at f/2.8. The camera has a 1280x1024 pixel resolution, 6.7 ~~6.7 p pixel size, 12-bit dynamic range, and 8 Hz maximum framing rate.
The PIV system and the wavemaker were synchronized by computer A that houses a data acquisition board and generates analog output DC voltage (Fig. 2). The timing of laser pulses was synchronized with the CCD camera by computer B that houses another data acquisition board for analog output. The camera was operated at 4 Hz and 90 pairs of images were taken at each phase for eight different phases. The double-frame/single-pulsed method was used for PIV velocity computation. The time separation (At) between the lst and 2”d laser pulses was 3.0 ms to limit the maximum displacement to be less than one-third of the width of the interrogation window (32x32 pixels). Two fields of view (FOV) were used to capture the vortex generation by the flow separation at each corner of barge. Fig. 3 shows the FOV. The interrogation window is of 32x32 pixels (3.6x3.6 mm’) with a 50% overlap between the adjacent windows.
The size of the FOV is 14.2x1 1.3 cm2 at both the weather side and the lee side. The PIV seeding particle (Vestosint 2157) has a mean diameter of 57 p and a specific weight of 1.02.
y . Barge 4
11 3 FOV FOV 113
Weather side Lee side 4 l .
142 4 l 142
Fig. 3 The field of view
The PIV velocity was computed using commercial software from LaVision. In the process, the background noise was fist subtracted before the evaluation. Fast Fourier transform was used for cross- correlation computation through two interrogation windows from a pair of images. The computation started initially with a large window size of 64x64 pixels and then reduced to a smaller size of 32x32 pixels using the result from the larger window for a better resolution. Once the velocity vectors were calculated, a median filter was applied to remove the spurious false vectors. The empty spaces were then filled with interpolated vectors and smoothed using a 3x3 smoothing filter to reduce unrealistic changes in velocity.
MEAN VELOCITY AND MEAN VORTICITY
The velocity fields for the weather and lee sides of the fixed barge were taken using PIV at the 8 different phases in the wave period. The field of view (FOV) was 14.2x1 1.3 cm’, which gave a resolution of 0.11 mm/pixel. The interrogation area was 32x32 pixels with a 50% overlap so the spatial resolution in velocity is about 1.8 mm.
The mean velocity and turbulence intensity were obtained by phase- averaging 90 measurements at each of the eight different phases, i.e.
364

where the symbol < > represents the ensemble average, $) is the k-
component velocity obtained from the Ith instantaneous velocity measurement, and N is the total number of instantaneous velocity at that phase. The vorticity estimated at point (i, j) based on the circulation calculated using the eight neighboring points is as following
- +&l,J+l + 2%I,, + WI-1,1-l 1
Eq. 3 is equivalent to applying the central-differences scheme to a smoothed ( 3 x 3 kernel) velocity field. The uncertainty in the vorticity
estimate, assuming uncorrelated velocity data, reduces to E~ =0.61&, lb comparing to E~ =E~ lb using central differences,
or to Ed =1.34&, lbx using Richardson extrapolation (Raffel et al.,
1998).
TURBULENT KINETIC ENERGY
The instantaneous velocity was decomposed into the mean velocity and turbulent fluctuations using the Reynolds decomposition
u, =(u,)+u; (4)
where prime denotes the turbulent fluctuations. Because only two velocity components were measured, the turbulence intensity is defined as
I = (u’u’+w’ w’) x (5)
where u’ and w’ are the velocity fluctuations in x and z directions,
respectively. The turbulent kinetic energy, k, is defined as
(6)
The coefficient 1.33 is obtained from the assumption that the flow around the barge is similar to a plane wake (Svendsen, 1987).
EXPERIMENTAL RESULTS AND DISCUSSION
The energy transmission and reflection were estimated from the wave elevation taken by wave gages under the assumption of an identical partition of the potential energy and kinetic energy. In the present study, two wave gauges were used with one located at 10 m in front of the barge (10 m in front of the wavemaker) and another 2 m behind the barge. The transmission coefficient, KT, is defined as the ratio of the transmitted wave height (HT) to the incident wave height (HI). For a breakwater, this coefficient represents the performance of the breakwater. In this experiment (B//1 = 0.125), the transmission coefficient was found to be 0.75 which is close to the value of 0.7 in Fugazza and Natale (1988).
To estimate the reflection coefficient, the wave elevation was measured by moving the wave gauges along the tank at every 5 cm for a distance of about one wavelength to find the values of maximum (H,,) and minimum (H-J heights of the standing wave envelop (Hughes, 1993). The reflection coefficient, KR, is then obtained using
K, = 9 = %ax - %m (7)
The refleition 17 max + %m coefficient between the wavemaker and barge was found
to be 0.49. Similarly, the reflection coefficient between the barge and horsehair covered beach at the end of the tank was 0.066. The transmitted energy (KT2) is 0.56 and reflected energy (KR2) is 0.24. Therefore, the fixed barge in this experiment dissipated about 20% of the wave energy during the interaction. Note that, unlike the transmission coefficient measured before the refection from the beach, the reflection coefficient was measured under the quasi-steady condition.
Fig. 4 Wave elevation measurements taken at a distance of 4 cm from each side of the barge. The alphabets (a) to (h) represent the phases in Figs. 5-6
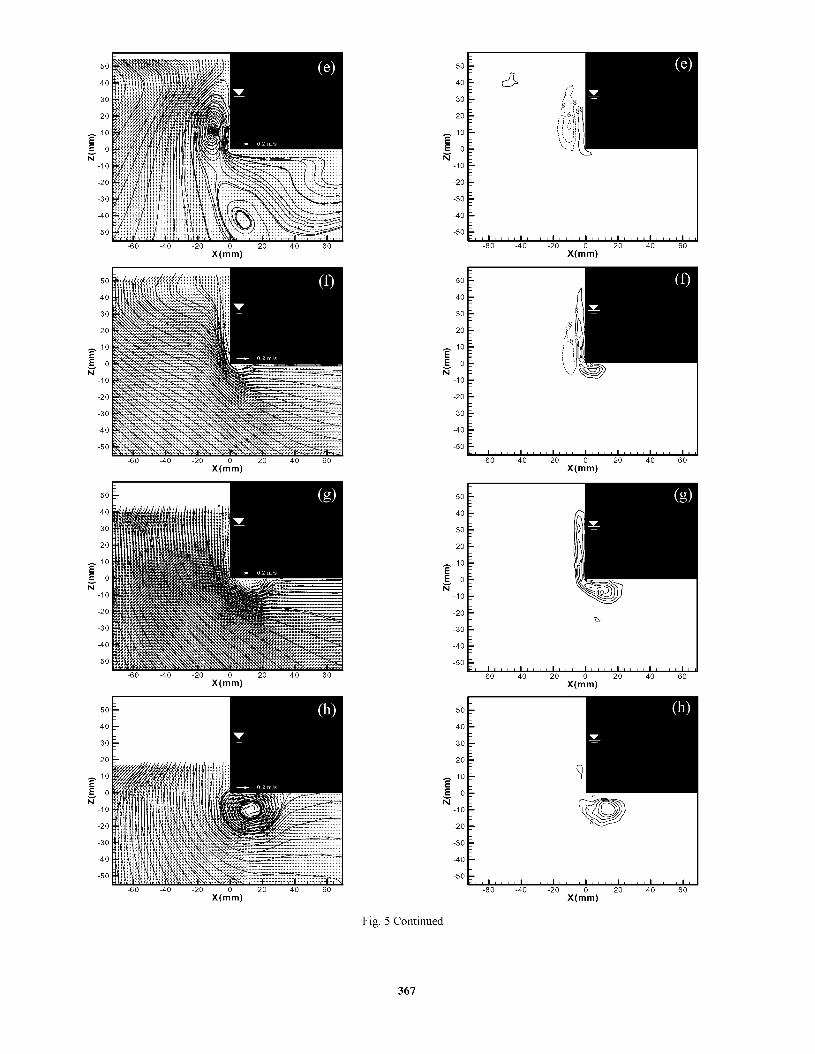
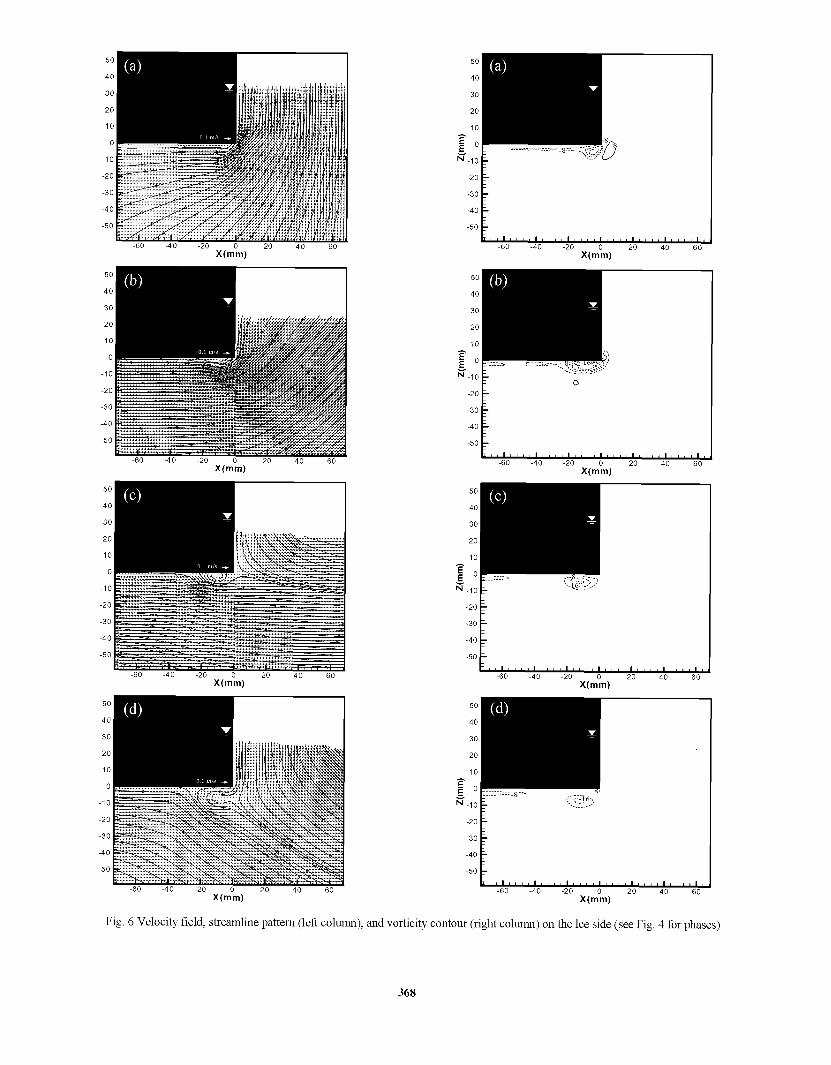
In the quasi-steady condition, the transmitted wave height on the lee side is only one half of the wave height measured on the weather side, as shown in Fig. 4. This gives notably different vortex patterns and associated vorticity strength on the weather side and the lee side. The mean velocity and vorticity fields and streamline for each phase at both the weather and lee sides of the barge are shown in Figs. 5-6, respectively. The distances (AX, AZ) between the adjacent velocity vectors in the x and z directions are the same and equal to 1.8 mm (16 pixels). The alphabets a to h in Fig. 4 correspond to the phases in Figs. 5-6. Solid lines indicate counterclockwise (positive) vorticity while dotted lines indicate clockwise (negative) vorticity. The contour lines starts from 40 s-l for clockwise vorticity and 40 s-l for counterclockwise vorticity with an increment of -8 s-l and 8 s-l, respectively, between the contour lines in the figures. The clockwise and counterclockwise vorticities are mainly created around the barge comers due to flow separation. On the weather side, the flow separation starts at the sidewall of the barge comer when the flow starts to reverse its direction (the free surface is roughly lever-up from the trough) (Fig. 5(b)), and at the bottom of the barge comer when the velocity starts to change to the downstream direction (free surface roughly level-down from the crest) (Fig. 5(f)). As expected, the movement of vorticity is strongly related to the wave elevation and velocity around the fixed barge. From the streamline pattern and vorticity field one clearly sees the development and evolution of the vorticity, including the variation of the reattachment point on the barge surface.
On the lee side, the vorticity pattern and strength (the maximum absolute vorticity) are quite different with that of the weather side. Unlike the lee side vortices, the location of the reattachment point on the weather side moves farther upward on the barge sidewall (Figs. 5(b-d)), and moves farther on the barge bottom in the direction of wave propagation (Figs. 5(f-h) and 5(a)). For the forward motion, the vorticity keeps on developing while the reattachment length continuous to increase to about the length of the wave particle trajectory, S (= 4 cm), after the flow starts to separate at the comer. Note that the
365
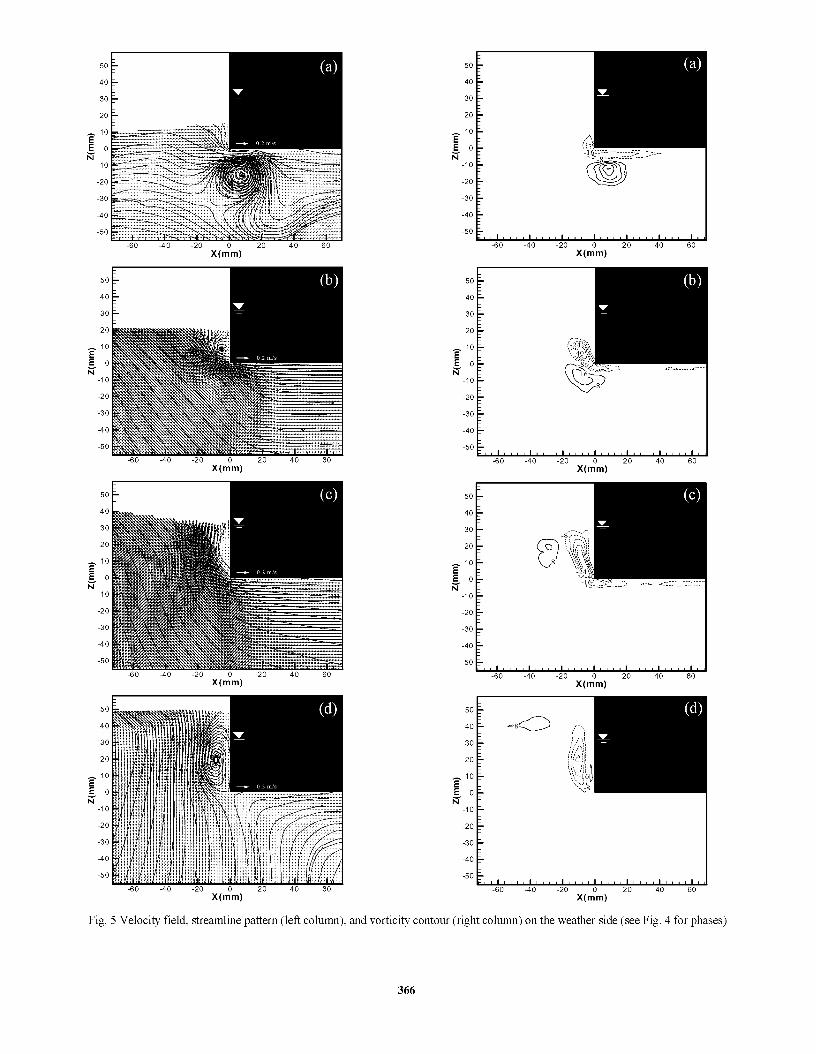
Fig. 5 Velocity field, streamline pattern (left column), iortic :ity
50
40
30
20
z 10
E o Ki
-10
.5oF,, , , , , , , , , , , , 1 -60 -40 -20
X(Al, 20 40 60
-50ti X(Al,
(right column) on the weather side (see Fig. 4 for phases
366
-60 -40 -20 X(Al,
20 40 60
-60 -40 -20 X(Al,
20 40 60 -60 -40 -20 X(Al,
20 40 60
-60 -40 -20 X(Al,
20 40 60
Fig. 5 Continued
367
A(mm)
50
40
30
20
10
0
-10
-20
-30
-40
-50
-60 -40 -20
X(mOm) 20 40 60
;:I, ‘-do’, , , ,, ,, , , , , , , , -40 -20 XhO~, 20 40 60
0
.J, ‘-do’, , , ,, ,, , , ,, , , ,c -40 -20
X(mOm) 20 40 60
:i[, ‘-do’, , , , , , , , , , ~
-40 -20 X(mOm)
20 40 60
$ ‘-do’, ,, ,, ,, ,, , ,, ,, -40 -20
X(m’m) 20 40 60
Fig. 6 Velocity field, streamline pattern (left column), and vorticity contour (right column) on the lee side (see Fig. 4 for phases)
368

X(mm)
X(mm)
X(mm)
X(mm)
3--&-&J -60 -40 -20
X(mOm) 20
50
40
30
20
10
E 0
~-10
-20
~“1”“““““““““,,“‘,“,“1 -60 -40 -20 X(m’m) 20 40 60
iI, ,, , , , , ,, ,, ‘40’, , ,:j -60 -40 -20
X(m’m) 20
50
40
30
20
10
EO
~-10
-20
$, , , , , , , , , , , , , ‘60’, ,(I -60 -40 -20
X(m’m) 20
Fig. 6 Continued
369
reattachment length for the backward motion on the lee side is only about 0.5s which is one-half of that on the weather side. Interestingly, this is similar to the free surface comparison between the lee side and the weather side. The similar characteristics also apply to the vorticity strength: the maximum absolute vorticity on the lee side is about one half of that on the weather side.
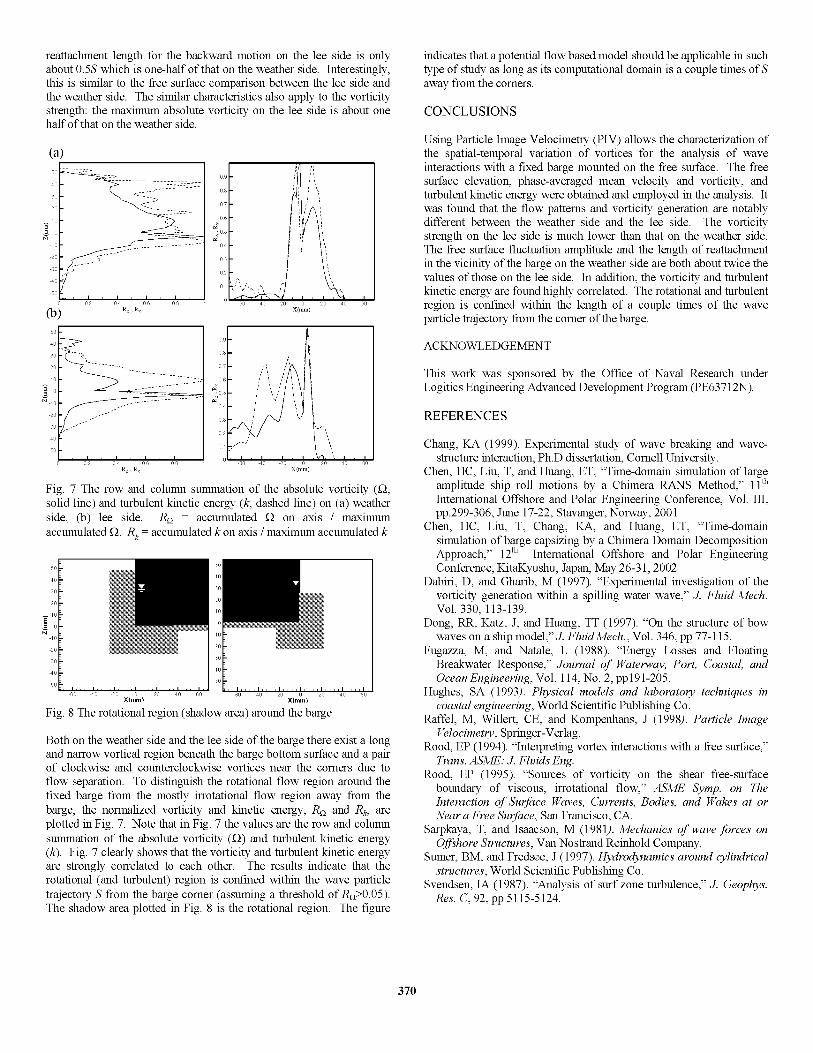
Fig. 7 The row and column summation of the absolute vorticity (I solid line) and turbulent kinetic energy (k, dashed line) on (a) weather side, (b) lee side. Rn = accumulated n on axis / maximum accumulated a. R, = accumulated k on axis / maximum accumulated k
so- j”M xdm, mom, Fig. 8 The rotational region (shadow area) around the barge
Both on the weather side and the lee side of the barge there exist a long and narrow vertical region beneath the barge bottom surface and a pair of clockwise and counterclockwise vortices near the comers due to flow separation. To distinguish the rotational flow region around the fixed barge from the mostly irrotational flow region away from the barge, the normalized vorticity and kinetic energy, Rn and Rk, are plotted in Fig. 7. Note that in Fig. 7 the values are the row and column summation of the absolute vorticity (a) and turbulent kinetic energy (k). Fig. 7 clearly shows that the vorticity and turbulent kinetic energy are strongly correlated to each other. The results indicate that the rotational (and turbulent) region is confined within the wave particle trajectory S from the barge comer (assuming a threshold of R$-0.05). The shadow area plotted in Fig. 8 is the rotational region. The figure
indicates that a potential flow based model should be applicable in such type of study as long as its computational domain is a couple times of S away from the comers.
CONCLUSIONS
Using Particle Image Velocimetry (PIV) allows the characterization of the spatial-temporal variation of vortices for the analysis of wave interactions with a fixed barge mounted on the free surface. The free surface elevation, phase-averaged mean velocity and vorticity, and turbulent kinetic energy were obtained and employed in the analysis. It was found that the flow patterns and vorticity generation are notably different between the weather side and the lee side. The vorticity strength on the lee side is much lower than that on the weather side. The free surface fluctuation amplitude and the length of reattachment in the vicinity of the barge on the weather side are both about twice the values of those on the lee side. In addition, the vorticity and turbulent kinetic energy are found highly correlated. The rotational and turbulent region is confined within the length of a couple times of the wave particle trajectory from the comer of the barge.
ACKNOWLEDGEMENT
This work was sponsored by the Office of Naval Research under Logitics Engineering Advanced Development Program (PE63712N).
REFERENCES
Chang, KA (1999). Experimental study of wave breaking and wave- structure interaction, Ph.D dissertation, Cornell University.
Chen, HC, Liu, T, and Huang, ET, “Time-domain simulation of large amplitude ship roll motions by a Chimera RANS Method,” llth International Offshore and Polar Engineering Conference, Vol. III, pp.299-306, June 17-22, Stavanger, Norway, 2001
Chen, HC, Liu, T, Chang, KA, and Huang, ET, “Time-domain simulation of barge capsizing by a Chimera Domain Decomposition Approach,” 12th International Offshore and Polar Engineering Conference, KitaKyushu, Japan, May 26-3 1,2002
Dabiri, D, and Gharib, M (1997). “Experimental investigation of the vorticity generation within a spilling water wave,” J. Fluid Mech. Vol. 330, 113-139.
Dong, RR, Katz, J, and Huang, TT (1997). “On the structure of bow waves on a ship model,” J. FluidMech., Vol. 346, pp 77-115.
Fugazza, M, and Natale, L (1988). “Energy Losses and Floating Breakwater Response,” Journal of Waterway, Port, Coastal, and Ocean Engineering, Vol. 114, No. 2, ~~191-205.
Hughes, SA (1993). Physical models and laboratoy techniques in coastal engineering, World Scientific Publishing Co.
Raffel, M, Willert, CE, and Kompenhans, J (1998). Particle Image Velocimety, Springer-Verlag.
Rood, EP (1994). “Interpreting vortex interactions with a free surface,” Trans. ASME: J. Fluids Erg.
Rood, EP (1995). “Sources of vorticity on the shear free-surface boundary of viscous, n-rotational flow,” ASME Symp. on The Interaction of Surface Waves, Currents, Bodies, and Wakes at or Near a Free Surface, San Francisco, CA.
Sarpkaya, T, and Isaacson, M (1981). Mechanics of wave forces on Offshore Structures, Van Nostrand Reinhold Company.
Sumer, BM, and Fredsae, J (1997). Hydrodynamics around cylindrical structures, World Scientific Publishing Co.
Svendsen, IA (1987). “Analysis of surf zone turbulence,” J. Geophys. Res. C, 92, pp 5115-5124.
370