february 2007 - the changing demographic landscape of higher education1 student demographic...
Post on 22-Dec-2015
218 views
TRANSCRIPT

February 2007 - The Changing Demographic Landscape of Higher Education
1
Student Demographic Student Demographic Projections, Public Projections, Public
Policy Questions and the Policy Questions and the Impact on Higher Impact on Higher
EducationEducationKnowing who is (and is not) knocking at the Knowing who is (and is not) knocking at the college doorcollege door
Becky Brodigan College Board Regional ForumMiddlebury College February 2007
February 2007 - The Changing Demographic Landscape of Higher Education
2
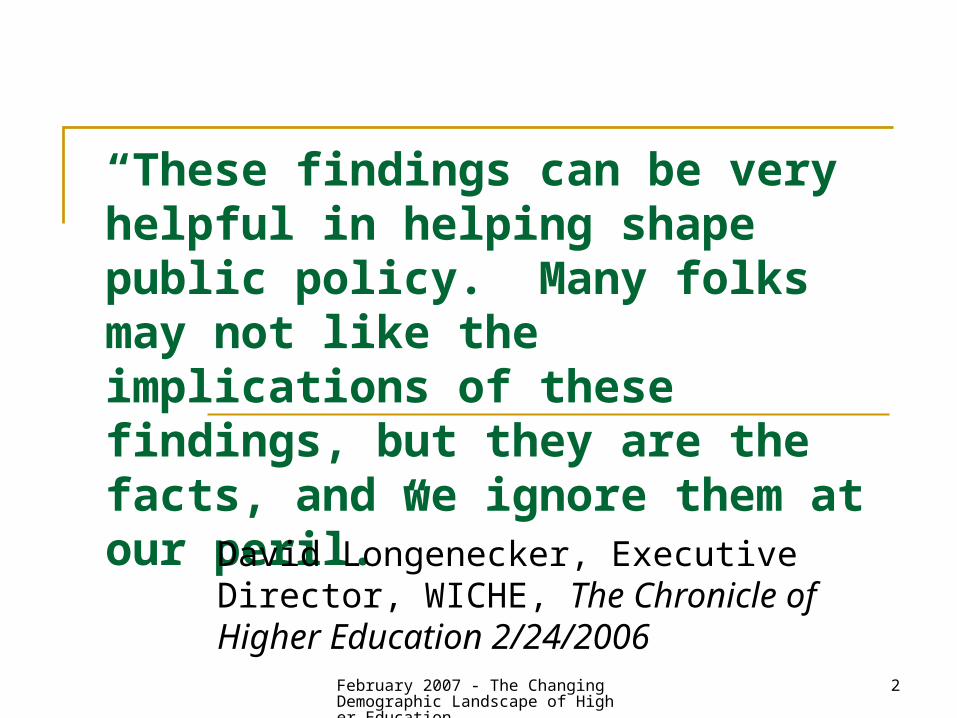
“These findings can be very helpful in helping shape public policy. Many folks may not like the implications of these findings, but they are the facts, and we ignore them at our peril.”
David Longenecker, Executive Director, WICHE, The Chronicle of Higher Education 2/24/2006

February 2007 - The Changing Demographic Landscape of Higher Education
3
Things to think about today… What is the environment within which we
operate? What is happening in our state and region
(and surrounding regions)? Where do our students come from (at our
institutions) and our states? Where do students from our state go? Where do non-residents come from to our
schools? Will these changes impact career colleges,
community colleges, state colleges, public flagships and different varieties of privates differently?
February 2007 - The Changing Demographic Landscape of Higher Education
4
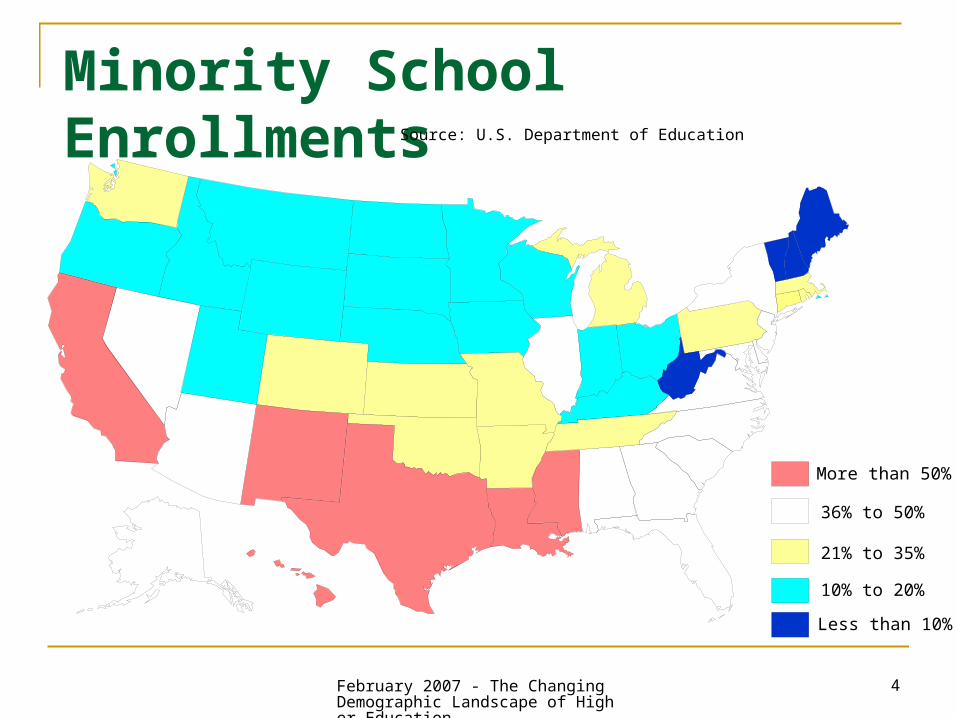
Minority School Enrollments
36% to 50%
21% to 35%
10% to 20%
More than 50%
Less than 10%
Source: U.S. Department of Education

February 2007 - The Changing Demographic Landscape of Higher Education
5
Number of Public High School Graduates Peaks and Valleys …
2,000,0002,100,0002,200,0002,300,0002,400,0002,500,0002,600,0002,700,0002,800,0002,900,0003,000,000
Source: WICHE/The College Board

February 2007 - The Changing Demographic Landscape of Higher Education
6
College 'bubble' is about to burst (Philadelphia Inquirer – 7/31/2006) Administrators at local private institutions
as diverse as Chestnut Hill College, Drexel University, St. Joseph's University, and two-year Harcum College in Bryn Mawr say they already are preparing for the coming shortage. In an effort to maintain the dramatic enrollment gains they've made, many are extending their recruiting efforts to faster-growing states, as well as adopting new academic programs to appeal to a wider pool of students.

February 2007 - The Changing Demographic Landscape of Higher Education
7
Projections of HS Graduates
in the United States
1%6%
14% 15%
65%
1%8%
13%
22%
56%
0.0%
10.0%
20.0%
30.0%
40.0%
50.0%
60.0%
70.0%
NativeAmerican
Asian American Black Hispanic White
2007 2018

February 2007 - The Changing Demographic Landscape of Higher Education
8
White, Non-Hispanic Degree Attainment – percent of total
declining in all degrees
0%
10%
20%
30%
40%
50%
60%
70%
80%
90%
Associates Bachelors Masters PhD
1981 1985 1990 1995 2003

February 2007 - The Changing Demographic Landscape of Higher Education
9
College Continuation Rates
30%
35%
40%
45%
50%
55%
60%
65%
70%
1976 1979 1982 1985 1988 1991 1994 1997 2000 2004White Black Hispanic
February 2007 - The Changing Demographic Landscape of Higher Education
10
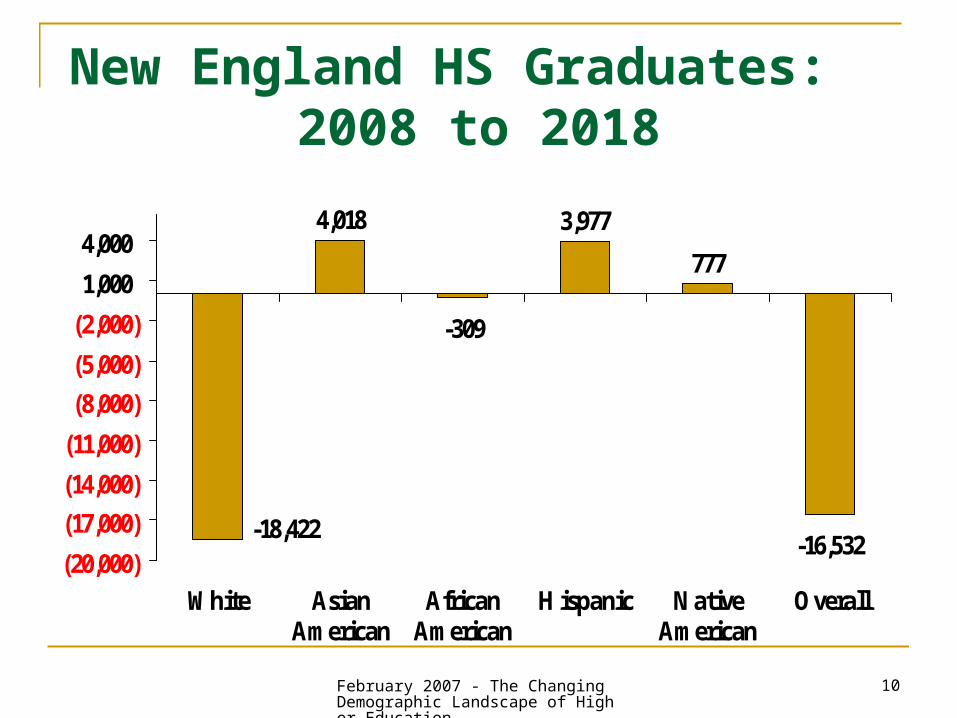
New England HS Graduates: 2008 to 2018
4,018
-309
3,977
777
-16,532-18,422
(20,000)
(17,000)
(14,000)
(11,000)
(8,000)
(5,000)
(2,000)
1,000
4,000
White AsianAmerican
AfricanAmerican
Hispanic NativeAmerican
Overall

February 2007 - The Changing Demographic Landscape of Higher Education
11
Other Northeast* HS Graduates:
2007-08 to 2017-1817,519
-11,460
3,977
-53,120-46,667
-390
(60,000)
(40,000)
(20,000)
0
20,000
NativeAmerican
AsianAmerican
AfricanAmerican
Hispanic White Total
* Includes DC, DE, MD, NY, NJ, PA

February 2007 - The Changing Demographic Landscape of Higher Education
12
SAT Takers by Race/Ethnicity
1% 5% 5%
86%
4%1%10% 13%
4%
73%
0%10%20%30%40%50%60%70%80%90%
100%
NativeAmerican
Asian American Hispanic White Other
New England US

February 2007 - The Changing Demographic Landscape of Higher Education
13
College Continuation Rates in the Northeast
68% 63% 63% 61% 59% 59%55%
43%
0%
10%
20%
30%
40%
50%
60%
70%
New
York
Massach
usett
s
New
Jerse
y
Conn
ectic
ut
Penn
sylva
nia
Maryla
nd
New
Ham
pshire
Verm
ont

February 2007 - The Changing Demographic Landscape of Higher Education
14
Enrollment at Colleges in Connecticut
CT64%
CA2% Inter
1%
TX0%
All other5%
NJ5%
NY11%
ME1%
NH1%RI1%
MA7%
PA1%
MD1%

February 2007 - The Changing Demographic Landscape of Higher Education
15
Enrollment at Colleges in New Hampshire
NH53%
All other10%
NJ2%
VT3%NY
4%Maine
4%
CT5%
MA18%
CA1%
TX0%

February 2007 - The Changing Demographic Landscape of Higher Education
16
Enrollment at Colleges in Massachusetts
MA62%
All other9%
CA2%
PA2%
NY6%
VT1%
ME2%RI
2%NH3%
CT5%
NJ3%
Inter3%

February 2007 - The Changing Demographic Landscape of Higher Education
17
Enrollment at Colleges in Rhode Island
RI32%
All Other9%
PA2%
MD1%
VT1%
ME1%
NH2%
CT10%
NY10%
MA22%
NJ8%
CA2%

February 2007 - The Changing Demographic Landscape of Higher Education
18
Enrollment at Colleges in Maine
ME69%
CA1%
All other6%
NY3%
VT2%
CT3%RI
1%NH4%
MA8% NJ
2%PA1%

February 2007 - The Changing Demographic Landscape of Higher Education
19
Enrollment at Colleges in Vermont
VT, 33.0%
TX, 0.3%
All other, 11.4%NY, 11.6%
NJ, 4.7%
NH, 6.7%
CT, 7.6%
ME, 4.4%
MA, 16.0%
PA, 2.7%
CA, 1.6%

February 2007 - The Changing Demographic Landscape of Higher Education
20
Emigration of College Students
18%
18%32%
37%42%42%
46%48%
57%
8%11%11%
43%
0% 10% 20% 30% 40% 50% 60%
US
California
Arizona
Texas
NY
Massachusetts
MD
Rhode Island
Maine
NJ
Connecticut
New Hampshire
Vermont

February 2007 - The Changing Demographic Landscape of Higher Education
21
Percent of Freshmen from Out-of-State
20%8%8%
9%
25%25%
34%39%
40%51%
67%70%
25%
0% 10% 20% 30% 40% 50% 60% 70% 80%
US
Texas
California
NJ
Arizona
NY
MD
Maine
Connecticut
Massachusetts
New Hampshire
Rhode Island
Vermont
February 2007 - The Changing Demographic Landscape of Higher Education
22
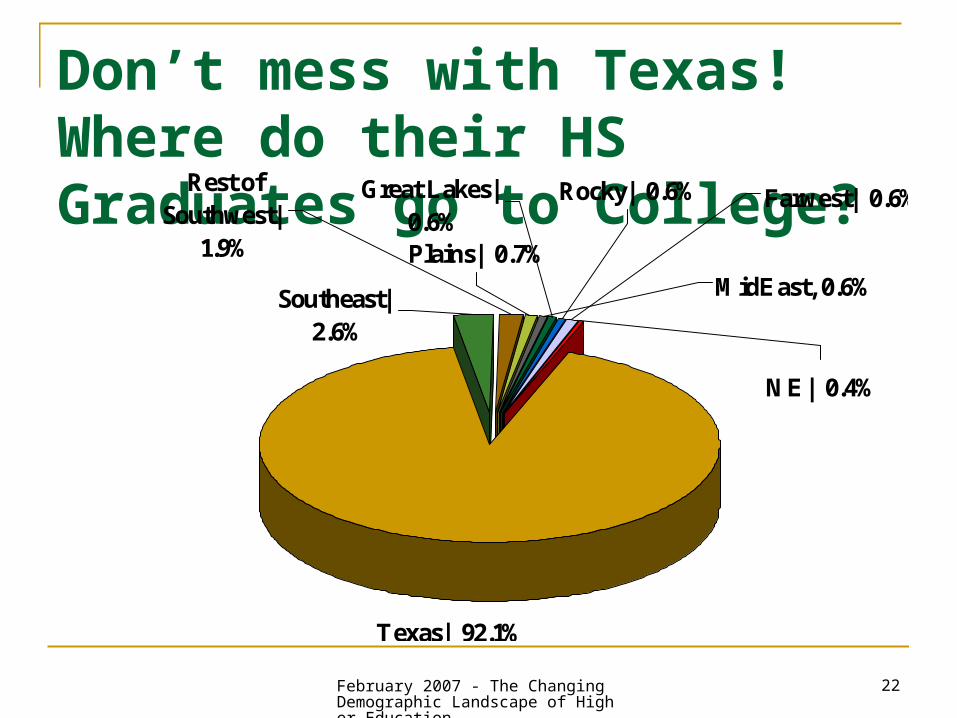
Don’t mess with Texas! Where do their HS Graduates go to College?
Texas| 92.1%
Plains| 0.7%MidEast, 0.6%
Rocky| 0.6%Great Lakes| 0.6%
Farwest| 0.6%
NE| 0.4%
Rest of Southwest|
1.9%
Southeast| 2.6%Only 19
colleges or universites in NE with 10 or more first year students from
Texas.

February 2007 - The Changing Demographic Landscape of Higher Education
23
College continuation rates
35%
40%
45%
50%
55%
60%
65%
70%
75%
MalesFemales
February 2007 - The Changing Demographic Landscape of Higher Education
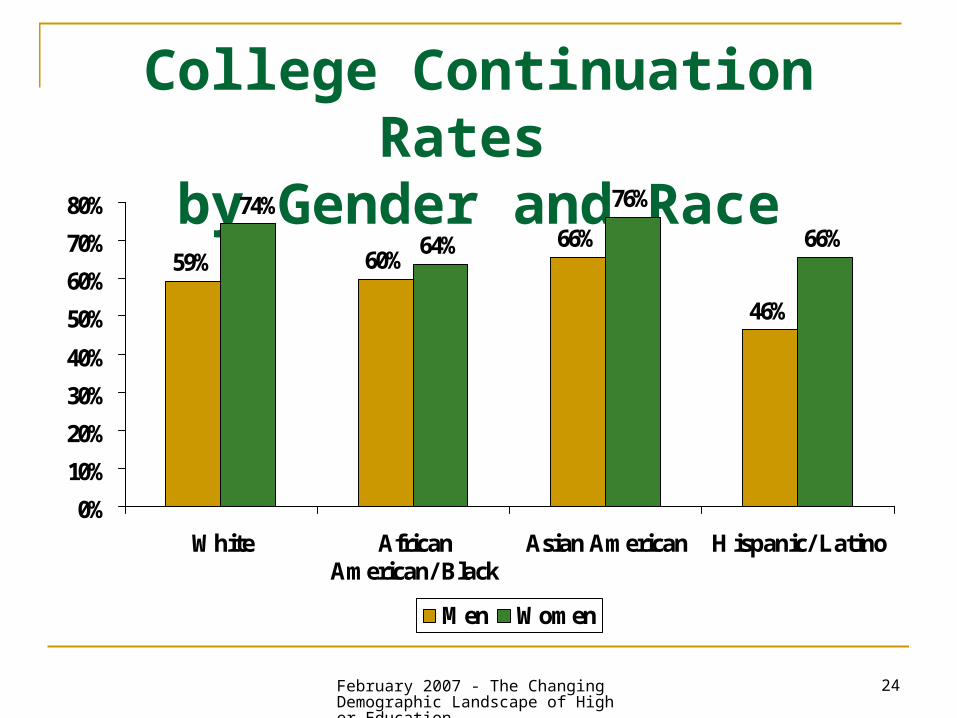
24
College Continuation Rates
by Gender and Race59% 60%
66%64%
76%
66%
46%
74%
0%
10%
20%
30%
40%
50%
60%
70%
80%
White AfricanAmerican/ Black
Asian American Hispanic/ Latino
Men Women
February 2007 - The Changing Demographic Landscape of Higher Education
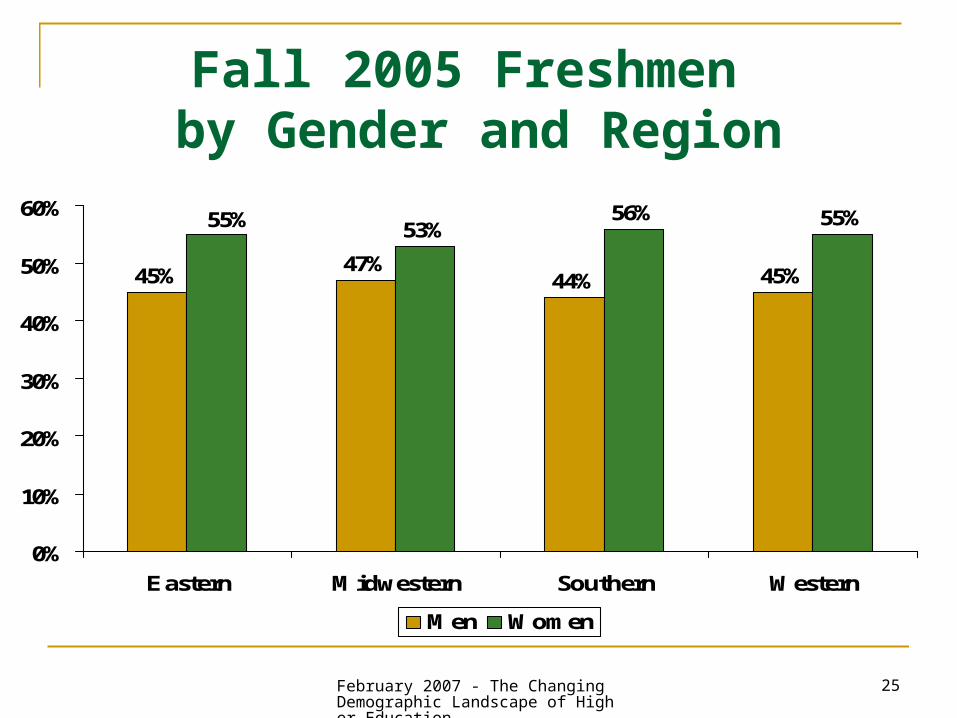
25
Fall 2005 Freshmen by Gender and Region
45% 47%44% 45%
53%56% 55%55%
0%
10%
20%
30%
40%
50%
60%
Eastern Midwestern Southern Western
Men Women

February 2007 - The Changing Demographic Landscape of Higher Education
26
Fall 2006 Freshmen by Gender by Income
18%
15%
12%
16%
19%
8%
12%12%
16%
7%
10%
17%14%
24%
0%
5%
10%
15%
20%
25%
Less than40
40 to 60 60 to 75 75 to 100 100 to 150 150to 200 Over 200
Men Women
45% of men less than 75K53% of women

February 2007 - The Changing Demographic Landscape of Higher Education
27
NE Enrollment Patterns: Full-Time
45% 44% 45% 45% 46% 48% 45% 45%
55% 56% 55% 55% 54% 52% 55% 55%
0%
10%
20%
30%
40%
50%
60%
70%
80%
Conn
ectic
ut
Main
eMass
NH RI
Verm
ont
Total
Total
US
Men Women

February 2007 - The Changing Demographic Landscape of Higher Education
28
NE Enrollment Patterns: Part-Time
62%68%
62% 63% 63% 66% 63%59%
0%10%20%30%40%50%60%70%80%
Conn
ectic
ut
Main
eMass
NH RI
Verm
ont
Total
Total
US
Men Women

February 2007 - The Changing Demographic Landscape of Higher Education
29
Percent of Total Undergraduate State AidNot Based on Need, 1982 to 2002

February 2007 - The Changing Demographic Landscape of Higher Education
30
Tomás Rivera Study18-24 year old California Latinos 98% said it was important to have a
college education 38% did not feel the benefits
outweighed the costs Not being able to work and incurring
debt were opportunity costs associated with attending college

February 2007 - The Changing Demographic Landscape of Higher Education
31
Tomás Rivera Study18-24 year old California Latinos Almost 25% thought loan availability
was contingent on grades 30% would use a commercial bank
as the source of their loan
“Perceptions of College Financial Aid Among California Latino Youth”
February 2007 - The Changing Demographic Landscape of Higher Education
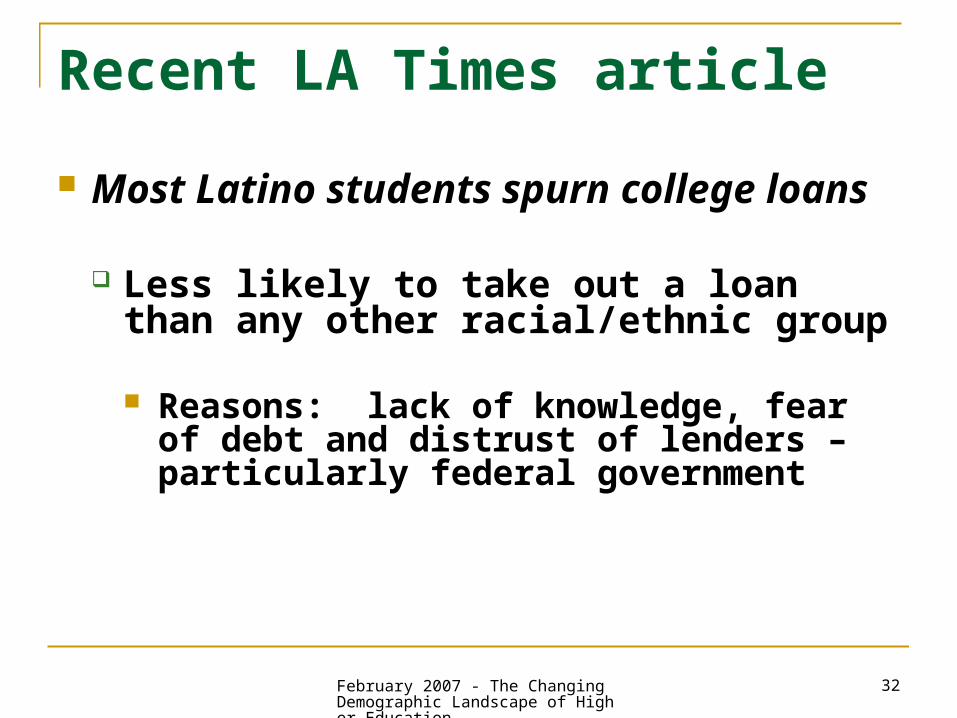
32
Recent LA Times article
Most Latino students spurn college loans
Less likely to take out a loan than any other racial/ethnic group
Reasons: lack of knowledge, fear of debt and distrust of lenders – particularly federal government

February 2007 - The Changing Demographic Landscape of Higher Education
33
Implications
Explaining the benefits of higher education will continue to be a challenge, especially when recruiting students with no family history
Opportunity costs are an impediment to many families
Cost perceptions will continue to hamper colleges ability to recruit
Need to better explain financial aid eligibility

February 2007 - The Changing Demographic Landscape of Higher Education
34
Race by Type of Private College
16%
2%
12%
63%
10%4% 4%
73%
10%
3%
12%
64%
8% 10%7%
60%
0%
15%
30%
45%
60%
75%
African American Asian American Hispanic White
Bachelors/ Associates Liberal Arts Masters Universities

February 2007 - The Changing Demographic Landscape of Higher Education
35
Race by Type of Public College
17%
3%
15%
58%
15%
3%
15%
60%
14%
6%11%
66%
9% 8% 8%
68%
0%
10%
20%
30%
40%
50%
60%
70%
African American Asian American Hispanic White
Bachelors/ Associates Public LA Public Masters Research

February 2007 - The Changing Demographic Landscape of Higher Education
36
For Profit Colleges
Caucasian39%
African American
19%
Hispanic17%
Unknown16%
Asian American
4%
International 4%
Native American
1%

February 2007 - The Changing Demographic Landscape of Higher Education
37
College Entrance within One-Year of High School Graduation64%
55%52%
13%
0%
10%
20%
30%
40%
50%
60%
70%
White African American Hispanic MaximumDifference
1972 1980 2001
Source: Higher Education and the Color Line, Pg 37.
February 2007 - The Changing Demographic Landscape of Higher Education
38
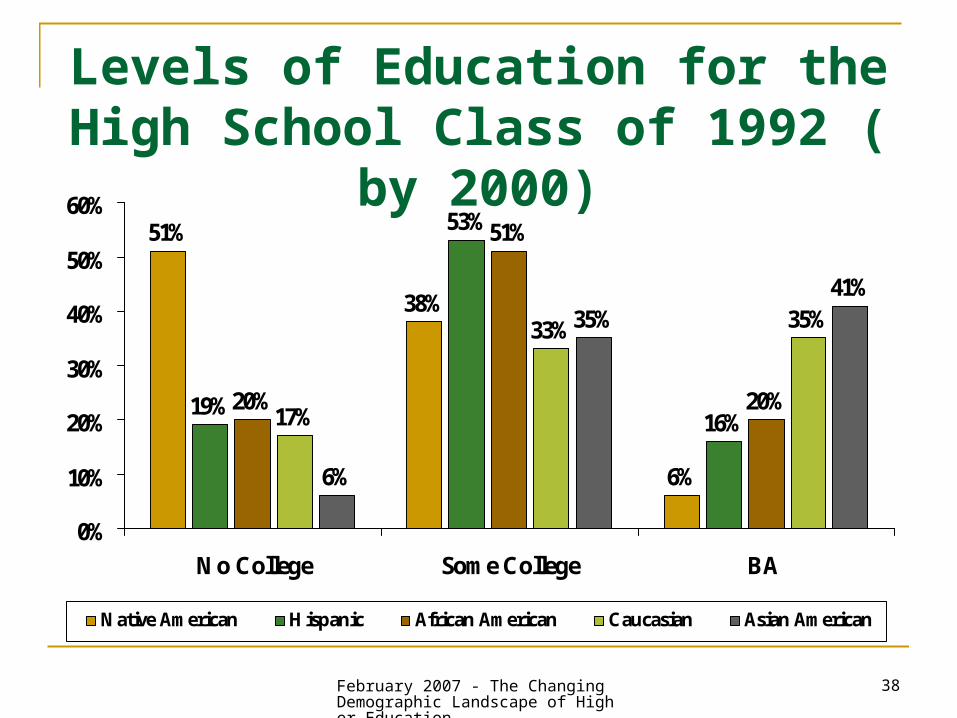
Levels of Education for the High School Class of 1992
( by 2000)51%
38%
6%
19%
53%
16%20%
51%
20%17%
33% 35%
6%
35%41%
0%
10%
20%
30%
40%
50%
60%
No College Some College BA
Native American Hispanic African American Caucasian Asian American

February 2007 - The Changing Demographic Landscape of Higher Education
39
Implications for the States – Changes in Personal per
Capita Income70%
37%
52% 49%
30%
-4% -5% -5% -3%-11%-20%
-10%0%
10%20%30%40%50%60%70%80%
Massachusetts Texas New York Colorado California
1980 to 2000 2000 to 2020

February 2007 - The Changing Demographic Landscape of Higher Education
40
Recent Sacramento Bee Headline…Latinos lag in reaching, finishing college
As a result, state per capita income could fall below national average

February 2007 - The Changing Demographic Landscape of Higher Education
41
Implications for the States – Personal per Capita Income
0
5,000
10,000
15,000
20,000
25,000
30,000
Massachusetts Texas New York Colorado California
2000 2020

February 2007 - The Changing Demographic Landscape of Higher Education
42
Summary HS graduation projections
in NE and the Northeast going down over all
Increases in groups with lower college continuation rates
Increasing in states that do not export students

February 2007 - The Changing Demographic Landscape of Higher Education
43
Summary Other Questions?
Will affirmative actions changes/legal cases stifle enrollment by students of color in states like California and Texas?
What will happen to per capita income in those states and public higher education funding as a result?

February 2007 - The Changing Demographic Landscape of Higher Education
44
Summary Male/Female ratios not likely to
improve – females are poorer – financial aid implications
Colleges in NE going to have to work harder just to maintain market share – expand marketing efforts and develop new strategies – we enroll each others students

February 2007 - The Changing Demographic Landscape of Higher Education
45
Institutional Implications More competition for fewer students in the
North East More expense to attempt to recruit
students from outside the region Will college going rates increase for
different ethnic groups? Are we ready? Will the pressure to maintain/increase
market share lead to a growth in discounting and increase in state and institutional merit aid awards?

February 2007 - The Changing Demographic Landscape of Higher Education
46
Broad Institutional Considerations Does your staff (the faculty and administrators)
resemble in the composition of future student body?
Will your strategy be to target these new groups of students or will you attempt to adapt to changes as they occur?
What are the financial resources (including financial aid) necessary to meet the institution’s enrollment goals?
If students come in with weaker preparation, what will be your response?
What will be the impact on retention and graduation rates?

February 2007 - The Changing Demographic Landscape of Higher Education
47
Additional Implications
• Some institutions will see shrinking enrollments because of declines in the number of high school graduates in their states or regions.
• Some institutions may need to expand or alter their recruitment strategies and redefine the target populations they seek to attract and enroll.
• The racial and ethnic composition of students on campus may be markedly different from current classes.