fiji water and sewerage department water safety plan2.pdf · fiji water and sewerage department...
TRANSCRIPT

\
FIJI
WATER AND SEWERAGE DEPARTMENT
SIGATOKA (MATOVO) WATER SAFETY PLAN
21-08-2009
Water Supply and Sewerage Department, Fiji
Author/ Consultant: Davendra Nath – (SOPAC/WHO)

System Description, Water Safety Plan, Improvement Schedule, (Matovo) – Sigatoka Regional Water Supply
Davendra Nath- Water Safety Plans Consultant – (SOPAC/WHO), Fiji 2009 Page 2
Acknowledgement
This is to acknowledge the contribution, support and commitment of the following:
Hon. Minister of Finance, National Planning, Sugar Industries and Public Utilities [Water and Energy] AND
Mr. Taito Delana, Director, Department of Water & Sewerage, Suva, Fiji
Without their support, the programme would not have been a success. The Department also wishes to acknowledge the contribution of: Mr. Samuela Tubui, Divisional Water Engineer, Western, DWS Mr. Govind Naiker, Treatment Officer /Western, Treatment Plants Mr. Sher Singh, Senior Scientific officer, National Water Quality Laboratory, Kinoya Mr. Joe Ravouvou, Supervisor, Sigatoka Regional Water Supply Mr. Viliame Senileba , Water Treatment Plant Supervisor, Matovo -Sigatoka A good commitment was made by the Water Supply Department, Lautoka in providing support, transport and other logistics for the consultant. This document would not have been produced without the technical support and inputs of:
Mr. Davendra Nath, Consultant, Drinking Water Safety Plans, Suva, Fiji Special thanks to SOPAC/ WHO for providing the consultant for this good course whereby Fiji will benefit in drinking water quality improvement.

System Description, Water Safety Plan, Improvement Schedule, (Matovo) – Sigatoka Regional Water Supply
Davendra Nath- Water Safety Plans Consultant – (SOPAC/WHO), Fiji 2009 Page 3
TABLE OF CONTENTS 1. INTRODUCTION ......................................................................................................................... 5
1.1 BACKGROUND ......................................................................................................................... 6
1.2 Matovo Treatment Plant……………………………………………………………....7 1.3. PROJECT OBJECTIVES: ............................................................................................................... 7 1.4 WHAT IS A DRINKING WATER SAFETY PLAN? ............................................................................... 7 1.5 ADMINISTRATIVE SUPPORT ........................................................................................................... 8 1.6 SIGATOKA (MATOVO) WATER SUPPLY DESCRIPTION ..................................................................... 8 1.7 WATER RESOURCE MANAGEMENT .............................................................................................. 12 1.8 FIJI WATER ECONOMICS ............................................................................................................. 13 1.9 WATER QUALITY MONITORING .................................................................................................... 14 1.10 WATER QUALITY MONITORING FOR SIGATOKA WATER SUPPLY SYSTEM ..................................... 15 1.11 SOCIAL ANALYSIS .................................................................................................................... 17 1.13 HEALTH STATUS ...................................................................................................................... 18 1.14 CLIMATE DATA ......................................................................................................................... 20
2. SYSTEM DESCRIPTION - MATOVO (SIGATOKA) WATER SUPPLY SYSTEM ................. 21
2.1 MATOVO CATCHMENT AND INTAKE .............................................................................................. 26
2.2 Matovo Treatment Processes…………………………………………..…………….27
2.3 Raw water receiving well………………………………………………………….....28
2.4 Clarifiers – Flocculation and Sedimentation .................................................. 27
2.5 Filters.............................................. .............................................................. 28
2.6 Chlorination.................................................................................................................33
2.7 Sludge Disposal...........................................................................................................35 3. SIGATOKA WATER SUPPLY-STORAGE AND DISTRIBUTIONS .............................................. 40
4. WATER SAFETY PLANNING .................................................................................................. 42
4.1 Improvements Needed .......................................................................................................... 43
5. WATER SAFETY PLANS –MATOVO ............................................................ 45
5.1. Risk Identification Worksheets ................................................................. 45
5.2: Plan to Manage the ‘Needs Urgent Attention’ ................................................................... 51
6. IMPROVEMENT SCHEDULE ................................................................................................... 60
7. RECOMMENDATION AND CONCLUSION.........................................................69
8. REFERRENCES..........................................................................................................72
ANNEX: 1 Drinking Water Risk Assessment Table .................................................................. 72
ANNEX :2 RISK ASSESSMENT –MATOVO ............................................................................... 73
ANNEX: 3 Test Results -Water Analysis -Sigatoka Supply.............................................79
ANNEX; 4 Nadroga Water Supply Monthly Report.........................................................81 ANNEX: 5 WHO – DRINKING WATER QUALITY GUIDLINES .......................................................... 80

System Description, Water Safety Plan, Improvement Schedule, (Matovo) – Sigatoka Regional Water Supply
Davendra Nath- Water Safety Plans Consultant – (SOPAC/WHO), Fiji 2009 Page 4
LIST OF ACRONYMS
ADB Asian Development Bank C/E Central Eastern DoE Department of Environment EEC Exclusive Economic Zone EU European Union EC European Commission EIA Environmental Impact Assessment FAC Free Available Chlorine GIS Geographic Information System GDWQ Guideline for Drinking Water Quality GDP Gross Domestic Product HACCP Hazard Analysis Critical Control Point HTH High Test Hypochlorite H2S Hydrogen Sulphide IAS Institute of Applied Science IEC Information, Education and Communication IWRM Integrated Water Resource management km Kilometers LLEE Live and Learn Environmental Education l/p/d Liter per person per day
ML Mega Liters MLD Mega Liters per Day MOH Ministry of Health MOU Memorandum of Understanding
NWQL National Water Quality Lab Mg/l Milligrams per liter NGOs Non Governmental Organizations NTU Nephelometric Turbidity Unit NZ-MOH New Zealand Ministry of Health NZDWS New Zealand Drinking Water Standards OHS Occupational Health and Safety PICs Pacific Island Countries PVC Polyvinylchloride pH Acidity/Alkalinity ppm Parts per million PWD Public Works Department RAP Regional Action Plan SOPs Standard Operating Procedures SOPAC Pacific Islands Applied geo-science Commission SCADA Supervisory Control and Data Acquisition TWL Top Water Level USA United States of America WHO World Health Organization WEDC Water, Engineering and Development Centre WSD Water and Sewerage Department

System Description, Water Safety Plan, Improvement Schedule, (Matovo) – Sigatoka Regional Water Supply
Davendra Nath- Water Safety Plans Consultant – (SOPAC/WHO), Fiji 2009 Page 5
WSP Water Safety Plan WTP Water Treatment Plant
1. INTRODUCTION
The Fiji replication commenced after the interest shown by the Water and Sewerage Department (WSD) of the Ministry of Local Government, Urban Development and Public Utilities. A request was made by the Director of Water and Sewerage via a letter to the Director of Pacific Islands Applied Geo-sciences Commission (SOPAC). Through the consultation with Director Water and Sewerage and the Divisional Water Engineer it was resolved that a workshop should be conducted to train and introduce the Water Safety Planning concept in Fiji for Western Division.
Sigatoka (Matovo) water supply system is serving the urban and rural population of 40,000 which depend on the treated reticulated water supply from three sources of surface water catchments namely Sigatoka river, Korotogo Borehole and Qereqere Borehole. There is continuous increase in the urban population growth of the Sigatoka coastal town. Due to the tourism development there is greater demand for the treated piped water supply. The major concern of the Water and Sewerage Department is the efficient supply of drinking water even though there are several constraints such as infrastructure, finance and human resources. The funds have been allocated from the government budget after realization of the extent of developments for both residential and tourism sectors in the area.
It is realised that the importance of improving the water quality in order to eliminate the health hazards and disease causing organisms from the water supply. As such it is ideal to incorporate the Water Safety Planning process in this venture. The expertise and resources will be made available from SOPAC/WHO to assist in the Water Safety Planning programme for Fiji. Greater commitment has been shown by the WSD after the successful completion of the water safety planning process for Suva/Nausori and Nadi/Lautoka zones.
It is anticipated that with necessary training for the staff of Water and Sewerage and Ministry of Health it would greatly enhance the capabilities for formulating and implementing the Water Safety Planning process as a proactive measure in maintaining the drinking water quality and quantity.
The importance of safe drinking water for health and development in the Pacific Island Countries (PICs) has been reflected in many regional action plans and policies. Through the Regional Action Plan (RAP) on Sustainable Water Management (Sigatoka, Fiji, 2002) Pacific Island Countries outlined actions that were needed to achieve sustainable water management through collaborative efforts by water sector authorities and inter-sectoral partners. The WHO workshop on Drinking Water Quality Standards and Monitoring in Pacific Island Countries (Nadi, Fiji, 2005) developed a Framework for Action on Drinking Water Quality and Health in Pacific Island Countries, designed to support the implementation of drinking water quality actions envisioned in the Regional Action Plan (RAP). The Pacific Island Countries embraced the Water Safety Plan concept during the workshop and this was reflected in the Regional Framework. It was recommended that PICs should use Water Safety Plans to better manage their water supplies to ensure safe quality drinking water for Pacific communities.

System Description, Water Safety Plan, Improvement Schedule, (Matovo) – Sigatoka Regional Water Supply
Davendra Nath- Water Safety Plans Consultant – (SOPAC/WHO), Fiji 2009 Page 6
1.1 BACKGROUND
The Fiji islands are located between 12 degree – 21 degree south latitude and 176 degree East – 178 degree West longitude (Refer to the Fiji islands Map Below). Fiji consists of more than 300 islands of which about one third are inhabited. With a land mass of 18.272 square km Fiji is third largest state in the region next to Papua New Guinea and the Solomon islands. The Exclusive Economic Zone (EEC) of the country Covers 1.3 million square Km. the two biggest islands , Viti Levu and Vanua Levu ,have the majority of the total population of about 900,000 ,with about 50% living in urban areas such as Suva (177,000), Lautoka (45,000) and Nadi (33,000). The largest Islands account for 87% of the land area and 90% of the population. The larger Islands such as Viti Levu and Vanua Levu, Tavueni, Kadavu and the islands of the Lomaiviti group are rather mountainous and of volcanic origin. They rise more or less abruptly from the slow to impressive heights. The south east or the windward sides of the islands record the highest rainfall up to 4000mm annually. The western and northern parts of the major islands are in the rain shadow of the volcanic mountain ranges and may receive an average rainfall of 2000mm. They are therefore much drier and frequently threatened by droughts (Terry and Raj 2002) The climate in Fiji is dominated by the southwest trade winds. Exposure and topography control the distribution of rainfall on the islands. Average annual precipitation over the Fiji group ranges from 1500 mm on smaller islands to over 4000 mm on the larger islands. Topographic effects mean however that much of this falls within the windward side of the islands‟ The wet season from November to April is also the season of tropical cyclones. In the western parts of the bigger islands up to 80% of the annual total rainfall falls during this period. The western and northern parts of the major islands receive only 60-70% of the rainfall recorded in the eastern parts. Here drought conditions are more likely to occur, especially during El-Niño episodes. These drier parts of Viti Levu and Vanua Levu are the centre of Fiji‟s sugar cane production. The Sigatoka water supply system comprises of the urban and rural areas of coastal town of Sigatoka extending from Natadola to Korotogo. There are a number of major hotels and resorts on the coasts occupied by the tourist. The water for the consumers is mainly treated and supplied by the three surface water catchments. About 16 MLD of treated water is supplied to the consumers through the distribution system and multiple storage reservoirs. The conventional water treatment is used with disinfection by chlorine. The water is extracted from the Sigatoka River and two smaller bore fields and after chlorination the water is fed to the distribution system either by mechanical pumps or by gravity. The supply capacity and the infrastructure are sufficient but the need is for improvements in all areas.

System Description, Water Safety Plan, Improvement Schedule, (Matovo) – Sigatoka Regional Water Supply
Davendra Nath- Water Safety Plans Consultant – (SOPAC/WHO), Fiji 2009 Page 7
1.2 Matovo Treatment Plant Motovo Treatment Plant receives its raw water supply from Sigatoka River via three infilteration galleries and two flight pumps situated close to the plant on the river bank.The plant is operated in through sedimentation tanks and maze clarifiers . Chlorination is done after rapid sand filteration, or with both clarification and filteration processes i.e full conventional treatment depending on the turbidity of incoming water from the dam.High contents of iron and manganese is common in the raw intake water and since there is no efficient methods to remove the chemicals it causes black stains in the system. Prior to sedimentation low doses of alum (and possibly lime ) are usually added to assist the filters to remove the solids and colour from the raw water through flocculation and cougulation process. Alumunium Sulphate (Alum) assists in floc formation and thus removes dissolved solids prior to filteration. Soda as is added to adjust he pH content of water to about 6.8 as this atandard increaseses the efficiency in treatment processs. The captured solids in the filter are backwashed and removed on a periodic basis. When the raw water turbidity and/or alum dose required is high, the conventional water treatment process is implemented. This includes sedimentation(clarification) prior to filteration. Under this mode of operation ,the raw water is always dosed with alum and usually lime. And at much higher doses than for direct filteration. Water for filter backwashing is stored in the wash water tanks at an elevated level close to the plant. These tanks are filled by the backwash supply pumps. During a backwash , air blowers provide air to scour the filter sand and dislodge the solids that have become captured within the filter beds. Water is then gravity fed from the wash water tanks to the filters. The wash water flows upwardly through the filter sand to flush out the solids to the site sludge thickerner which also receives sludge from the clarifiers. The sludge water is pumped to the lagoons located near the plant. Filtered water is dosed with chlorine and lime prior to entry to the clear water reservoirs. From the clear water reservoirs, water is pumped by high lift pumps to the storage tanks and gravity flows to surrounding areas via outlet mains of 300 -500 mm diameter.
1.3. Project Objectives: The main objective of the Fiji Water Safety Plans Programme is to produce Water Safety Plan and Improvement Schedule for Sigatoka urban Water supply system involving the staff of Water and Sewerage Department and the operators of Matovo/ Nadroga Water Supply. At the end of the programme it is anticipated that the staff of the Department are well familiar in compiling the plans for other supplies by them and have a completed WSP for Matovo supply. 1.4 What is a Drinking Water Safety Plan? A Drinking Water Safety Plan (DWSP) is a comprehensive risk assessment and management tool that encompasses all stages in the drinking water supply from catchment to consumers. It draws on principles and concepts from other risk management approaches including Hazard Analysis Critical Control Point (HACCP) and the „multi-barrier approach‟. It is more of a pro-active approach whereby continuous monitoring and improvements are done to eliminate any hazard in the water supply system.

System Description, Water Safety Plan, Improvement Schedule, (Matovo) – Sigatoka Regional Water Supply
Davendra Nath- Water Safety Plans Consultant – (SOPAC/WHO), Fiji 2009 Page 8
The Improvement Schedules are part of the Water Safety plans and compiled after the risk assessment and risk ranking in the water supply system for the specific plant is formulated.
The key objectives of a Drinking Water Safety Plan are to:
Prevent the contamination of source waters;
Treat water effectively and efficiently to reduce or remove contaminants; and
Prevent re-contamination during storage, distribution and handling
1.5 Administrative Support Administrative support was given by Nadroga Water Supply department for the logistics such as transportation for field work and office space for the consultant. A good commitment was shown by the department as the lead agency in the project. All information was made available with reference to reports, inspections and personal interviews during the consultancy. A mini seminar for the Matovo plant operators were done to brief them on the Water Safety plans concept.
1.6 Sigatoka (Matovo) Water Supply Description Sigatoka urban water supply system flow diagram and locality plan can be seen in detail below. Since the water is from surface river catchment there is full conventional treatment system in place and thus sedimentation, filtration and chlorination is the necessary process to eliminate dissolved solids, micro-organisms and unwanted natural chemicals from water prior to public consumption. Since the intake is of surface water from the Sigatoka River, it contains impurities and highly turbid therefore full treatment of water is required prior to human consumption. The pictures below show the maze clarifiers in use at the Matovo treatment plant. The clear water in the Sigatoka is more common in dry season but highly turbid in rainy seasons. The turbidity increases as there is extensive farming in the catchment area alongside the river. Bacterial content of the water is high as well due to pollution by human and animal activities. The catchment area is large therefore it is necessary for regular inspection, monitoring and public awareness. There is a need for other agencies to act collaboratively in this regards.
Horizontal - Maze Clarifier – Matovo Plant Flight pumps- Sigatoka River Catchment

System Description, Water Safety Plan, Improvement Schedule, (Matovo) – Sigatoka Regional Water Supply
Davendra Nath- Water Safety Plans Consultant – (SOPAC/WHO), Fiji 2009 Page 9
Borehole Intake at Qereqere - Sigatoka Borehole intake at Korotogo - Sigatoka
The intake water quality is monitored by the National Water Quality Laboratory (NWQL) staff from Kinoya once a month to detect to detect abnormal presence of bacteria and hazardous chemicals.
The map below shows that the Sigatoka (Matovo) water supply system is located in the western division where it is more prone to natural disasters such as flooding. Secondly the demand is high with large distribution area.
Unmaintained Reservoir – Lawai Voua Reservoir – Damaged lids
Most of the storage reservoirs were seen to be unmaintained and overgrown with grass. The missing and rusted lids pose a problem of bird and rodent access. Some of the reservoirs were not maintained at the Top water level and no notice boards or proper fence were seen to control public access.
Manual water level measuring is common due to lack of proper telemetry system. The catchment area and bore fields were not fence or protected from natural disasters. It was revealed that two trips are made daily to all reservoirs to measure the water levels.

System Description, Water Safety Plan, Improvement Schedule, (Matovo) – Sigatoka Regional Water Supply
Davendra Nath- Water Safety Plans Consultant – (SOPAC/WHO), Fiji 2009 Page 10
Manual Water level Measuring - Voua Unprotected Bore-fields from animal and public access Sigatoka River intake - Matovo
Figure 1 Map- Fiji Islands- Sigatoka (Matovo) Regional Water Supply
Sigatoka (Matovo)
Regional Water Supply

System Description, Water Safety Plan, Improvement Schedule, (Matovo) – Sigatoka Regional Water Supply
Davendra Nath- Water Safety Plans Consultant – (SOPAC/WHO), Fiji 2009 Page 11
Figure 2- Sigatoka Water Supply Operational Structure
Divisional Engineer Western
Senior Water Engineer
Supervisor Higher Grade
Water Supervisor
Technical
Assistant
Leading Hand
Pipe Fitters
Trade Assistant
Labourer
Gardener
Supervisor – Bulk
supply - Distribution
Water Foreman
Leading Hand
Pipe Fitters
Watchman/Gatemen
Administration Staff
Laboures
Operation
Team
Leak Detection
Unit
Plan Preventive
Maintenance
Director
Dept of Water and Sewerage
Treatment
Supervisor
Plant Officer
Incharge
Pump Attendant
Pump Assistant

System Description, Water Safety Plan, Improvement Schedule, (Matovo) – Sigatoka Regional Water Supply
Davendra Nath- Water Safety Plans Consultant – (SOPAC/WHO), Fiji 2009 Page 12
1.7 Water Resource Management
Surface water is used as the main source of supply for all major Towns on the larger, high islands of Fiji, as well as for industries and irrigation. Some small, low lying islands rely exclusively on ground water and may or may not use rainwater. Rainwater harvesting is widespread in Fiji but improvements are required to sustain supply during droughts and prevent the stored water from contamination.
As a result of climate change flooding is currently a very high priority political issue for Fiji. In light of serious flooding which has occurred throughout various parts of the country over the last few years there is loss of life and damage to properties and infrastructure thus causing economic burden. On small low-lying islands, groundwater resources may be very vulnerable due to over-exploitation and contamination. Industrial pollution, urban drainage and sewage are cause of concern for water contamination on larger islands. Even though 70% of the population has excess to treated, metered reticulated water, continuity of supply is not ideal and maybe in question, particularly in the drier months. Wells on many islands are contaminated with faecal coli-forms due principally to a lack of sanitation and awareness amongst the community. The health of the near-shore environment is of particularly high importance, owing to tourism development along the coast. (IWRM Synopsis - Pacific Island Countries 2007) Fiji identified the following water resource management barriers:
A lack of water resources management technical capacity and formal responsibilities
A lack of public awareness on water conservation and water pollution
Land tenure and water rights
Conflicting policies and unclear legislation
A lack of effective formal coordination
Adequate planning mechanisms
Table 1- Fiji Essential Data - (Source-SPC data 2000)
Area 18,333 sq km
Population 850,000
Population Density 46 persons/ sq km
Urban Population 46%
Annual inter-census growth rate 2.6%
Annual inter-census national growth
1.6%
Rainfall 2000 – 4000 mm/year
GDP (Gross Domestic Product) $5.6 billion
GDP/capita $6,200
Land use Arable land:11%;permanent crops ;4.6%
Water consumption Urban:200 lpd;semi-rban;150 lpd; rural:100 lpd
Population access to treated water 80%
Island type Volcanic, limestone, atoll, mixed
Type of water supply Surface water, groundwater, rainwater, desalination
Key Economic Sectors Agriculture, clothing, fisheries, sugar and tourism

System Description, Water Safety Plan, Improvement Schedule, (Matovo) – Sigatoka Regional Water Supply
Davendra Nath- Water Safety Plans Consultant – (SOPAC/WHO), Fiji 2009 Page 13
1.8 Fiji Water Economics Responsibilities for Fijis water resources falls within the jurisdiction of the Director of Water and Sewerage in the Public Works Department. The Fiji Public Works Department has responsibility to supply potable water to over 80% of the country‟s population. The consistent development of water resources and supply strategies in Fiji has been thwarted by a lack of clear and comprehensive legislation compounded by the number of government agencies that are mandated to deal with water at one level or another. These departments include the Ministry of Public Utilities, Ministry of Lands and Mineral Resources, Ministry of Health, Ministry of Regional Development, Housing and Squatter Settlement and Ministry of Agriculture Environment and Fisheries. Hydrology falls within Public Works Department while the Ministry of Lands and Resources assists in the planning and assessment of ground water resources. Although Fiji is fortunate to have a plentiful supply of fresh water with high rainfall, droughts and floods over the last twenty years have caused major interruptions to the collection, treatment and reticulation of portable water. The symptoms of these impacts have been most noticeable in the towns and cities of Fiji where major water supply shortages and breakdowns have been the norm. Legislation related to water resources in Fiji is outdated but has generally served the nation well until recent times. There is a need to review various water related legislation to reflect current policy constraints. The commercial use of water from groundwater supplies as well as resource management issues in catchments including logging underlies the need of comprehensive review of national policy followed by legislation. Many of these issues are politically and socially sensitive in Fiji, with the shortage of water supply in towns and cities and need for major infrastructure improvements. (SOPAC Misc Report 554-Carpenter& Jones)
The Water and Sewerage Department operates and maintains 32 Public water supply schemes nationwide comprising of 15 Water Treatment Plants, over 110 service reservoirs and over 2,200 km of reticulation system of 50 -900mm mains. It costs the WSD about $28 million per annum to produce and supply safe water to the nation. About $6 million is spent on electricity annually to operate motors and pumps. Chemicals used to purify the water costs about $2 million a year.
To be connected to government water supply the following fees is charged;
New domestic connection $21.95
New commercial meter $100.98 Re – connections $10.00
The average cost of producing 1,000 litres of water (equivalent to 1 unit on your water meter) is $1.98 but charges you less than 1 cent per litre. (Water Sewerage Dept 2008)

System Description, Water Safety Plan, Improvement Schedule, (Matovo) – Sigatoka Regional Water Supply
Davendra Nath- Water Safety Plans Consultant – (SOPAC/WHO), Fiji 2009 Page 14
1.9 Water Quality Monitoring It is recommended that before a monitoring programme is designed relevant agencies and professionals form a team and discus various aspects such as risk identification, parameter selection and risk management. A multidisciplinary approach is adopted to ensure that agencies with responsibilities for specific areas associated with water quality are involved. It is important to briefly but accurately describe the drinking water supply for which the monitoring plan is being set up. It is important to know your role when designing a drinking water quality monitoring plan, whether you are a water supplier or a surveillance agency. The water supplier has a responsibility to ensure that the water they supply is fit for human consumption. Hence they are responsible for monitoring the quality of raw water, treated water and water at storages and distribution system. The surveillance agency is also expected to monitor the water supplied by the supplier to verify that the quality is indeed fit for human consumption. They are responsible for monitoring the water quality immediately after treatment and during storage and distribution. Occasionally they could monitor the source water quality to ensure that the supplier is doing its job of source water protection (SOPAC Tech Report 407, Hassan & Aalbersberg- 2008) Currently there are four major types of water quality monitoring programmes in Fiji, including those conducted by PWDs National Water Quality Laboratory (NWQL) for urban treated water and the Public Health Department for urban, rural and private supplies. The Institute of Applied Science (IAS-USP) also samples urban and rural water supplies and for private bottling companies. There is no official exchange of information between agencies and results from WSD and USP are treated as confidential and not shared voluntarily with the Health Department. The critical parameters in water quality monitoring are:
- Microbial Organisms- Monitoring microbiological quality of drinking water is of principal importance because of the acute risk to health posed by bacteria and viruses in drinking water. Microbial organisms that are pathogenic (disease causing) make the largest contribution to water –borne diseases in developed and developing countries. The presence of pathogens in drinking water is usually due to human and animal waste entering the water sources. An indicator organism such as E. Coli-form is always present in large quantities in faecal matter, whether pathogenic organisms are present or not. A high level of indicator organisms in a water sample indicates a high risk that pathogenic organisms might also be present (Mosley et al, 2004) The table below shows examples of population based sampling numbers and frequencies for microbiological parameters in distribution systems drawn from WHO Guidelines for Drinking –Water Quality (2004)
Table 2 - Water Samples per Population
Population Sample per month
<5,000 1 sample
5,000 to 100,000 1sample per 5,000 population
>100,000 1 sample per 10,000 pop plus 10 samples

System Description, Water Safety Plan, Improvement Schedule, (Matovo) – Sigatoka Regional Water Supply
Davendra Nath- Water Safety Plans Consultant – (SOPAC/WHO), Fiji 2009 Page 15
However if the population served is 30,000 then 6 samples are to be taken per month, this depends on the resources as well. It is advisable that the samples from a distribution system are collected randomly over the network instead of having fixed sampling points. This would ensure coverage of the entire network over time.
- Turbidity Turbidity is the measure of “cloudiness” of the water and is often used as a simple substitute for suspended solids. Turbidity may cause rejection of water by consumers, as it is also associated with bacteria survival, as adsorption onto suspended solids by microorganisms is common. Turbidity should always be tested whenever a sample is taken for water quality testing, the standard being no more than 1- NTU for treated water. High turbidity protects micro-organisms from chlorine and other disinfectants and interferes with the maintenance of residual chlorine. An increased turbidity during distribution may indicate leakage or breakage of piped system and therefore an increased likelihood of microbiological contamination (Howard 2002).
- Residual Chlorine or Free Available Chlorine Chlorine is a relatively cheap and readily available chemical that, when dissolved in clear water in sufficient quantities will destroy most disease causing organisms without being a danger to people. However chlorine is used up as organisms are destroyed. If enough chlorine is added, there will be some left in the water after the organisms have been destroyed, this is called free chlorine. Free chlorine will remain in the water until it is either lost to the outside world or used up destroying new contamination. Therefore, if we test water and find that there is still some free chlorine left, it proves that most dangerous organisms in the water have been removed and it is safe to drink. We call this measuring the residual chlorine or free available chlorine (FAC). Residual chlorine or FAC of above 0.6 mg/L or more causes problems of acceptability for some consumers on the basis of taste, depending on local circumstances. Monitoring residual chlorine where the treated water leaves the plant indicated that the disinfection process is working properly. Measuring at different points in the distribution system is used to check that there is not an excessive chlorine demand that may indicate other problems in the system such as ingress of contaminants.
- pH A common indicator pH is the measure of the hydrogen ions (H+) concentration in the water and is an important parameter for describing the likely state of other chemical process occurring. The pH of piped or reticulated drinking water supplies should be regularly monitored as low levels (<5-6) may cause corrosion of metal pipes and fittings, releasing metals into the water. Water with pH > 8.5 could indicate that the water is hard. pH is important as an operational parameter, particularly in terms of efficacy of chlorination or optimising coagulation. Where the pH is>8.5, the chlorination efficiency becomes impaired. The optimum ph for chlorination is between 6 .5 and 8.5. Wherever possible, the pH in water should be tested when residual chlorine is measured (Mosley et al 2004).
1.10 Water Quality Monitoring for Sigatoka Water Supply System There is no on-line water quality monitoring instruments installed at Matovo WTP. There is no automatic control of the chemical dosing pumps. If automatic adjustment of

System Description, Water Safety Plan, Improvement Schedule, (Matovo) – Sigatoka Regional Water Supply
Davendra Nath- Water Safety Plans Consultant – (SOPAC/WHO), Fiji 2009 Page 16
coagulant dose rate (g/m3) is required, some means of monitoring raw water conditions for controlling the alum and soda ash dosing pumps is also required. Fiji has no water quality standards and no system for classifying receiving waters therefore ministries adopts their own standards in reference to the WHO standards. The National Water Quality Laboratory at Kinoya test a number of parameters including Free Available Chlorine (FAC) and bacteriological test weekly in the distribution and storage system and provides the results to the water treatment plant operators and the management. The NWQL has adopted standards for its treated water. These standards have been adopted from a variety of sources and they are equal to or more stringent than, for example the current Australian and New Zealand Drinking Water Standards with the notable exception of Turbidity. However it needs to be noted that the adoption of standards has little effect meaning in the absence of a Non –compliance Procedure or Event Reaction procedure and /or an incentive to comply (ADB Report 1999). At the Matovo Treatment Plant test on the water quality are done at an interval of 4 hours and the result are recorded for adjustment if chemical dosing and availability of FAC at plant is to be maintained at the required standards. During manual testing, Hach chlorine colour comparator and turbidity meters are used. The plant operators monitor the water quality at various points at the plant and record the results. The treated water being delivered from Matovo WTP aims to achieve the following water quality objectives;
Water Quality Parameter Objective Limit
Turbidity < 1.0 NTU pH >6.8 Residual chlorine 1.0 mg/L
Table 3-Treated Water Monitoring for NZDWS 2000 Compliance
Parameter Method/Location Frequency Comments Turbidity Online turbidity meters on
outlet of each filter Continuous Surrogate for protozoa
contamination. Must be demonstrably less than 0.1 NTU for more that 95% 0f the time and must not exceed 0.2 NTU.
Copper Sulphate
Laboratory methods Drinking water leaving the plant
3 samples per calendar quarter
If dosing of copper sulphate continues: must not exceed 2 mg/l in any sample.
Chlorine Online chlorine residual monitor
Continuous Must be sampled after not less than 30 minutes contact time; monitoring plant must not be out of service for more than 1 hour per week; residual in drinking water leaving the plant must not be less than 0.2 mg/l with pH not greater than 8.0 and turbidity always less than 0.5 NTU
pH Online monitor in drinking water leaving the plant.
Continuous Required for verification of chlorine residual compliance
(Harrison & Grierson Report 2003)

System Description, Water Safety Plan, Improvement Schedule, (Matovo) – Sigatoka Regional Water Supply
Davendra Nath- Water Safety Plans Consultant – (SOPAC/WHO), Fiji 2009 Page 17
Table 4-The table below summarizes the dose rates for chemicals
Chemical Solution Strength
Dose Rate Pump Rate (at 16MLD)
Comments
Soda Ash 0.5% 20g/m3 670m3/hr High turndown rate- two operating pumps would be required to achieve range 2 pumps plus standby
Alum 0.5% 10g/m3 670m3/hr Turndown of 1:5 Difficult to prepare stronger (than20%) stock from alum kibble. Two simplex pumps or large duplex pump)to achieve capacity) plus standby if using 10% stock
Potassium Permanganate
0.1% 2.0g/m3 670m3/hr 1gm of iron/manganese will react with 0.94 gm of potassium permanganate
Polyelectrolyte 0.1% 0.15 – 0.20 mg/l
255 – 920 L/hr
Turndown OK One pump plus standby
Lime 5% Max dose of 1.0 mg/L
450 – 920 L/hr
Turndown ok one pump plus standby
(Harrison & Grierson Report 2004)
1.11 Social Analysis Recent water shortages in Sigatoka areas due to tourism and residential developments have affected many residents as water stoppages were unexpected. There are no alternatives for water supply when the main system is un-operational as few people have rainwater tanks and the nearby creeks and streams are polluted. During water cuts the water is catered in trucks to the residents as there are no water vendors or public standpipes. This may not be possible as the government has announced a 50% reduction in operation cost for all government departments. The carted water is liable to recontamination as tanks are not clean and domestic storage containers are also contaminated by unhygienic handling. Those who experience the adverse consequences are mostly the children and the elderly who rely on others for water. Over the next five years, it is predicted that the Sigatoka population will increase. Without intervention to improve the current water supply system, it will not be possible to cope with the increased demand. As many businesses rely on water supply as an essential element in their production, thus scarcity of water can mean significant economic disruption. There is also a social and non-monetary cost for the tourism, education and health services sectors when water is not available. While the overall coverage of the water supply network is good in the area with 70% coverage of piped supply, the unreliability and unpredictability of the system affects virtually everyone. There are a lot of areas in the system that needs improvement. During the 1996 -2007 inter-censal period, the Nadroga/Navosa area also continued to experience population growth at a rate of 0.7 percent per year. Much of this growth occurred in peri-urban areas. (Census 2007 Report)

System Description, Water Safety Plan, Improvement Schedule, (Matovo) – Sigatoka Regional Water Supply
Davendra Nath- Water Safety Plans Consultant – (SOPAC/WHO), Fiji 2009 Page 18
Table 5-Population Change 1996 – 2007 Nadroga/Navosa Area
Area 2007 Pop 1996 Pop Change (number)
Change (%)
Nadroga Total 58,623 54,083 4,540 8.4
Urban 9446 7862 1584 20
Rural 49,177 48,221 2,958 6.25
Source: Fiji Islands Bureau of Statistics –Press Release N0.53, 2007
Although the overall population growth rate of Fiji is 1.62% the areas which grew most rapidly during the last census period were the peri-urban areas of Nadi and Lautoka. These area average growth rates were 2.8% and 2.3% respectively. (Census 2007 Report) Tourism and Development During the 1996-2007 intercensal periods, the population of Nadroga/Navosa also increased at about the national average. The substantial increase in the category others is probably related to the relative abundance of Coral Coast freehold leases. (Census 2007 Report- Bureau of Statistics- Fiji, No.45, 2008) Visitor arrivals in 2004 reached a record of 504,075. This number represents an increase of 17% over the 2003 figures of 430,800 and the first year to surpass the 500,000 mark in visitor arrivals in Fiji.(Statistical News- Fiji Islands Bureau of Statistics- No.12,2009).
Year 2002 2003 2004
Visitor Arrivals 397,859 430,800 504,075
1.13 Health Status
Fiji enjoys a relatively high standard of health compared to many of its Pacific Islands neighbours. Comprehensive health care and immunisation programs, coupled with other initiatives undertaken by the Ministry of Health to promote healthy lifestyles, such as health education in schools, Healthy Islands Concept and health promoting communities project, have contributed to a high health standard.
The average life expectancy has increased from 61.4 to 70.6 years for males and from 65.2 to 74.9 for females for the period 1993-1997. The infant mortality rate is around 22 per 1000 live births (Bureau of Statistics 1999) While general health indicators have improved, non-communicable diseases such as diabetes, heart diseases, cancer and respiratory diseases have been on the increase and are the main illnesses of concern in Fiji. The diseases are attributed to changes in lifestyle such as smoking, obesity and diet. Health reports indicate that the main illnesses in the greater Nadroga/Navosa province are diabetes, hypertension and asthma. Some key diseases, which have been reported to health authorities for the whole of Fiji in the five year period from 2003 to 2007, are presented in table 6 below.

System Description, Water Safety Plan, Improvement Schedule, (Matovo) – Sigatoka Regional Water Supply
Davendra Nath- Water Safety Plans Consultant – (SOPAC/WHO), Fiji 2009 Page 19
Table 6-Notifiable Diseases for Fiji
Name of Disease 2003 2004 2005 2006 2007
Acute Poliomyelitis 0 0 0 1 0
Dengue 2762 84 27 34 83
Diphtheria 0 0 0 0 0
Dysentery 142 152 114 106 203
Encephalitis 4 0 1 3 1
German Measles 2 2 0 7 0
Diarrhoea 6,103 5,844 6,309 11,411 7,625
Infectious Hepatitis 100 75 72 81 119
Malaria 12 3 5 2 1
Meningitis 47 63 118 107 120
Tetanus 0 4 1 0 0
Typhoid 26 7 117 167 299
Tuberculosis 188 135 133 93 54
Source: Ministry of Health, Fiji – 2007 Annual Report
Figure 2 - Notifiable Diseases for Fiji -2003-2007
The Central Board of Health was satisfied with the quality of mains water supply available in Nadroga/Navosa area. In year 2008 total water samples analysed were 166 and 123 of these were rated satisfactory. Health Authorities informed that the use of rivers and creeks for water is rare in Nadroga/Navosa area and there is a high level of awareness about polluted water and the need to boil before consumption. The media is used to notify the public about unsafe water condition if necessary.

System Description, Water Safety Plan, Improvement Schedule, (Matovo) – Sigatoka Regional Water Supply
Davendra Nath- Water Safety Plans Consultant – (SOPAC/WHO), Fiji 2009 Page 20
Table 7- Bacteriological Water Sampling for Nadroga/Navosa Area - 2008
Sampling Area Total samples taken
Number Satisfactory
Number Unsatisfactory
% Unsatisfactory
Bacteriological 48 30 18 28
Chemical 12 10 2 15
Total 60 40 20 33 Source: Ministry of Health- Unsatisfactory samples are mostly from untreated supply.
1.14 Climate Data The climate in Fiji is dominated by the South East trade winds. Exposure and topography control the distribution of rainfall on the islands. Average annual precipitation for Fiji group ranges from 1500 -4000mm. Rainfall for the March to May 2008 period was predicted to be average to above average across Fiji. The confidence level of the forecast was generally moderate. Most parts of the country experienced widespread rainfall with occasional heavy falls during the first three weeks as troughs of low pressure remain at western side causing flooding in January, 2009 in Nadi.
Figure 3 - Total Monthly Rainfall – Nadroga/Navosa for year 2008 Data Source: Fiji Metrological Services – 2008
Total Monthly Rainfall 2008

System Description, Water Safety Plan, Improvement Schedule, (Matovo) – Sigatoka Regional Water Supply
Davendra Nath- Water Safety Plans Consultant – (SOPAC/WHO), Fiji 2009 Page 21
2. SYSTEM DESCRIPTION MATAVO WATERSUPPLY Water Supply Information Sheet
Catchments & Intake
Catchment
Source: Sigatoka River intake (Surface water)
Waste entering into the catchment from wild animals(pigs/cattle)
Frequent flooding at the intake during rainy season
Fish /shellfish and wild water fowls common in the area
Decaying vegetation around the catchment
Access of humans/animals into catchment area Intake
Intake located on sigatoka river bank (Concrete Structure).
Korotogo borehole intake pumped to the reservoir.
Qereqere borehole intake to Voua reservoir
Borehole intake water is chlorinated and pumped to the reservoirs
Treatment
Water from Sigatoka River is pumped by mechanical/flight electrical pumps to Matovo Treatment Plant.
Chemical mixing (Alum, Soda Ash, and Copper Sulphate) is done at the fresh water inlet at the plant.
Sedimentation and Coagulation is done at the horizontal clarifiers.
Rapid sand filtration is done) eight filter beds available.
Chlorine dosing is done via an injector at the main line, prior to distribution.
Modern with computerised operation
Storage and Distribution
Treated water is pumped to the storage reservoirs and gravity flows to
the distribution.
Supply rate is about 16 Mega Litres per day of treated water.
Water is pumped and stored in 7 reservoirs along the distribution network.
Distribution of mains line is of 150-500 diameter iron and PVC pipes.
All consumers are metered and water charges are imposed.

System Description, Water Safety Plan, Improvement Schedule, (Matovo) – Sigatoka Regional Water Supply
Davendra Nath- Water Safety Plans Consultant – (SOPAC/WHO), Fiji 2009 Page 22
Figure 5 – Matovo Water Supply Schematic
Sigatoka River located opposite the road from the
Treatment Plant
Galleries/Flight Pumps
To Lawai Reservoir
Sedimentation Tanks
Clarifier Sludge Pumps
Receiving Well
PRE – CHEMICAL DOSING
Horizontal Clarifiers
Filter
Wash Water
Holding Tank
Back Wash
Pump
Isolation
Reservoir
Distribution to
SUPPLY
Rapid Sand Filters
Chlorine
Gas Chlorine
Injector
Dosing
Pumps
Alum
Soda Ash
Copper Sulphate
Effluent Pump
1
6
3 4
2
5
Uplift Pumps
Garage
Flocculation
Computer Control
Centre
7 8
Sludge Lagoon 2
Sludge Lagoon 1
Office
CH
EM
ICA
L
ST
OR
AG
E
BU
ILD
ING
Sludge
Thickener

System Description, Water Safety Plan, Improvement Schedule, (Matovo) – Sigatoka Regional Water Supply
Davendra Nath- Water Safety Plans Consultant – (SOPAC/WHO), Fiji 2009 Page 23
Figure 3: Korotogo and Qereqere Intake and Treatment
(No Treatment except chlorination)
Chlorine Injection
Korotogo Intake (Borehole) Chlorine Mixing Tanks
Borehole
Up-Lift Pumps Power
Operated
Korotogo Reservoir (Gravity Flow)
Qereqere Intake (Borehole)
Qereqere River
Boreholes (3 only 1 in operation)
Chlorine Mixing Tank
Chlorine Injection
Motor Pump
Voua Reservoir Pump and Gravity flow to
Natadola
Natadola
Office
Distribution
Main
Office
From Matovo Water
Treatment Plant

System Description, Water Safety Plan, Improvement Schedule, (Matovo) – Sigatoka Regional Water Supply
Davendra Nath- Water Safety Plans Consultant – (SOPAC/WHO), Fiji 2009 Page 24
Figure 6 - TREATMENT PROCESS MATOVO TREATMENT PLANT
Removes leaves, sticks, fish and other debris
Kills most disease causing organisms & Helps control taste and odour causing substances
Causes very fine particles to clump together into larger particles
Mixes chemicals with raw water containing fine particles that will not
readily settle or filter out water Gathers together fine, light particles (floc) to aid the sedimentation and filtration process.
Settles out larger suspended particles. Filters out remaining suspended particles Kills disease causing organisms. Provides chlorine residual for distribution system.
Provides chlorine contact time
RAW
WATER
SCREENS
FLASH
MIX
COAGULATIO/
FLOCCULATION
SEDIMENTATION
FILTRATION
POST
CHLORINATION
N
Pre-chemical dosing of
Alum, Soda ash and Copper
Sulphate to adjust pH and
Control algal growth
Fresh Water
Receiving Well
CHEMICALS
CLEAR WATER
FINISHED WATER
Sludge Removal
Sludge Thickerner Sludge Lagoons

System Description, Water Safety Plan, Improvement Schedule, (Matovo) – Sigatoka Regional Water Supply
Davendra Nath- Water Safety Plans Consultant – (SOPAC/WHO), Fiji 2009 Page 25
Figure 7 - Flow Chart for the Matovo Water Supply System
er beds x
Source: Sigatoka River/Korotogo/Qereqere
Boreholes Intakes
Screens/Weirs/Gabions
Pumped from Intake by Submersible /flight
pumps/power motor
Flash Mixer @ Treatment Plant – pre
chemical dosing at Fresh Water Receiving
well (computerised control)
Sedimentation @ the
Horizontal clarifiers
Clear Storage Reservoir
Motovo/Lawai
Distribution
Gravity flow to Pipe
network and Storage
Reservoir
Post Chemical Dosing
-Chlorination/ Lime Addition for pH correction
and maintaining residual chlorine
- High Iron and manganese content
500/600 diameter mains to
distribution reservoirs
Filter
beds x
6
8 Rapid Sand filters /Computer controlled backwashing

System Description, Water Safety Plan, Improvement Schedule, (Matovo) – Sigatoka Regional Water Supply
Davendra Nath- Water Safety Plans Consultant – (SOPAC/WHO), Fiji 2009 Page 26
2.1 Matovo Catchment and Intake The source for the Nadroga water supply is the Sigatoka River, which is located on the opposite side of the treatment plant. Additional water is supplemented by two borehole intakes at Korotogo and Qereqere. The water flows by gravity to distribution and booster pumps are used to increase the pressure in the mains. There is extensive farming and human activities in or around the catchment area (Sigatoka River). Some wild animals such as pigs and waterfowl are common and the dam supports fish and shellfish. The intake water becomes turbid due to the shellfish collection by the households in the area. Due to heavy rains and nature of surrounding soil there is increased turbidity in the dam and the colour of water turns brown. Due to large water capacity and human activities as farming and fishing there is significant change in the water quality. There is no sedimentation in the river due to fast flow and turbulence during floods. Floods are common and the the intake galleries are damaged. There has been no major water problem encountered over the years as claimed by water supervisor. As there is no fencing it is likely that access can be available for some wild and domestic animals. Surface water that runs off the land into the river has dissolved minerals such as hardness salts, iron and manganese due to the topography and soil structure. However the river can be contaminated by mud from erosion and there is increase in (turbidity) and microbiological organisms. The organic components are a mixture of plant debris and clay which settle down at the bottom of the river. Korotogo Borehole Intake A borehole intake is located at Korotogo which supplies addition I MLD and it is pumped to the Korotogo reservoir after chlorination. There is one pump attendant who mans and monitors the flow and chlorination. The station needs to be improved in terms of chlorine monitoring and borehole maintenance. Qereqere Borehole Intake This intake is located inland in the flats of Qereqere amongst the sugar cane farming area. There are three boreholes in place but only one bore is only used. The other two have the malfunctioning motors. Since all the intakes are located on the banks of Qereqere River they are prone to flooding. Since there is no protection of the pumps and borehole contamination and damage is possible. There is a pump station where chlorination is done and monitored prior to pumping the water to the mains for distribution to Voua and Natadola reservoirs. 2.2 Matovo Treatment Plant Processes Raw water is delivered to Motovo WTP from Sigatoka River by field gallery submersible pumps and by flight pumps and arrives by twin 600/700 diameter steel pipes. The full conventional water treatment is done at the plants and treated water is pumped to storage reservoirs and distribution by uplift pumps controlled by the computers. The pre-treatment chemicals such as Soda Ash, Alum and copper sulphate are added at the receiving well. The flocculation and coagulation occurs at horizontal clarifies and the sedimentation tanks. Filtration and chlorination is done to the water prior to delivery to consumers through the distribution mains. The clarifiers sludge is disposed into the lagoons after passing through the sludge thickener located at the plant site.

System Description, Water Safety Plan, Improvement Schedule, (Matovo) – Sigatoka Regional Water Supply
Davendra Nath- Water Safety Plans Consultant – (SOPAC/WHO), Fiji 2009 Page 27
The total flow that has been achieved with all the existing water pumps running (as at 2005) is around 13,200 m3 /day or 550m3/hr. When only one of the gallery pumps is operating the flow is around 450m3/hr1. 2.3 Raw Water Receiving Well At raw water receiving well pre-chemical dosing occurs and alum/soda ash and copper sulphate is added. There is an inline static mixer with an injection point for aluminium sulphate (alum). The alum is added as a solution that is made up on site. The alum is a coagulant that will both react with negatively charged colour molecules and then react with the water to form gelatinous particles, or floc. The static mixer provides a high level of turbulence so that the alum is instantaneously mixed with the incoming raw water. The instantaneous mixing is required because the reaction between the alum and the colour molecules occurs very rapidly. Dosing of the alum will lower the pH of the water. The water flows into the bottom of the inlet channel and then overflows two weirs into two separate channels. Each weir is designed to accept a flow of 8,000m3/day. The pipes from the weir flow to two parallel flocculation chambers and subsequently into two sedimentation tanks. Each of the parallel tanks is designed for a flow of 8,000m3/day and therefore the maximum capacity of the existing plant is 16,000m3/day or 670m3/hr. 2.4 Clarifiers – Flocculation and Sedimentation The flocculation chambers consist of long narrow channels that the water passes through. These are baffles in the channel that causes gentle turbulence to mix the water. The water is mixed so that floc that are formed in the coagulation stage are encouraged to collide and combine with one another. In this manner they form larger floc that will settle more rapidly in the sedimentation stage. The channel is split into three separate sections and there is a different number of different sized baffles in each of the three sections. The different sizes and spacing are designed so that the mixing is more vigorous at the start of the channel and less vigorous in the subsequent two sections. The detention time is at least 20 min at maximum flow. Soda ash can be dosed into the flocculation channel to raise the pH if required. The soda ash is dosed as slurry that is made up onsite. In the sedimentation tanks the water passes under a horizontal baffle and then rises up through some plastic lamella plates. The lamella plates are on an angle of around 60* and about 50mm apart. All the water rising through lamella must pass between two of the plates. In the sedimentation tank, the floc that were formed when the alum was dosed and then increased in size in the flocculation stage – drop towards the bottom of the tank. When the water is passing through the lamella plates the floc has to drop a maximum of 50mm and it reaches the surface of the plates where the upward velocity of the water is zero. The solid sides down the plates and falls to the bottom of the tank.
1 Information from Motovo Operations and maintenance manual - April 2005, Presently inflow and outflow meters not working

System Description, Water Safety Plan, Improvement Schedule, (Matovo) – Sigatoka Regional Water Supply
Davendra Nath- Water Safety Plans Consultant – (SOPAC/WHO), Fiji 2009 Page 28
2.5 Filters
The water that overflows the weirs in each sedimentation tanks combines and then flows to the inlet channel for the filters. There are eight individual filters designed for a flow of 2,000M3/day and has a dimension of 6.1m by 2.4m. The flow is split into filters by weirs. The filters have an air scour and a backwash. The air is provided by blowers and the backwash water flows by gravity from the backwash tank. The water flows down through a layer of filter sand and through the filter floors. The filtered water is collected in a filtered water pipe. There is one pipe for the filtered water from four of the filters and another pipe for the water the other four filters. The filtered water flow is split from this point until it is combined in the wet well for the high lift pumps. There is a tapping point on each of the filtered water lines. These tapping points convey water to turbidity analysers. In this way the combined turbidity from each set of four filters can be determined. Alarms are raised if high turbidity is detected. The filters are mono-sand filters. The filter bed depth is 650mm and the sand has an effective size of 0.5mm and a uniformity coefficient of 1.5-6. The filter bed is suspended above a plenum floor. The filter nozzles have a small hole that sits just below the floor that air passes through during the backwash stage and large nozzles at the bottom that water passes down through during filtration and backwash water rise up through during backwash. The flow into each filter is through a penstock gate and during normal operation water flows out the filtered water valve to the contact tank. The purpose of the filters is to remove fine particulate matter from the water that comes from the sedimentation tanks. This particulate matter will include floc that has been formed in the coagulation process and also any particle of iron and manganese that have formed by oxidation with potassium permanganate. As the filters collect material the water level above the filter bed will rise. The filter can be cleaned using the backwashing cycle. In the backwashing cycle ain and water are forced backwards through the filter to remove dirt and carry it to the drain.
Filtered Water Turbidity Meters There are two filtered water turbidity meters at the plant .they are HACH 1720E turbidity meters. There is a sampling point on the filtered water line that runs from filters 1 – 4 that feds turbidity meter 1. It measures the combined turbidity of the four filters. Turbidity meter 2 monitors the filtered water from filters 5 -8. The turbidity meters are a way that the operators can monitor the performance of the filters. The target turbidity at the plant is less than 1.0 NTU. The operators should the trend of the filtered water turbidity and determine what the plant is capable of producing when it is operating well.

System Description, Water Safety Plan, Improvement Schedule, (Matovo) – Sigatoka Regional Water Supply
Davendra Nath- Water Safety Plans Consultant – (SOPAC/WHO), Fiji 2009 Page 29
Figure 9 - Site Plan Matovo Treatment Plant 2.2.1 Flash Mixer
Sedimentation Tank
Intake Sigatoka River
Road to
Plant
Filters- 8
Clarifiers Receiving Well
Sludge Disposal
Lagoons
Reservoirs
Staff Quarters
Clarifiers
Garage
Computer
Control
Room
Contact Tank
Chemical dosing/
Pumps
Office/ Lab
Soda Ash
Alum/Copper Sulphate
Chlorine Sludge
Thickener Staff
Quarters
Sludge Pipe
Filter Back
Wash Tank
Chemical
Storage
Lagoons
Lagoons
Up-Lift
Pumps
Intake Galleries
Valley Road
To Sigatoka
Manual Chlorination
To Distribution

System Description, Water Safety Plan, Improvement Schedule, (Matovo) – Sigatoka Regional Water Supply
Davendra Nath- Water Safety Plans Consultant – (SOPAC/WHO), Fiji 2009 Page 30
Water Testing for correct chemical dosing Chemical storage/ mixing tanks
Horizontal clarifiers and Sedimentation Tanks Rapid Sand filters The chemical dosing at the Receiving Well is as follows:
Table 8- Raw Water chemical dosing
Chemical Solution Strength Dosing Range Pump Rate (at 16 MLD)
Alum
o.5%
2.g/m3 670m3/hr
Soda Ash 0.5%
10.g/m3 670m3/hr
Copper Sulphate 10% 10kg/100L
Only if algae is present in the raw water
Potassium Permanganate
0.1% 2.0g/m3 670m3/hr
All chemical dosing is automated at Motovo plant. Dosing pumps have constant speed motors and the only adjustment is manual, on stroke length. Thus dosing rate turndown is less than about

System Description, Water Safety Plan, Improvement Schedule, (Matovo) – Sigatoka Regional Water Supply
Davendra Nath- Water Safety Plans Consultant – (SOPAC/WHO), Fiji 2009 Page 31
6:1. The need for adjustment is determined largely by instinct and judgement of the plant operator in accordance to changes in flow rate and in raw water characteristics. Dosing of alum and soda ash consists of dribbling chemical solutions onto the surface of the water as it enters the receiving well. The practice is not appropriate as it prevents the coagulant reacting fully with the suspended solids and colloids in the raw water. It also leads to the formation of stable, quasi-floc species which are not able to react with polyelectrolyte and pass through clarifiers and filters. These un-re-actable solids contribute to filter bed degradation through mud-balling and blinding as well as degrading final water quality.
Table 9 - Chemicals added in the purification processes at Matovo Treatment Plant:
Chemicals Process Benefits
Aluminium Sulphate (Alum) Helps in the process of Coagulation
Sodium Carbonate (Soda Ash) Adjusts the Alkalinity and Acidity of Water
Hydrated Lime pH and acidity of Water
Copper Sulphate Controls the growth of Algae
Chlorine Disinfectant – kills germs(bacteria)
Potassium permanganate Oxidise and removes Iron and manganese
Table 10 - Chemical test done at the Motovo Treatment Plant to monitor Efficiency
Type of Test Equipments Used
Residual chlorine Lovi Bond colour comparator with Plain test Tablets
Turbidity HACH Brand 2100p Turbidity Meter
Jar test One litre glass jars with alum solution
pH test Screen methyl orange 10 drops, colour matching Lovi Bond (Nasselerise)
Chemical dosing pumps – Matovo Chlorine drip injection -Qereqere

System Description, Water Safety Plan, Improvement Schedule, (Matovo) – Sigatoka Regional Water Supply
Davendra Nath- Water Safety Plans Consultant – (SOPAC/WHO), Fiji 2009 Page 32
2.6 Chlorination The contact tank is located next to the filter block. It has two compartments, and each serves for four filters. Each side of the contact tank consists of long channels that the water must pass through before it can enter the high lift pump wet well. The contact tank provides a minimum of 30 minutes retention for chlorine contact to satisfactorily disinfect the water.
High Lift Pumps
There are four high lift pumps that are wired up at the WTP. They are hydro-titan 150x125x315. The motors on the pumps are WEG 315/W and are 160kW motors. The four high-lift pumps have manual isolation switches beside them. There is a fifth pump that is not connected. Each pump is capable of pumping over 8,000m3/day.
Gas Chlorination
At Matovo chlorine gas is dosed as a disinfectant for the water. The residual chlorine level of 0.2mg/l at the consumer end is desirable. The plant level dosage is between 1-2mmg/l. The dose applied may be varied according to the need to ensure residual is reaching all parts of the water supply system. Chlorine gas is delivered to the plant in 920 Kg steel cylinders and the injection system is fully automated. Manual control of chlorine dosing is done. The operator controls the flow of water through the venturi gas educators using manual valves on the water lines. The operators can change the gas flow through the V-notch gas regulators by turning the knob on top the front of the regulators on top. The operator must calculate the required chlorine dose rate by determining the required chlorine dose rate (likely to be around 1.5 mg/m3). The required gas flow rate is determined by multiplying the dose rate by the water flow rate. For example if the flow rate is 500m3/hr and the dose rate is 1.6 g/m3 the total flow of chlorine gas would need to be 800g/hr. If two chlorinators are running this would be 400g/hr each.2
Gas chlorine cylinders -920 kg Functioning Chlorinator
2 O&M Manual for Matovo doc – April 2005
System Description, Water Safety Plan, Improvement Schedule, (Matovo) – Sigatoka Regional Water Supply
Davendra Nath- Water Safety Plans Consultant – (SOPAC/WHO), Fiji 2009 Page 33
Chlorine Dosing Rate:
Dose Rate Formula - Weight of Chemical x 1000 = Dose rate Inflow per shift Plant water inflow per shift = 33.600 litres Method A - Gas Chlorination
- Chlorinator No.1 = 2kg - Chlorinator No.2 = 4kg - Total = 6kg/hr - 6x8hrs per shift = 48kg per shift (Dose rate)
48 x 1000 = 1.375 ppm which gives 0.8 residual chlorine
33,600 Method B – HTH Powder Chlorine in 40kg Drum –Manual mixing and drip feeding ( To Top up if gas chlorination is not providing the required residual chlorine) -10 kg x 60% strength = 6kg x1000 = 0.18 ppm 33,600 Total dosing = Gas Chlorination - 1.375 HTH –Top up - 0.18 1.555 ppm which gives plant level dosing at 1.1 ppm If the inflow water is dirty then plant dosing rate is increased to 1.5 ppm. A sample calculation of chlorine dose rate is provided below: Required chlorine dose rate: 2.2 mg chlorine / Litre of filtered water at a plant inflow rate of 65 MLD Dose rate: 2.2 mg/L Filtered water flow: 65 ML/d (Assume Stage 1 has 45ML/d and Stage 2 20ML/d Therefore mass of chlorine to be dosed in one Hour: Stage 1: 2.2 mg/L x 45 ML/d divide by 24 hrs = 4.1kg/hr Stage 2: 2.2 mg/L x 20 ML/d divide by 24 hrs = 1.8 Kg/hr Total for the plant = (4.1 kg +1.8 kg) = 5.9 kg/hr
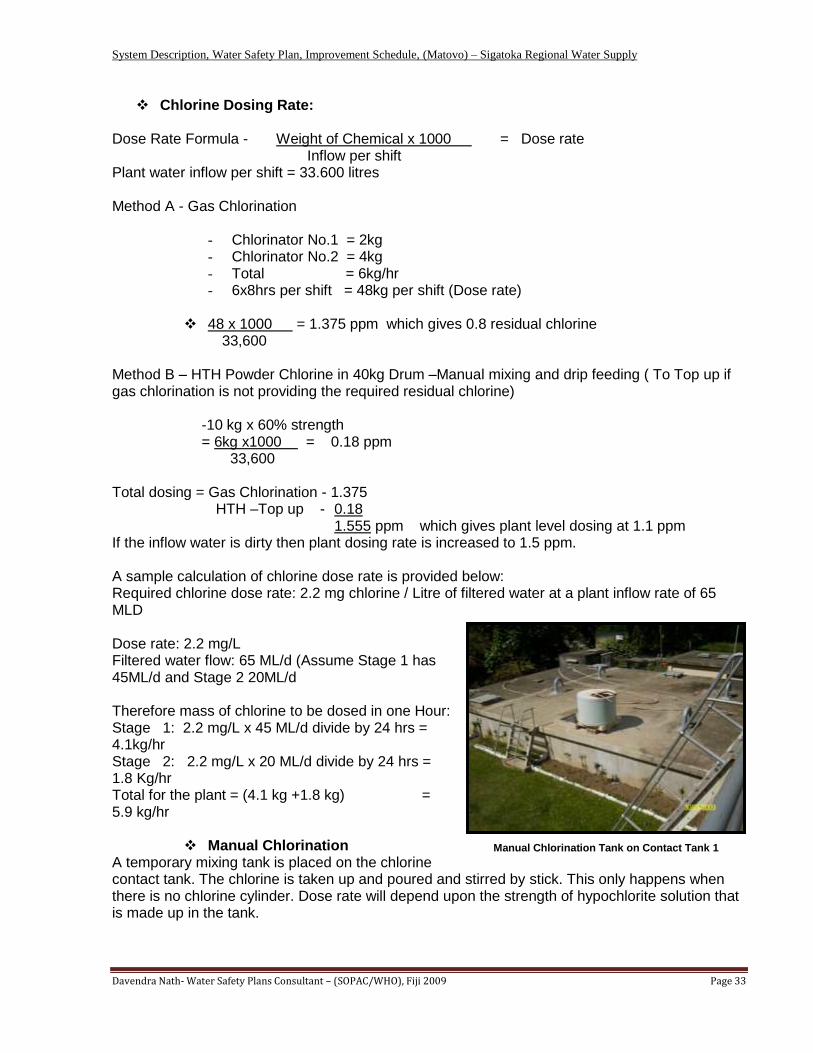
Manual Chlorination A temporary mixing tank is placed on the chlorine contact tank. The chlorine is taken up and poured and stirred by stick. This only happens when there is no chlorine cylinder. Dose rate will depend upon the strength of hypochlorite solution that is made up in the tank.
Manual Chlorination Tank on Contact Tank 1

System Description, Water Safety Plan, Improvement Schedule, (Matovo) – Sigatoka Regional Water Supply
Davendra Nath- Water Safety Plans Consultant – (SOPAC/WHO), Fiji 2009 Page 34
2.7 Sludge Disposal The sludge thickener is located beside the pump house .the sludge thickener consists of a circular concrete tank with a floor that slopes to a sump in the centre and an overflow weir at the top around the outside. There is also a slow rotating scraper that helps to push the solids into the central sump. The purpose of the sludge thickener is to separate the majority of the solids from the sedimentation tank sludge from the water that is discharged to the roadside drain. The sludge from the sedimentation tank enters the sludge thickener. The time that water spends in the thickener is relatively long. The solids in the sludge will settle in the bottom of the tank. The rotating scrapper will push the solids into the sump in the centre. The water that overflows the weir around the side of the thickener will be cleaner than the sludge that entered the thickener.
Sludge Lagoons
There are two sludge lagoons for the WTP. They are located across the road from the WTP on the river flood plain as seen in the picture. The water flows into the lagoon from a pipe at one end. At the other end of each lagoon there is an outlet box that includes an overflow weir. The height of the weir can be adjusted to allow the operator to decant water from the lagoon. The water that overflows the end of the lagoons flows out a drain and into Sigatoka River. The purpose of the lagoons is to capture the solids from the sludge the sludge thickener effluent before they are discharged into the Sigatoka River.
3. STORAGE AND DISTRIBUTION
The design capacity for the Matovo Treatment plant is 16 MLD, but due to demand the production capacity may increase in future. From the Matovo WTP the treated water flows to the Lawai reservoir from where it flows by gravity to consumers. There are two bore well water extractions at Korotogo and Qereqere from here the water is pumped to the two reservoirs located at Korotogo and Voua. Borehole water is chlorinated prior to pumping to the storage facilities and distribution.
Metered domestic per capita consumption varies across geographical regions from 73 l/p/d to more than 200l/p/d. The average metered domestic consumption recorded during 1998 drought
Sludge Thickener – Matovo WTP

System Description, Water Safety Plan, Improvement Schedule, (Matovo) – Sigatoka Regional Water Supply
Davendra Nath- Water Safety Plans Consultant – (SOPAC/WHO), Fiji 2009 Page 35
was only 143 l/p/d. However when metering errors and suppressed demand are taken into account, the true average per capita consumption is calculated to be as 185 – 190 l/p/d. Based on population and development projections in Sigatoka area the demand for average daily water is expected to increase in future. The reservoir tanks are of concrete structure and needs maintenance to eliminate recontamination of the water. The distribution network needs improvement and maintenance due to water demand stress. The recent flood in the area has worsened the problem and had exposed the mains. Due to old infrastructure there are leakages and, unaccounted use for water is running at levels of about 30 %. The WSD has established a Leak detection programme and curbing on illegal water connections. The distribution system comprises of about 800km of pipes larger than 50 mm diameter. Discussions reveal that there is a need for leak detection equipments and training as assistance is from Lautoka office. The common problems noted at reservoirs were the missing and rusted cover lids and the monitoring of the water level. There is no stipulated schedule of the reservoir cleaning and maintenance as this largely depends on the annual budget. Most of the allocated funds are exhausted in the middle of the year and utilised on other important services.
Even though there is a maintenance team at Nadroga water supply, due to the old system and constrained resources many complaints are received and handled accordingly. It is necessary to establish proper staff recruitment and training procedures for the efficiency of the services. The figures below show the location of reservoirs and pump stations within Sigatoka /Matovo distribution system.
Complaints on Water Services for the Month of July 2009
1. Total Complaints Received 78
2. Burst Mains 5
3. Service Pipes 30
4. No water (Low pressure) 10
5. Defective Meter 9
6 Leaking Fire Hydrant 1
7. Total Complaint Solved 68
8. Complaints Pending 10

System Description, Water Safety Plan, Improvement Schedule, (Matovo) – Sigatoka Regional Water Supply
Davendra Nath- Water Safety Plans Consultant – (SOPAC/WHO), Fiji 2009 Page 36
Figure 10 –Sigatoka (Matovo) Water Supply Distribution System

System Description, Water Safety Plan, Improvement Schedule, (Matovo) – Sigatoka Regional Water Supply
Davendra Nath- Water Safety Plans Consultant – (SOPAC/WHO), Fiji 2009 Page 37
Figure 11 –SIGATOKA (MATOVO) WATER DISTRIBUTION NETWORK
Korotogo Pump Station
Voau
TWL 61m
Natadola
TWL
114.5
300
Lawai No.2
TWL 120 m
Pumps
Lawaqa
Res
TWL 56m
Korotogo
TWL 90
200-150
Legend Reservoir
Direction of Flow………..
Pipe Diameter..................... 200 -150
TWL … … ……. ………Top Water Level
450mm line
MATOVO
TREATMENT
PLANT
Qereqere Pump
Station
450/300 twin line
300
Lawai No 1
TWL 108 m
NADI/LAUTOKA DISTRIBUTION NETWORK
Volivoli
TWL 53.6
Motovo Intake – Sigatoka River
Motovo Reservoir
Korotogo Borehole
Qereqere Borehole Intake

System Description, Water Safety Plan, Improvement Schedule, (Matovo) – Sigatoka Regional Water Supply
Davendra Nath- Water Safety Plans Consultant – (SOPAC/WHO), Fiji 2009 Page 38
Table 11 - Reservoir Condition and Risk Assessment
Reservoir Location
Type of Tank
Risk Assessment Capacity Mega litre (cub. m)
Top Water Level
(TWL)m
No. days’
supply @200 l/p/d
1. Lawai N0.1 Steel//galvan
ised
Reservoir receives treated water from Motovo and gravity supplies to other reservoirs. Inlet chamber and turn keys well protected. Well fenced no access for animals and people
1818 108 2
2. Lawai No.2 concrete Old–un o maintained not in use. Overgrown grass and damaged lids.
n/a 120 4
3. Volivoli concrete Inlet chamber damaged easy access for rodents and small domestic animals into the tank. Ground level, needs drainage
568 56.3 1
4. Lawaqa concrete Partly below ground level. Compound overgrown with grass. Needs drainage. Chamber was seen left open and rusted.
400 56 3
5. Korotogo concrete Open and rusted inlets 568 90 1
6. Voua concrete
Below ground level. Trees close to reservoirs. Inlet chamber open and rusted. Easy access for rodents and domestic animals.
3270 61.2 1
7. Natadola concrete Three concrete tanks half underground. Well maintained
166 1
Lawai Reservoir – New -Steel Bolted Korotogo Reservoir – Concrete and well fenced

System Description, Water Safety Plan, Improvement Schedule, (Matovo) – Sigatoka Regional Water Supply
Davendra Nath- Water Safety Plans Consultant – (SOPAC/WHO), Fiji 2009 Page 39
Table14 - Reservoir Condition Assessment-Sigatoka (Matovo) Water Supply
Reservoir Location
Type of Tank
Risk Assessment
Fence Gate Compound Chambers Water level
Indicators
Ladders
1. Lawai No.1 Steel Bolted on concrete
base Satisfactory
Needs repair
clean good manual satisfactory
2. Lawai No.2 Concrete (not
in Use) nil nil
Needs cleaning of grass/trees
Rusted/ missing
manual Unsecure/
rusted
3. Volivoli concrete Needs repair Needs repair
Compound needs drainage
Rusted/ broken inlet
manual Ground
level
4. Lawaqa concrete Needs repair good Needs cleaning
of grass and drainage
Needs cover manual Needs repair
5. Korotogo concrete good good clean Open /lid missing
manual good
6. Voua concrete good good clean Missing/
Rusted lids manual good
7. Natadola Concrete/circ
ular good good
Clean recently constructed
Rusted needs replacement
manual good
8. Korotogo Intake
Borehole
good good clean Needs repair nil nil
9. Qereqere Intake
Borehole (3) one in use
nil nil clean Needs barrier
wall nil nil
Lawai –Unmaintained Reservoir Vuoa Reservoir – Damaged lids

System Description, Water Safety Plan, Improvement Schedule, (Matovo) – Sigatoka Regional Water Supply
Davendra Nath- Water Safety Plans Consultant – (SOPAC/WHO), Fiji 2009 Page 40
3.1 SIGATOKA WATER SUPPLY DISTRIBUTIONS The maximum storage capacity of the reservoir within Sigatoka Regional supply is about 3,270 cubic meters. From these reservoirs, treated water is distributed to Sigatoka urban and rural areas via two connected distribution mains. The area experiences water cuts therefore it is recommended that unused Lawai reservoir should be utilised to overcome water cuts due to reduced storage. The reservoirs are located at a maximum height of 108 m so there is good head pressure in the supply system.
Secondly the high- lift electrical pumps are used to supply water to the reservoirs which are located at fairly long distances. The distribution mains are of the sizes of 150mm to 450 mm. The distribution mains are laid alongside the roads and across the farm lands and tramlines in order to have easy access for maintenance. Some reservoirs need major improvements such as fencing and provisions of lids and covers which were seen either rusted or left open.
High Lift pumps and Treated Water Pipelines
From the Motovo WTP four high-lift pumps the water for reticulation. Each pump is fitted with a variable speed drive (VSD). The VSDs on the high-lift pumps are controlled automatically to provide a constant level in the distribution. Two pumps are capable of pumping more than the maximum plant output of16,000 m3/day. The operator can toggle the duty
pumps. There are two standby pumps at maximum plant flow. The distribution lines running from Matovo WTP are twin lines of 450 and 300 diameters. The 300mm line is over twenty years old. The 450 mm line was constructed in 2000.the capacity of this line is more than adequate to take the full plant flow. The 300mm line is isolated, but water can be pumped up this line as required.
Qereqere Supply System From Qereqere borehole intake the water is pumped to Voua reservoir by 150mm mains after manual chlorination. This station only supplies about 1MLD of treated water. The plant is manned 24 hrs to monitor flow and chlorination.
Manual Chlorination-Qereqere Pump Station
Voua Reservoir - Concrete
Booster Pump - Korotogo

System Description, Water Safety Plan, Improvement Schedule, (Matovo) – Sigatoka Regional Water Supply
Davendra Nath- Water Safety Plans Consultant – (SOPAC/WHO), Fiji 2009 Page 41
Korotogo Supply System Water is extracted from borehole by submersible pumps and after chlorination the water is pumped by one high-lift pump to the Korotogo reservoir located opposite Outrigger Resort. The station supplies about 1MLD of treated water. The borehole needs upgrading to eliminate contamination. All pumps are motor driven and are of centrifugal types. These have spinning impeller that rotates pushing water to the outside of the impeller and
putting it under pressure. The pressure allows the water to go uphill reservoirs or other point of water use. Interviews with a number of residents of Sigatoka areas revealed that they receive the pipe water but the low pressure is a common problem, secondly when there is a pipe breakage then fine silts are seen in the treated water. The distribution team confirmed this as a problem due to the fact that there is no drain out chambers in the lower part of the system. The dirty water at the consumer end is normally due to the siltation in the pipes which are not cleaned. It is also the possibility that some dissolved solids may have passed through the filtration system. This events signal that there is a need to improve the treatment and distribution systems immediately to improve the water quality and avoid the recontamination of treated water.
Storage Reservoirs Treated water is stored at the treatment plant site in galvanised and concrete takes. Qereqere –Borehole Intake/Pump Station
Chlorine gas is added as a disinfectant (to eliminate any remaining microbiological agents in the water). Soda Ash is used for pH adjustment.
Storage reservoirs are regularly visited to monitor the water level. The measurements are done manually. The telemetry system should be provided in order to save time and cost. The storage reservoir covers are rusted or missing. The lids should be of lighter materials such as aluminium which is also rust proof.
Natadola - Reservoir -New Concrete Structure
Korotogo Pump Station

4. WATER SAFETY PLANNING
Water Safety Plans (WSP) is the nameplate for WHO‟s new risk-assessment / risk-management approach to ensuring safe drinking water. This approach was introduced to Pacific island countries in a workshop, Nadi, Fiji, February 2005. The 18 countries and territories present completed a „Framework for Action on Drinking Water Quality and Health in Pacific Island Countries‟ to guide future activities and gather donor support. The meeting of Pacific Islands Health Ministers in Apia, Samoa, endorsed this „Framework‟ two months later with a statement in the „Samoa Commitment‟. Three Pacific-wide water quality programmes have since been proposed and funded.
Figure 12 - Stages in Development of Water Safety Plans
Prepared during the Pacific Water Safety Training and Planning Workshop 2006
Matovo- Intake Galleries on River bank Driveway to Matovo Intake –No fence/Gate
National Implementation Plan for
Water Safety Plans Programme
Actions to assist:
WSP Preparation
WSP Implementation
WSP Review and Evaluation
Preparing WSP
Implementing WSP
Reviewing outcomes of WSP
Practice at:
WSP Preparation
Commitment to:
WSP
Stages in Developing and Implementing a Water
Safety Plans Programme
Introduction to:
WSP
Reviewing outcomes of WSP Programme

System Description, Water Safety Plan, Improvement Schedule, (Matovo) – Sigatoka Regional Water Supply
Davendra Nath- Water Safety Plans Consultant – (SOPAC/WHO), Fiji 2009 Page 43
Figure 13 - Stages in Implementation of Water Safety Plan
Figure: 9 WEDC Publications 2005
4.1 Improvements Needed
There is a lack of legislation, rules and standards in the water sector and the responsibilities and powers of the authorities are not clearly defined. The Ministry of Health, normally the surveillance agency, has not vigorously conducted any surveillance activity to gather sufficient data. A microbiology laboratory has been set up at Mataika House, Tamavua with necessary equipments but it is under utilised as field samples are not arriving. The field staffs, the Health Inspectors are unable to perform water quality work due to the constrained resources with their ministry. There is little or no co-operation, collaboration or exchange of information between relevant authorities. It is recommended that the Government should establish Fiji Water Authority at the earliest so that necessary strategies are formulated and appropriate management practices are in place. The tax payers are suffering due to mismanagement and high rate of corruption in many of the government ministries. The relevant authorities should establish a monitoring and surveillance scheme to which all of the authorities agree and enforce as this is important due to the re-emergence of such diseases as laptospirosis and typhoid in Fiji.
Stages in Developing and Implementing Water Safety Plans
Stage 1: Forming a WSP Steering Group
Stage 2: System description and analysis
Stage 3: Tools development and pilot activities
Stage 4: System assessment
Stage 5: WSP Matrix (developing the plan)
Stage 6: Verification (water quality assessment)
Water Safety Plan
IMPLEMENT WSP

System Description, Water Safety Plan, Improvement Schedule, (Matovo) – Sigatoka Regional Water Supply
Davendra Nath- Water Safety Plans Consultant – (SOPAC/WHO), Fiji 2009 Page 44
The Health Department should be responsible for surveillance activities and the overall supervision of the water quality aspects, and should develop a monitoring scheme for the short term including the chemical parameters to be monitored, sampling frequency and inspection regimes. National Drinking Water Quality Standards are required; this will include bacteriological, physical, and chemical quality parameters, and other acceptable levels for drinking water. Standardised sampling methods, sampling frequency and analysis methods should be derived through inter-agency studies.
Figure 14 - Risks in the Water Supply System
Matovo- Raw Water Inlet /Weirs Matovo Catchment Bore-field – Sigatoka River

System Description, Water Safety Plan, Improvement Schedule, (Matovo) – Sigatoka Regional Water Supply
Davendra Nath- Water Safety Plans Consultant – (SOPAC/WHO), Fiji 2009 Page 45
5. WATER SAFETY PLANS –MATOVO
5.1. Risk Identification Worksheets
Catchment & Intake
List what could happen that may cause drinking-water to become
unsafe (deterioration in water quality)
Is this under control? If not, judge whether this needs urgent attention.
Responsible agent/s for immediate action.
1. Easy access of animals (horses/cattle)to the intake sites (galleries and flight pumps
No. No fencing or barrier to control animal access. No drainage to control storm water entering the gallery sites
Yes/ Nadroga Water Supply to monitor and post security guards. Erect fence from the road to intake (river).
2. Siltation in the intake is likely due to soil erosion and decaying vegetation
No. No barriers to the intake. Regularly monitoring the intake ,flight pumps and the galleries bottom for siltation
Yes .Nadroga Water Supply. Prepare monitoring schedules for siltation and cleaning.
3. Sabotage / Vandalism
No. Possible intentional sabotage by chemical pollution. Security to be upgraded with provisions of caretaker, security locks and lights.
Yes/ Proper fencing is required at the Intake. Responsible-WSD. This is the major intake for Sigatoka/Nadroga Water Supply
4. Natural disaster (flooding) makes source unsafe – massive occasional erosion and blockage with debris.
No. Water intake galleries and flight pumps located on the river bank erosion is common with mud/debris entering the galleries and intake.
Yes. Use IWRM approach. WSD –hydrology section to monitor data of flooding. Upgrade intake /protect with barrier walls and lids.
5. Pollution from dead wild animals and decaying wood debris.
No. Increase in bacterial pollution
- Public Awareness and liaison with authorities and surrounding villages
No. WSD/Plant managers/regular inspection of the dam site Place Sign Boards
6. Some villagers from Naduri and Nakalavo have easy access to the river for collection of fresh water mussels.
No. To inform/educate the villages /put notices in order to eliminate contamination and causing turbidity to the water.
Water Supply Nadroga /Provincial Council/Health Department -Public Awareness

System Description, Water Safety Plan, Improvement Schedule, (Matovo) – Sigatoka Regional Water Supply
Davendra Nath- Water Safety Plans Consultant – (SOPAC/WHO), Fiji 2009 Page 46
7. Farming alongside the river No. Erosion use of farm chemicals and pollution from farm animals(cattle/pigs) is common
WSD/MPI and Health Depart to educate people. Signboard, notices and public awareness.
8. Logging in the area No. Licences permit to be issued on conditions. Logging programme.
Environmental Plan needed/ WSD/Agricultural/Environment Depart
9. Public access and eco-tourism likely to contaminate the river water
No. Public awareness/notice boards to be placed
WSD and Ministry of Tourism to provide information on use of Sigatoka river for picnic, and tourist touring.
Treatment
List what could happen that may cause drinking-water to become unsafe (deterioration in water quality) Risks: Include process/machinery failure
Is this under control?
If not, judge whether this needs urgent attention. Also, identify responsible agent(s) for immediate action.
1.High contents of Iron and manganese in the raw water from the Motovo Intake
No. There are no methods to aerate the water to remove iron and manganese. -Previously Potassium Permanganate was used but it has been stoped.
Yes. Plant operators/ Nadroga Water supply/WSD – to provide aeration methods through waterfall system. -Introduce aeration method to remove iron and manganese
2. Replace malfunctioning flow meters at plants and reservoirs.
No. Water measurement for the inflow will help in calculating the chemical dosing rate
Yes. –WSD /Design engineers Plant operators. -Work on estimation and old records
3. Filter Failures - Matovo has 8 rapid sand filters. - Filter media needs upgrading 4. Provision for flow meters to monitor backwash rate and air scouring.
No. Reduction in filter media, needs upgrading. - This will also increase the plant chlorine demand to remove bacteria. Passing of dissolved solids will produce harmful chemical reactions. -No, flow meters can contribute to fast backwash rate which can result in loss of filter media. – can lead to mud ball accumulation. To provide redundant air scourers (machine)
Yes. WSD / Design and Structures – hydraulics. Filter media needs upgrading/replacement.
- Increase backwashing Plant managers/operator Install flow meters. -upgrading/replacement of filter media.

System Description, Water Safety Plan, Improvement Schedule, (Matovo) – Sigatoka Regional Water Supply
Davendra Nath- Water Safety Plans Consultant – (SOPAC/WHO), Fiji 2009 Page 47
List what could happen that may cause drinking-water to become unsafe (deterioration in water quality) Risks: Include process/machinery failure
Is this under control?
If not, judge whether this needs urgent attention. Also, identify responsible agent(s) for immediate action.
5. Mixing of wrong chemical and incorrect dosing
No. No notices to identify the mixing chambers. No SOPs available for chemical mixing
Plants Operators Placing of notices and instruction at the mixing area. Prepare SOPS for
each section
6. Chlorine dosing rate may not counteract fluctuation in water quality accordingly.
Yes. Increase dosing rate during period of heavy rainfall. Ensure chlorinator servicing is done on time. Use of backup HTH dosing. -Do Jar test to maintain appropriate chemical dosing
Treatment Section Plant Operators. Monitoring of residual chlorine at plant and consumer end.
- Provide SOPs for jar Test and train staff.
7. Accumulation of clarifier sludge. Increase in bacteria/ unpleasant taste and smell of water, reduced retention time.
No. Sludge pumps malfunctioning due to manual operation. De-sludge Thickener
Plant operators to monitor and do regular manual cleaning. Design engineers to replace and upgrade. Reset the computerised system.
8. Algal Growth
No. Regular dosing of required amount of Copper sulphate sludge scrappers/sludge thicker/lagoons
WSD ,Engineers, Plant Operators, -Manual removing to be done when scrapper not functioning
9. Free Available Chlorine (FAC) samples taken randomly at the treatment plant.
Yes, But need a monitoring program for distribution and treatment plant. Need of proper recording of results
NWQL – chemist Plant Operators Senior Treatment Officer C/E Design proper monitoring programme with records.
10. Easy access of animals/pets into the treatment plant compound.
No. Broken fence/open gates and some staff have pets living within the compound.
Plant operator to warn the staff and place notice on the gates. -Remove all pets from WTP compound immediately.
11. Treatment facilities/storage tank/reservoir is damaged by natural disasters such as flooding, landslide, earthquakes.
Establish and follow emergency plans for all natural disaster events. Have standby power generators. Switch to manual dosing treatment if no other option permits. Follow the maintenance schedules for all repair works.
Inspection after natural disaster Water-borne diseases on the rise. Large amounts of water flowing out of the storage and distribution system.

System Description, Water Safety Plan, Improvement Schedule, (Matovo) – Sigatoka Regional Water Supply
Davendra Nath- Water Safety Plans Consultant – (SOPAC/WHO), Fiji 2009 Page 48
List what could happen that may cause drinking-water to become unsafe (deterioration in water quality) Risks: Include process/machinery failure
Is this under control?
If not, judge whether this needs urgent attention. Also, identify responsible agent(s) for immediate action.
12. Pre Chemical Dosing. Due to plant size needs to be equipped with proper chemical dosing pump for copper sulphate/alum
-Plant should maintain residual chlorine of 1.2 g/cubic meter; this will allow an acceptable residual in the reticulation system. - For effective chlorination –one chlorinator is installed at the plant - Provision of backup disinfection is provided by means of Calcium Hypochlorite (HTH)
Failure of any above measures will lead to a total collapse of water quality.
No - There is a need to upgrade OHS requirements for handling chlorine. Soda Ash- is added for pH correction in treated water. Inadequate dosing can produce acidic water. - No. the dosing system has to be maintained regularly. Separate storage of chemical is required
Yes. WSD/ Engineer Plant managers/operators Computer operators Check computer settings and manual addition of chemicals to be done during malfunction of computer. -Train staff to use Self contained Breathing apparatus (SCBA)
13. Sampling/Water quality test No, irregular testing done at plant due to lack of a proper lab and testing chemicals.
WSD/NWQL – Kinoya staff Provide necessary equipments and testing chemicals.
14. Manual Chlorination
No. Should have one mixing tank on a elevated base in line with isolation tank with a shed. -Ventilated area needed. -Provide HTH powder chlorine at all times to supplement the dosing if the mechanical system breakdowns.
Yes, WSD – Plant Operators
- Provide instruction and SOPs for manual chlorination
15. Computer Breakdown
No. Lack knowledge of computer operation of the plant. Relocation of the computer room for easy access. Proper record keeping is needed
WSD/Plant operators to train sufficient staff on computer operation.
16. There is no treatment / barrier for protozoa, so it could be assumed that they are present in water.
Upgrade filters media. Soak filters in caustic solution to remove mud balls, slime growth and cracks.
Protozoa analysis of drinking water Upgrade sand filters to increase efficiency

System Description, Water Safety Plan, Improvement Schedule, (Matovo) – Sigatoka Regional Water Supply
Davendra Nath- Water Safety Plans Consultant – (SOPAC/WHO), Fiji 2009 Page 49
Storage and Distribution
List what could happen that may cause drinking-water to become unsafe (deterioration in water quality) (Risks)
Is this under control? If not, judge whether this needs urgent attention.
Also, identify the responsible agency(s) for immediate
action.
1. Rusted and missing reservoir inlet chamber lids.
Rodents ,birds and animals can enter the reservoir tanks
No. -need to cut all trees nearby and remove discarded items from the reservoir. Repair all opening and inlets of the reservoir. - provide iron lids and cover all inlet chambers of the reservoirs. All main valves must be controlled from public access
Yes, WSD/Distribution manager Iron lids to be replace by lighter and rust resistance materials(aluminium) -Staff to follow proper procedures and cover the lids after inspection or taking Water level measurements.
2. Leakages within the distribution network could result in cross-contamination. rusted and old pipes
Breakages in
underground pipeline from other activities such as digging for electrical/ telephone cables, construction etc
Yes. A Leak detection programme has been mobilized by the DWS. No, Place warning sign and make information available. Use leak detector for underground seepage. About 30% is unaccounted water leakages through the system. Some direct connection without permission.
WSD/ Distribution manager Yes//Utility Companies Awareness. GIS /Maps Consent /Approval for development works. Regular Public awareness campaigns to be done.
3. Free available chlorine levels in the distribution system could be low due to increased turbidity after pipe breakages, old pipes and poor end mains.
No. - Current monitoring for FAC is sufficient but sampling points can be changed regularly. - Daily FAC testing to be done at the plant.
WSD/ Engineer –Nadroga Distribution Section. Manager –Motovo Treatment Plant/Bore hole pump attendants
4. Vandalism /Sabotage.
No. Common, as key valves damaged and iron lids are removed by public. - Reservoir/bore field is easily accessible by public so security, gates and fencing is required.
Yes. Police/WSD – Nadroga Water Supply. Provide steel enclosure for key area/ access to reservoir. Provide concrete walls around borehole pumps.
5. Illegal connections could lead to cross-contamination.
A regular monitoring / surveillance schedule for illegal connections. Allocate wardens in each zone/area/community.
Through Public complaints. Low water pressure in affected areas. High water demand.

System Description, Water Safety Plan, Improvement Schedule, (Matovo) – Sigatoka Regional Water Supply
Davendra Nath- Water Safety Plans Consultant – (SOPAC/WHO), Fiji 2009 Page 50
List what could happen that may cause drinking-water to become unsafe (deterioration in water quality) (Risks)
Is this under control? If not, judge whether this needs urgent attention. Also, identify the responsible agency(s) for immediate action.
6. Water is contaminated as a result of repair works in the distribution system.
No. - Insufficient flushing and chlorine wash after repair of broken mains. Few wash out system and hydrants available in the distribution system -Use appropriate backflow prevention devices, -No SOPs for repair of mains
Yes/ Nadroga-Distribution Section WSD - Engineer –Distribution Section Install non –return valves Monitoring of the distribution for bacteriological levels and residual chlorine.
7. Drop in water pressure due to high water demand disturbs sediments. Sediments settle more
in mains with low pressure.
Need to clean the distribution system with swabs(pigs)
No. - Numerous reports of insufficient water to parts of the network and dirty water seen at consumer taps. Wash out should be provided. This is a problem and water pressure should be constant to avoid sediments in the distribution.
Yes- Distribution Section. DE/W Use existing reservoirs such as one not in use at Lawai.
8. Damages to the distribution network from natural disasters such as floods, landslides and earthquakes.
No. - Survey teams in place and activated after natural disaster. Establish and follow emergency contingency plans for natural disasters.
Yes WSD-consult with Disaster Management Office for emergency water supply. The water supply department makes costs estimates for the damages and funded by HQ. Use Health Department for Public Awareness and monitoring.
9. Damage to exposed pipelines.
Yes, - Endeavour to bury/protect/encase all exposed pipelines. Have warning signs posted at reservoir and risk areas to inform the public.
Yes WSD- Nadroga /Distribution Section. Train mechanical and maintenance teams.
10. Contaminated storage reservoirs
No, - Regular cleaning of storage tanks. -Mud sedimentation common in reservoir - Old reservoir needs structural maintenance
Yes WSD/ Distribution manager Upgrade and use modern cleaning equipments to remove silts and debris,
11. Borehole Intake Contamination
Likely as no extended head cover, seepage of storm water from flooding. No fencing of bore field.
No, needs head cover /concrete paving and drainage/protective barriers walls.
12. Easy Access of Animals and people to reservoirs
No, Needs fencing of reservoirs and bore fields /place notice
Yes, WSD/Nadroga water Supply.

System Description, Water Safety Plan, Improvement Schedule, (Matovo) – Sigatoka Regional Water Supply
Davendra Nath- Water Safety Plans Consultant – (SOPAC/WHO), Fiji 2009 Page 51
5.2: Plan to Manage the ‘Needs Urgent Attention’ Catchments & Intake Risks that ‘Needs Urgent
Attention’
Improvement Schedule: How can you remove or reduce or remedy the cause and by when? Indicate where additional resources will be needed.
Until remedied, how will you know when this is actually causing deterioration towards unsafe drinking water?
What contingency management plan is in place until the cause is removed, reduced or remedied? Who needs to know and how quickly? Who can help?
1.Easy access of animals (horses/cattle)to the intake sites (galleries and flight pumps
No. No fencing or barrier to control animal access. No drainage to control storm water entering the gallery sites
Yes/ Live and dead animals seen in the catchment area – animal faeces, and water smells .Test reveals high content of bacterial organisms
-Clean the area of dead and live animals -Nadroga Water Supply to monitor and post security guards. - Erect fence from the road to intake (river).
2.Sabotage / Vandalism
- There is no fencing so access is possible by the public. - Possible intentional sabotage of electric pumps. - Caretaker /ranger to be allocated for monitoring at dam and intake pipes. - Security locks and lights needed
-Water smells looks or tastes abnormal. -Pump breaks down and there are signs of sabotage or vandalism, broken infrastructure and presence of offenders on water supply sites.
Existing dam managers should help. Responsible-WSD. Warn the public through the media. WSD/Police Dept Place public Notice at the intake and plant sites.
3. Natural disaster makes source unsafe - massive occasional flooding and erosion and blockage with debris.
Water catchment is large area uphill which has high annual rainfall and lot of other smaller tributaries joins the river. - The system is hampered during natural disasters. Establish and follow emergency contingency plans for all repair works more so immediately after a natural disaster
Change in water colour/taste and suspended matter seen. Seek immediate help of emergency water supply from the Disaster Management Office. Water cartage to the affected public
Use IWRM approach. WSD –hydrology section to monitor data of flooding. WSD/MOH to make contingency plans. Collect all related data for actions when necessary. Monitoring of Water Quality by National Lab/Plant lab Boil water advice to Public given via media.
4. Public access and eco- tourism likely to contaminate river water.
- Public awareness of target population on river care. - use of proper human excreta disposal near catchment sites.
Water smells and solid waste visible in the river. Entry of contaminated water into the intake and WTP.
Educate the people visiting the Vaturu dam for picnicking. Local Health Authority to monitor and raise public awareness

System Description, Water Safety Plan, Improvement Schedule, (Matovo) – Sigatoka Regional Water Supply
Davendra Nath- Water Safety Plans Consultant – (SOPAC/WHO), Fiji 2009 Page 52
Risks that ‘Needs Urgent
Attention’
Improvement Schedule: How can you remove or reduce or remedy the cause and by when? Indicate where additional resources will be needed.
Until remedied, how will you know when this is actually causing deterioration towards unsafe drinking water?
What contingency management plan is in place until the cause is removed, reduced or remedied? Who needs to know and how quickly? Who can help?
4. Siltation in the intake is likely due to soil erosion and decaying vegetation
No barriers to the intake. Regularly monitoring the intake ,flight pumps and the galleries bottom for siltation
-High turbidity readings at plant -Visible change in the colour of raw water
WSD engineers to design dredging plans and erect barriers to exclude debris and silts. Nadroga Water Supply. Prepare monitoring schedules for siltation and cleaning.
5. Some villagers from Naduri and Nakalavo villages have easy access to the river for collection of fresh water mussels.
To inform/educate the villages /put notices in order to eliminate contamination and causing turbidity to the water.
-Turbid Water -colour change of water -Increased back washing and filter load noted
Water Supply Nadroga /Provincial Council/Health Department to raise public awareness
6. Farming alongside the Sigatoka and Qereqere rivers.
Erosion use of farm chemicals and pollution from farm animals(cattle/pigs) is common
.- Change in Water taste -water test reveals presence of chemicals above required standards
WSD/MPI and Health Depart to educate people. Signboard, notices and public awareness
7. Logging in the area increase turbidity in the Sigatoka River
Licences permit to be issued on conditions. Logging programme.
Increase turbidly and change of water colour -increased siltation in the intake. -high sludge content at plant
Environmental Plan needed/ WSD/Agricultural/Environment Depart
8. Pollution from dead animals and decaying debris
-Erect fence and barriers at the intakes. -Public Awareness and liaison with authorities and surrounding villages.
-dead animals and debris seen. -water smells with abnormal taste. - increase in bacterial content of raw water
WSD/Plant managers/regular inspection of the dam site Place Sign Boards -Public awareness and networking with other stakeholders

System Description, Water Safety Plan, Improvement Schedule, (Matovo) – Sigatoka Regional Water Supply
Davendra Nath- Water Safety Plans Consultant – (SOPAC/WHO), Fiji 2009 Page 53
Treatment - [Plan to Manage the ‘Needs Urgent Attention] Risks that ‘Needs Urgent Attention’
Improvement Schedule: How can you remove or reduce or remedy the cause and by when? Indicate where additional resources will be needed.
Until remedied, how will you know when this is actually causing deterioration towards unsafe drinking water?
What contingency management plan is in place until the cause is removed or reduced? Who needs to know and how quickly? Who can help?
1.High contents of Iron and manganese in the raw water from the Motovo Intake
There are no methods to aerate the water to remove iron and manganese.
Yes. Plant operators/ Nadroga Water supply/WSD – to provide aeration methods through waterfall system.
2. Replace malfunctioning flow meters at plants and reservoirs.
Water measurement for the inflow will help in calculating the chemical dosing rate. Residual Chlorine level inconsistence. Maintain SCADA system.
Public complains on chlorine taste/ No residual chlorine present when tested.
-Top priority should be given - WSD/ Engineers - Design and structures
3.Filter Failures Matovo has 8 rapid sand filters. - Filter media needs upgrading 4. Provision for flow meters to monitor backwash rate - Improper air scouring
Due to cracking and mud balls noted all media to soak with caustic soda. This will eliminate slime build up and accumulation of mud-balls. - This will also increase the plant chlorine demand -No, flow meters can contribute to fast backwash rate which can result in loss of filter media. – can lead to mud ball accumulation. To provide redundant air scourers (machine)
Turbid Water, High rate of dissolved and suspended solids. Chlorination is affected. Inspection reveals flow meters not functioning.
Yes. WSD / Design and Structures – hydraulics. Plant managers/operator

System Description, Water Safety Plan, Improvement Schedule, (Matovo) – Sigatoka Regional Water Supply
Davendra Nath- Water Safety Plans Consultant – (SOPAC/WHO), Fiji 2009 Page 54
Risks that ‘Needs Urgent Attention’
Improvement Schedule: How can you remove or reduce or remedy the cause and by when? Indicate where additional resources will be needed.
Until remedied, how will you know when this is actually causing deterioration towards unsafe drinking water?
What contingency management plan is in place until the cause is removed or reduced? Who needs to know and how quickly? Who can help?
5. Chlorine dosing rate may not counteract fluctuation in water quality accordingly.
Increase dosing rate during period of heavy rainfall. Ensure chlorinator servicing is done on time. Use of backup HTH dosing. No residual chlorine when tested.
No residual chlorine at consumer end of 0.5 ppm as required by the WHO standard. Treatment Section Plant Operators test indicates less then1.2 ppm of residual chlorine.
WSD/mechanical section. - Higher chemical dosage is an option.
6. Free Available Chlorine (FAC) samples not taken randomly at the distribution system and treatment plant.
Need a monitoring program for distribution and treatment plant. Presently done in ad-hoc manner. -Train staff and provide equipments and test chemicals
NWQL – chemist- test results not to required standards when tested by Plant Operators and Health Inspectors
- WSD / Design and Structures – hydraulics. - Higher chemical dosage is an option.
7.Manual Chlorination
Should have two tanks and, one mixing tank and one drip tank. existing mixing compartment-.Ventilation Provide HTH powder chlorine at all times to supplement the dosing if the mechanical system breakdowns.
FAC test that the treated water has no less than 1.2 ppm at plant and no less than 0.5 at consumer
pipe. No taste of chlorine in treated water. WSD – Plant
Operators
Additional testing resources needed at the Nagado plant such as turbidity meter and chemical detectors.
8.Mixing of wrong chemical with wrong dosing/storage facilities
No notices to identify the mixing chambers. No SOPs available for chemical mixing.
Plants Operators Placing of notices and instruction at the mixing area. Prepare SOPS
for each section

System Description, Water Safety Plan, Improvement Schedule, (Matovo) – Sigatoka Regional Water Supply
Davendra Nath- Water Safety Plans Consultant – (SOPAC/WHO), Fiji 2009 Page 55
Risks that ‘Needs Urgent Attention’
Improvement Schedule: How can you remove or reduce or remedy the cause and by when? Indicate where additional resources will be needed.
Until remedied, how will you know when this is actually causing deterioration towards unsafe drinking water?
What contingency management plan is in place until the cause is removed or reduced? Who needs to know and how quickly? Who can help?
9. Pre Chemical Dosing. - Due to plant size needs to be equipped with proper chemical dosing pump for copper sulphate/alum
-Plant should maintain residual chlorine of 1.2 g/cubic meter; this will allow an acceptable residual in the reticulation system. - Provision of backup disinfection is provided by means of Calcium Hypochlorite (HTH)
- Algal growth in the WTP common
- There is a need to upgrade OHS requirements for handling chlorine. -Training on the Use of Self contained breathing apparatus (SCBA) to be done for the staff -Sufficient Copper sulphate to be added to the raw water. Manually remove all algal growth. - There is a need to train staff on jar-test and to provide testing materials. -The whole dosing system has to be serviced
-Algal growth seen in treatment plant waters. -Test at plant and at consumer end indicates less residual chlorine then the required standard. - Dissolved solids passing to filters causing mud balls and clogging
WSD/Plant managers. Visual inspection must be done.
10. Treatment facilities/storage tank/reservoir is damaged by natural disasters such as flooding, landslide, earthquakes.
Establish and follow emergency plans for all natural disaster events. Have standby power generators. Switch to manual dosing treatment if no other option permits. Follow the maintenance schedules for all repair works.
Inspection after natural disaster Water-borne diseases on the rise. Large amounts of water flowing out of the storage and distribution system.
Carting of treated water to the affected areas. Send out public health messages through local media informing consumers about possible risk of contamination. Advise them to take necessary precautionary measures e.g. boil or filter water. WSD-Engineers

System Description, Water Safety Plan, Improvement Schedule, (Matovo) – Sigatoka Regional Water Supply
Davendra Nath- Water Safety Plans Consultant – (SOPAC/WHO), Fiji 2009 Page 56
Risks that ‘Needs Urgent Attention’
Improvement Schedule: How can you remove or reduce or remedy the cause and by when? Indicate where additional resources will be needed.
Until remedied, how will you know when this is actually causing deterioration towards unsafe drinking water?
What contingency management plan is in place until the cause is removed or reduced? Who needs to know and how quickly? Who can help?
11.Accumulation of clarifier sludge
No. Sludge pumps malfunctioning due to manual operation. De-sludge Thickener
Plant operators to monitor and do regular manual cleaning. Design engineers to replace and upgrade. Reset the computerised system.
12There is no treatment / barrier for protozoa, so it could be assumed that they are present in water.
Upgrade filters media. Soak filters in caustic solution to remove mud balls, slime growth and cracks.
Protozoa analysis of drinking water Upgrade sand filters to increase efficiency
Increase chlorine residual. Give boil water advice to the public. SWD/MOH
13 Vandalism/sabotage.
Provide extra security lights and monitors. Put up a security fence to stop unauthorized access to the water storage tanks/post attendant/watchman at pump and reservoirs.
Low pressure/loss of water Abnormal objects in treatment plant water .other mechanical/electrical not correctly functioning, contaminated water samples.
Security persons posted. Install security alarms. WSD-
Production/distribution Section
14.Easy access of animals/pets into the treatment plant
Provide gates and lids -Place notices -Inform staff to prevent access of animals into WTP
Entry of animals and birds into treated water. Water smells. Dead animals and birds seen -Contaminated chemical solutions
WSD/ Plant Operators
15. Algal Growth
No. Regular dosing of required amount of Copper sulphate sludge scrappers/sludge thicker/lagoons
Algal growth seen in the treatment plant. -Water smells and gives green colour - Clogs filters
WSD ,Engineers, Plant Operators, -Manual removing to be done when scrapper not functioning
16. Computer Breakdown
No. Lack knowledge of computer operation of the plant. Relocation of the computer room for easy access. Proper record keeping is needed
Insufficient chemical dosing and filter backwashing stops. -confirmed by test and visual inspection
WSD/Plant operators to train sufficient staff on computer
operation.

System Description, Water Safety Plan, Improvement Schedule, (Matovo) – Sigatoka Regional Water Supply
Davendra Nath- Water Safety Plans Consultant – (SOPAC/WHO), Fiji 2009 Page 57
Storage and Distributions [Plan to Manage the „Needs Urgent Attention]
Risks that ‘Needs Urgent Attention’ Improvement Schedule: How can you remove or reduce or remedy the cause and by when? Indicate
where additional resources will be needed.
Until remedied, how will you know when this is actually
causing deterioration towards unsafe drinking water?
What contingency management plan is in place until the cause is removed, reduced or remedied? Who
needs to know and how quickly? Who can help?
1. Illegal connections could lead to cross-contamination.
-A regular monitoring / surveillance schedule for illegal connections. Allocate wardens in each zone/area/community.
Through Public complaints. Low water pressure in affected areas. High water demand.
The residual chlorine will provide protection (provided the levels of contaminants are low) until repairs are complete.
2. Rusted and missing lids- at reservoirs. Rodents and animals getting into the storage reservoir tanks.
-Cut down trees growing close to the reservoir tanks and remove discarded items. -All inlets to be sealed properly and rusted lids replaced. -Regular inspection of reservoir.
Rodents die and excrete in and on the storage tanks. Ingress of animals and their excrement noticeable. Dead animals, birds and rodents seen in the storage tanks.
Close all inlets to the tanks Cover the openings with sacks or other flexible materials until repair works are done.
3. Easy access of animals and people to reservoirs.
-All turn keys wheels to be well secured and kept under lock and key. -Provide security grills around reservoir chambers and turn keys.
Decrease in water pressure and cross contamination. Presences of bacteria and other dead organic matter when inspected and analysed.
Security checks. Place security alarms. Notice Board/signs. -Post caretaker.
4. Contaminated storage reservoirs. Accumulation of sediments in storage tank.
-Establish and follow a cleaning/maintenance schedule once a year. - Avoid ingress of dirt during repair of breakages in the mains.
Colour of water changes .water turbidity increases. Water smells. Presence of Bacteria when analysed.
-Drain storage tank water. - Clean the tank. - Improve filtration at treatment plant –Upgrade filter media

System Description, Water Safety Plan, Improvement Schedule, (Matovo) – Sigatoka Regional Water Supply
Davendra Nath- Water Safety Plans Consultant – (SOPAC/WHO), Fiji 2009 Page 58
Risks that ‘Needs Urgent Attention’ Improvement Schedule: How can you remove or reduce or remedy the cause and by when? Indicate
where additional resources will be needed.
Until remedied, how will you know when this is actually
causing deterioration towards unsafe drinking water?
What contingency management plan is in place until the cause is removed, reduced or remedied? Who
needs to know and how quickly? Who can help?
5. Leakages within the distribution network could result in cross-contamination.
-About 30 % water is lost due to leakage and abuse. A Leak detection programme is in place. -Inform public on proper water use and water laws especially the villagers.
Analysis of mains water will indicate presences of pathogenic bacteria. Colour and turbidity is abnormal. Low water pressure in distribution pipes.
Close the distribution network and clean the system. WSD and distribution manager to act - Inform public to boil water through media/radio.
6. Free available chlorine levels in the distribution system could be too low.
-Current monitoring for FAC is insufficient. The fluctuation could be due to water demand and major breakages. - Only selected areas tested regularly need to change the sampling point.
No FAC in treated water when tested. Presence of bacterial organisms in the treated water.
NWQL to monitor FAC/bacterial content regularly and provide report to plant operators to do appropriate chlorination.
7. Water is contaminated as a result of repair works in the distribution system.
Drain contaminated water before reconnection. Control back flaw of dirty water. Chlorine- washes of pipes and analyse water for bacterial contents prior to consumption. Refer to SOPs if available.
Water colour and turbidity changes. - Increased suspended and dissolved solids in treated water.
Distribution Section to monitor - Inform public to boil their drinking water. - Analyse water for bacterial content. -Formulate SOPs
8. Drop in water pressure due to main breaks and high demand disturbs sediments in pipes.
Keep supply constant to maintain pressure. Monitor usage, maintain average reservoir levels, and throttle supply. Provide additional reservoir.
Reports of insufficient water to parts of the network and dirty water seen at consumer taps. Water colour and turbid water seen at consumer end.
Distribution Section to monitor. Analyze water for bacterial content.
9. Damages to the distribution network from natural disasters such as floods, landslides and earthquakes.
Establish and follow emergency contingency plans for natural disasters during and after an event.
Low water pressure in distribution system. Consumer complains
WSD-consult with Disaster Management Office for emergency water supply. Analyse for bacterial content.

System Description, Water Safety Plan, Improvement Schedule, (Matovo) – Sigatoka Regional Water Supply
Davendra Nath- Water Safety Plans Consultant – (SOPAC/WHO), Fiji 2009 Page 59
Risks that ‘Needs Urgent Attention’ Improvement Schedule: How can you remove or reduce or remedy the cause and by when? Indicate
where additional resources will be needed.
Until remedied, how will you know when this is actually
causing deterioration towards unsafe drinking
water?
What contingency management plan is in place until the cause is removed, reduced or remedied? Who
needs to know and how quickly? Who can help?
10. Damage to exposed pipelines.
-Endeavour to bury/protect/encase all exposed pipelines. Have warning signs posted to inform the public. – -Regular monitoring of intake and distribution pipes.
-Low pressure/leakages -Contaminated water found in the system on analysis -Visible colour change of the water at consumer end
WSD-Distribution Section Inform the public Cover the pipelines. Install Signs
11. Borehole Intake Contamination
-Flushing of contaminate water (sections only). -Sufficient chlorination at Pump stations -Provide washout valves at the lower end of the distribution system.
-Water smells -Water colour changes -Increase in dissolved solids in treated water at consumer end -Reduced water pressure at consumer end. -High levels of bacteria in tests
WSD/ Distribution Manager. Establish cleaning programme for the mains.
12. Vandalism/sabotage - valve cover lids removed by
people. - Unlocked lids and gates
Cannot stop vandalism/sabotage but can reduce and prevent likelihood of both. If possible lock and secure tools, equipment, enclosures and parts. Upgrade cover method for chambers and reservoir/fence and grills. - Place notice/Sign boards/media information
-Low pressure of water in pipes -People seen around storage tanks drawing water or bathing in instances of water cuts
Police/WSD to monitor regularly. Provide steel enclosure for key area/ access to reservoir

6. IMPROVEMENT SCHEDULE
CATCHMENT AND INTAKE
Risks Identified
Improvement Priority Responsibilities and Timeline
Comments and Costs
1. Sabotage and Vandalism.
-Secure intake at Matovo/Qereqere to ensure that vandals do not get access to the intake pumps or galleries/bore holes by fencing and putting sign post caretaker or ranger.
High WTP/DWS WSD Cost Fencing and Sign boards $30,000
2. Public access and farming in the catchment areas Matovo/Qereqere
People/tourist uses the area for picnicking. - Raise public awareness for people staying along riverside on pollution control and farming chemicals.
High WSD Public Awareness MOH/MAPI Surveys and Workshops
Promote Health and Sanitation /farm advice for settlements/villages $30,000
3. Natural disasters makes source unsafe from massive occasional flooding and erosion-blockages with debris/silts Matovo/Qereqere
-PWD and Provincial Councils to undertake awareness on land conservation and catchment protection. -Construct barrier walls To exclude debris/silts
High
WSD Cost of construction of barrier walls- Motovo and Qereqere $85,000
4.Eassy access of animals (horses/cattle) to the intakes sites (galleries/bore holes) – Matovo/Qereqere
-Erect fence and gates around the bore fields at Matovo and Qereqere. -Provide gates
High WSD Construct fence and gates. $ 80,000

System Description, Water Safety Plan, Improvement Schedule, (Matovo) – Sigatoka Regional Water Supply
Davendra Nath- Water Safety Plans Consultant (SOPAC/WHO) Fiji 2009 Page 61
TREATMENT [Improvement Schedule] Risks Identified Improvement Priority Responsi
bilities and Timeline
Comments and Costs
1. High contents of Iron and Manganese in raw water from Matovo intake. (Sigatoka River)
-There is no security guard -Potassium permanganate was added before but stopped due to cost and health effects. -Erection cascade to be constructed at plant to aerate the raw water prior to further treatment.
High
PWD NWQL WTP-operators PWD
There is an identified area at the plant site for construction- Submit sketch plans by engineers. Cost; $40,000
2. Filter Failures - Matovo has 8 rapid sand filters. - Filter media needs upgrading - Provision for flow meters to monitor backwash rate - Improper air scouring
-Due to high Turbidity and faulty sedimentation system all media to be soaked with caustic soda. This will eliminate slime build up and accumulation of mud-balls. - Inefficient filters will also increase the plant chlorine demand. -No, flow meters can contribute to fast backwash rate which can result in loss of filter media. – can lead to mud ball accumulation. To provide redundant air scourers (machine). Upgrade filter media (all size)
High WSD WTP operators
Repair filters and upgrade filter media. Cost- $ 110,000
3.Replace malfunctioning flow meters at plants and reservoirs
-Plant flow meters are no functioning. -Chemical dosing is on estimation and old records
High WSD Cost $30,000
4.Manual Chlorination
-Should have a separate compartment close to the contact tank. -proper piping and mixing devise to be provided. -Provide HTH powder chlorine at all times to supplement the dosing if the mechanical system breakdowns. -Provide manual chlorine tank and shed.
High WSD Cost $20,000

System Description, Water Safety Plan, Improvement Schedule, (Matovo) – Sigatoka Regional Water Supply
Davendra Nath- Water Safety Plans Consultant (SOPAC/WHO) Fiji 2009 Page 62
Risks Identified Improvement Priority Responsibilities and Timeline
Comments and Costs
5. Chlorine dosing rate does not counteract fluctuation in water quality accordingly. FAC no monitored. -Matovo Plant Lab needs Upgrading.
-Follow monitoring procedures for FAC measurements to confirm a chlorine residual of no less than 0.2 mg/L. Increase measurements during period of heavy rainfall. -Need to have a lockable lab. Area identified at the existing office building. A 3mx3m new lab to be made.
High
WTP operators
Upgrade Existing lab with provision of necessary equipments such as clear glass etc. Cost- $20,000
6.Vandilism/Sabotage
-Provide extra security lights and monitors. -Put up a security fence to stop unauthorized access to the water storage tanks/post attendant/watchman at pump and reservoirs. -Provide Notice /Sign boards
High WSD/WTP operators
Cost- $20,000
7. Easy access of animals/pets in the treatment plants
-Sealing and repairing of all entry points for pets/animals and rodents. -Provide enclosure /lids for clear well to exclude entry of solid and liquid waste. – -Upgrade sanitation of the plant. -Place notice board at the WTPs
Medium WSD/WTP operators
Upgrade grills and screens in the Plant building and hygiene aspects. Cost- $10,000
8. Computer Breakdowns
Maintain computer programme and train staff
High
Upgrading and training cost- Cost $60,000
9.Mixing of wrong chemical with wrong dosing/storage facilities
-Placing of notices and instruction at the mixing area. -Prepare SOPS for each section -Extend storage facilities
High
WSD/Plant Operators
Cost of building and posting instruction at places Cost- $50,000
10.Accumulation of Clarifier sludge
-Replace sludge scrapper Cleaning of lamella plates -Need for heavy duty water blasters for removing of floccs. -Upgrade sludge removal pipes.
high
WSD/Plant operators
Cost of repair of scrapper and outlet pipes. $60,000

System Description, Water Safety Plan, Improvement Schedule, (Matovo) – Sigatoka Regional Water Supply
Davendra Nath- Water Safety Plans Consultant (SOPAC/WHO) Fiji 2009 Page 63
STORAGE AND DISTRIBUTION – [Improvement Schedule]
Risks Identified
Improvement Priority Responsibilities and Timeline
Comments and Costs
1.Vandalism/Sabotage There is easy access for the public into the reservoir compounds. - Unlocked gates and reservoir lids.
- Install security lights and steel grills for the inlet and inspection chambers
-Fencing and upgrading of gates for the reservoirs
High WSD/WTP operators
Upgrade Security at all time. Cost $30,000
2.Illegal connections could lead to cross-contamination
-A regular monitoring / surveillance schedule for illegal connections. -Allocate wardens in each zone community.
-Raise public awareness And enforce Water legislation
Moderate WSD/WTP operators
Inform via media. Public awareness materials. Brochure- Cost $20,000
3. Easy access of animals and people into Intake and borehole sites.
-Repair damaged intake chambers. -All inlets to the storage reservoir to be sealed properly. - Rusted lids to be replaced. All ladders to be upgraded - Place notice/sign boards
High WSD/WTP operators
Cost $25,000
4.Trees and shrubs around the reservoir provides presence of rodents and birds
-Cut down all trees /shrubs growing close to reservoir. -Remove shrubs/grass and landscape to keep the sites clean. - All valve wheels at the storage reservoirs to be well secured and kept under lock and key.
Moderate
WSD/WTP operators/ PWD
Cost- $25,000

System Description, Water Safety Plan, Improvement Schedule, (Matovo) – Sigatoka Regional Water Supply
Davendra Nath- Water Safety Plans Consultant (SOPAC/WHO) Fiji 2009 Page 64
Risks Identified
Improvement Priority Responsibilities and Timeline
Comments and Costs
5. Free available chlorine levels in the distribution system could be too low.
Current monitoring for FAC is insufficient. Design a more rigid monitoring programme with identified sampling points and time period.
High WSD WTP operators NWQL
Upgrade the existing testing procedures. -No cost
6. Water is contaminated as a result of repair works in the distribution system. Danger of backflow during breakages and low pressure
-Drain contaminated water before reconnection. Control back siphonage of dirty water. Chlorine washing of pipes and analyse water for bacterial contents. -Establish written procedures e.g. SOPs for fixing distribution problems, including hygiene procedures. -Use appropriate backflow prevention devices, double check valve and ensure air gaps. -Education programme for new and existing industry which pose a significant threat if backflow occurred. Backflow prevention devices installed if required valves and valve house
High Moderate
WTP distribution section WTP distribution section
Train staff on Water demand management, leak detection and pipe maintenance. And use SOPs $30,000
7. Drop in water pressure due to breakages and high demand disturbs sediments in mains.
-Numerous reports of insufficient water to parts of the network and dirty water seen at consumer taps. -Install inlet/outlet meters for all reservoirs. -upgrade the existing reservoir at Lawai
High
WSD WTP operators Distribution Section
Increase the mains size in the areas affected. Upgrade Reservoirs Cost $40,000

System Description, Water Safety Plan, Improvement Schedule, (Matovo) – Sigatoka Regional Water Supply
Davendra Nath- Water Safety Plans Consultant (SOPAC/WHO) Fiji 2009 Page 65
Risks Identified
Improvement Priority Responsibilities and Timeline
Comments and Costs
8. Damages to the distribution network from natural disasters such as floods, landslides and earthquakes.
-Establish emergency contingency plans. - Provide water carting -Endeavour to landscape and upgrade reservoir
access.
Moderate
WSD WTP operators PWD Regional Development
Avail water cart tanks Cost $20,000
9. Contaminated storage reservoirs Accumulation of sediments , silt and debris
-Regular cleaning of storage tanks of sediments and chlorine washing before refill. - install floater gauges to measure the water level in the reservoir tanks.
High
WSD WTP operators
Costs- $ 30,000
10. Leakages within the distribution network could lead to cross contamination. -Damage to exposed pipes. Interrupted distribution or contamination of water due to accidental damage. -Mains scaling and sedimentation.
-Unintentional pipeline damage by companies. -Formulate M.O.U with PWD, Telecom and FEA to repair damages done during their operations -Establish leakage detection measures Encourage public to report for damaged pipes. -Public notices to stress importance of pipelines that are buried or exposed to stop damage. - provide wash out valves at the lower areas of the distribution system to flush out deposited silts. - regular flushing of mains water to eliminate sediments in distribution
High Moderate
WSD WTP operators Distribution section PWD & Municipal, Provincial councils PWD
Public awareness Sign boards.
Provide wash out valves and chambers Cost – $60,000
11. Drop in Water Level in the reservoirs. Leakage in underground pipelines within houses and properties.
-Provide water level measuring gauge. (Telemetry). -Encourage upgrading of old pipelines within houses/properties. -Advise property owners on advantages of using standardised pipes and fittings.
High
DWS to install measuring devise and train staff PWD
Cost of installation and training on data recording $30,000

6.1SUMMARY FOR THE IMPROVEMENT SCHEDULE FOR THE SIGATOKA (MATOVO) WATER SUPPLY SYSTEM IMPROVEMENT REQUIRED COMPONENT IMPLIED ETIMATE COST Tot Cost
Catchment and Intake Fiji Dollars FJD
1.Public awareness campaign – villagers/farmers Surveys and Workshops/IEC materials 30,000
2.Provide security gates/signboards at –Matovo/ Qereqere Gates/signboards at the main entrance 30,000
3.Constructing Barrier Walls at Bore-fields-Matovo/ Qereqere
To protect from flood damages. 85,000
4.Fencing at Matovo and Qereqere intakes Fencing to protect access of animals 80,000 $225,000
Treatment
5.Construct Aeration Cascade To remove Iron/manganese in Raw Water 40,000
6.Upgrade filtration –sand filters Upgrade/replace mono-sand media 110,000
7.To upgrade the plant flow recordings Upgrade and install flow meters 30,000
8.Upgrade Manual Chlorination Provide facilities/equipments and shed 20,000
9.Monitoring of Chemical dosing Provide test materials and laboratory 20,000
10.Vandalism/Sabotage Provide lights/gates and sign post 20,000
11.Easy access of animals and pets Provide notice and upgrade screens/grills 10,000
12.Improve computer system and programming Improve programming and train staff 40,000
13.Chemical dosing and Storage Place instruction and provide storage facilities 40,000
14.Removal of clarifier sludge Repair clarifier scrapper and sludge pumps 40,000
15.Repair sludge pump and provide shed Repair pump and protect from weather(Sheds) 40,000 410,000
Storage and Distribution 16.Vandalism/sabotage Security lights, fence /gates and grills 30,000
17.Illegal connections Monitoring/public awareness/employ wardens 20,000
18.Control access of animals/people to reservoirs Provide fence/gates/signboards 25,000
19.Clear reservoir sites Remove trees, Shrubs from reservoirs 25,000
20.Backflow /contamination control measures Prepare SOPs /train staff/control device 30,000
21. Increase water storage capacity/reservoirs Provide and maintain existing reservoirs 40,000
22.Cleaning of Silts and debris in the reservoirs Remove silts and debris from reservoirs 20,000
23.Damage of pipes and storage system in Disasters Cover pipes/post signboards/ 30,000
24.Provision of water level measuring gauge Install measuring device (telemetry system) 60,000
25.Damage to distribution system by earthworks Sign post, public awareness/Formulate -MOU 30,000 310,000
TOTAL COST -FJD $945,000

System Description, Water Safety Plan, Improvement Schedule, (Matovo) – Sigatoka Regional Water Supply
Davendra Nath- Water Safety Plans Consultant (SOPAC/WHO) Fiji 2009 Page 67
Table 1: Water Safety Plan Team - Sigatoka
Name Position Organization Responsibility Phone/E-Mail
Peceli
Ravasua
Actg
Divisional
Water
Engineer-
Western
Department of
Water and
Sewerage, (WSD)
Lautoka
Overall Supervision
of Engineering and
Infrastructure for
Western Division
Water Production and
distribution.
PH: 6660563 P.O. Box 56, Lautoka
Govind
Naicker
Treatment
Supervisor,
Western
Lautoka Water
Supply
Supervision of
treatment Plants for
Western Division
PH: 6660563
Sher Singh
Senior
Scientific
Officer
Kinoya Water
Quality laboratory Supervisor for the
Plant treatment
process – Western
Division
PH: 3392133
fj
Joe Ravouvou Actg Water
Supervisor
Nadroga Water
Supply Supervisor
Nadroga PH: 6500139
Viliame
Senileba
Officer In-
charge Matovo Water
Treatment Plant Plant Supervisor Matovo
Ph: 6280110
Mereseini
Mataluvu
Project
Officer Lautoka Water
Supply Project Planner –
Western Division PH: 6660563
Paula Laqere Health
Inspector
Ministry of
Health ,Sigatoka
Rural Water and
Sanitation
Health Office, Sigatoka
Ph; 6500341
Suliano
Turanga
Agricultural
Officer
Dept of Agriculture
Sigatoka
Division – farming
technology
Ph;6500418
Rupeni .N
Leak
Detection
Officer
Nadroga Water
Supply
Leak
detection/complains
Ph; 6500139
Joseva
Qainicici
Plant
Operator
Matovo Water
Treatment Plant
Plant Operator Ph: 6280110

System Description, Water Safety Plan, Improvement Schedule, (Matovo) – Sigatoka Regional Water Supply
Davendra Nath- Water Safety Plans Consultant (SOPAC/WHO) Fiji 2009 Page 68
7 RECOMMENDATIONS AND CONCLUSION
7.1. Remarks and Recommendations
1. There is a need for the improvements in water resource management and land use planning in the water shed; therefore it is necessary to have a water authority for the efficient management of the water supply system in relation to human, capital and natural resources.
2. There is a need for the training of staff on raising public awareness in the departments and
in the community levels. It is necessary for the continuous up-skilling of staff at all sectors of the organisation due to the advent of new technology and quick staff turnover.
3. Since most of the staff are field workers occupational health and safety provisions should
be made for efficient work performance especially in the treatment plant where hazardous chemicals are used. Training of Fire safety and self contained breathing apparatus (SCBA)
4. The Matovo Treatment Plant to be upgraded and improved (filters, clarifiers, chemical mixing and sludge disposal). The request of such improvement in seen in the monthly reports. The plant building also needs improvement and hygiene upgrade.
5. Modern laboratory with equipment to be set at the Matovo Treatment Plant and a field monitoring system for residual chlorine and leak detection procedures made available.
6. All plant operators should be suitably qualified, graded to operate the plants. The
department should arrange for the necessary training for the respective staff.
7. Data and record keeping should be improved in order to monitor the resource, demand and water wastage. SCADA telemetry system to be improved where necessary.
8. Existing management plans and strategies to be continuously reviewed with the
formulation of contingency plans and standard operating procedures (SOPs).
9. Ministry of Health as regulators should formulate a monitoring plan for the drinking water quality for bacterial and chemical parameters and make relevant information available to Water department.
10. Due to the increase in the population, tourism and industrial activities in Sigatoka (Coral
Coast)there is increase in water demand, therefore storage and distribution system to be
maintained and upgraded.
11. There are a number of reservoirs in the Sigatoka water supply; unfortunately the
inspection reveals that they are not well maintained. Contamination of treated water is
likely as most reservoirs are seen with over growth of grass and broken manhole lids
/inlets. Ingress of rodents and small animals are possible. The turn key chambers are
unmaintained and usually damaged by vandalism. This to be addresses immediately as
per the WSP/Improvement Schedules.

System Description, Water Safety Plan, Improvement Schedule, (Matovo) – Sigatoka Regional Water Supply
Davendra Nath- Water Safety Plans Consultant (SOPAC/WHO) Fiji 2009 Page 69
12. Remove siltation of dissolved solids which is common in the reservoirs and distribution mains as filtration process at the treatment plant is in-efficient. There are no flush out device for the mains at low lying areas. Siltation also occurs due to the low water pressure during water cuts.
13. Coordination with major stakeholders and networking and information sharing is
necessary to promote more collaborative approach in water resource management at watershed and service level.
14. It is vital to enforce Environmental Management Act and Public Health Act to maintain a
healthy watershed through elimination of pollution from human activities (point and non-point source).
15. There is lack of data on water resource management and surveillance with major stakeholders such as WSD, Mineral Resources Department and Ministry of Health. This impedes in making proper decisions in many cases such as water demands in specific zones and water loss through leakages (unaccounted water). Department sections to improve data recording and formulating improvement proposals.
16. Proper chemical storage areas should be provided to store different chemicals in confined
areas in order to maintain them in good condition and provide efficient methods of application of chemicals without endangering the health of workers and quality of chemicals.
17. The intake bore-field on the Sigatoka river banks needs protection from flooding and damage. Concrete barrier should be constructed to exclude debris /silts and damage to the bore wells.
18. An aeration cascade should be constructed at the Matovo treatment plant site to remove iron and manganese contents from raw water entering the WTP.
19. The Qereqere borehole intake to be protected from floods and animals by fencing the site and constructing the barrier walls to protect borehole pumps.
20. The existing abundant reservoir at Lawai to be upgraded and reused for water storage to avoid water cuts and low pressure.
21. Training should be provided to distribution staff on the water demand management and leak detection procedures.
22. Since the Matovo plant is fully computerised, the staff should be sufficiently trained on computer programming and maintenance. One specialist is required for this job to avoid malfunction of the treatment operations.
23. Since the installation, the uplift pumps are continuously running to meet the water demand
as such it is difficult to carry out service and maintenance. Therefore it is recommended that additional standby pumps made avail at plant and borehole intakes.

System Description, Water Safety Plan, Improvement Schedule, (Matovo) – Sigatoka Regional Water Supply
Davendra Nath- Water Safety Plans Consultant (SOPAC/WHO) Fiji 2009 Page 70
7.2 Conclusion
The Water Safety Plan was finalized through the assistance of the Matovo Sigatoka Water Supply staff and reference was also made to the outcome of the WSP workshop held at Lautoka Water Supply in December 2008. A mini workshop was also done to brief the plant operators at Matovo since some of the staff did not attend the Lautoka workshop and were not familiar with the Water safety plan concept. Sigatoka Water Safety Plans steering committee is formed which would monitor the future activities necessary for implementing the plan. The Water Safety Plans documents will be presented to the Steering Committee and the Water and Sewerage Department for their initial endorsement as the final document. It is realized that this document is very important for the implementation of the plan and to carry out the improvements in order to remove risks in the water supply system and create a holistic management approach from catchment to consumer. The document would assist in future planning and for the fund allocation in specific areas as per the improvement schedule. The completed Water Safety Plan is an ideal reference document for staff and the decision markers. The Improvement Schedule was finalised with the assistance of Water and Sewerage Department during the consultancy process. The national budgetary allocation in reference to this document is important for the country to divert further funding in this area. It is anticipated that Fiji Water Safety Plan programme will assist and train the staff of the department in improving the water quality by eliminating the risks in the system. The Steering committee also requested that staff from WSD should be further trained in risk assessment and management in the water supply system. The WSP replication programme for Fiji is well progressing due to the commitment shown by the stakeholders and especially Water and Sewerage Department. Some of the issues raised in the recommendation in necessary to be considered so that early improvements are made to the system. The Sigatoka (Matovo) Water Supply is under much pressure due to high demand of treated water for consumption by the increasing population in the Sigatoka coral coast area. The Sigatoka Regional Water Supply has authority and capacity to maintain the treatment and distribution system but many constraints such as lack of capital and human resources and deteriorating infrastructure hinders the progress. There are many benefits of improved water quality and quantity such as improved human health and the economic status of the country. It is therefore anticipated that Fiji will surely gain through implementation of this WSP programme. It is envisaged that Water and Sewerage Department, the Ministry of Health and the Department of Public Works will work together to implement Water Safety Plans for the Water Supply system and replicate the process for the other areas in Fiji. Cooperation between various agencies is necessary to achieve the outcomes, as they have expressed commitment for this programme at the commencement of the Regional Action Plan (RAP) for the Pacific island countries and endorsed by the ministers.

System Description, Water Safety Plan, Improvement Schedule, (Matovo) – Sigatoka Regional Water Supply
Davendra Nath- Water Safety Plans Consultant (SOPAC/WHO) Fiji 2009 Page 71
8. Reference:
1. Annual Report 2008- Water Treatment Plants for Western, Dept of Water and Sewerage. 2. Clive Carpenter and Paul Jones – 2004, SOPAC Miscellaneous Report 554 – An Overview
of Integrated Water Resources Management in Pacific Island Countries: A National and Regional Assessment.
3. Global Water Partnership – Technical Advisory Committee (TAC) ,Background Papers No.4, Integrated Water Resources management ,2000,Stockholm,Sweden.
4. Guidelines for Drinking Quality, 2004 Volume 1, Third Edition, WHO, Geneva. 5. Howard, A.G 2002. Water Supply Surveillance: a reference manual. WEDC. Loughborough
University, UK. 6. Hassan. T, Aalbersberg.W,2008 .Designing A Drinking Water Quality Monitoring
Programme, A Practical Guide for pacific Island Countries, SOPAC Technical Report 407. A SOPAC Secretariat, Suva.
7. Integrated Water Resource management in Pacific Island Countries- a Synopsis 2007, SOPAC Secretariat, Suva.
8. Mosley .L, Singh. S and Aalbersberg. W, 2004 .Water Quality Monitoring in Pacific Island Countries, SOPAC Technical Report 381, SOPAC Secretariat. Suva
9. Ministry of Health, 2005, Small Drinking Water Supplies- Preparing a Public Health Risk
Management Plan. Wellington, New Zealand.
10. Pacific Framework for Action on Drinking Water Quality and Health- A WHO Workshop Paper.2005, Nadi ,Fiji Islands.
11. Terry. J. and Raj .R.2002. The 1997-98 El-Nino and Drought in the Fiji Islands, In International Hydrological Programme. Hydrology and water management in the humid tropics, Proceedings of the Second International Colloquium 22-26 March 1999 Panama. IHP-V Tech Documents in hydrology. No 52 UNESCO, Paris.
12. Water Safety Plans- Planning Water Safety Management for urban water supplies in
developing countries; Godfrey. S; Howard, G; 2005.
13. Water Safety Planning in Practice-whose plan it is; paper presented during the Water
Safety Plans Workshop, Suva Fiji. Gregor J, et.al 2005 Suva Fiji.
14. WHO - Guidelines for Drinking Water Quality, 2004 Volume 1 ,Third Edition
15. Water Supply Plans Books 1&2 -2004, WEDC Publication-Loughborough University, UK
16. Matovo Water Treatment Plant-Water and Sewerage Department.
17. Water and Sewerage Department Annual Report, 2008.

System Description, Water Safety Plan, Improvement Schedule, (Matovo) – Sigatoka Regional Water Supply
Davendra Nath- Water Safety Plans Consultant (SOPAC/WHO) Fiji 2009 Page 72
ANNEX: 1
Drinking Water Risk Assessment Table
Judging Priorities – systematic risk assessment
i. For each hazard event, decide on the likelihood of the event happening Likelihood Score Possible Descriptions
Almost Certain 5 Occurs like clockwork
Occurs every week, month or season
Likely 4 Has occurred more than once before
Expected to occur every year
Possible 3 Has occurred before
Expected to occur every 2-5 years
Unlikely 2 Has occurred before
Expected to occur every 5-10 years
Rare 1 Has never occurred before and unlikely to occur less than every 10 years
ii. For each hazard event, decide on the consequence to people’s health if it did happen. Consequence Score Possible Descriptions
Insignificant 1 No illness expected in the community or interruption to water availability
Minor 2 Very few of the community ill, or some interruption to water availability
Moderate 3 Some of the community ill
Major 4 Most of the community ill
Catastrophic 5 Most (or all) of the community ill with anticipation of some deaths
iii For each hazard event, look up the likelihood and consequence scores in this table to find the corresponding priority (very low, low, medium, high, very high) Likelihood Consequence
Insignificant 1
Minor 2
Moderate 3
Major 4
Catastrophic 5
Almost Certain 5
Medium 5
Medium 10
High 15
High 20
very high 25
Likely 4 Medium 4
Medium 8
Medium 12
High 16
high 20
Possible 3 very low 3
Low 6
Medium 9
High 12
High 15
Unlikely 2 very low 2
very low 4
Low 6
Medium 8
High 10
Rare 1 very low 1
very low 2
low 3
medium 4
medium 5
(Adapted from NZ MoH, 2007)
Instruction: Using either of the methods outlined above, consider each of the hazard events separately and determine
the priority for each. Enter the priority rating into the third column of the DWSP matrix.

System Description, Water Safety Plan, Improvement Schedule, (Matovo) – Sigatoka Regional Water Supply
Davendra Nath- Water Safety Plans Consultant (SOPAC/WHO) Fiji 2009 Page 73
ANNEX: 2
RISK ASSESSMENT –MATOVO
Risk assessment was conducted using the following steps:
i. Identify risks (at each stage of the water supply system)
ii. Identify control Measures (or barriers)
iii. Prioritize Risks which are not under control
Semi-quantitative ranking – using the “likelihood” and “consequence” matrices, a semi-
quantitative way of prioritizing risks was developed as in the tables below.
Intake/Catchment
RISK CAUSE
CONTROL
MEASURE
IN
PLACE?
LIKELIHOOD CONSEQUENCE PRIORITY
High levels of Faecal
Coli-form in raw water
Animal/bird faeces
and/or seepage None
Almost Certain
5
Moderate
3
High
15
High turbidity due to
Increased
sedimentation and soil
erosion
Deforestation /
logging
None Almost Certain
5
Minor
3
High
15
Farming – land
clearing
None Likely
4
Minor
2
Moderate
8
Flooding
None Likely
4
Moderate
3
High
12
Fishing None Likely –
4
Major
-4
Very High -
16
Not sufficient water,
low water level
Drought
None Possible
3
Major
4
High
12
Algae in raw water
High nutrient
levels in water
None Likely
4
Minor
2
Moderate
8
Galleries Contaminated
by flood
Increased siltation
/debris in the
borehole intakes.
None Possible
3
Major
4
High
12
Access by animals to
intake galleries No boundary fence None
Likely
4
Major
4
Very high
16
Access by people No boundary
fence/notice None
Possible
3
Major
4
High
12

System Description, Water Safety Plan, Improvement Schedule, (Matovo) – Sigatoka Regional Water Supply
Davendra Nath- Water Safety Plans Consultant (SOPAC/WHO) Fiji 2009 Page 74
Pumping Station/Intakes –Qereqere/Korotogo
RISK CAUSE
CONTROL
MEASURE IN
PLACE?
LIKELIHOOD CONSEQUENCE PRIORITY
Pump Failure
Electrical blackout None Possible
2
Major
4
High
8
Mechanical
Problems
Preventative
Maintenance
programme in
place/ No
standby pumps.
Possible
2
Major
4
Moderate
8
Vandalism and
Sabotage
Low security None Likely
4
Major
4
Very High
16
Easy access to
site/No fence and
gates
None Unlikely
2
Major
4
Moderate
8
Contamination from
Storm water and
flooding
Damaged
infrastructure
(borehole intake)
None Possible
3
Major
4
High
12
Low water Intake Smaller diameter
intake pipe None
Likely
4
Major
4
Very High
16
Treatment Plant -Matovo
RISK CAUSE
CONTROL
MEASURE
IN PLACE?
LIKELIHOOD CONSEQUENCE PRIORITY
Raw Water Channel
Sabotage and/or
vandalism
Low security.
no screens None
Likely
4
Major
4
Very High
16
Easy access to
site by pets None
Unlikely
2
Major
4
Moderate
8
Solution strength
inaccurate
Chemical dosing
affected due to
chemical
deterioration/No
jar test done
None Unlikely
2
Major
4
Moderate
8
Chemical Under-
dosing
Equipment
Failure (e.g.
improper jar-test
or old balance
etc)
Calibration
by trained
technicians
and audited
by NWQL
Possible
2
Major
4
Moderate
8

System Description, Water Safety Plan, Improvement Schedule, (Matovo) – Sigatoka Regional Water Supply
Davendra Nath- Water Safety Plans Consultant (SOPAC/WHO) Fiji 2009 Page 75
RISK CAUSE
CONTROL
MEASURE IN
PLACE?
LIKELIHOOD CONSEQUENCE
Fluctuations in
turbidity None
Likely
3
Major
4
High
12
Fluctuations in
flow rate Flow meters
Possible
2
Moderate
3
Moderate
6
Improper mixing
(low
concentration)
Trained
Technicians
required
Rare
1
Moderate
3
Low
3
Chemical
Over-dosing
Equipment
Failure (e.g.
improper jar-test
or old balance
etc)
Calibration
by NWQL
Possible
2
Major
4
Moderate
8
Fluctuations in
turbidity None
Likely
3
Major
4
High
12
Fluctuations in
flow rate Flow meters
Possible
2
Moderate
3
Moderate
6
Improper mixing
(high
concentration)
Trained
Technicians
required.
Rare
1
Moderate
3
Low
3
Contamination
from operational
activities
Improper safety
mechanisms –
no railing,
slippery surface,
poor lighting,
poor ladder etc
None Possible
2
Moderate
3
Moderate
6
Clarifiers
Overload High turbidity
Increased
dose of
coagulant (jar
test)
Likely
3
Moderate
3
Moderate
9
Algae in water Algae in raw
water
Increase
dosing of
copper
sulphate
likely
3
Moderate
3
Moderate
9
Malfunctioning Damage to
scarper
No
preventative
maintenance
in place
Almost certain
5
Major
4
Very High
20
Filters
Filter overload
High turbidity None Likely
3
Moderate
3
Moderate
9
Clarifier failure
No
preventative
Maintenance
in Place
Almost certain
5
Major
4
Very high
20
Insufficient
Backwash
Trained
operators
likely
4
Major
4
High
16

System Description, Water Safety Plan, Improvement Schedule, (Matovo) – Sigatoka Regional Water Supply
Davendra Nath- Water Safety Plans Consultant (SOPAC/WHO) Fiji 2009 Page 76
Filter Medium
expired (sand)
Changing
filters prior to
expiry
Likely
4
Major
4
High
16
Protozoa presence
in treated water
No Protozoa
barrier
No upgrading
of Sand filters
Possible
3
Major
4
High
12
Disinfection
In-sufficient
Chlorination
Chlorinator
failure/manual
dosing
Preventative
Maintenance
Possible
3
Major
4
High
12
High
turbidity/high
chlorine demand
None-
upgrade filter
media
Possible
3
Major
4
High
12
Pumps
Pump failure
Electrical
Failure None
Possible
3
Major
4
High
12
Power board
exposed/no
standby pumps
Computer
Breakdown
None Possible
3
Major
4
High
12
Flow Meters Not functioning Estimation Possible
3
Major
4
High
12
Contact Well Storage
Sedimentation
Improper
filtration
,reduced filter
media
none Likely
4
Major
4
Very High
16
Accumulation of
Filter Media
Damaged filter
nozzle allows
filter media to
enter clear well
none Likely
4
Major
4
Very High
16
Easy entry of
rodents and birds
Open inlets
above clear
well/manual
chlorination
none
Possible
3
Major
4
High
12
Sabotage
/Accidents
Open Inlets/no
screens none
Possible
3
Moderate
3
Moderate
9
Entry by
Operators to
check water level
No mechanical
measuring
device
none
Possible
3
Major
4
High
12
Chemical Storage
Chemicals lose
strength
Improper
Storage None
Possible
3
Major
4
High
12

System Description, Water Safety Plan, Improvement Schedule, (Matovo) – Sigatoka Regional Water Supply
Davendra Nath- Water Safety Plans Consultant (SOPAC/WHO) Fiji 2009 Page 77
Unventilated
Chambers Distract workers none
Possible
3
Moderate
4
High
12
Post Treatment Storage - Matovo
RISK CAUSE
CONTROL
MEASURE
IN
PLACE?
LIKELIHOOD CONSEQUENCE PRIORITY
Accidental contamination
Rusted covers
and other
components
None Possible
3
Major
4
High
12
Cracks allow for
bacterial access None
Likely
4
Major
4
Very High
16
Sedimentation
at the bottom of
the tank
None Likely
4
Major
4
Very High
16
Security
Low security None Likely
4
Major
4
Very High
16
Easy access to
site None
likely
4
Major
4
Very High
16
Storage and Distribution network –Sigatoka (Matovo) Supply
RISK CAUSE
CONTROL
MEASURE
IN PLACE?
LIKELIHOOD CONSEQUENCE PRIORITY
Distribution Pipe
Breakages
Old pipes
Leak
detection and
replacement
Likely
4
Major
4
Very High
16
Earth Works None Possible
3
Major
4
High
12
Disasters None Possible
3
Major
4
High
12
Sedimentation and Scaling
in storage tanks and
Distribution pipes
Pipe breakages none Likely
4
Major
4
Very high
16
Inefficient
filtration none
Possible
3
Major
4
High
12
Rodents, Birds and
animals entering the
reservoir tanks
Rusted cover
and inlets none
Possible
3
Major
4
High
12
Remove tall
trees and
discarded
pipes / fitting
Casual
workers
Possible
3
Major
4
High
12
Cross Contamination of
treated water
Illegal
connections
Meter
reading
Possible
3
Moderate
3
Moderate
9
Low water pressure
High demand
and low
treatment plant
capacity
Increase
water intake
through
catchments
improvement.
Possible
3
Moderate
3
Moderate
9

System Description, Water Safety Plan, Improvement Schedule, (Matovo) – Sigatoka Regional Water Supply
Davendra Nath- Water Safety Plans Consultant (SOPAC/WHO) Fiji 2009 Page 78
ANNEX: 3

System Description, Water Safety Plan, Improvement Schedule, (Matovo) – Sigatoka Regional Water Supply
Davendra Nath- Water Safety Plans Consultant (SOPAC/WHO) Fiji 2009 Page 79

System Description, Water Safety Plan, Improvement Schedule, (Matovo) – Sigatoka Regional Water Supply
Davendra Nath- Water Safety Plans Consultant (SOPAC/WHO) Fiji 2009 Page 80
ANNEX:4
NADROGA WATER SUPPLY
MONTHLY REPORT SHEET
Station: Matovo WTP................................................Month: April 2009
Type of Treatment: Coagulation, pH correction, copper sulphate dosing, filtration, Flocculation,
Sedimentation
Attendant: V.Senileba , J.Qainiuci, Amar Singh, Eliki,Eveli, Waisale.
Total Flow: 245,528 cbu meter
Average daily flow: 8184 cub meter
CHLORINATION:
a)Chemical Used (Type) Alum Soda, Chlorine gas, Copper sulphate
b)Chemical Used (Amount) 5700 kg 700 kg 630 kg 50 kg
c)Dosing rate 31.7 ppm 19.7 ppm 6.7 ppm 0.60 ppm
d)Introduction to chemical to system: Through dosing pumps and chlorinator
REMARKS OF CHLORINE:
Chlorine is injected into the system for the final disinfection purposes.
FILTERATION:
a) Type : 8 Rapid sand filters
b) Filtration rate:
c) Wash Water rate:
REMARKS ON FILTERATION
All filters operating on manual mode
Backwashing done manually
GENERAL REMARKS:
Matovo is operating normally.
We also have some ups and downs during the month. Breakdown to some of the intake pumps.
Malfunction of high-lift pumps, dosing pumps and most of all the power failures.
OPERATOR SUPERVISOR

System Description, Water Safety Plan, Improvement Schedule, (Matovo) – Sigatoka Regional Water Supply
Davendra Nath- Water Safety Plans Consultant (SOPAC/WHO) Fiji 2009 Page 81
MONTHLY COSTS
CHEMICALS
Chlorine Gas (Cl2) 630 kg at $ 4.66 cent /kg = $ 2935.80
Chlorine powder (CaOCl2)
Aluminium Sulphate
(AL2SO4.18H2) 5700 kg at 0.71 “ = 4047.00
Soda Ash (Na2CO3) 700 kg at 0.90 “ 630.00
Miscellaneous (CuSo4) 50 kg at 4.97 “ = 248.50
HTH Powder (Cl) 40 kg at 3.93 “ = 157.20
FUEL:
Diesel nil
Lubricating Oil nil
FEA ELECTRICITY
Meter No.
83460564 162790 at 0.2214 cents/un $36.041.71
83460564 23946 at 0.2214 Cents/un 5,301.65
OTHER STORES:
1. Toilet Paper 50 at 0.22 cents /unit $11.00
LABOUR
Skilled 704 hours wages paid 4.20/hr $ 2956.80
Unskilled 704 hrs wages paid 3.71/hr 2611.84
Trade Assistant 176 hrs wages paid 4.46/hr 784.96
Shift allowance 1408 hrs wages paid 0.05/hr 70.40
TOTAL $55,796.86

System Description, Water Safety Plan, Improvement Schedule, (Matovo) – Sigatoka Regional Water Supply
Davendra Nath- Water Safety Plans Consultant (SOPAC/WHO) Fiji 2009 Page 82
ANNEX:4
NADROGA WATER SUPPLY
MONTHLY REPORT SHEET
Station: Matovo WTP................................................Month: April 2009
Type of Treatment: Coagulation, pH correction, copper sulphate dosing, filtration, Flocculation,
Sedimentation
Attendant: V.Senileba , J.Qainiuci, Amar Singh, Eliki,Eveli, Waisale.
Total Flow: 245,528 cub meter
Average daily flow: 8184 cub meter
CHLORINATION:
a)Chemical Used (Type) Alum Soda, Chlorine gas, Copper sulphate
b)Chemical Used (Amount) 5700 kg 700 kg 630 kg 50 kg
c)Dosing rate 31.7 ppm 19.7 ppm 6.7 ppm 0.60 ppm
d)Introduction to chemical to system: Through dosing pumps and chlorinator
REMARKS OF CHLORINE:
Chlorine is injected into the system for the final disinfection purposes.
FILTERATION:
d) Type : 8 Rapid sand filters
e) Filtration rate:
f) Wash Water rate:
REMARKS ON FILTERATION
All filters operating on manual mode
Backwashing done manually
GENERAL REMARKS:
Matovo is operating normally.
We also have some ups and downs during the month. Breakdown to some of the intake pumps.
Malfunction of high-lift pumps, dosing pumps and most of all the power failures.
OPERATOR SUPERVISOR

System Description, Water Safety Plan, Improvement Schedule, (Matovo) – Sigatoka Regional Water Supply
Davendra Nath- Water Safety Plans Consultant (SOPAC/WHO) Fiji 2009 Page 83
MONTHLY COSTS
CHEMICALS
Chlorine Gas (Cl2) 630 kg at $ 4.66 cent /kg = $ 2935.80
Chlorine powder (CaOCl2)
Aluminium Sulphate
(AL2SO4.18H2) 5700 kg at 0.71 “ = 4047.00
Soda Ash (Na2CO3) 700 kg at 0.90 “ 630.00
Miscellaneous (CuSo4) 50 kg at 4.97 “ = 248.50
HTH Powder (Cl) 40 kg at 3.93 “ = 157.20
FUEL:
Diesel nil
Lubricating Oil nil
FEA ELECTRICITY
Meter No.
83460564 162790 at 0.2214 cents/un $36.041.71
83460564 23946 at 0.2214 Cents/un 5,301.65
OTHER STORES:
2. Toilet Paper 50 at 0.22 cents /unit $11.00
LABOUR
Skilled 704 hours wages paid 4.20/hr $ 2956.80
Unskilled 704 hrs wages paid 3.71/hr 2611.84
Trade Assistant 176 hrs wages paid 4.46/hr 784.96
Shift allowance 1408 hrs wages paid 0.05/hr 70.40
TOTAL $55,796.86

System Description, Water Safety Plan, Improvement Schedule, (Matovo) – Sigatoka Regional Water Supply
Davendra Nath- Water Safety Plans Consultant (SOPAC/WHO) Fiji 2009 Page 84
ANNEX: 4
World Health Organisation (WHO) Drinking Water Quality Guidelines
Parameter WHO Guideline value
Faecal coli-form or E. coli Not detectable in a 100 ml sample
Aluminium 0.2 mg/L*
Arsenic 0.01 mg/L
Ammonia 1.5 mg/L*
Cadmium 0.003 mg/L
Arsenic 0.01 mg/L
Chloride 250 mg/L*
Colour 15 TCU*
Copper 2 mg/L
Fluoride 1.5 mg/L
Hydrogen Sulphide 0.05 mg/L*
Iron 0.3 mg/L*
Lead 0.01 mg/L
Manganese 0.1 mg/L*
Nitrate 10 mg/L
Sodium 200 mg/L*
Sulphate 250 mg/L*
Turbidity 5 NTU*
Total dissolved solids 1000 mg/L*
Zinc 3 mg/L
* May not be toxic but could result in consumer complaints
Source: WHO Guideline for Drinking Water Quality - 3rd
Edition